

#aeri
aeri
Просмотров: 47,346
349 обсуждают
Популярные
Новые

·
--


ENTRY HUNTER⁷⁸⁹
·
--
РостHI BINANCE SQUARE Fam !!
REPOST THE PINPOST !!!
JOIN OUR Chatgroup
THANKS All.
ALL IS WELL
Buy the Dip !
#USMidtermElections
$BNB
REPOST THE PINPOST !!!
JOIN OUR Chatgroup
THANKS All.
ALL IS WELL
Buy the Dip !
#USMidtermElections
$BNB

2
544
·
--
🚀 ALTCOINS ARE MAKING MOVES! WHO'S LEADING TODAY?
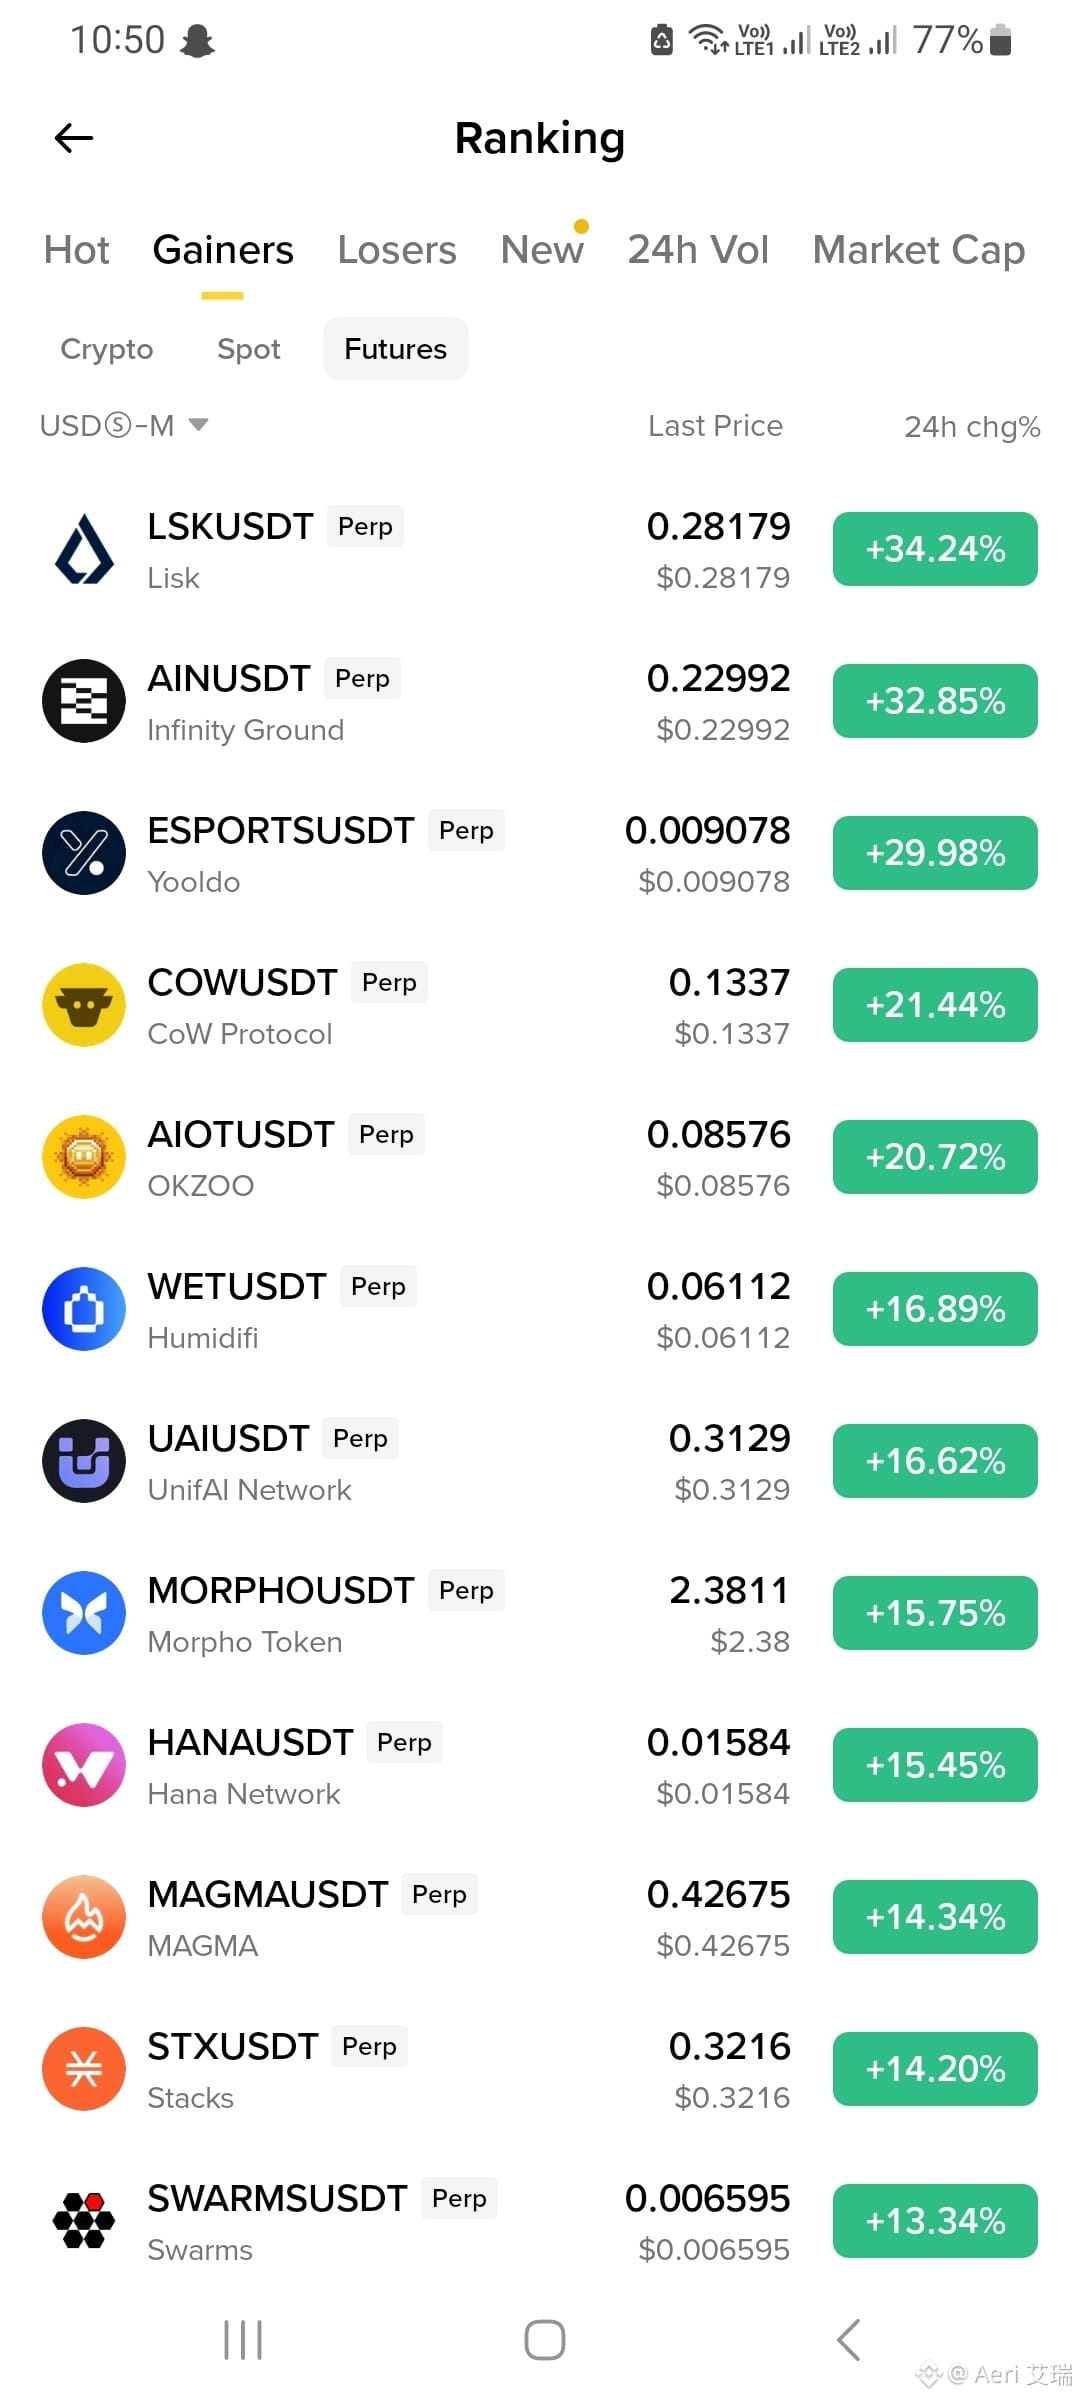
Some interesting price movements are showing up on Binance Futures. Here's a look at the top gainers over the last 24 hours. 📊
🔥 Top Performers:
🥇 LSKUSDT — +34.24%
🥈 AINUSDT — +32.85%
🥉 ESPORTSUSDT — +29.98%
🔸 COWUSDT — +21.44%
🔸 AIOTUSDT — +20.72%
🔸 WETUSDT — +16.89%
🔸 UAIUSDT — +16.62%
🔸 MORPHOUSDT — +15.75%
🔸 HANAUSDT — +15.45%
🔸 MAGMAUSDT — +14.34%
🔸 STXUSDT — +14.20%
🔸 SWARMSUSDT — +13.34%
📌 A quick market observation:
LSK, AIN, and ESPORTS are leading this list with gains above 29%. These are worth keeping on the watchlist for further research.
But remember: strong daily gains don't guarantee continued momentum. Check trading volume, market structure, and potential reversal levels before making decisions.
💬 Which of these gainers do you think deserves more attention?
#MooDCirCuiT
#Aeri
$COW
{future}(COWUSDT)
$WET
{future}(WETUSDT)
$LSK
{future}(LSKUSDT)
🚀 ALTCOINS ARE MAKING MOVES! WHO'S LEADING TODAY?
Some interesting price movements are showing up on Binance Futures. Here's a look at the top gainers over the last 24 hours. 📊
🔥 Top Performers:
🥇 LSKUSDT — +34.24%
🥈 AINUSDT — +32.85%
🥉 ESPORTSUSDT — +29.98%
🔸 COWUSDT — +21.44%
🔸 AIOTUSDT — +20.72%
🔸 WETUSDT — +16.89%
🔸 UAIUSDT — +16.62%
🔸 MORPHOUSDT — +15.75%
🔸 HANAUSDT — +15.45%
🔸 MAGMAUSDT — +14.34%
🔸 STXUSDT — +14.20%
🔸 SWARMSUSDT — +13.34%
📌 A quick market observation:
LSK, AIN, and ESPORTS are leading this list with gains above 29%. These are worth keeping on the watchlist for further research.
But remember: strong daily gains don't guarantee continued momentum. Check trading volume, market structure, and potential reversal levels before making decisions.
💬 Which of these gainers do you think deserves more attention?
#MooDCirCuiT
#Aeri
$COW
$WET
$LSK
Abu Fahadأ:
💛
1
1
8
967
·
--

Mithun Matubber 1688
·
--
Рост🐸🔥 PEPE × UNI — TWO CRYPTO GIANTS, TWO DIFFERENT STORIES! 🚀🦄
The crypto market never sleeps… and neither does the community! 👀
💚 $PEPE — Meme culture, viral energy, and a passionate community.
💜 $UNI — A key token in the Uniswap ecosystem, connecting traders to the world of decentralized finance (DeFi).
One brings the power of memes. The other represents decentralized trading. Could both capture the market's attention in the next crypto cycle? 👀📈
🎯 My watchlist: 🐸 $PEPE 🦄 $UNI
💬 YOUR TURN! If you could choose ONE for your watchlist today, which would it be?
🔥 Team PEPE 🐸 or Team UNI 🦄?
Drop your ticker below and tell us WHY! 👇
⚠️ Crypto is volatile. Do your own research; no coin guarantees profits.
#PEPE #UNI #Crypto #BinanceSquare #Altcoins

Abu Fahadأ:
💛
1
6
746
·
--
🚀 GREEN ACROSS THE BOARD? HERE ARE TODAY’S TOP GAINERS! 📈
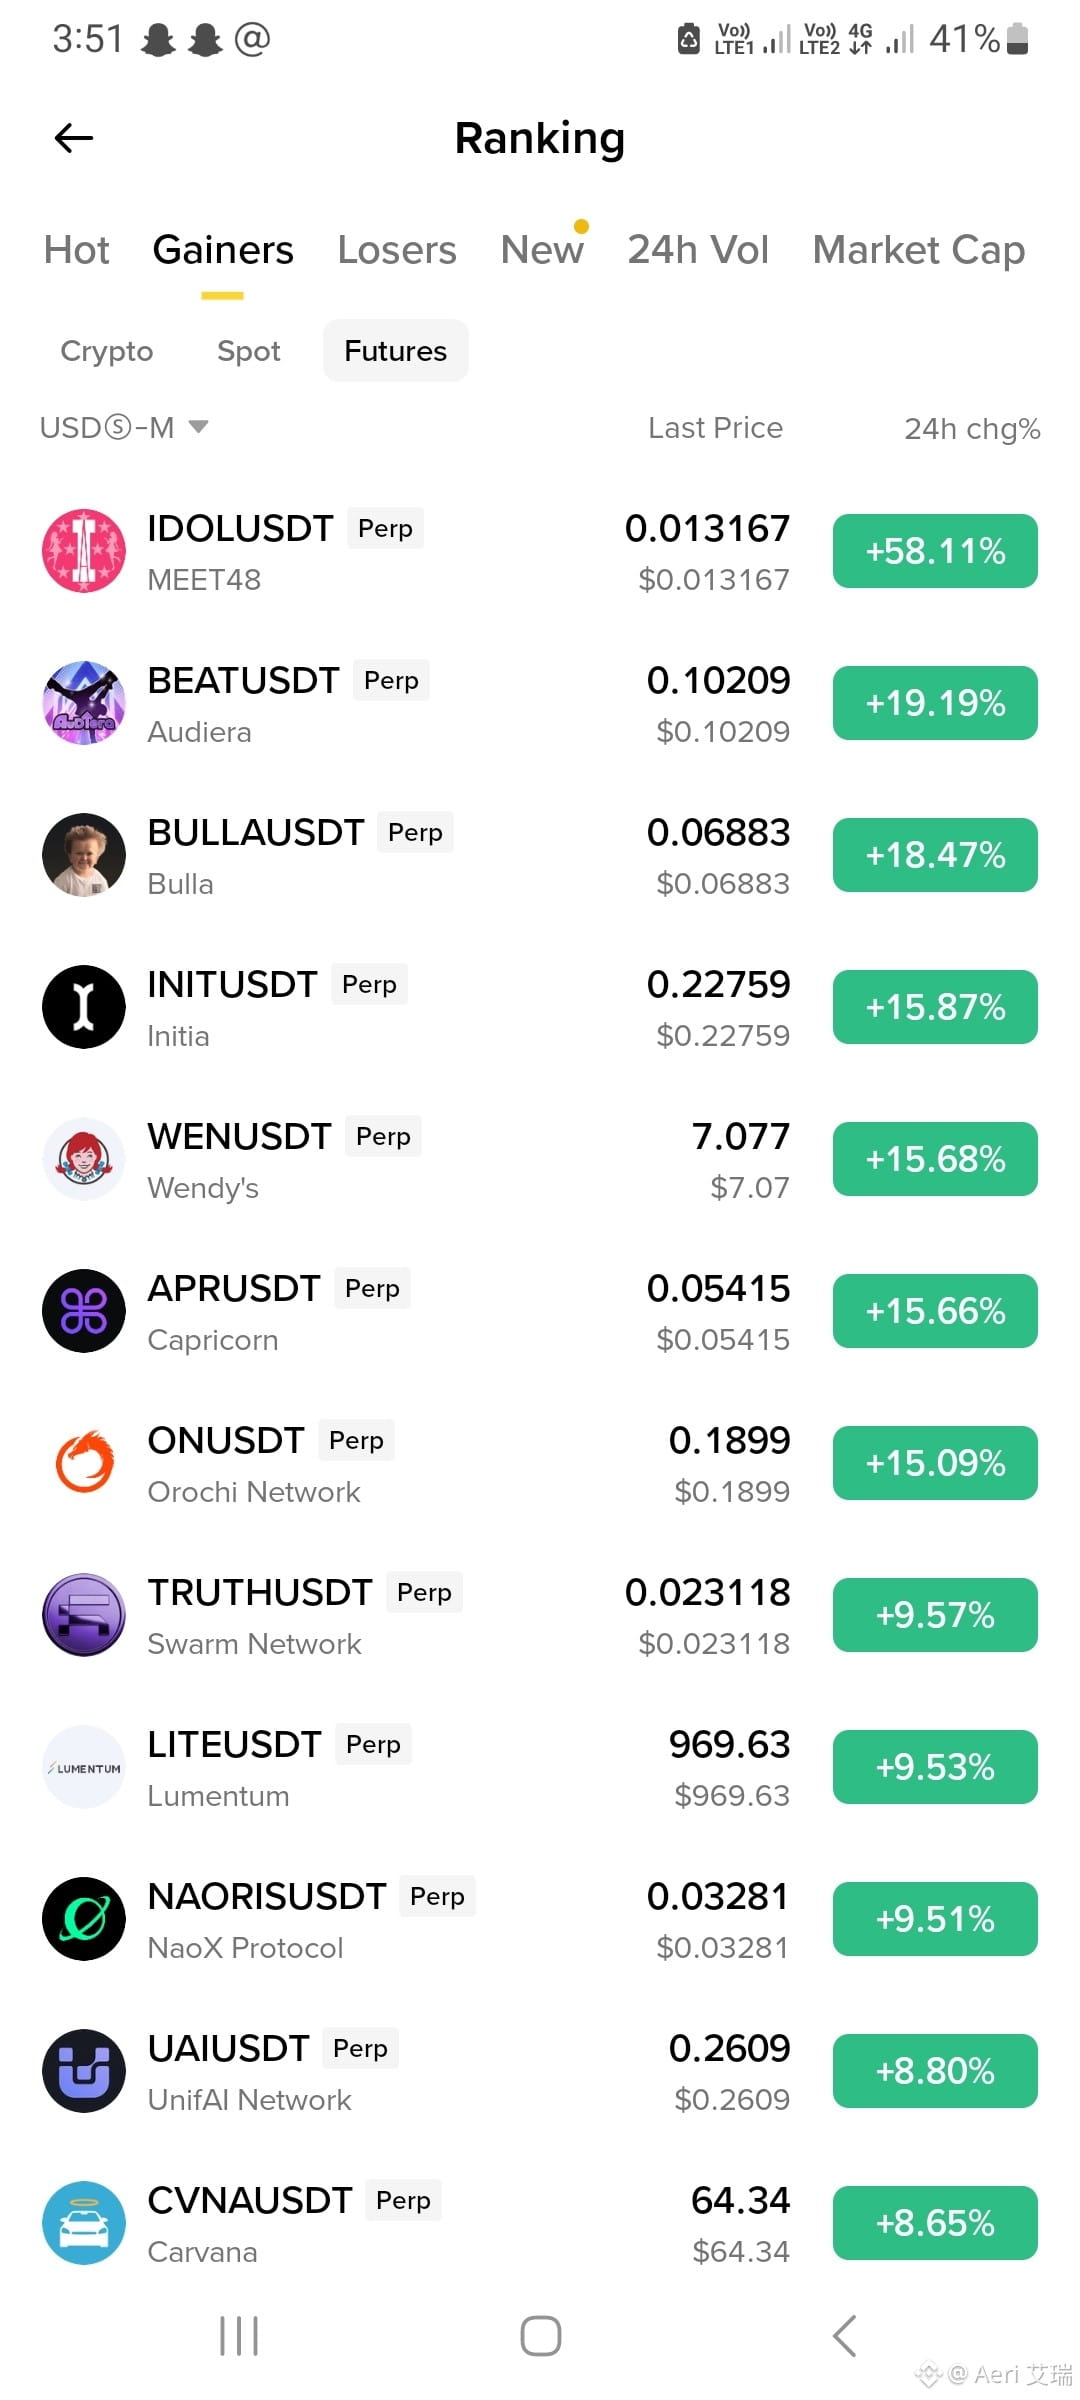
The Binance Futures Gainers list is showing some impressive 24-hour moves! 👀
🔥 Coins catching attention:
🥇 IDOLUSDT — +58.11%
🥈 BEATUSDT — +19.19%
🥉 BULLAUSDT — +18.47%
📈 INITUSDT — +15.87%
📈 WENUSDT — +15.68%
📈 APRUSDT — +15.66%
📈 ONUSDT — +15.09%
💡 What should traders watch?
✔️ Is the price move supported by trading volume?
✔️ Is momentum continuing or starting to fade?
✔️ Where are the potential entry and exit levels?
✔️ Is the risk worth taking?
⚠️ Remember: A top gainer isn't automatically a good entry. After a sharp pump, prices can reverse just as quickly. Do your research before opening a position.
🎯 Which coin would you investigate first? Drop your pick in the comments! 👇
$BEAT
{future}(BEATUSDT)
$APR
{future}(APRUSDT)
$BULLA
{future}(BULLAUSDT)
#MooDCirCuiT #Aeri
🚀 GREEN ACROSS THE BOARD? HERE ARE TODAY’S TOP GAINERS! 📈
The Binance Futures Gainers list is showing some impressive 24-hour moves! 👀
🔥 Coins catching attention:
🥇 IDOLUSDT — +58.11%
🥈 BEATUSDT — +19.19%
🥉 BULLAUSDT — +18.47%
📈 INITUSDT — +15.87%
📈 WENUSDT — +15.68%
📈 APRUSDT — +15.66%
📈 ONUSDT — +15.09%
💡 What should traders watch?
✔️ Is the price move supported by trading volume?
✔️ Is momentum continuing or starting to fade?
✔️ Where are the potential entry and exit levels?
✔️ Is the risk worth taking?
⚠️ Remember: A top gainer isn't automatically a good entry. After a sharp pump, prices can reverse just as quickly. Do your research before opening a position.
🎯 Which coin would you investigate first? Drop your pick in the comments! 👇
$BEAT
$APR
$BULLA
#MooDCirCuiT #Aeri
Abu Fahadأ:
💛
1
2
976
·
--
Цитируемый контент удален
3
809
·
--
Рост
👀 What’s getting attention in the crypto market today?
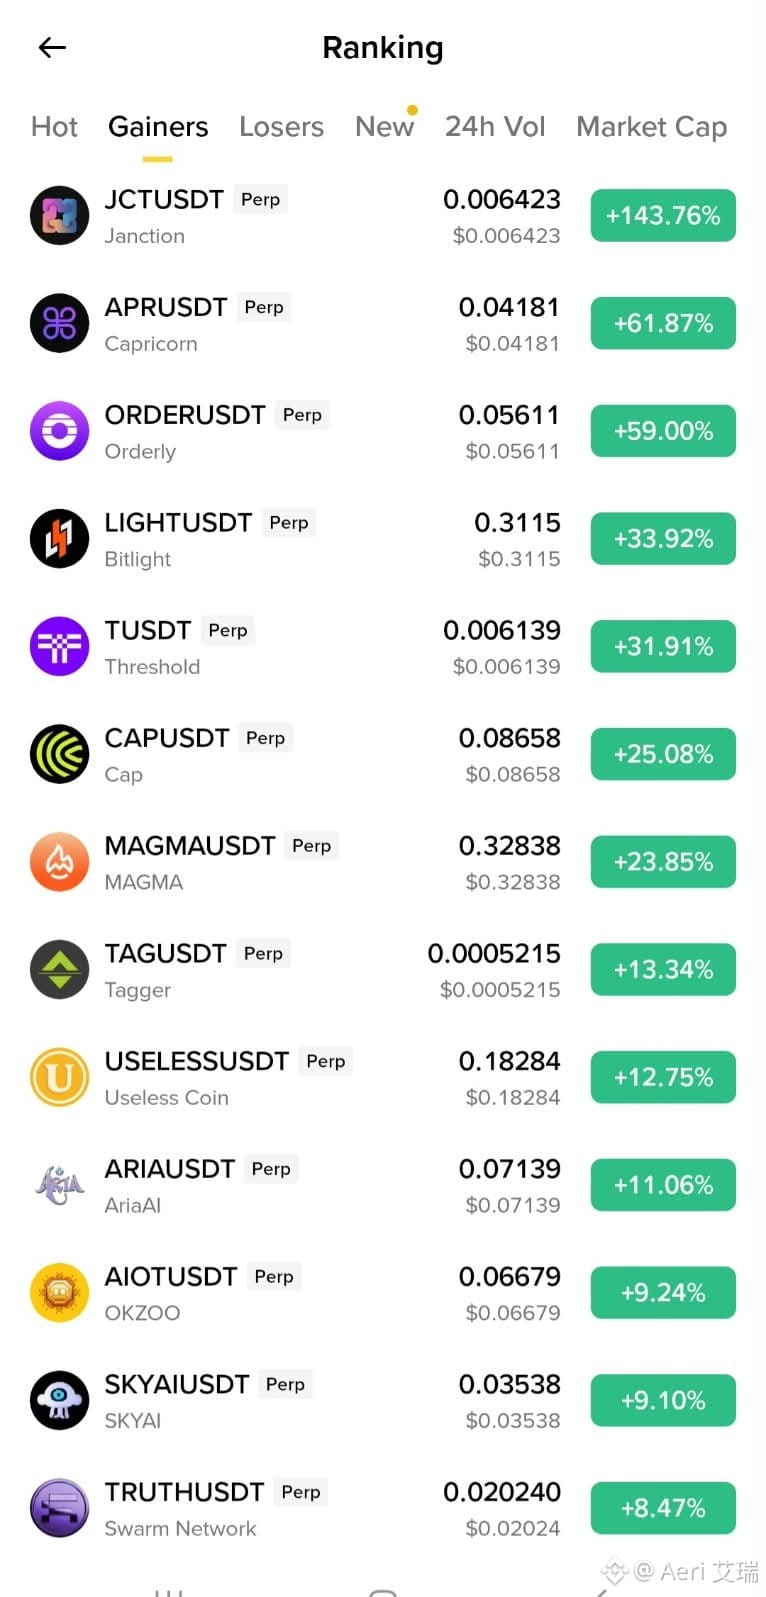
Binance’s trending list is a useful place to start when exploring which coins are attracting interest. 📊
I’m keeping these names on my radar today—not rushing into trades, just watching the movement and looking for potential opportunities.
Remember, attention can change quickly in crypto. Check the volume, price action, and your risk before making a move.
Watch the market. Do your research. Trade with a plan. 🎯
Which coin caught your eye today? 👇
$JCT
{future}(JCTUSDT)
$T
{future}(TUSDT)
$APR
{future}(APRUSDT)
#Binance
#Aeri
#MooDCirCuiT
👀 What’s getting attention in the crypto market today?
Binance’s trending list is a useful place to start when exploring which coins are attracting interest. 📊
I’m keeping these names on my radar today—not rushing into trades, just watching the movement and looking for potential opportunities.
Remember, attention can change quickly in crypto. Check the volume, price action, and your risk before making a move.
Watch the market. Do your research. Trade with a plan. 🎯
Which coin caught your eye today? 👇
$JCT
$T
$APR
#Binance
#Aeri
#MooDCirCuiT
1
5
1k
·
--
Рост
🏆 The competition is heating up! Making smarter picks and climbing toward rewards in Binance Pick Season 1. 💰 #BinancePick
$IN
{future}(INUSDT)
#Aeri
$BIRB
{future}(BIRBUSDT)
#MooDCirCuiT
$IRYS
{future}(IRYSUSDT)
🏆 The competition is heating up! Making smarter picks and climbing toward rewards in Binance Pick Season 1. 💰 #BinancePick
$IN
#Aeri
$BIRB
#MooDCirCuiT
$IRYS
$IN
#Aeri
$BIRB
#MooDCirCuiT
$IRYS

822
·
--
📊 Strategy meets predictions on Binance Pick! Earning scores, learning markets, and aiming higher every day. 🔥 #BinancePick
$MAGMA
{future}(MAGMAUSDT)
#Aeri
$BTR
{future}(BTRUSDT)
#MooDCirCuiT
$AGT
{future}(AGTUSDT)
📊 Strategy meets predictions on Binance Pick! Earning scores, learning markets, and aiming higher every day. 🔥 #BinancePick
$MAGMA
#Aeri
$BTR
#MooDCirCuiT
$AGT
$MAGMA
#Aeri
$BTR
#MooDCirCuiT
$AGT

1
1k
·
--
Рост
🏆 Binance Pick Season 1 is live!
Make smart predictions, earn scores, and compete for 1M USDC! 🚀 #BinancePick
#MooDCirCuiT
#Aeri
$APT
{future}(APTUSDT)
$DOOD
{future}(DOODUSDT)
$AKE
{future}(AKEUSDT)
🏆 Binance Pick Season 1 is live!
Make smart predictions, earn scores, and compete for 1M USDC! 🚀 #BinancePick
#MooDCirCuiT
#Aeri
$APT
$DOOD
$AKE
Make smart predictions, earn scores, and compete for 1M USDC! 🚀 #BinancePick
#MooDCirCuiT
#Aeri
$APT
$DOOD
$AKE

258
·
--
Цитируемый контент удален
1
388
·
--
$LYN SHORT
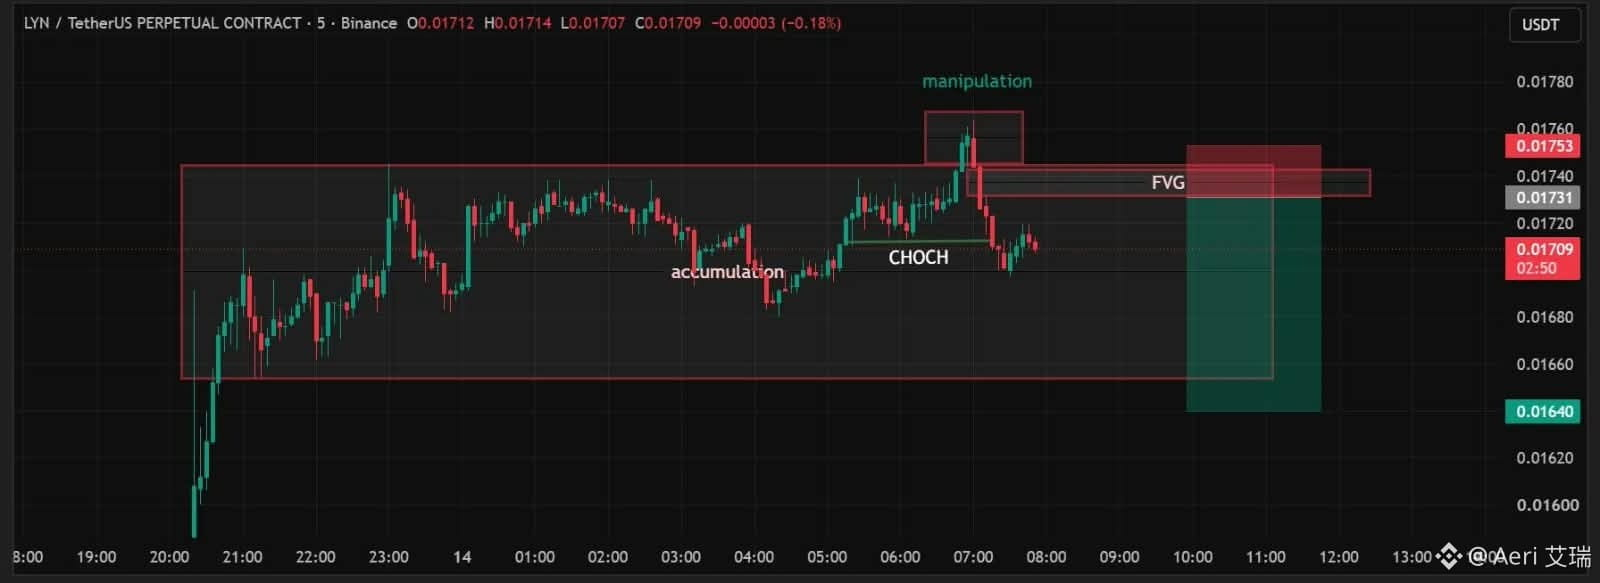
Price is locked in a clear 1H downtrend, and the recent 5m spike into the FVG at 0.01753 looks like a classic manipulation before continuation. With Binance cutting leverage tiers on Oct 16 forcing high-leverage longs to unwind, the path of least resistance is down.
Trading Ideas Short $LYN
Entry: 0.01710 - 0.01730 (current range / FVG retest)
SL: 0.01765 (above the manipulation high and FVG)
TP1: 0.01640 (range low / initial target)
TP2: 0.01580 (manipulation wick low)
TP3: 0.01500 (next psychological support)
Risk: A 1H close above 0.01765 invalidates the bearish structure and signals a potential trend reversal. The leverage adjustment on Oct 16 could also cause a violent short squeeze if too many traders are positioned short. Size accordingly.
What do you think?
Would you take this setup, or wait for confirmation?
$LYN
{future}(LYNUSDT)
#MooDCirCuiT
#Aeri
$LYN SHORT
Price is locked in a clear 1H downtrend, and the recent 5m spike into the FVG at 0.01753 looks like a classic manipulation before continuation. With Binance cutting leverage tiers on Oct 16 forcing high-leverage longs to unwind, the path of least resistance is down.
Trading Ideas Short $LYN
Entry: 0.01710 - 0.01730 (current range / FVG retest)
SL: 0.01765 (above the manipulation high and FVG)
TP1: 0.01640 (range low / initial target)
TP2: 0.01580 (manipulation wick low)
TP3: 0.01500 (next psychological support)
Risk: A 1H close above 0.01765 invalidates the bearish structure and signals a potential trend reversal. The leverage adjustment on Oct 16 could also cause a violent short squeeze if too many traders are positioned short. Size accordingly.
What do you think?
Would you take this setup, or wait for confirmation?
$LYN
#MooDCirCuiT
#Aeri
1
7
1k
·
--
$XRP Setup | LONG
XRP is trying to stabilize after a brutal five-day slide that took it from $1.41 down to $1.31. Price is now hovering around $1.36, sitting above the 100-day EMA at $1.339 which has been acting as a floor for the past two sessions. The monthly RSI is at its lowest level in 13 years, and the long-to-short ratio sits at 1.09, meaning positioning is starting to tilt slightly bullish.
Trade Plan
Direction: Long
Entry Zone: $1.345 – $1.365
Stop Loss: $1.315
TP1: $1.395
TP2: $1.445
TP3: $1.500
Why This Makes Sense
• XRPL payment volume jumped 153.9% in 24 hours to 363.3 million XRP, signaling fresh on-chain demand
• The 100-day EMA at $1.339 is holding as support, and buying interest emerged near the $1.34 moving average zone
• Monthly RSI at a 13-year low suggests the selling may be overextended; historically, such extreme readings have preceded sharp rebounds
• Long-to-short ratio at 1.09 shows a modest tilt toward longs, though not overwhelming conviction
Risk Note
This is a counter-trend bounce play, not a confirmed reversal. XRP remains below both the 200-day EMA at $1.381 and the 50-day EMA at $1.395, so the overhead resistance is real. If price fails to reclaim $1.38 on a daily close, I'll cut the trade without hesitation. Position size accordingly.
#MooDCirCuiT
#Aeri
$XRP
{future}(XRPUSDT)
$XRP Setup | LONG
XRP is trying to stabilize after a brutal five-day slide that took it from $1.41 down to $1.31. Price is now hovering around $1.36, sitting above the 100-day EMA at $1.339 which has been acting as a floor for the past two sessions. The monthly RSI is at its lowest level in 13 years, and the long-to-short ratio sits at 1.09, meaning positioning is starting to tilt slightly bullish.
Trade Plan
Direction: Long
Entry Zone: $1.345 – $1.365
Stop Loss: $1.315
TP1: $1.395
TP2: $1.445
TP3: $1.500
Why This Makes Sense
• XRPL payment volume jumped 153.9% in 24 hours to 363.3 million XRP, signaling fresh on-chain demand
• The 100-day EMA at $1.339 is holding as support, and buying interest emerged near the $1.34 moving average zone
• Monthly RSI at a 13-year low suggests the selling may be overextended; historically, such extreme readings have preceded sharp rebounds
• Long-to-short ratio at 1.09 shows a modest tilt toward longs, though not overwhelming conviction
Risk Note
This is a counter-trend bounce play, not a confirmed reversal. XRP remains below both the 200-day EMA at $1.381 and the 50-day EMA at $1.395, so the overhead resistance is real. If price fails to reclaim $1.38 on a daily close, I'll cut the trade without hesitation. Position size accordingly.
#MooDCirCuiT
#Aeri
$XRP
1
2
328
·
--
$APT Setup | LONG
Aptos just finished its four-year token unlock. Monthly emissions dropped around 60%. Price is holding near $0.83 after a strong four-week run, but on-chain stablecoin liquidity is down 17.5%. That divergence tells me to keep size small and wait for confirmation.
Trade Plan
Direction: Long
Entry Zone: 0.8280 – 0.8350
Stop Loss: 0.8150
TP1: 0.8650
TP2: 0.8950
TP3: 0.9400
Why This Makes Sense
• The unlock overhang is gone. Monthly APT emissions fell from ~11.3M to ~4.5M tokens, removing a persistent supply pressure that kept rallies capped.
• Price is defending the $0.82–$0.83 zone. This area acted as support after the recent dip, and the 24h low of $0.7880 held cleanly.
• Momentum is cooling but not broken. RSI on the 4H sits near 60 after peaking above 70, which is typical mid-trend behavior rather than exhaustion.
• The first real resistance sits around $0.94–$0.96. If buyers reclaim that band, the path toward $1.00 opens up.
I'm watching whether stablecoin liquidity stabilizes while price holds above $0.83. If it keeps bleeding, this rally looks supply-driven, not demand-driven. That's why I prefer confirmation over catching the exact bottom.
Risk Note
The main risk here is a liquidity drain. If stablecoins on Aptos keep falling, the ecosystem loses dry powder and the token can drift lower even without a fresh catalyst. Keep your position size modest. A close below $0.82 invalidates the setup, and I'd step aside rather than average down.
#Aeri
#MooDCirCuiT
$APT
{future}(APTUSDT)
$APT Setup | LONG
Aptos just finished its four-year token unlock. Monthly emissions dropped around 60%. Price is holding near $0.83 after a strong four-week run, but on-chain stablecoin liquidity is down 17.5%. That divergence tells me to keep size small and wait for confirmation.
Trade Plan
Direction: Long
Entry Zone: 0.8280 – 0.8350
Stop Loss: 0.8150
TP1: 0.8650
TP2: 0.8950
TP3: 0.9400
Why This Makes Sense
• The unlock overhang is gone. Monthly APT emissions fell from ~11.3M to ~4.5M tokens, removing a persistent supply pressure that kept rallies capped.
• Price is defending the $0.82–$0.83 zone. This area acted as support after the recent dip, and the 24h low of $0.7880 held cleanly.
• Momentum is cooling but not broken. RSI on the 4H sits near 60 after peaking above 70, which is typical mid-trend behavior rather than exhaustion.
• The first real resistance sits around $0.94–$0.96. If buyers reclaim that band, the path toward $1.00 opens up.
I'm watching whether stablecoin liquidity stabilizes while price holds above $0.83. If it keeps bleeding, this rally looks supply-driven, not demand-driven. That's why I prefer confirmation over catching the exact bottom.
Risk Note
The main risk here is a liquidity drain. If stablecoins on Aptos keep falling, the ecosystem loses dry powder and the token can drift lower even without a fresh catalyst. Keep your position size modest. A close below $0.82 invalidates the setup, and I'd step aside rather than average down.
#Aeri
#MooDCirCuiT
$APT
2
436
·
--
Рост
$JCT Setup | LONG
The 1H chart has shifted structure. We are seeing a classic rounded bottom with higher lows grinding up from 0.001704. The price is now consolidating right below the 0.00200 resistance. Momentum is clearly with the buyers on this timeframe.
Trade Plan
Direction: Long
Entry Zone: 0.001920 – 0.001945 (Retest of the yellow EMA)
Stop Loss: 0.001870 (Below the recent higher low and pink EMA)
TP1: 0.001986 (Immediate resistance)
TP2: 0.002050 (Breakout extension)
TP3: 0.002150 (Macro lower high)
Why This Makes Sense
• The chart shows a textbook sequence of higher lows. Buyers are stepping in earlier each time.
• The yellow EMA has crossed above the pink EMA and is acting as dynamic support. Price is holding above both.
• Volume is steady on the green candles, showing real accumulation, not a fakeout pump.
• The dip to 0.001704 was the liquidity flush. The slow grind up is the recovery phase.
Risk Note
The macro 4H trend is still technically down, so this is a counter-trend scalp. Do not marry this long. If price loses the pink EMA (around 0.001880), the bullish thesis is dead. Take profits at TP1 and move your stop to break-even.
#MooDCirCuiT
#Aeri
$JCT
{future}(JCTUSDT)
$JCT Setup | LONG
The 1H chart has shifted structure. We are seeing a classic rounded bottom with higher lows grinding up from 0.001704. The price is now consolidating right below the 0.00200 resistance. Momentum is clearly with the buyers on this timeframe.
Trade Plan
Direction: Long
Entry Zone: 0.001920 – 0.001945 (Retest of the yellow EMA)
Stop Loss: 0.001870 (Below the recent higher low and pink EMA)
TP1: 0.001986 (Immediate resistance)
TP2: 0.002050 (Breakout extension)
TP3: 0.002150 (Macro lower high)
Why This Makes Sense
• The chart shows a textbook sequence of higher lows. Buyers are stepping in earlier each time.
• The yellow EMA has crossed above the pink EMA and is acting as dynamic support. Price is holding above both.
• Volume is steady on the green candles, showing real accumulation, not a fakeout pump.
• The dip to 0.001704 was the liquidity flush. The slow grind up is the recovery phase.
Risk Note
The macro 4H trend is still technically down, so this is a counter-trend scalp. Do not marry this long. If price loses the pink EMA (around 0.001880), the bullish thesis is dead. Take profits at TP1 and move your stop to break-even.
#MooDCirCuiT
#Aeri
$JCT
2
462
·
--
Рост
$DUSK Setup | LONG
DUSK is pushing hard today, up over 15% and reclaiming the $0.097 area after a clean bounce from the $0.0880 floor. Price is holding above all key EMAs on the 1H chart, and the breakout from that tight consolidation looks real, not just a wick. Volume is confirming the move, and the structure has shifted from choppy to clearly bullish.
Trade Plan
Direction: Long
Entry Zone: $0.0965 – $0.0980
Stop Loss: $0.0880
TP1: $0.1025
TP2: $0.1080
TP3: $0.1150
Why This Makes Sense
• Price broke above the $0.095–$0.098 neckline resistance that has capped every rally since early October, flipping it into support.
• The 1H EMA structure is stacked bullishly — price is holding above the 7, 25, and 99 EMAs, with the 25 EMA rising sharply.
• Buyers are clearly in control, with recent activity showing nearly 99% buy pressure and a strong social sentiment reading of +8.23%.
• Fundamental catalysts are lining up: Dusk Domains mainnet launches October 18, routing protocol revenue directly into DUSK liquidity, and the team just shipped 10 core cryptography upgrades
#Aeri
#MooDCirCuiT
$DUSK
{future}(DUSKUSDT)
$DUSK Setup | LONG
DUSK is pushing hard today, up over 15% and reclaiming the $0.097 area after a clean bounce from the $0.0880 floor. Price is holding above all key EMAs on the 1H chart, and the breakout from that tight consolidation looks real, not just a wick. Volume is confirming the move, and the structure has shifted from choppy to clearly bullish.
Trade Plan
Direction: Long
Entry Zone: $0.0965 – $0.0980
Stop Loss: $0.0880
TP1: $0.1025
TP2: $0.1080
TP3: $0.1150
Why This Makes Sense
• Price broke above the $0.095–$0.098 neckline resistance that has capped every rally since early October, flipping it into support.
• The 1H EMA structure is stacked bullishly — price is holding above the 7, 25, and 99 EMAs, with the 25 EMA rising sharply.
• Buyers are clearly in control, with recent activity showing nearly 99% buy pressure and a strong social sentiment reading of +8.23%.
• Fundamental catalysts are lining up: Dusk Domains mainnet launches October 18, routing protocol revenue directly into DUSK liquidity, and the team just shipped 10 core cryptography upgrades
#Aeri
#MooDCirCuiT
$DUSK
2
347
·
--
Рост
$BAT Setup | LONG
Trade Plan
Direction: Long
Entry Zone: $0.1880 – $0.1920
Stop Loss: $0.1790
TP1: $0.2030
TP2: $0.2150
TP3: $0.2280
Why This Makes Sense
* MA5 has crossed above MA20, and MACD is still printing positive bars — the short-term trend is up.
* The funding rate is deeply negative, which means short positions are crowded and paying to hold. Any push higher forces them to cover.
* RSI is around 65, close to overbought but not there yet. There's still room before momentum exhaustion.
* The $0.1880–$0.1920 zone sits near MA5 and the middle Bollinger band, which has acted as a launchpad on previous pullbacks.
Risk Note
This is a short-squeeze-driven rally, not a slow, spot-led uptrend. If funding flips positive and price stalls, the buying pressure can vanish fast. Keep position size small — volatility over the last 30 candles is above 28%, so wicks can hit stops easily. A close below MA20 invalidates the setup; don't average down.
#MooDCirCuiT
#Aeri
$BAT
{future}(BATUSDT)
$BAT Setup | LONG
Trade Plan
Direction: Long
Entry Zone: $0.1880 – $0.1920
Stop Loss: $0.1790
TP1: $0.2030
TP2: $0.2150
TP3: $0.2280
Why This Makes Sense
* MA5 has crossed above MA20, and MACD is still printing positive bars — the short-term trend is up.
* The funding rate is deeply negative, which means short positions are crowded and paying to hold. Any push higher forces them to cover.
* RSI is around 65, close to overbought but not there yet. There's still room before momentum exhaustion.
* The $0.1880–$0.1920 zone sits near MA5 and the middle Bollinger band, which has acted as a launchpad on previous pullbacks.
Risk Note
This is a short-squeeze-driven rally, not a slow, spot-led uptrend. If funding flips positive and price stalls, the buying pressure can vanish fast. Keep position size small — volatility over the last 30 candles is above 28%, so wicks can hit stops easily. A close below MA20 invalidates the setup; don't average down.
#MooDCirCuiT
#Aeri
$BAT
1
398
·
--
Okay!! I’m watching September CPI closely and it’s mostly because of oil.
Crude has been jumpy with the Middle East situation and US energy costs are creeping up again. My read is that oil can still go higher but it really depends on whether there are actual supply problems or whether demand is strong enough to hold prices up. Those are different stories.
The part I care about is the Fed. If energy pushes CPI above what people expect the market may start asking whether another hike is back on the table this year. That would likely push Treasury yields up and hit existing bond prices. A soft print or calmer headlines could easily reverse that.
So here’s what I’m watching:
Where Brent goes, and whether the supply news is real
Actual September CPI vs. consensus
How yields and Fed pricing move in the hours after the release
I’m not chasing oil here and I’m not going big on bonds before the data. I’d rather wait for the print see how the market reacts and look for confirmation. Protecting capital matters more to me than calling every move.
The question I’m really asking is whether this CPI surprises enough to change the Fed outlook not just whether it comes in hot.
What’s your take? Do you think oil pushes inflation higher and do yields follow?
#CPIWatch
#MooDCirCuiT #Aeri
1
4
1.5k
·
--
Рост

S U L E M A N 特币
·
--
🔥 SOLANA GIVEAWAY IS HERE! 🚀 Celebrating our journey toward 5,000 members with an exciting SOL giveaway! 💜
🎁 Join the community, stay active, and don’t miss the fun. Let’s grow together with $SOL ! 💎
$RSR
$GTC
🎁 Join the community, stay active, and don’t miss the fun. Let’s grow together with $SOL ! 💎
$RSR
$GTC

1.1k
·
--
You don’t need to win every trade.
You need to survive the bad ones, learn from them, and keep showing up.
The market will test your patience before it rewards your discipline.
Don’t chase the pump.
Don’t panic in the dump.
Build the mindset that survives both. 🧠📈
One day, the discipline you thought was slowing you down will be the reason you’re still standing.
$XRP
{future}(XRPUSDT)
$GTC
{future}(GTCUSDT)
$AKE
{future}(AKEUSDT)
#MooDCirCuiT
#Aeri
You don’t need to win every trade.
You need to survive the bad ones, learn from them, and keep showing up.
The market will test your patience before it rewards your discipline.
Don’t chase the pump.
Don’t panic in the dump.
Build the mindset that survives both. 🧠📈
One day, the discipline you thought was slowing you down will be the reason you’re still standing.
$XRP
$GTC
$AKE
#MooDCirCuiT
#Aeri

1.4k
20
92
1.4k
·
--
I earned 0.10 USDC in profits from Write to Earn last week
#Write2Earn
#MooDCirCuiT
#艾瑞
#Aeri
$BROCCOLIF3B
{future}(BROCCOLIF3BUSDT)
$RIF
{future}(RIFUSDT)
$NFP
{future}(NFPUSDT)
I earned 0.10 USDC in profits from Write to Earn last week
#Write2Earn
#MooDCirCuiT
#艾瑞
#Aeri
$BROCCOLIF3B
$RIF
$NFP
#Write2Earn
#MooDCirCuiT
#艾瑞
#Aeri
$BROCCOLIF3B
$RIF
$NFP

4
8
312
Войдите, чтобы посмотреть больше материала
Присоединяйтесь к пользователям криптовалют по всему миру на Binance Square
⚡️ Получайте новейшую и полезную информацию о криптоактивах.
💬 Нам доверяет крупнейшая в мире криптобиржа.
👍 Получите достоверные аналитические данные от верифицированных создателей контента.
Эл. почта/номер телефона
В тренде
1
#BinanceProcesses$4.65BWithdrawals
Просмотров: 1,753
47 обсуждают
2
#WithdrawalsBack: 15 networks live
Просмотров: 3,913
98 обсуждают
3
#BinanceUpdatesProofofReservesAddresses
Просмотров: 78,831
1,240 обсуждают
4
#BinanceToResumePhaseOneOfWithdrawals
Просмотров: 118,304
1,399 обсуждают
5
#BinanceHadAlreadyCovered$6BofHackLoss
Просмотров: 8,133
123 обсуждают
6
#FBIConfirmsNorthKoreaIsResponsibleForBinanceCryptoHack
Просмотров: 42,310
138 обсуждают
7
#CZDismissesClaimsBinanceHackWasPredicted
Просмотров: 58,202
631 обсуждают
8
#B14gReportsUnauthorizedTransferOfAbout97MCORE
Просмотров: 16,835
305 обсуждают
9
#USSpotETHETFsPost23StraightDaysOfNetOutflows
Просмотров: 21,256
279 обсуждают
10
#IntelHasItsWorstDaySince1974
Просмотров: 108,824
885 обсуждают