
#tradingeducation
tradingeducation
Просмотров: 149,657
1,086 обсуждают
Популярные
Новые

Orders and execution · Lesson 5
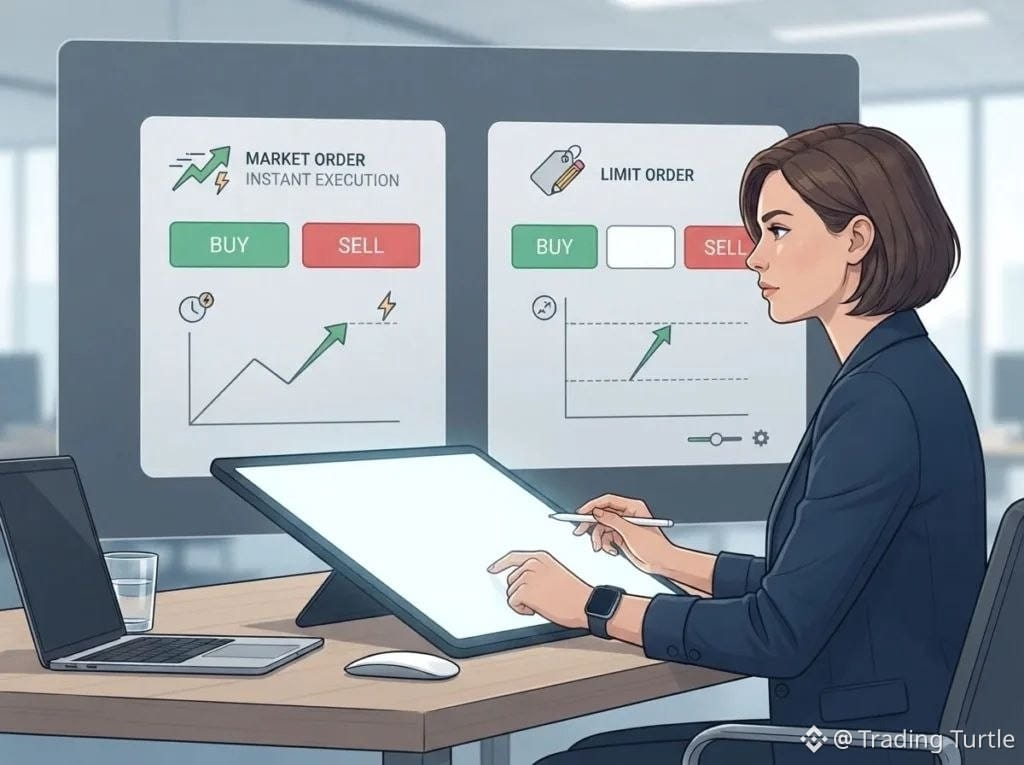
Market orders
Getting an immediate fill and getting the price you expected are different things.
A market order prioritizes execution over exact price. It normally fills against available liquidity in the order book, which means the final average fill can differ from the last displayed price when the market moves quickly or depth is thin. This difference is slippage. Market orders can be useful when execution matters more than price precision, but they should not be treated as price guarantees.
Imagine available sell orders near the displayed price are thin. A market buy can fill across several prices, so the average differs from the screen price you first saw.
Explain the difference between the displayed price and the average execution price, using a historical or simulated order book.
Next in this series: Limit orders.
#TradingEducation #PriceAction #RiskManagement #TradingTurtle
Orders and execution · Lesson 5
Market orders
Getting an immediate fill and getting the price you expected are different things.
A market order prioritizes execution over exact price. It normally fills against available liquidity in the order book, which means the final average fill can differ from the last displayed price when the market moves quickly or depth is thin. This difference is slippage. Market orders can be useful when execution matters more than price precision, but they should not be treated as price guarantees.
Imagine available sell orders near the displayed price are thin. A market buy can fill across several prices, so the average differs from the screen price you first saw.
Explain the difference between the displayed price and the average execution price, using a historical or simulated order book.
Next in this series: Limit orders.
#TradingEducation #PriceAction #RiskManagement #TradingTurtle
Market orders
Getting an immediate fill and getting the price you expected are different things.
A market order prioritizes execution over exact price. It normally fills against available liquidity in the order book, which means the final average fill can differ from the last displayed price when the market moves quickly or depth is thin. This difference is slippage. Market orders can be useful when execution matters more than price precision, but they should not be treated as price guarantees.
Imagine available sell orders near the displayed price are thin. A market buy can fill across several prices, so the average differs from the screen price you first saw.
Explain the difference between the displayed price and the average execution price, using a historical or simulated order book.
Next in this series: Limit orders.
#TradingEducation #PriceAction #RiskManagement #TradingTurtle
15

·
--
🚨 TRADING REALITY
Most beginners don't lose because they can't find a good coin.
They lose because they: ❌ Enter without a plan
❌ Chase pumps
❌ Move their Stop Loss
❌ Take profits too early
❌ Trade emotionally
A good strategy means nothing without discipline.
Save this if you're learning to trade. 📌
#TradingEducation $BTC
{future}(BTCUSDT)
$ETH
{future}(ETHUSDT)
$BNB
{future}(BNBUSDT)
🚨 TRADING REALITY
Most beginners don't lose because they can't find a good coin.
They lose because they: ❌ Enter without a plan
❌ Chase pumps
❌ Move their Stop Loss
❌ Take profits too early
❌ Trade emotionally
A good strategy means nothing without discipline.
Save this if you're learning to trade. 📌
#TradingEducation $BTC
$ETH
$BNB
Most beginners don't lose because they can't find a good coin.
They lose because they: ❌ Enter without a plan
❌ Chase pumps
❌ Move their Stop Loss
❌ Take profits too early
❌ Trade emotionally
A good strategy means nothing without discipline.
Save this if you're learning to trade. 📌
#TradingEducation $BTC
$ETH
$BNB
67

Why do traders spend more energy predicting the top than riding the move that's already proven itself?
Here's the gap: reversals are rare, trends are common. Every time a trader hunts for the exact turning point, they're betting against the higher-probability outcome — continuation. The dominant trend already has momentum, volume, and structure behind it. Fading it means fighting all three at once, hoping to be early instead of being right.
Watch how often price makes higher highs and higher lows (or the reverse) before you start guessing a reversal. Practice identifying trend structure before you look for exhaustion signals.
What's your process for confirming a trend before you trade with it?
$ADA $DOGE $AVAX #Trading #TradingEducation #Crypto #TA
Follow for daily trading education · Education only, not financial advice.
Why do traders spend more energy predicting the top than riding the move that's already proven itself?
Here's the gap: reversals are rare, trends are common. Every time a trader hunts for the exact turning point, they're betting against the higher-probability outcome — continuation. The dominant trend already has momentum, volume, and structure behind it. Fading it means fighting all three at once, hoping to be early instead of being right.
Watch how often price makes higher highs and higher lows (or the reverse) before you start guessing a reversal. Practice identifying trend structure before you look for exhaustion signals.
What's your process for confirming a trend before you trade with it?
$ADA $DOGE $AVAX #Trading #TradingEducation #Crypto #TA
Follow for daily trading education · Education only, not financial advice.
Here's the gap: reversals are rare, trends are common. Every time a trader hunts for the exact turning point, they're betting against the higher-probability outcome — continuation. The dominant trend already has momentum, volume, and structure behind it. Fading it means fighting all three at once, hoping to be early instead of being right.
Watch how often price makes higher highs and higher lows (or the reverse) before you start guessing a reversal. Practice identifying trend structure before you look for exhaustion signals.
What's your process for confirming a trend before you trade with it?
$ADA $DOGE $AVAX #Trading #TradingEducation #Crypto #TA
Follow for daily trading education · Education only, not financial advice.

1
142

·
--
📊 What Is Risk-to-Reward Ratio in Trading?
The risk-to-reward ratio compares the amount you could lose on a trade with the amount you hope to gain.
For example:
🔹 Risk: $10
🔹 Potential reward: $20
🔹 Risk-to-reward ratio: 1:2
Traders often use this ratio when planning entry, stop-loss, and take-profit levels. However, a favorable ratio does not guarantee that a trade will succeed.
Always manage risk carefully, avoid overtrading, and do your own research before making decisions.
#tradingeducation #RiskManagementInTrading #CryptoTrading. #tradingbasics #BİNANCESQUARE
📊 What Is Risk-to-Reward Ratio in Trading?
The risk-to-reward ratio compares the amount you could lose on a trade with the amount you hope to gain.
For example:
🔹 Risk: $10
🔹 Potential reward: $20
🔹 Risk-to-reward ratio: 1:2
Traders often use this ratio when planning entry, stop-loss, and take-profit levels. However, a favorable ratio does not guarantee that a trade will succeed.
Always manage risk carefully, avoid overtrading, and do your own research before making decisions.
#tradingeducation #RiskManagementInTrading #CryptoTrading. #tradingbasics #BİNANCESQUARE
The risk-to-reward ratio compares the amount you could lose on a trade with the amount you hope to gain.
For example:
🔹 Risk: $10
🔹 Potential reward: $20
🔹 Risk-to-reward ratio: 1:2
Traders often use this ratio when planning entry, stop-loss, and take-profit levels. However, a favorable ratio does not guarantee that a trade will succeed.
Always manage risk carefully, avoid overtrading, and do your own research before making decisions.
#tradingeducation #RiskManagementInTrading #CryptoTrading. #tradingbasics #BİNANCESQUARE
60

·
--
NVDAB/USDT — Candlestick Analysis & Trade Setup
Coin: NVDAB
Trading pair: NVDAB/USDT
Timeframe: 1-hour chart
Candlestick observation
The candlestick chart helps us identify buying and selling pressure. I’m watching how NVDAB reacts around its support and resistance levels before considering a trade.
Example trade setup educational only
- Current price: [Insert the live NVDAB price]
- Entry: [Insert a possible entry price after your analysis]
- Stop-loss: [Insert a level below your support]
- Take-profit: [Insert your target near resistance]
- Risk-to-reward: [Calculate your ratio]
My view: I would wait for confirmation before entering rather than buying simply because the price is moving. A breakout that fails can quickly turn into a loss.
⚠️ This is not financial advice. Crypto is highly volatile, and this is an example of how to analyse a trade not a guaranteed prediction.
$NVDAB
#NVDAX #cryptouniverseofficial #candlestick_patterns #TradingEducation
NVDAB/USDT — Candlestick Analysis & Trade Setup
Coin: NVDAB
Trading pair: NVDAB/USDT
Timeframe: 1-hour chart
Candlestick observation
The candlestick chart helps us identify buying and selling pressure. I’m watching how NVDAB reacts around its support and resistance levels before considering a trade.
Example trade setup educational only
- Current price: [Insert the live NVDAB price]
- Entry: [Insert a possible entry price after your analysis]
- Stop-loss: [Insert a level below your support]
- Take-profit: [Insert your target near resistance]
- Risk-to-reward: [Calculate your ratio]
My view: I would wait for confirmation before entering rather than buying simply because the price is moving. A breakout that fails can quickly turn into a loss.
⚠️ This is not financial advice. Crypto is highly volatile, and this is an example of how to analyse a trade not a guaranteed prediction.
$NVDAB
#NVDAX #cryptouniverseofficial #candlestick_patterns #TradingEducation
Coin: NVDAB
Trading pair: NVDAB/USDT
Timeframe: 1-hour chart
Candlestick observation
The candlestick chart helps us identify buying and selling pressure. I’m watching how NVDAB reacts around its support and resistance levels before considering a trade.
Example trade setup educational only
- Current price: [Insert the live NVDAB price]
- Entry: [Insert a possible entry price after your analysis]
- Stop-loss: [Insert a level below your support]
- Take-profit: [Insert your target near resistance]
- Risk-to-reward: [Calculate your ratio]
My view: I would wait for confirmation before entering rather than buying simply because the price is moving. A breakout that fails can quickly turn into a loss.
⚠️ This is not financial advice. Crypto is highly volatile, and this is an example of how to analyse a trade not a guaranteed prediction.
$NVDAB
#NVDAX #cryptouniverseofficial #candlestick_patterns #TradingEducation
74
·
--
📚 TRADING LESSON: ENTRY → TP → SL
🟢 ENTRY = The price where you enter a trade.
Example: BTC at $80,000 → you buy.
🎯 TAKE PROFIT (TP) = The price where you plan to take your profit.
Example: TP at $83,000 → you sell in profit.
🛑 STOP LOSS (SL) = The price where you exit to limit your loss.
Example: SL at $78,000 → you exit if price falls.
Easy to remember:
ENTRY = Get in
TP = Take profit
SL = Limit loss
📌 Always have a plan before entering a trade.
#TradingEducation $BTC
{future}(BTCUSDT)
$BNB
{future}(BNBUSDT)
$ETH
{future}(ETHUSDT)
📚 TRADING LESSON: ENTRY → TP → SL
🟢 ENTRY = The price where you enter a trade.
Example: BTC at $80,000 → you buy.
🎯 TAKE PROFIT (TP) = The price where you plan to take your profit.
Example: TP at $83,000 → you sell in profit.
🛑 STOP LOSS (SL) = The price where you exit to limit your loss.
Example: SL at $78,000 → you exit if price falls.
Easy to remember:
ENTRY = Get in
TP = Take profit
SL = Limit loss
📌 Always have a plan before entering a trade.
#TradingEducation $BTC
$BNB
$ETH
🟢 ENTRY = The price where you enter a trade.
Example: BTC at $80,000 → you buy.
🎯 TAKE PROFIT (TP) = The price where you plan to take your profit.
Example: TP at $83,000 → you sell in profit.
🛑 STOP LOSS (SL) = The price where you exit to limit your loss.
Example: SL at $78,000 → you exit if price falls.
Easy to remember:
ENTRY = Get in
TP = Take profit
SL = Limit loss
📌 Always have a plan before entering a trade.
#TradingEducation $BTC
$BNB
$ETH
75
·
--
📚 TRADING LESSON: LONG vs SHORT
🟢 LONG = You expect the price to go UP 📈
Example: Buy BTC at $80K → sell at $83K = profit.
🔴 SHORT = You expect the price to go DOWN 📉
Example: Short BTC at $80K → close at $77K = profit.
Easy to remember:
LONG = UP 📈
SHORT = DOWN 📉
Which one did you learn first? 👇
#TradingEducation $BTC
{future}(BTCUSDT)
$BNB
{future}(BNBUSDT)
$ETH
{future}(ETHUSDT)
📚 TRADING LESSON: LONG vs SHORT
🟢 LONG = You expect the price to go UP 📈
Example: Buy BTC at $80K → sell at $83K = profit.
🔴 SHORT = You expect the price to go DOWN 📉
Example: Short BTC at $80K → close at $77K = profit.
Easy to remember:
LONG = UP 📈
SHORT = DOWN 📉
Which one did you learn first? 👇
#TradingEducation $BTC
$BNB
$ETH
🟢 LONG = You expect the price to go UP 📈
Example: Buy BTC at $80K → sell at $83K = profit.
🔴 SHORT = You expect the price to go DOWN 📉
Example: Short BTC at $80K → close at $77K = profit.
Easy to remember:
LONG = UP 📈
SHORT = DOWN 📉
Which one did you learn first? 👇
#TradingEducation $BTC
$BNB
$ETH
73
·
--
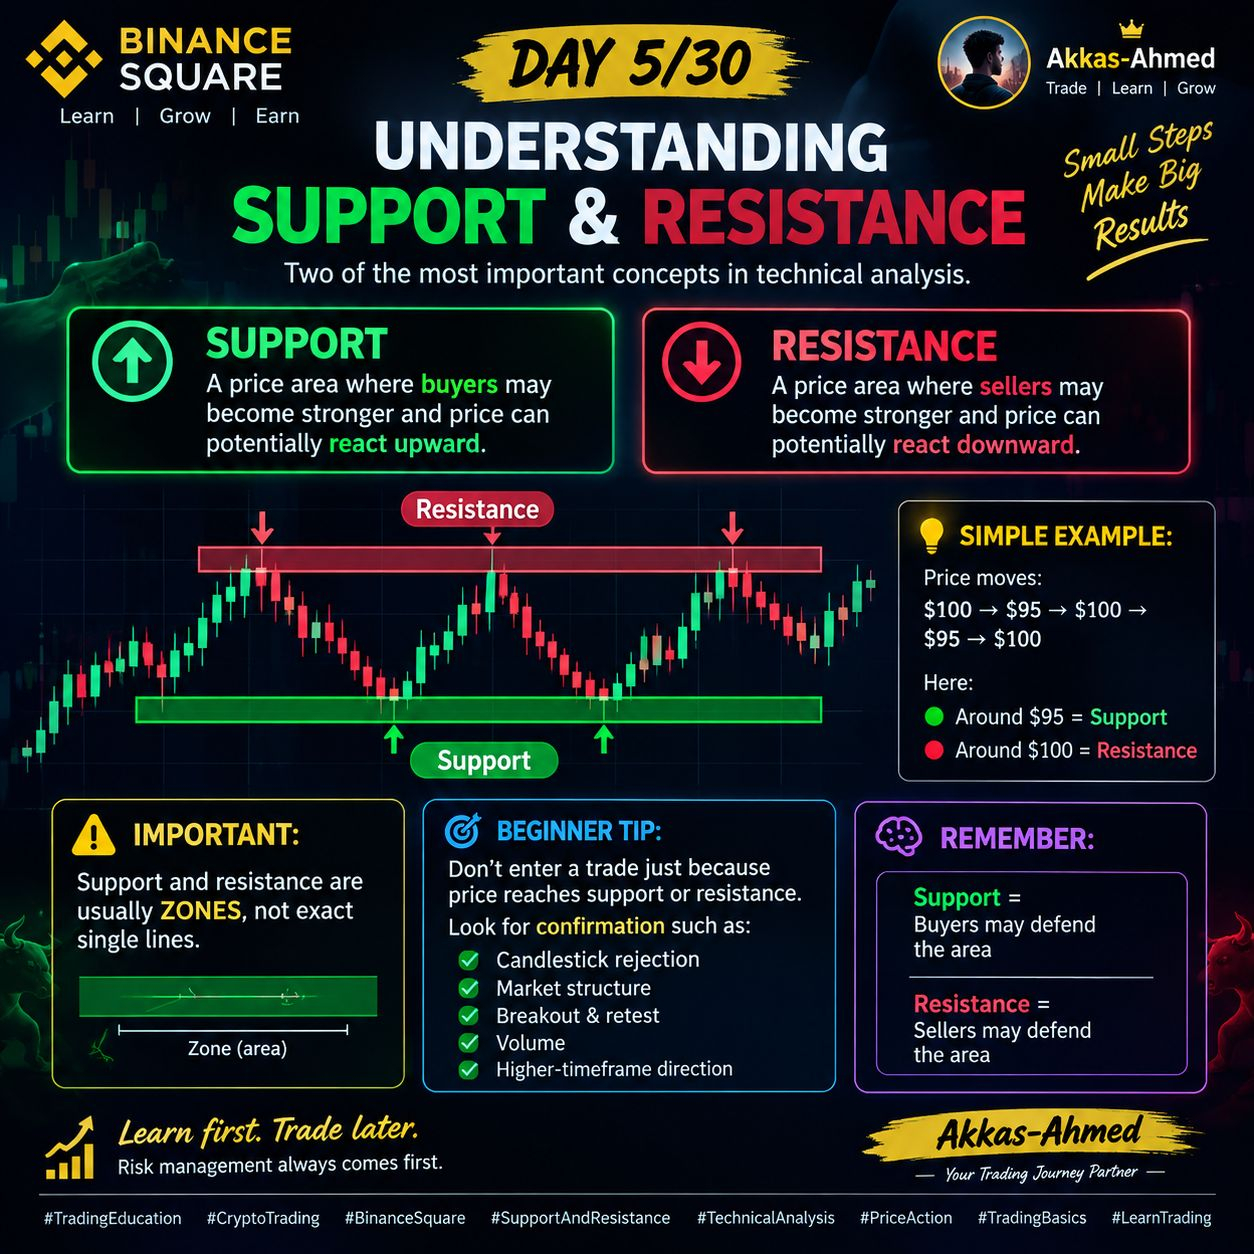
📅 DAY 5/30 — Understanding Support & Resistance 📊 $BTC
Support & Resistance are two of the most important concepts in technical analysis.
🟢 SUPPORT
A price area where buyers may become stronger and price can potentially react upward.
🔴 RESISTANCE
A price area where sellers may become stronger and price can potentially react downward.
📌 SIMPLE EXAMPLE:
Price moves: $100 → $95 → $100 → $95 → $100
Here: • Around $95 = Support • Around $100 = Resistance
⚠️ Important: Support and resistance are usually ZONES, not exact single lines.
💡 Beginner Tip: Don’t enter a trade just because price reaches support or resistance.
Look for confirmation such as: • Candlestick rejection • Market structure • Breakout & retest • Volume • Higher-timeframe direction
🧠 Remember: Support = Buyers may defend the area
Resistance = Sellers may defend the area
📚 Learn first. Trade later. Risk management always comes first.
#TradingEducation #CryptoTradingTip #BinanceSquareFamily #TechnicalAnalysis $BTC
📅 DAY 5/30 — Understanding Support & Resistance 📊 $BTC
Support & Resistance are two of the most important concepts in technical analysis.
🟢 SUPPORT
A price area where buyers may become stronger and price can potentially react upward.
🔴 RESISTANCE
A price area where sellers may become stronger and price can potentially react downward.
📌 SIMPLE EXAMPLE:
Price moves: $100 → $95 → $100 → $95 → $100
Here: • Around $95 = Support • Around $100 = Resistance
⚠️ Important: Support and resistance are usually ZONES, not exact single lines.
💡 Beginner Tip: Don’t enter a trade just because price reaches support or resistance.
Look for confirmation such as: • Candlestick rejection • Market structure • Breakout & retest • Volume • Higher-timeframe direction
🧠 Remember: Support = Buyers may defend the area
Resistance = Sellers may defend the area
📚 Learn first. Trade later. Risk management always comes first.
#TradingEducation #CryptoTradingTip #BinanceSquareFamily #TechnicalAnalysis $BTC
Support & Resistance are two of the most important concepts in technical analysis.
🟢 SUPPORT
A price area where buyers may become stronger and price can potentially react upward.
🔴 RESISTANCE
A price area where sellers may become stronger and price can potentially react downward.
📌 SIMPLE EXAMPLE:
Price moves: $100 → $95 → $100 → $95 → $100
Here: • Around $95 = Support • Around $100 = Resistance
⚠️ Important: Support and resistance are usually ZONES, not exact single lines.
💡 Beginner Tip: Don’t enter a trade just because price reaches support or resistance.
Look for confirmation such as: • Candlestick rejection • Market structure • Breakout & retest • Volume • Higher-timeframe direction
🧠 Remember: Support = Buyers may defend the area
Resistance = Sellers may defend the area
📚 Learn first. Trade later. Risk management always comes first.
#TradingEducation #CryptoTradingTip #BinanceSquareFamily #TechnicalAnalysis $BTC
72

Статья
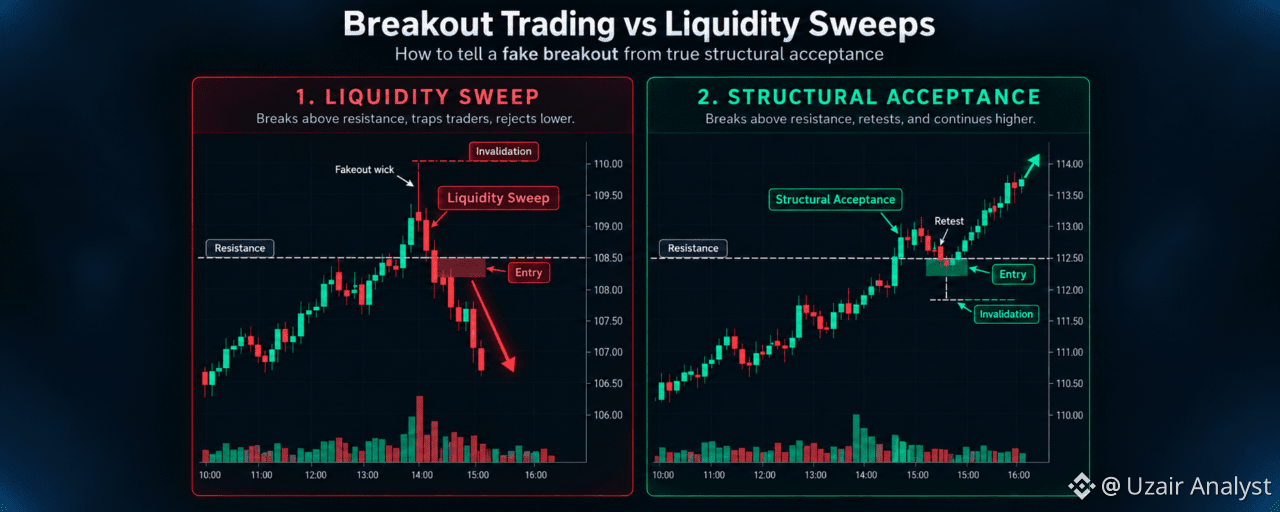
The Liquidity Illusion: Why Most Traders Get Trapped on BreakoutsMost traders see a large green candle piercing resistance as a signal to buy. To institutional desks, that exact candle is often just an exit door.
If you have ever market-bought a textbook breakout only to watch the price violently reverse into a red wick five minutes later, you didn't get unlucky—you provided the exit liquidity.
🧠 The Mechanics Behind the Trap
Markets do not move on patterns; they move on liquidity.
When an asset consolidates below a major resistance zone for days, two massive clusters of buy orders accumulate above that ceiling:
Buy-Stop orders from short sellers protecting their positions.Breakout Market-Buy orders from momentum traders waiting for the breach.
A high-volume entity holding a heavy position cannot simply sell at market price without crashing the order book against themselves. They need a concentrated surge of buyers. By driving price just high enough to trigger those stop-losses and breakout entries, they generate the exact counter-liquidity needed to offload size.
Once the trapped liquidity is absorbed, buying volume evaporates, and gravity takes over.
📊 Real Breakout vs. Liquidity Grab: The Difference
MetricLiquidity Grab (Fakeout)Structural BreakoutCandle BehaviorFast surge above level, leaves a long upper wickDecisive body close above level with minimal wick Volume SignatureVolume spike on the wick, dry volume immediately afterExpanding volume on the push, declining volume on the retest Lower TimeframeImmediate rejection back inside previous rangeRange acceptance: price treats previous resistance as support Open Interest (OI)Aggressive OI spike with funding heating up rapidly Gradual spot-driven accumulation backing derivatives volume
⚡ The 3-Rule Execution Checklist
Before taking another breakout trade, apply this filter:
Eliminate the First-Touch Entry: Never buy the initial expansion candle into an untested macro level. Chasing green candles gives you the worst possible risk-to-reward ratio.Wait for Structural Acceptance: A true breakout requires price to prove the level has changed hands. Look for a clean retest that prints a higher low above the broken level.Define Invalidation by Structure, Not Emotion: Your stop loss should not be an arbitrary percentage; it should sit where the breakout thesis is mathematically broken—typically back inside the old range.
Trading profitability does not come from catching every single move. It comes from avoiding the obvious traps designed to harvest impatient capital.
Chasing is optional. Discipline isn't.
$BTC $ETH #TradingEducation #CryptoStrategy #RiskManagement
The Liquidity Illusion: Why Most Traders Get Trapped on Breakouts
Most traders see a large green candle piercing resistance as a signal to buy. To institutional desks, that exact candle is often just an exit door.
If you have ever market-bought a textbook breakout only to watch the price violently reverse into a red wick five minutes later, you didn't get unlucky—you provided the exit liquidity.
🧠 The Mechanics Behind the Trap
Markets do not move on patterns; they move on liquidity.
When an asset consolidates below a major resistance zone for days, two massive clusters of buy orders accumulate above that ceiling:
Buy-Stop orders from short sellers protecting their positions.Breakout Market-Buy orders from momentum traders waiting for the breach.
A high-volume entity holding a heavy position cannot simply sell at market price without crashing the order book against themselves. They need a concentrated surge of buyers. By driving price just high enough to trigger those stop-losses and breakout entries, they generate the exact counter-liquidity needed to offload size.
Once the trapped liquidity is absorbed, buying volume evaporates, and gravity takes over.
📊 Real Breakout vs. Liquidity Grab: The Difference
MetricLiquidity Grab (Fakeout)Structural BreakoutCandle BehaviorFast surge above level, leaves a long upper wickDecisive body close above level with minimal wick Volume SignatureVolume spike on the wick, dry volume immediately afterExpanding volume on the push, declining volume on the retest Lower TimeframeImmediate rejection back inside previous rangeRange acceptance: price treats previous resistance as support Open Interest (OI)Aggressive OI spike with funding heating up rapidly Gradual spot-driven accumulation backing derivatives volume
⚡ The 3-Rule Execution Checklist
Before taking another breakout trade, apply this filter:
Eliminate the First-Touch Entry: Never buy the initial expansion candle into an untested macro level. Chasing green candles gives you the worst possible risk-to-reward ratio.Wait for Structural Acceptance: A true breakout requires price to prove the level has changed hands. Look for a clean retest that prints a higher low above the broken level.Define Invalidation by Structure, Not Emotion: Your stop loss should not be an arbitrary percentage; it should sit where the breakout thesis is mathematically broken—typically back inside the old range.
Trading profitability does not come from catching every single move. It comes from avoiding the obvious traps designed to harvest impatient capital.
Chasing is optional. Discipline isn't.
$BTC $ETH #TradingEducation #CryptoStrategy #RiskManagement
If you have ever market-bought a textbook breakout only to watch the price violently reverse into a red wick five minutes later, you didn't get unlucky—you provided the exit liquidity.
🧠 The Mechanics Behind the Trap
Markets do not move on patterns; they move on liquidity.
When an asset consolidates below a major resistance zone for days, two massive clusters of buy orders accumulate above that ceiling:
Buy-Stop orders from short sellers protecting their positions.Breakout Market-Buy orders from momentum traders waiting for the breach.
A high-volume entity holding a heavy position cannot simply sell at market price without crashing the order book against themselves. They need a concentrated surge of buyers. By driving price just high enough to trigger those stop-losses and breakout entries, they generate the exact counter-liquidity needed to offload size.
Once the trapped liquidity is absorbed, buying volume evaporates, and gravity takes over.
📊 Real Breakout vs. Liquidity Grab: The Difference
MetricLiquidity Grab (Fakeout)Structural BreakoutCandle BehaviorFast surge above level, leaves a long upper wickDecisive body close above level with minimal wick Volume SignatureVolume spike on the wick, dry volume immediately afterExpanding volume on the push, declining volume on the retest Lower TimeframeImmediate rejection back inside previous rangeRange acceptance: price treats previous resistance as support Open Interest (OI)Aggressive OI spike with funding heating up rapidly Gradual spot-driven accumulation backing derivatives volume
⚡ The 3-Rule Execution Checklist
Before taking another breakout trade, apply this filter:
Eliminate the First-Touch Entry: Never buy the initial expansion candle into an untested macro level. Chasing green candles gives you the worst possible risk-to-reward ratio.Wait for Structural Acceptance: A true breakout requires price to prove the level has changed hands. Look for a clean retest that prints a higher low above the broken level.Define Invalidation by Structure, Not Emotion: Your stop loss should not be an arbitrary percentage; it should sit where the breakout thesis is mathematically broken—typically back inside the old range.
Trading profitability does not come from catching every single move. It comes from avoiding the obvious traps designed to harvest impatient capital.
Chasing is optional. Discipline isn't.
$BTC $ETH #TradingEducation #CryptoStrategy #RiskManagement
56
Ever wonder why price rips away from a spot, then comes back to that exact spot before continuing?
That spot is an order block — the last candle before a strong, decisive move away from an area. It forms because large orders got filled there but not fully, so price returns later to let the rest execute before continuing the original direction. That's why these zones act like magnets on a pullback.
Watch this: never mark it as one thin line. Mark the whole candle's range, high to low. Price often wicks into part of the zone, not the exact edge, and reacts inside that range.
Where do you usually draw your zones — too tight or too wide?
$SOL $XRP $ADA #Trading #TradingEducation #Crypto #TA
Follow for daily trading education · Education only, not financial advice.
Ever wonder why price rips away from a spot, then comes back to that exact spot before continuing?
That spot is an order block — the last candle before a strong, decisive move away from an area. It forms because large orders got filled there but not fully, so price returns later to let the rest execute before continuing the original direction. That's why these zones act like magnets on a pullback.
Watch this: never mark it as one thin line. Mark the whole candle's range, high to low. Price often wicks into part of the zone, not the exact edge, and reacts inside that range.
Where do you usually draw your zones — too tight or too wide?
$SOL $XRP $ADA #Trading #TradingEducation #Crypto #TA
Follow for daily trading education · Education only, not financial advice.
That spot is an order block — the last candle before a strong, decisive move away from an area. It forms because large orders got filled there but not fully, so price returns later to let the rest execute before continuing the original direction. That's why these zones act like magnets on a pullback.
Watch this: never mark it as one thin line. Mark the whole candle's range, high to low. Price often wicks into part of the zone, not the exact edge, and reacts inside that range.
Where do you usually draw your zones — too tight or too wide?
$SOL $XRP $ADA #Trading #TradingEducation #Crypto #TA
Follow for daily trading education · Education only, not financial advice.

1
185
Big positions are never built in the candle everyone's watching.
Large players can't buy or sell all at once without moving price against themselves. So accumulation happens quietly — sideways ranges, boring charts, low volume periods where retail has already lost interest and moved on to whatever is pumping. Distribution works the same way in reverse: it looks calm, even bullish, right as size gets sold into strength. By the time the move is obvious, positioning is already done. The chop that bores you out of a trade is often the point, not a mistake.
Watch for extended ranges after a strong trend — that's where the real work gets done, not in the breakout candle.
What's the most boring chart you've ignored this month?
$AVAX $LINK $TRX #Trading #TradingEducation #Crypto #TA
Follow for daily trading education · Education only, not financial advice.
Big positions are never built in the candle everyone's watching.
Large players can't buy or sell all at once without moving price against themselves. So accumulation happens quietly — sideways ranges, boring charts, low volume periods where retail has already lost interest and moved on to whatever is pumping. Distribution works the same way in reverse: it looks calm, even bullish, right as size gets sold into strength. By the time the move is obvious, positioning is already done. The chop that bores you out of a trade is often the point, not a mistake.
Watch for extended ranges after a strong trend — that's where the real work gets done, not in the breakout candle.
What's the most boring chart you've ignored this month?
$AVAX $LINK $TRX #Trading #TradingEducation #Crypto #TA
Follow for daily trading education · Education only, not financial advice.
Large players can't buy or sell all at once without moving price against themselves. So accumulation happens quietly — sideways ranges, boring charts, low volume periods where retail has already lost interest and moved on to whatever is pumping. Distribution works the same way in reverse: it looks calm, even bullish, right as size gets sold into strength. By the time the move is obvious, positioning is already done. The chop that bores you out of a trade is often the point, not a mistake.
Watch for extended ranges after a strong trend — that's where the real work gets done, not in the breakout candle.
What's the most boring chart you've ignored this month?
$AVAX $LINK $TRX #Trading #TradingEducation #Crypto #TA
Follow for daily trading education · Education only, not financial advice.

103
Market structure · Lesson 4
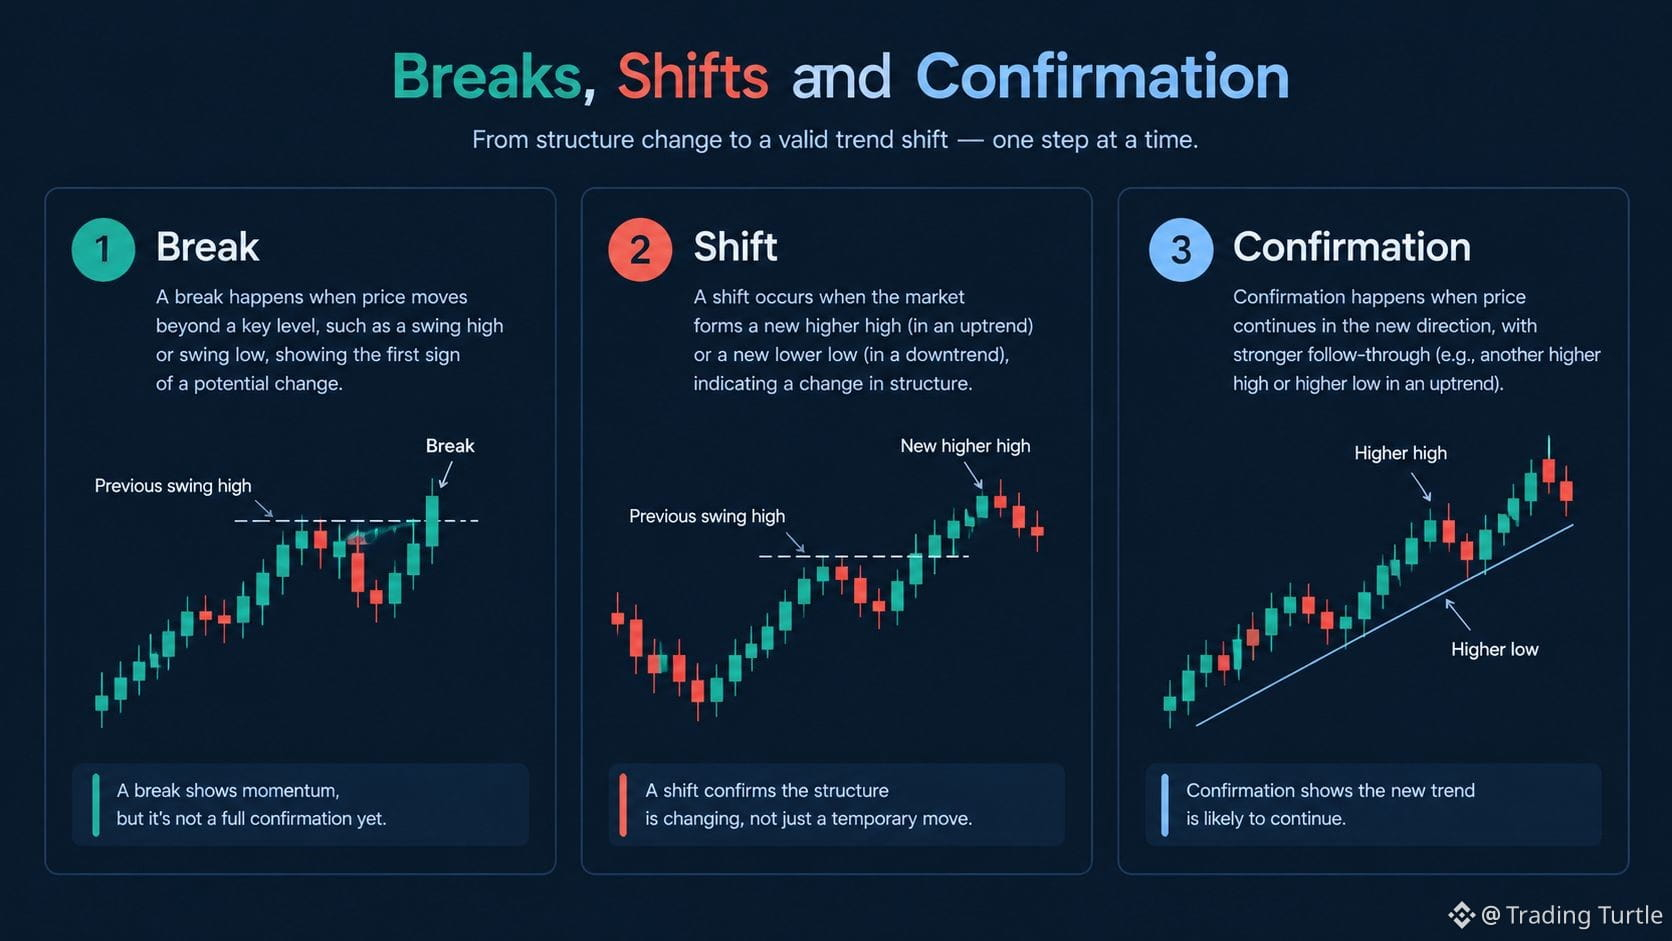
Breaks, shifts and confirmation
A broken level is a reason to reassess the chart, not proof of a new trend.
A break of a meaningful swing can weaken the prior structure, but it does not guarantee a full reversal. Confirmation usually comes from what price does after the break: whether the market accepts beyond the level, forms a new opposing swing sequence, or quickly reclaims the broken area. Structure is evidence for a trading thesis, not a promise about the next candle.
Compare a break followed by acceptance beyond a level with a break that quickly returns inside the old structure. The follow-through gives the two moves different meanings.
Find a historical break and hide the later candles. Write what evidence would strengthen or weaken each interpretation.
Next in this series: Market orders.
#TradingEducation #PriceAction #RiskManagement #TradingTurtle
Market structure · Lesson 4
Breaks, shifts and confirmation
A broken level is a reason to reassess the chart, not proof of a new trend.
A break of a meaningful swing can weaken the prior structure, but it does not guarantee a full reversal. Confirmation usually comes from what price does after the break: whether the market accepts beyond the level, forms a new opposing swing sequence, or quickly reclaims the broken area. Structure is evidence for a trading thesis, not a promise about the next candle.
Compare a break followed by acceptance beyond a level with a break that quickly returns inside the old structure. The follow-through gives the two moves different meanings.
Find a historical break and hide the later candles. Write what evidence would strengthen or weaken each interpretation.
Next in this series: Market orders.
#TradingEducation #PriceAction #RiskManagement #TradingTurtle
Breaks, shifts and confirmation
A broken level is a reason to reassess the chart, not proof of a new trend.
A break of a meaningful swing can weaken the prior structure, but it does not guarantee a full reversal. Confirmation usually comes from what price does after the break: whether the market accepts beyond the level, forms a new opposing swing sequence, or quickly reclaims the broken area. Structure is evidence for a trading thesis, not a promise about the next candle.
Compare a break followed by acceptance beyond a level with a break that quickly returns inside the old structure. The follow-through gives the two moves different meanings.
Find a historical break and hide the later candles. Write what evidence would strengthen or weaken each interpretation.
Next in this series: Market orders.
#TradingEducation #PriceAction #RiskManagement #TradingTurtle
51
·
--
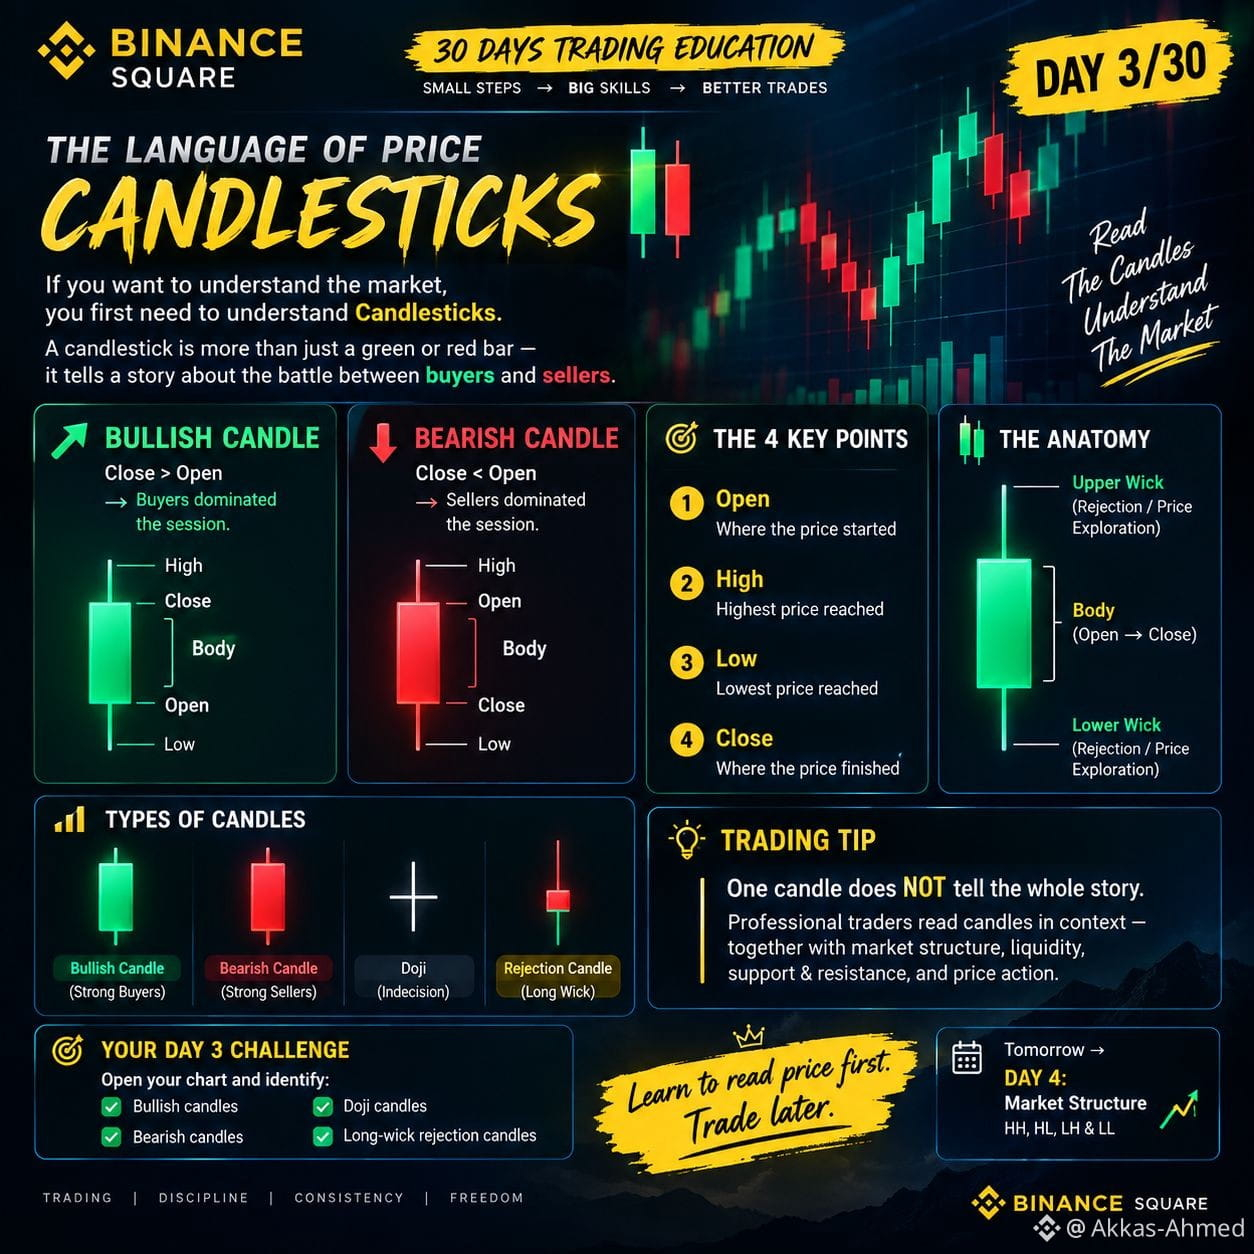
📅 DAY 3/30 — THE LANGUAGE OF PRICE 🕯️📊 @Binance_Earn_Official $
If you want to understand the market, you first need to understand Candlesticks.
A candlestick is more than just a green or red bar — it tells a story about the battle between buyers and sellers.
🟢 Bullish Candle Close > Open
➡️ Buyers dominated the session.
🔴 Bearish Candle Close < Open
➡️ Sellers dominated the session.
Every candle has 4 key points:
• Open → Where price started
• High → Highest price reached
• Low → Lowest price reached
• Close → Where price finished
And remember:
🧱 Body = Open ↔ Close
🕯️ Wick = Rejection / Price Exploration
💡 SMART TRADING RULE:
One candle does NOT tell the whole story.
Professional traders read candles in context — together with market structure, liquidity, support & resistance, and price action.
🎯 DAY 3 CHALLENGE:
Open your chart and identify: ✅ Bullish candles
✅ Bearish candles
✅ Doji candles
✅ Long-wick rejection candles
Don't rush to trade.
Learn to read price first. Trade later. 📚📈
Tomorrow → DAY 4: Market Structure — HH, HL, LH & LL 🔥
#TradingEducation #crypto #BinanceSquare @BTC-
📅 DAY 3/30 — THE LANGUAGE OF PRICE 🕯️📊 @Binance Earn Official $
If you want to understand the market, you first need to understand Candlesticks.
A candlestick is more than just a green or red bar — it tells a story about the battle between buyers and sellers.
🟢 Bullish Candle Close > Open
➡️ Buyers dominated the session.
🔴 Bearish Candle Close < Open
➡️ Sellers dominated the session.
Every candle has 4 key points:
• Open → Where price started
• High → Highest price reached
• Low → Lowest price reached
• Close → Where price finished
And remember:
🧱 Body = Open ↔ Close
🕯️ Wick = Rejection / Price Exploration
💡 SMART TRADING RULE:
One candle does NOT tell the whole story.
Professional traders read candles in context — together with market structure, liquidity, support & resistance, and price action.
🎯 DAY 3 CHALLENGE:
Open your chart and identify: ✅ Bullish candles
✅ Bearish candles
✅ Doji candles
✅ Long-wick rejection candles
Don't rush to trade.
Learn to read price first. Trade later. 📚📈
Tomorrow → DAY 4: Market Structure — HH, HL, LH & LL 🔥
#TradingEducation #crypto #BinanceSquare @BTC -
If you want to understand the market, you first need to understand Candlesticks.
A candlestick is more than just a green or red bar — it tells a story about the battle between buyers and sellers.
🟢 Bullish Candle Close > Open
➡️ Buyers dominated the session.
🔴 Bearish Candle Close < Open
➡️ Sellers dominated the session.
Every candle has 4 key points:
• Open → Where price started
• High → Highest price reached
• Low → Lowest price reached
• Close → Where price finished
And remember:
🧱 Body = Open ↔ Close
🕯️ Wick = Rejection / Price Exploration
💡 SMART TRADING RULE:
One candle does NOT tell the whole story.
Professional traders read candles in context — together with market structure, liquidity, support & resistance, and price action.
🎯 DAY 3 CHALLENGE:
Open your chart and identify: ✅ Bullish candles
✅ Bearish candles
✅ Doji candles
✅ Long-wick rejection candles
Don't rush to trade.
Learn to read price first. Trade later. 📚📈
Tomorrow → DAY 4: Market Structure — HH, HL, LH & LL 🔥
#TradingEducation #crypto #BinanceSquare @BTC -
1
105
Market structure · Lesson 3
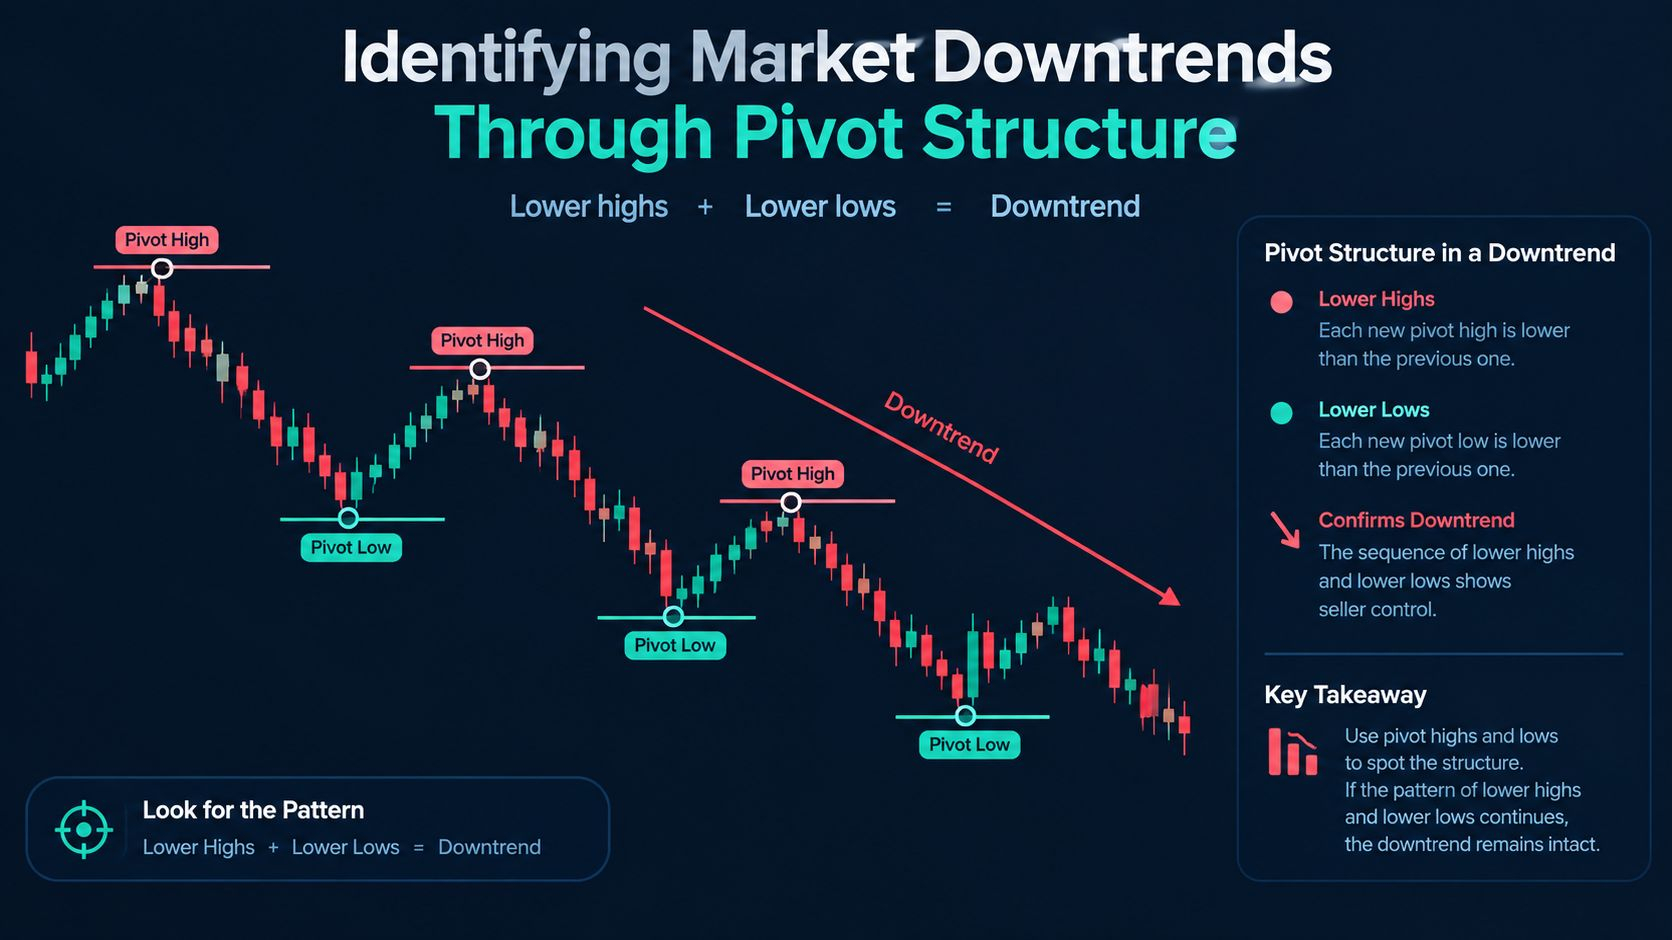
Lower highs and lower lows
A brief rally can look like a recovery even while the broader downtrend continues.
A downtrend is commonly described by meaningful lower highs and lower lows. Sellers repeatedly prevent rallies from reclaiming prior important highs while price establishes lower lows. Traders should distinguish structural pivots from ordinary noise and avoid calling a reversal from one isolated break without considering the next reaction and the higher-timeframe context.
Imagine a rally stops below the previous meaningful high, followed by a fresh low. Buyers lifted price temporarily, but the sequence of lower highs and lower lows remained intact.
On a historical chart, mark a rally high and the following low. Explain whether they changed the structure or continued it.
Next in this series: Breaks, shifts and confirmation.
#TradingEducation #PriceAction #RiskManagement #TradingTurtle
Market structure · Lesson 3
Lower highs and lower lows
A brief rally can look like a recovery even while the broader downtrend continues.
A downtrend is commonly described by meaningful lower highs and lower lows. Sellers repeatedly prevent rallies from reclaiming prior important highs while price establishes lower lows. Traders should distinguish structural pivots from ordinary noise and avoid calling a reversal from one isolated break without considering the next reaction and the higher-timeframe context.
Imagine a rally stops below the previous meaningful high, followed by a fresh low. Buyers lifted price temporarily, but the sequence of lower highs and lower lows remained intact.
On a historical chart, mark a rally high and the following low. Explain whether they changed the structure or continued it.
Next in this series: Breaks, shifts and confirmation.
#TradingEducation #PriceAction #RiskManagement #TradingTurtle
Lower highs and lower lows
A brief rally can look like a recovery even while the broader downtrend continues.
A downtrend is commonly described by meaningful lower highs and lower lows. Sellers repeatedly prevent rallies from reclaiming prior important highs while price establishes lower lows. Traders should distinguish structural pivots from ordinary noise and avoid calling a reversal from one isolated break without considering the next reaction and the higher-timeframe context.
Imagine a rally stops below the previous meaningful high, followed by a fresh low. Buyers lifted price temporarily, but the sequence of lower highs and lower lows remained intact.
On a historical chart, mark a rally high and the following low. Explain whether they changed the structure or continued it.
Next in this series: Breaks, shifts and confirmation.
#TradingEducation #PriceAction #RiskManagement #TradingTurtle
33
Most traders can't read a chart because they never learned to read structure first.
An uptrend is nothing mystical — it's just a sequence of higher highs and higher lows. Each pullback holds above the last low, each rally clears the last high. That rhythm is the trend's heartbeat. A break of structure happens when price fails to make a new high and instead slices below the prior higher low. That's not noise — it's the market telling you the buyers who controlled the rhythm just lost control.
Watch what happens after that break: does price reclaim structure fast, or build lower highs? That's your next clue.
What's the last structure break you spotted before a trend actually flipped?
$ETH $BNB $SOL #Trading #TradingEducation #Crypto #TA
Follow for daily trading education · Education only, not financial advice.
Most traders can't read a chart because they never learned to read structure first.
An uptrend is nothing mystical — it's just a sequence of higher highs and higher lows. Each pullback holds above the last low, each rally clears the last high. That rhythm is the trend's heartbeat. A break of structure happens when price fails to make a new high and instead slices below the prior higher low. That's not noise — it's the market telling you the buyers who controlled the rhythm just lost control.
Watch what happens after that break: does price reclaim structure fast, or build lower highs? That's your next clue.
What's the last structure break you spotted before a trend actually flipped?
$ETH $BNB $SOL #Trading #TradingEducation #Crypto #TA
Follow for daily trading education · Education only, not financial advice.
An uptrend is nothing mystical — it's just a sequence of higher highs and higher lows. Each pullback holds above the last low, each rally clears the last high. That rhythm is the trend's heartbeat. A break of structure happens when price fails to make a new high and instead slices below the prior higher low. That's not noise — it's the market telling you the buyers who controlled the rhythm just lost control.
Watch what happens after that break: does price reclaim structure fast, or build lower highs? That's your next clue.
What's the last structure break you spotted before a trend actually flipped?
$ETH $BNB $SOL #Trading #TradingEducation #Crypto #TA
Follow for daily trading education · Education only, not financial advice.

80

·
--
Fighting the trend is like swimming upstream with a heavy backpack. 🌊
Can it work? Sure—but price must not only reverse; it must prove it can hold.
When the higher timeframe makes higher highs and higher lows, longs usually face less friction than shorting every rally.
In a downtrend, lower highs and lower lows show sellers still control the path. Buying every “cheap” dip can lead to premature entries. ⚠️
Practical rule:
• Uptrend: wait for pullbacks into support, then confirmation
• Downtrend: wait for rallies into resistance, then confirmation
• Range: stop calling it a trend—trade smaller or wait
Trend trading isn’t buying green candles or shorting red ones. It’s waiting for a pullback and checking whether the dominant structure still holds.
You don’t need to nail the exact turning point. Avoid trades that require the whole market to reverse just to work.
Trade with the current, not against it. 🎯
Do you check higher-timeframe structure before entering? 👇
#TrendTrading #PriceAction #CryptoTrading #TradingEducation
Fighting the trend is like swimming upstream with a heavy backpack. 🌊
Can it work? Sure—but price must not only reverse; it must prove it can hold.
When the higher timeframe makes higher highs and higher lows, longs usually face less friction than shorting every rally.
In a downtrend, lower highs and lower lows show sellers still control the path. Buying every “cheap” dip can lead to premature entries. ⚠️
Practical rule:
• Uptrend: wait for pullbacks into support, then confirmation
• Downtrend: wait for rallies into resistance, then confirmation
• Range: stop calling it a trend—trade smaller or wait
Trend trading isn’t buying green candles or shorting red ones. It’s waiting for a pullback and checking whether the dominant structure still holds.
You don’t need to nail the exact turning point. Avoid trades that require the whole market to reverse just to work.
Trade with the current, not against it. 🎯
Do you check higher-timeframe structure before entering? 👇
#TrendTrading #PriceAction #CryptoTrading #TradingEducation
Can it work? Sure—but price must not only reverse; it must prove it can hold.
When the higher timeframe makes higher highs and higher lows, longs usually face less friction than shorting every rally.
In a downtrend, lower highs and lower lows show sellers still control the path. Buying every “cheap” dip can lead to premature entries. ⚠️
Practical rule:
• Uptrend: wait for pullbacks into support, then confirmation
• Downtrend: wait for rallies into resistance, then confirmation
• Range: stop calling it a trend—trade smaller or wait
Trend trading isn’t buying green candles or shorting red ones. It’s waiting for a pullback and checking whether the dominant structure still holds.
You don’t need to nail the exact turning point. Avoid trades that require the whole market to reverse just to work.
Trade with the current, not against it. 🎯
Do you check higher-timeframe structure before entering? 👇
#TrendTrading #PriceAction #CryptoTrading #TradingEducation

92
·
--
$What Is Trading? 📈
Trading is the process of analyzing price movements in a financial market and making decisions based on market information.
For beginners, the goal should not be quick profit. The first step is to understand how markets work, learn basic concepts, and develop responsible decision-making skills.
🔑 Key Takeaways
✅ Understand what trading means
✅ Learn how price movements work
✅ Study market analysis
✅ Understand risk before thinking about profit
✅ Build knowledge step by step
💡 Remember: Knowledge comes before money. Never make financial decisions based only on social-media posts or someone else's signals.
Educational content only. Not financial advice.
Akkas-Ahmed
Binance Square Educational Series
#TradingSignals #CryptoEducation #MarketAnalysisПодробнее #TradingEducation #BinanceSquare
$What Is Trading? 📈
Trading is the process of analyzing price movements in a financial market and making decisions based on market information.
For beginners, the goal should not be quick profit. The first step is to understand how markets work, learn basic concepts, and develop responsible decision-making skills.
🔑 Key Takeaways
✅ Understand what trading means
✅ Learn how price movements work
✅ Study market analysis
✅ Understand risk before thinking about profit
✅ Build knowledge step by step
💡 Remember: Knowledge comes before money. Never make financial decisions based only on social-media posts or someone else's signals.
Educational content only. Not financial advice.
Akkas-Ahmed
Binance Square Educational Series
#TradingSignals #CryptoEducation #MarketAnalysisПодробнее #TradingEducation #BinanceSquare
Trading is the process of analyzing price movements in a financial market and making decisions based on market information.
For beginners, the goal should not be quick profit. The first step is to understand how markets work, learn basic concepts, and develop responsible decision-making skills.
🔑 Key Takeaways
✅ Understand what trading means
✅ Learn how price movements work
✅ Study market analysis
✅ Understand risk before thinking about profit
✅ Build knowledge step by step
💡 Remember: Knowledge comes before money. Never make financial decisions based only on social-media posts or someone else's signals.
Educational content only. Not financial advice.
Akkas-Ahmed
Binance Square Educational Series
#TradingSignals #CryptoEducation #MarketAnalysisПодробнее #TradingEducation #BinanceSquare

Binance BiBi:
Working on it. Your reply is on the way.
2
1
121

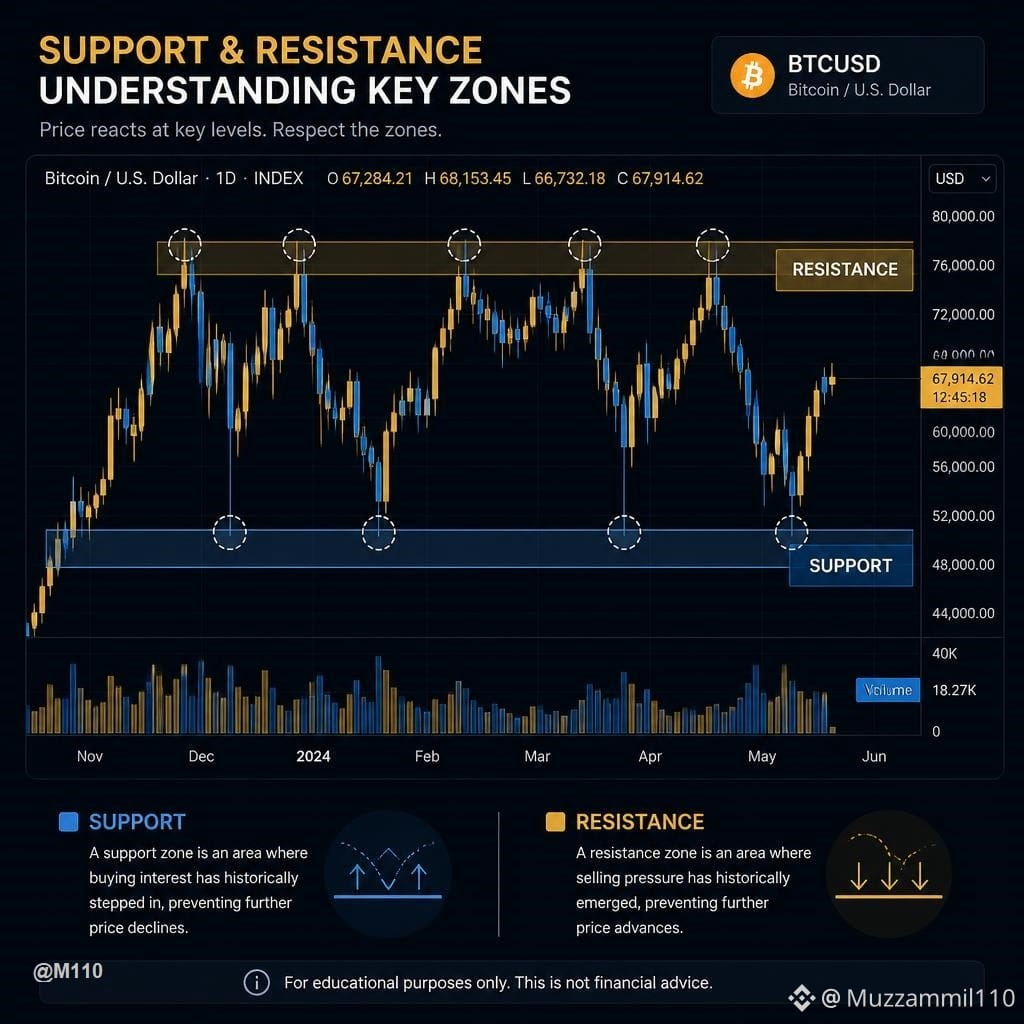
📊 Support & Resistance: Why These Levels Matter More Than Random Price Targets
When studying a crypto chart, it's easy to focus on a specific price target.
But before thinking about where price might go, it's often more useful to understand where price has previously reacted.
That's where support and resistance come in.
🔹 Support
A price area where buying interest has previously helped slow or stop a decline.
🔹 Resistance
A price area where selling pressure has previously slowed or stopped an advance.
🔹 Why Are They Important?
These aren't magic numbers.
They are areas where traders and market participants have previously shown interest. The more clearly a level has been respected, the more useful it can be as part of your chart analysis.
🔹 Levels vs. Exact Lines
Beginners often draw one perfect line.
In reality, support and resistance are often better viewed as zones because price can move slightly above or below an area before reacting.
🔹 Context Matters
A level should not be analyzed in isolation.
Consider:
• Market structure
• Volume
• Previous reactions
• Timeframe
• Overall market conditions
📌 Beginner takeaway:
Instead of asking:
"What's the next random price target?"
Start by asking:
"Where has the market previously shown strong interest?"
That simple change can make chart analysis much more structured.
$BTC
This is educational content, not a trading signal or financial advice.
💬 When analyzing a chart, do you focus more on support, resistance, or both?
Daily crypto thoughts for calm decision-makers — follow
#Marketstructure #tradingeducation #CryptoTrading #CryptoWithAli #BinanceSquare
📊 Support & Resistance: Why These Levels Matter More Than Random Price Targets
When studying a crypto chart, it's easy to focus on a specific price target.
But before thinking about where price might go, it's often more useful to understand where price has previously reacted.
That's where support and resistance come in.
🔹 Support
A price area where buying interest has previously helped slow or stop a decline.
🔹 Resistance
A price area where selling pressure has previously slowed or stopped an advance.
🔹 Why Are They Important?
These aren't magic numbers.
They are areas where traders and market participants have previously shown interest. The more clearly a level has been respected, the more useful it can be as part of your chart analysis.
🔹 Levels vs. Exact Lines
Beginners often draw one perfect line.
In reality, support and resistance are often better viewed as zones because price can move slightly above or below an area before reacting.
🔹 Context Matters
A level should not be analyzed in isolation.
Consider:
• Market structure
• Volume
• Previous reactions
• Timeframe
• Overall market conditions
📌 Beginner takeaway:
Instead of asking:
"What's the next random price target?"
Start by asking:
"Where has the market previously shown strong interest?"
That simple change can make chart analysis much more structured.
$BTC
This is educational content, not a trading signal or financial advice.
💬 When analyzing a chart, do you focus more on support, resistance, or both?
Daily crypto thoughts for calm decision-makers — follow
#Marketstructure #tradingeducation #CryptoTrading #CryptoWithAli #BinanceSquare
When studying a crypto chart, it's easy to focus on a specific price target.
But before thinking about where price might go, it's often more useful to understand where price has previously reacted.
That's where support and resistance come in.
🔹 Support
A price area where buying interest has previously helped slow or stop a decline.
🔹 Resistance
A price area where selling pressure has previously slowed or stopped an advance.
🔹 Why Are They Important?
These aren't magic numbers.
They are areas where traders and market participants have previously shown interest. The more clearly a level has been respected, the more useful it can be as part of your chart analysis.
🔹 Levels vs. Exact Lines
Beginners often draw one perfect line.
In reality, support and resistance are often better viewed as zones because price can move slightly above or below an area before reacting.
🔹 Context Matters
A level should not be analyzed in isolation.
Consider:
• Market structure
• Volume
• Previous reactions
• Timeframe
• Overall market conditions
📌 Beginner takeaway:
Instead of asking:
"What's the next random price target?"
Start by asking:
"Where has the market previously shown strong interest?"
That simple change can make chart analysis much more structured.
$BTC
This is educational content, not a trading signal or financial advice.
💬 When analyzing a chart, do you focus more on support, resistance, or both?
Daily crypto thoughts for calm decision-makers — follow
#Marketstructure #tradingeducation #CryptoTrading #CryptoWithAli #BinanceSquare
65
·
--
Support and resistance are areas—not laser lines. 🎯
Price rarely taps one exact number, reverses perfectly, and sends you a thank-you note.
Why? Because traders place orders across an area. Some buy early. Some wait for confirmation. Some take profit just before the obvious level.
So draw a zone, not a single thin line.
Example: price has reacted several times between 98 and 100. That whole range is a support zone. If price dips to 99.2, wicks below 98.8, then closes back inside the area, support may still be doing its job.
But if price closes decisively below the zone and starts holding underneath it, the idea has weakened. A wick is a test. Acceptance below is different. ⚠️
Practical rule:
Mark the cluster of prior reactions.
Watch how price behaves inside it.
Use candle closes and market structure—not one tiny wick—to judge a break.
And don’t enter just because price touched your line. Ask: are buyers or sellers actually defending this zone?
Levels guide your attention. Price action gives the answer. 🧠
Do you draw your support and resistance as lines or zones? 👇
#SupportResistance #PriceAction #CryptoTrading #TradingEducation
Support and resistance are areas—not laser lines. 🎯
Price rarely taps one exact number, reverses perfectly, and sends you a thank-you note.
Why? Because traders place orders across an area. Some buy early. Some wait for confirmation. Some take profit just before the obvious level.
So draw a zone, not a single thin line.
Example: price has reacted several times between 98 and 100. That whole range is a support zone. If price dips to 99.2, wicks below 98.8, then closes back inside the area, support may still be doing its job.
But if price closes decisively below the zone and starts holding underneath it, the idea has weakened. A wick is a test. Acceptance below is different. ⚠️
Practical rule:
Mark the cluster of prior reactions.
Watch how price behaves inside it.
Use candle closes and market structure—not one tiny wick—to judge a break.
And don’t enter just because price touched your line. Ask: are buyers or sellers actually defending this zone?
Levels guide your attention. Price action gives the answer. 🧠
Do you draw your support and resistance as lines or zones? 👇
#SupportResistance #PriceAction #CryptoTrading #TradingEducation
Price rarely taps one exact number, reverses perfectly, and sends you a thank-you note.
Why? Because traders place orders across an area. Some buy early. Some wait for confirmation. Some take profit just before the obvious level.
So draw a zone, not a single thin line.
Example: price has reacted several times between 98 and 100. That whole range is a support zone. If price dips to 99.2, wicks below 98.8, then closes back inside the area, support may still be doing its job.
But if price closes decisively below the zone and starts holding underneath it, the idea has weakened. A wick is a test. Acceptance below is different. ⚠️
Practical rule:
Mark the cluster of prior reactions.
Watch how price behaves inside it.
Use candle closes and market structure—not one tiny wick—to judge a break.
And don’t enter just because price touched your line. Ask: are buyers or sellers actually defending this zone?
Levels guide your attention. Price action gives the answer. 🧠
Do you draw your support and resistance as lines or zones? 👇
#SupportResistance #PriceAction #CryptoTrading #TradingEducation

59
·
--
The biggest breakout candle is often the one that traps impatient traders. 🚨
A breakout is not “valid” because price moved hard.
Quality matters more than size.
A strong breakout usually shows 3 things:
• Price closes clearly beyond the level — not just a wick through it
• The level holds on a retest, or price builds above it
• There is room to the next resistance/support — not a wall sitting 1% away
Example:
Price breaks above resistance with a huge green candle. Everyone rushes in. But the candle closes back inside the range.
That is not strength. That is rejection.
Compare it with a smaller candle that closes above resistance, pauses, retests the level, then holds. Less exciting? Maybe. But the market is proving buyers can defend the new area. 🎯
Practical rule: don’t judge a breakout by the first spike. Wait for the close, then ask: “Did price actually accept above the level?”
Big candles create FOMO. Structure creates conviction.
Trade the confirmation—not the excitement. What breakout signal do you trust most: candle close, retest, or volume? 👇
#Breakouts #CryptoTrading #PriceAction #TradingEducation
The biggest breakout candle is often the one that traps impatient traders. 🚨
A breakout is not “valid” because price moved hard.
Quality matters more than size.
A strong breakout usually shows 3 things:
• Price closes clearly beyond the level — not just a wick through it
• The level holds on a retest, or price builds above it
• There is room to the next resistance/support — not a wall sitting 1% away
Example:
Price breaks above resistance with a huge green candle. Everyone rushes in. But the candle closes back inside the range.
That is not strength. That is rejection.
Compare it with a smaller candle that closes above resistance, pauses, retests the level, then holds. Less exciting? Maybe. But the market is proving buyers can defend the new area. 🎯
Practical rule: don’t judge a breakout by the first spike. Wait for the close, then ask: “Did price actually accept above the level?”
Big candles create FOMO. Structure creates conviction.
Trade the confirmation—not the excitement. What breakout signal do you trust most: candle close, retest, or volume? 👇
#Breakouts #CryptoTrading #PriceAction #TradingEducation
A breakout is not “valid” because price moved hard.
Quality matters more than size.
A strong breakout usually shows 3 things:
• Price closes clearly beyond the level — not just a wick through it
• The level holds on a retest, or price builds above it
• There is room to the next resistance/support — not a wall sitting 1% away
Example:
Price breaks above resistance with a huge green candle. Everyone rushes in. But the candle closes back inside the range.
That is not strength. That is rejection.
Compare it with a smaller candle that closes above resistance, pauses, retests the level, then holds. Less exciting? Maybe. But the market is proving buyers can defend the new area. 🎯
Practical rule: don’t judge a breakout by the first spike. Wait for the close, then ask: “Did price actually accept above the level?”
Big candles create FOMO. Structure creates conviction.
Trade the confirmation—not the excitement. What breakout signal do you trust most: candle close, retest, or volume? 👇
#Breakouts #CryptoTrading #PriceAction #TradingEducation

39
Войдите, чтобы посмотреть больше материала
Присоединяйтесь к пользователям криптовалют по всему миру на Binance Square
⚡️ Получайте новейшую и полезную информацию о криптоактивах.
💬 Нам доверяет крупнейшая в мире криптобиржа.
👍 Получите достоверные аналитические данные от верифицированных создателей контента.
Эл. почта/номер телефона
В тренде
1
#SECReceivesGrayscaleLitecoinTrustETFFiling
Просмотров: 36,870
761 обсуждают
2
#ClarityActFacesProceduralVoteSept15
Просмотров: 150,457
1,722 обсуждают
3
#US10YearTreasuryYieldNears5%
Просмотров: 51,568
938 обсуждают
4
#CryptoLiquidations$674MIn24H
Просмотров: 10,713
149 обсуждают
5
#TokenizedStockHoldersUp619.1%
Просмотров: 50,224
819 обсуждают
6
#RevolutConfirmsFakeGovEmailDataBreach
Просмотров: 79,716
1,107 обсуждают
7
#CanadaOSFISaysTokenizedDepositsEqualTraditionalDeposits
Просмотров: 4,694
93 обсуждают
8
#USBankCompletesCrossBorderPaymentPilotOnStellar
Просмотров: 68,651
1,109 обсуждают
9
#NvidiaInTalksToInvestUpTo$10BInAnthropicIPO
Просмотров: 4,765
81 обсуждают
10
#EtherRalliesAsBearishBetsLiquidate
Просмотров: 104,554
1,384 обсуждают