

#technicalanalysispost
technicalanalysispost
Просмотров: 9,264
143 обсуждают
Популярные
Новые

Writing
$BTC (BTC) TRADING STRATEGY
₿ Strategy: Trend + Support & Resistance
📈 Bullish Setup • Wait for BTC to break above resistance. • Confirm the breakout with strong volume. • Look for a retest before considering entry.
📉 Bearish Setup • Watch for rejection at resistance. • Wait for support to break before considering a short setup.
🎯 Risk Management • Always set a Stop-Loss (SL). • Aim for a minimum 1:2 risk-to-reward ratio. • Never risk more than you can afford to lose.
⏳ Timeframe: 4H Chart
⚠️ Reminder: Wait for confirmation. Avoid FOMO trading.
💬 Are you BTC bullish or bearish?
#Bitcoin #BTC #CryptoTrading #TradingStrategy #Binance #TechnicalAnalysisPost
{spot}(BTCUSDT)
⚠️ Educational cont#BinancePick ent only. Not financial advice.
Writing
$BTC (BTC) TRADING STRATEGY
₿ Strategy: Trend + Support & Resistance
📈 Bullish Setup • Wait for BTC to break above resistance. • Confirm the breakout with strong volume. • Look for a retest before considering entry.
📉 Bearish Setup • Watch for rejection at resistance. • Wait for support to break before considering a short setup.
🎯 Risk Management • Always set a Stop-Loss (SL). • Aim for a minimum 1:2 risk-to-reward ratio. • Never risk more than you can afford to lose.
⏳ Timeframe: 4H Chart
⚠️ Reminder: Wait for confirmation. Avoid FOMO trading.
💬 Are you BTC bullish or bearish?
#Bitcoin #BTC #CryptoTrading #TradingStrategy #Binance #TechnicalAnalysisPost
⚠️ Educational cont#BinancePick ent only. Not financial advice.
59

🚨 Bitcoin ($BTC ) Next Big Move Alert! ⚡
Market is currently testing a crucial key level on the 4H timeframe. Price action is showing strong consolidation right near the resistance zone.
📌 My Trade Setup & Plan:
• Direction: Looking for a breakout / pullback entry
• Entry Zone: Watch local support zones
• Target 1 (TP): Clean resistance level
• Stop Loss (SL): Below recent swing low
💡 Remember: Always manage your risk properly before entering any trade. Capital preservation comes first! 🛡️
What are your thoughts on BTC right now? Are you bullish or bearish? Let me know in the comments below! 👇
#BinanceSquareFamily #CryptoTrading. #TechnicalAnalysisPost #PriceActionAlwaysWin #BTC☀️
{spot}(BTCUSDT)
Disclaimer: Educational content only. DYOR / NFA.
🚨 Bitcoin ($BTC ) Next Big Move Alert! ⚡
Market is currently testing a crucial key level on the 4H timeframe. Price action is showing strong consolidation right near the resistance zone.
📌 My Trade Setup & Plan:
• Direction: Looking for a breakout / pullback entry
• Entry Zone: Watch local support zones
• Target 1 (TP): Clean resistance level
• Stop Loss (SL): Below recent swing low
💡 Remember: Always manage your risk properly before entering any trade. Capital preservation comes first! 🛡️
What are your thoughts on BTC right now? Are you bullish or bearish? Let me know in the comments below! 👇
#BinanceSquareFamily #CryptoTrading. #TechnicalAnalysisPost #PriceActionAlwaysWin #BTC☀️
Disclaimer: Educational content only. DYOR / NFA.
1
110

🎯 Support and Resistance: Key Levels Every Trader Should Understand!
Support is a price area where buying interest may appear, while resistance is an area where selling pressure may increase.
📊 These levels can help traders analyze price movements, but they are not guaranteed to predict what happens next.
Do you use support and resistance in your trading strategy? Share your thoughts! 👇
#CryptoTrading #SupportAndResistance #TechnicalAnalysisPost #TradingTips #BinanceSquare
42

·
--
Рост
$SOL Solana (SOL) Price Analysis Today | October 23, 2026
📊 Market Overview
$SOL
{spot}(SOLUSDT)
Solana (SOL) is showing volatile price action, with buyers attempting to defend important support levels. Recent market reporting highlighted a price snapshot of $103.43, up 1.03% intraday. This is a reported snapshot, not a guaranteed live price.
🔍 Technical Analysis
1. Support Zone: Around $100
If SOL holds this area, buyers may attempt another recovery. A breakdown below support could increase selling pressure.
2. Resistance Zone: $105–$108
A sustained move above this area, supported by strong trading volume, could improve short-term momentum.
3. Market Momentum: Mixed to bearish
Recent technical reporting indicated negative MACD momentum, suggesting that buyers should wait for stronger confirmation before assuming a bullish trend.
📈 What Could Happen Next?
- Bullish scenario: SOL breaks above resistance with strong volume and maintains the breakout.
- Bearish scenario: SOL loses support and selling pressure increases.
- Sideways scenario: SOL continues consolidating while traders wait for a clearer direction.
💡 Final Thoughts
Solana remains worth watching because of its blockchain ecosystem and continued development. However, short-term price direction is uncertain. Monitor price action, trading volume, and momentum indicators instead of relying on a single signal.
⚠️ Disclaimer: This article is for educational purposes only, not financial advice. The price levels are illustrative and require confirmation against the latest SOL/USDT chart.
#Solana #SOL #CryptoAnalysis #BinanceSquare #TechnicalAnalysisPost #BinancePick #EarningsSeason #HSBCBeginsPhasedRolloutOfHKDStablecoinRedCoin #InterpolAfricaOperationArrests1462
$SOL Solana (SOL) Price Analysis Today | October 23, 2026
📊 Market Overview
$SOL
Solana (SOL) is showing volatile price action, with buyers attempting to defend important support levels. Recent market reporting highlighted a price snapshot of $103.43, up 1.03% intraday. This is a reported snapshot, not a guaranteed live price.
🔍 Technical Analysis
1. Support Zone: Around $100
If SOL holds this area, buyers may attempt another recovery. A breakdown below support could increase selling pressure.
2. Resistance Zone: $105–$108
A sustained move above this area, supported by strong trading volume, could improve short-term momentum.
3. Market Momentum: Mixed to bearish
Recent technical reporting indicated negative MACD momentum, suggesting that buyers should wait for stronger confirmation before assuming a bullish trend.
📈 What Could Happen Next?
- Bullish scenario: SOL breaks above resistance with strong volume and maintains the breakout.
- Bearish scenario: SOL loses support and selling pressure increases.
- Sideways scenario: SOL continues consolidating while traders wait for a clearer direction.
💡 Final Thoughts
Solana remains worth watching because of its blockchain ecosystem and continued development. However, short-term price direction is uncertain. Monitor price action, trading volume, and momentum indicators instead of relying on a single signal.
⚠️ Disclaimer: This article is for educational purposes only, not financial advice. The price levels are illustrative and require confirmation against the latest SOL/USDT chart.
#Solana #SOL #CryptoAnalysis #BinanceSquare #TechnicalAnalysisPost #BinancePick #EarningsSeason #HSBCBeginsPhasedRolloutOfHKDStablecoinRedCoin #InterpolAfricaOperationArrests1462
33

₿ Bitcoin ($BTC /$USDT ) Analysis | October 22, 2026
Bitcoin is trading near the $83,000 zone, and traders are watching whether buyers can defend nearby support or push the price toward resistance. Recent market data shows continued volatility, making confirmation especially important. <Cite refs={["turn546824search0","turn546824search10"]}/>
📊 Key Levels to Watch 🔹 Immediate support: $82,600 🔹 Major support zone: $80,000–$81,000 🔹 Immediate resistance: $84,900–$85,500 🔹 Higher resistance: $88,000
📈 Bullish Scenario: If BTC breaks above $85,500 and holds that level with strong volume, further upside may become possible.
📉 Bearish Scenario: If BTC loses the $82,600 area, sellers could push the price toward lower support zones.
🎯 My Strategy: Wait for confirmation, monitor trading volume, and manage risk carefully. A breakout is not confirmed until price action supports it.
💬 What do you think? Will BTC break above $85,500 or retest support first? Share your analysis below!
#Bitcoin #BTCUSDT #CryptoAnalysis #BinanceSquare #CryptoMarket #TechnicalAnalysisPost #BTC☀ #BTCUSDTAnalysis
{future}(BTCUSDT)
₿ Bitcoin ($BTC /$USDT ) Analysis | October 22, 2026
Bitcoin is trading near the $83,000 zone, and traders are watching whether buyers can defend nearby support or push the price toward resistance. Recent market data shows continued volatility, making confirmation especially important. <Cite refs={["turn546824search0","turn546824search10"]}/>
📊 Key Levels to Watch 🔹 Immediate support: $82,600 🔹 Major support zone: $80,000–$81,000 🔹 Immediate resistance: $84,900–$85,500 🔹 Higher resistance: $88,000
📈 Bullish Scenario: If BTC breaks above $85,500 and holds that level with strong volume, further upside may become possible.
📉 Bearish Scenario: If BTC loses the $82,600 area, sellers could push the price toward lower support zones.
🎯 My Strategy: Wait for confirmation, monitor trading volume, and manage risk carefully. A breakout is not confirmed until price action supports it.
💬 What do you think? Will BTC break above $85,500 or retest support first? Share your analysis below!
#Bitcoin #BTCUSDT #CryptoAnalysis #BinanceSquare #CryptoMarket #TechnicalAnalysisPost #BTC☀ #BTCUSDTAnalysis
73

·
--
$AGT Tests $0.09888 Resistance: Breakout or Rejection? | Open Interest +31% in 24h
📊 $AGT Quant Outlook | 1-Day Intraday
Price: 0.091430 (+32.1% / 1D)
Trend (1H): Uptrend | RSI 62
Structure: above 200D MA ✅
🔑 Key Levels
Support: 0.073504 / 0.060453
Resistance: 0.098884 / 0.106891
📈 Bull case: 1H close above 0.098884 → 0.106891 next
📉 Bear case: 1H close below 0.073504 → 0.060453 in play
🧮 Derivatives Pulse
• Funding: +0.0251% (neutral)
• Open Interest: $45.5M (+31.4% 24h)
• Liquidations 24h: Longs $310K | Shorts $758K
• Top traders L/S 1.50 vs Retail 0.66
🌐 Market Context
• Fear & Greed: 59 (Greed)
• BTC trend (1D): Bullish
• Short-term model bias (1-4h): Neutral
🎯 Trade Idea (R:R-checked)
LONG on retest ~0.075506 | SL 0.067498 | TP1 0.098884 | TP2 0.106891 | R:R 1:2.9
Risk management: max 2x isolated, risk ≤1-2% of capital
Not Financial Advice | DYOR
#AGTUSDT #CryptoAnalysis" #TechnicalAnalysisPost #BinanceSquare #AGTUSDT
— Crypto Quant Analyst | Fundamental & Technical Expert | Data-backed insights
1
224

·
--
🔊 دليل اكتشاف الحجم والسيولة (Volume)
🧠 سر التداول الاحترافي: كيف تقرأ أحجام التداول (Volume) وتكتشف تجميع الحيتان؟ 📈
📊 المؤشرات الفنية كثيرة، لكن حجم التداول (Volume) هو المؤشر الوحيد الذي لا يمكن تزييفه!
🔊 تعلم كيف تقرأ الفارق بين التجميع الحقيقي والتصريف الخادع.
✨️علامات التجميع الحقيقي (Accumulation):
🟢 زيادة تدريجية في أحجام التداول مع استقرار السعر أو صعوده ببطء.
🟢 ظهور شمعات صاعدة ذات أحجام تداول أضعاف الشمعات الهابطة.
🟢 ثبات السعر فوق المتوسطات المتحركة الرئيسية (مثل MA 25 و MA 99) مع ضخ سيولةمتزايد.
علامات التصريف (Distribution):
🔴 ارتفاع ضخم جداً في الحجم عند القمم دون تحقيق صعود سعري حقيقي (احذر الفخ!).
💡 نصيحة اليوم: لا تعتمد على السعر بمفرده؛ قارن دائماً بين حركة الشموع وأحجام التداول في أسفل الشارت للتأكد من قوة الاتجاه.
💬 احفظ هذا المنشور لديك لترجع إليه أثناء تحليلك القادم! ما هو مؤشرتك المفضل بجانب الفوليوم؟
#EducationalContent #tradingtips #TechnicalAnalysisPost #BinanceSquareBTC
52

🚀 $AVA is breaking out strongly on the 4H chart. Price jumped from the 0.22–0.31 range to 0.4001 (+29%) with high volume. 📈 My plan is a SPOT BUY. I'll accumulate near the current price of ~$0.40, and I prefer adding on a pullback to $0.35–$0.37. 🎯 TP1: $0.45 | TP2: $0.50 | 🛑 SL: $0.33. If demand stays strong and supply stays limited, $AVA could continue higher. However, after such a vertical move a pullback is possible, so I'll scale in and keep my position size small. A clean hold above $0.4226 would strengthen the bullish outlook. Always manage your risk.
#AVA #AVAUSDT #Binance #CryptoTrading #Altcoins #TechnicalAnalysisPost
{spot}(AVAUSDT)
🚀 $AVA is breaking out strongly on the 4H chart. Price jumped from the 0.22–0.31 range to 0.4001 (+29%) with high volume. 📈 My plan is a SPOT BUY. I'll accumulate near the current price of ~$0.40, and I prefer adding on a pullback to $0.35–$0.37. 🎯 TP1: $0.45 | TP2: $0.50 | 🛑 SL: $0.33. If demand stays strong and supply stays limited, $AVA could continue higher. However, after such a vertical move a pullback is possible, so I'll scale in and keep my position size small. A clean hold above $0.4226 would strengthen the bullish outlook. Always manage your risk.
#AVA #AVAUSDT #Binance #CryptoTrading #Altcoins #TechnicalAnalysisPost
#AVA #AVAUSDT #Binance #CryptoTrading #Altcoins #TechnicalAnalysisPost
1
117

*What is Resistance Line? Explained with BTC 82,573 Example*
As marked on my chart, BTC has a strong resistance at 82,573.
*What is Resistance Line?*
A resistance line is a price level where selling pressure is so high that price fails to go above it. Sellers defend this level.
In my chart:
- Current Price: Trading at 81,570.18
- Resistance: At 82,573.06
- As you can see, whenever price went near 82,573, it got rejected and dropped to 80,809.25
*2 Scenarios:*
*1. Breakout Above (Bullish):*
If price closes above 82,573 with increased volume, resistance will break and become new support. This is bullish continuation.
*2. Rejection Below (Bearish):*
If price fails to break 82,573, selling pressure pushes price down. As happened in my chart - drop to 80,809.
*Trading Tip:*
Always confirm breakout with volume and closing price. SAR is at 81,013.67 below price, so bias is bullish for now, but breaking 82,573 is key.
Educational only, NFA.
$BTC #Bitcoin #ResistanceLine #TechnicalAnalysisPost #writetoearn #writetoearn
14

📊 XAUUSDT GOLD — BREAKDOWN OR BOUNCE? 🔥
Gold is currently trading around 4,175 on the 15-minute chart.
🎯 Key Level: 4,170
🔻 Bearish Scenario: If price breaks below 4,170 and the 15-minute candle closes below it, we could see further downside.
🔼 Bullish Scenario: If 4,170 holds as support and price shows a strong bullish rejection, we could see a bounce toward higher levels.
📢 FRIENDS, WHAT'S YOUR ANALYSIS?
Will Gold break below 4,170 or bounce back to the upside? 🤔
👇 COMMENT BELOW: BREAKDOWN 📉 OR BOUNCE 📈?
Let's discuss our analysis together! Always manage your risk and wait for confirmation before entering a trade.
#XAUUSDT #GoldTrading #CryptoTrading. #TechnicalAnalysisPost #BinanceSquare
86

🚨 $ZEC BEARISH ALERT — LONGING HERE IS EXTREMELY RISKY! 📉
Taking a LONG position on $ZEC at this level is like jumping into fire! 🔥
$ZEC previously surged to a high of $1,699, but the price has been gradually declining since then. A further drop toward $500 or even lower is possible if bearish pressure continues.
🔻 The price has repeatedly attempted to recover, but buyers have failed to push the market higher.
📉 Look closely at the candles: The market is following the trendline downward, showing continued bearish momentum.
🎯 My Strategy: 🔴 Watch for SHORT opportunities. 📉 Consider a longer-term SHORT position if the bearish trend continues. ⚠️ Monitor price action and resistance levels before entering.
Bears are still in control! Don't ignore the downtrend. 🐻🔥
#ZECUSDT #CryptoTrading. #ShortSetup #TechnicalAnalysisPost
{future}(ZECUSDT)
🚨 $ZEC BEARISH ALERT — LONGING HERE IS EXTREMELY RISKY! 📉
Taking a LONG position on $ZEC at this level is like jumping into fire! 🔥
$ZEC previously surged to a high of $1,699, but the price has been gradually declining since then. A further drop toward $500 or even lower is possible if bearish pressure continues.
🔻 The price has repeatedly attempted to recover, but buyers have failed to push the market higher.
📉 Look closely at the candles: The market is following the trendline downward, showing continued bearish momentum.
🎯 My Strategy: 🔴 Watch for SHORT opportunities. 📉 Consider a longer-term SHORT position if the bearish trend continues. ⚠️ Monitor price action and resistance levels before entering.
Bears are still in control! Don't ignore the downtrend. 🐻🔥
#ZECUSDT #CryptoTrading. #ShortSetup #TechnicalAnalysisPost
199

·
--
🚨 **BTC/USDT — Key Levels to Watch!** 📊
🎯 **$83,800–$84,000** is the key resistance zone I'm watching.
📈 If Bitcoin closes a 4H candle above this zone, bullish momentum could strengthen, potentially shifting the short-term trend in favor of buyers.
📉 However, if BTC breaks below **$81,500**, we could see a retest of the **$80,400 support zone**.
⚡ **Patience is key. Wait for confirmation before making your next move!**
💬 What's your prediction — Bullish 🟢 or Bearish 🔴?
#bitcoin #BTC #BTCUSDT #cryptotrading #TechnicalAnalysisPost
118

·
--
$CVNA.US
📊 CVNAUSDT – Latest Market Analysis | October 10, 2026
📈 Market Trend: Cautiously bullish, but momentum remains mixed.
🟢 Support: $63.15 – $61.85
🔴 Resistance: $64.49 – $65.74
🚀 Bullish Scenario: A breakout above $64.49 could push the price toward $65.74.
⚠️ Bearish Scenario: A breakdown below $63.15 may increase selling pressure.
💡 Market Insight: Watch volume and price action around key levels before entering a trade.
#CVNAUSDT #stockmarketupdate #TechnicalAnalysisPost #TradingSignals💹💬
Latest reported closing price: $63.73 on October 9, 2026. Technical levels are indicative, not guaranteed. �
stockvs.com +1
{stock_us}(CVNA.US)
$CVNA.US
📊 CVNAUSDT – Latest Market Analysis | October 10, 2026
📈 Market Trend: Cautiously bullish, but momentum remains mixed.
🟢 Support: $63.15 – $61.85
🔴 Resistance: $64.49 – $65.74
🚀 Bullish Scenario: A breakout above $64.49 could push the price toward $65.74.
⚠️ Bearish Scenario: A breakdown below $63.15 may increase selling pressure.
💡 Market Insight: Watch volume and price action around key levels before entering a trade.
#CVNAUSDT #stockmarketupdate #TechnicalAnalysisPost #TradingSignals💹💬
Latest reported closing price: $63.73 on October 9, 2026. Technical levels are indicative, not guaranteed. �
stockvs.com +1
CVNAUS-1,54%
115
⚠️ BITCOIN BERTAHAN DI $82.000! BULLISH REVERSAL ATAU PANTULAN SEMENTARA? 🚀📉
📊 UPDATE MARKET BTC/USDT
Berdasarkan laporan pasar terbaru, BTC diperdagangkan di sekitar $82.634, naik sekitar 1,14% dalam 24 jam, tetapi masih terkoreksi sekitar 2,29% dalam 7 hari.
Volume perdagangan 24 jam tercatat sekitar $24,52 miliar. Meski harga mulai pulih, volume yang cenderung menyusut mengindikasikan bahwa momentum pembeli belum sepenuhnya meyakinkan.
🎯 LEVEL PENTING YANG WAJIB DIPANTAU
Support:
- $82.000–$82.300 — area pertahanan terdekat.
- $81.680–$81.775 — support penting jangka pendek.
- $79.400–$80.500 — zona target jika tekanan jual berlanjut.
Resistance:
- $83.300–$84.200 — hambatan pertama.
- $84.900–$85.000 — resistance kunci pemulihan.
- $87.400–$88.500 — zona breakout lanjutan.
🟢 SKENARIO BULLISH — BUY THE DIP ATAU TUNGGU BREAKOUT?
Jika BTC mempertahankan support $82.000–$82.300 dan membentuk konfirmasi bullish pada timeframe M15 atau H1, peluang rebound masih terbuka.
Rencana trading potensial:
- Entry: $82.100–$82.400 setelah muncul konfirmasi pantulan.
- TP1: $83.300.
- TP2: $84.200.
- TP3: $84.900.
- Invalidation: harga menembus $81.680 dan gagal merebutnya kembali.
SKENARIO BEARISH — WASPADA BREAKDOWN!
Jika BTC gagal bertahan di atas $82.000 dan menembus support $81.680 dengan tekanan jual yang meningkat, pemulihan berpotensi gagal.
Rencana trading potensial:
- Entry short: setelah breakdown terkonfirmasi dan retest $81.680–$82.000 ditolak.
- TP1: $80.500.
- TP2: $79.400.
- Invalidation: harga kembali bertahan di atas $82.300–$82.500 setelah breakdown.
💡 KESIMPULAN
BTC sedang mencoba rebound, tetapi kenaikan harian belum menghapus pelemahan mingguan. Area $81.680–$82.300 menjadi zona krusial untuk memantau kekuatan pembeli.
Jika support bertahan, peluang menuju $84.200 terbuka. Namun, jika support jebol, trader perlu mengantisipasi koreksi menuju $80.500 hingga $79.400.
$BTC
{spot}(BTCUSDT)
#BTCUSDT #BitcoinAnalysis #TechnicalAnalysisPost #CryptoTrading #BinanceSquare
⚠️ BITCOIN BERTAHAN DI $82.000! BULLISH REVERSAL ATAU PANTULAN SEMENTARA? 🚀📉
📊 UPDATE MARKET BTC/USDT
Berdasarkan laporan pasar terbaru, BTC diperdagangkan di sekitar $82.634, naik sekitar 1,14% dalam 24 jam, tetapi masih terkoreksi sekitar 2,29% dalam 7 hari.
Volume perdagangan 24 jam tercatat sekitar $24,52 miliar. Meski harga mulai pulih, volume yang cenderung menyusut mengindikasikan bahwa momentum pembeli belum sepenuhnya meyakinkan.
🎯 LEVEL PENTING YANG WAJIB DIPANTAU
Support:
- $82.000–$82.300 — area pertahanan terdekat.
- $81.680–$81.775 — support penting jangka pendek.
- $79.400–$80.500 — zona target jika tekanan jual berlanjut.
Resistance:
- $83.300–$84.200 — hambatan pertama.
- $84.900–$85.000 — resistance kunci pemulihan.
- $87.400–$88.500 — zona breakout lanjutan.
🟢 SKENARIO BULLISH — BUY THE DIP ATAU TUNGGU BREAKOUT?
Jika BTC mempertahankan support $82.000–$82.300 dan membentuk konfirmasi bullish pada timeframe M15 atau H1, peluang rebound masih terbuka.
Rencana trading potensial:
- Entry: $82.100–$82.400 setelah muncul konfirmasi pantulan.
- TP1: $83.300.
- TP2: $84.200.
- TP3: $84.900.
- Invalidation: harga menembus $81.680 dan gagal merebutnya kembali.
SKENARIO BEARISH — WASPADA BREAKDOWN!
Jika BTC gagal bertahan di atas $82.000 dan menembus support $81.680 dengan tekanan jual yang meningkat, pemulihan berpotensi gagal.
Rencana trading potensial:
- Entry short: setelah breakdown terkonfirmasi dan retest $81.680–$82.000 ditolak.
- TP1: $80.500.
- TP2: $79.400.
- Invalidation: harga kembali bertahan di atas $82.300–$82.500 setelah breakdown.
💡 KESIMPULAN
BTC sedang mencoba rebound, tetapi kenaikan harian belum menghapus pelemahan mingguan. Area $81.680–$82.300 menjadi zona krusial untuk memantau kekuatan pembeli.
Jika support bertahan, peluang menuju $84.200 terbuka. Namun, jika support jebol, trader perlu mengantisipasi koreksi menuju $80.500 hingga $79.400.
$BTC
#BTCUSDT #BitcoinAnalysis #TechnicalAnalysisPost #CryptoTrading #BinanceSquare
115

·
--
Рост
$EURL.ETF $#EURUSD 📊 EURUSD — BULLISH BREAKOUT ANALYSIS
⏱️ Timeframe: 30 Minutes
📈 Market Bias: Bullish
📌 MARKET ANALYSIS
EURUSD is showing signs of a potential bullish continuation after breaking above the descending trendline and recovering from the previous consolidation zone.
Price is currently trading around 1.12139, with the 1.12000 area acting as an important technical zone to monitor for a possible retest.
The recent price action suggests that buyers are attempting to gain control following the previous bearish movement. If the market maintains its position above the breakout area and bullish momentum continues, EURUSD may extend its upward movement toward the next resistance levels.
🔎 KEY MARKET STRUCTURE
🟢 Breakout Zone — 1.12000
This is the key consolidation and breakout area. If price holds above this level, it may act as support and provide a foundation for further bullish movement.
🟢 Potential Trigger Area — 1.12050
A successful retest of this area, followed by bullish rejection and confirmation, could provide a potential buying opportunity.
🔵 Major Demand Zone — 1.11640
This is an important support area where buyers previously entered the market. If price experiences a deeper retracement, this zone should be monitored for a possible reaction.
🎯 TECHNICAL UPSIDE TARGETS
🥇 TP1: 1.12300
🥈 TP2: 1.12600
🥉 TP3: 1.13000
📈 MARKET OUTLOOK
The short-term outlook is leaning bullish as long as EURUSD holds above the key breakout zone at 1.12000. A successful retest of the 1.12050 area could strengthen the bullish scenario and potentially push the price toward 1.12300, 1.12600, and 1.13000.
⚠️ RISK MANAGEMENT
If the price falls back below the breakout zone, bullish momentum may weaken. Traders should wait for confirmation before entering a trade and always use proper risk management.
This analysis is based on the levels shown and is not a guarantee of future price movement.
#EURUSD #TechnicalAnalysisPost #BullishBreakout #TradingSignals
EURLETF-1,78%
93
·
--
$NKE
📊 NKEUSDT MARKET ANALYSIS | OCTOBER 9, 2026
🔹 Asset: Nike (NKE)
💰 Recent Price: Around $34.70
📉 Market Trend: Bearish overall
⚡ Short-Term Outlook: Potential recovery, but confirmation is needed.
🔍 Technical Analysis NKE has shown a small recovery, but the broader trend remains weak. The price is trading below major moving averages, indicating continued selling pressure.
🟢 Support Levels • $33.80 — Immediate support
• $32.00 — Major support zone
🔴 Resistance Levels • $35.15 — First resistance
• $36.60 — Next resistance
📈 Bullish Scenario: A confirmed breakout above $35.15 could open the way toward $36.60.
📉 Bearish Scenario: A breakdown below $33.80 could bring $32.00 into focus.
🎯 Trading Strategy: Watch for a confirmed breakout or breakdown before entering a trade. Manage risk carefully.
⚠️ Disclaimer: This is educational market commentary, not financial advice. NKE is Nike's stock ticker; NKEUSDT may be a platform-specific trading pair.
#NKE #MarketAnalysis" #TechnicalAnalysisPost #TradingCommunity
{future}(NKEUSDT)
$NKE
📊 NKEUSDT MARKET ANALYSIS | OCTOBER 9, 2026
🔹 Asset: Nike (NKE)
💰 Recent Price: Around $34.70
📉 Market Trend: Bearish overall
⚡ Short-Term Outlook: Potential recovery, but confirmation is needed.
🔍 Technical Analysis NKE has shown a small recovery, but the broader trend remains weak. The price is trading below major moving averages, indicating continued selling pressure.
🟢 Support Levels • $33.80 — Immediate support
• $32.00 — Major support zone
🔴 Resistance Levels • $35.15 — First resistance
• $36.60 — Next resistance
📈 Bullish Scenario: A confirmed breakout above $35.15 could open the way toward $36.60.
📉 Bearish Scenario: A breakdown below $33.80 could bring $32.00 into focus.
🎯 Trading Strategy: Watch for a confirmed breakout or breakdown before entering a trade. Manage risk carefully.
⚠️ Disclaimer: This is educational market commentary, not financial advice. NKE is Nike's stock ticker; NKEUSDT may be a platform-specific trading pair.
#NKE #MarketAnalysis" #TechnicalAnalysisPost #TradingCommunity
263

·
--
🔴 Trending Coins
$ETH SUPPORT & RESISTANCE
🟢 Support: $2,500
🔴 Resistance: $2,650
⚠️ Below support → bearish continuation risk increases.
📌 Watch for rejection before entering a short.
$XRP SUPPORT & RESISTANCE
🟢 Support: $1.38
🔴 Resistance: $1.48
⚠️ Break below support → possible further downside.
📌 Confirmation matters more than prediction.
$SOL SUPPORT & RESISTANCE
🟢 Support: $112
🔴 Resistance: $120
⚠️ Rejection near resistance → bearish setup.
📌 Wait for confirmation before selling.
$BTC SUPPORT & RESISTANCE
🟢 Support: $83,000
🔴 Resistance: $86,500
⚠️ Below $83K → bearish pressure could increase.
📌 Above $86.5K → short setup becomes weaker.
Major crypto markets were under pressure on October 7, with BTC, ETH and XRP all falling, so sell setups should be confirmed rather than chased.
#crypto #trading #Trendingcoins #TechnicalAnalysisPost #BTC #ETH #XRP #SOL #Bearish
52

🚨 BITCOIN BREAKOUT WATCH — $BTC
$BITCOIN is holding around the $85K–$86K zone, keeping traders focused on the next major move.
📈 Bullish Scenario:
A clean breakout above the recent resistance, backed by strong volume, could strengthen bullish momentum and open the door toward higher levels.
📉 Risk Scenario:
If BTC loses key support and closes below it, short-term volatility and selling pressure could increase.
🎯 My Take:
Don’t chase the candle.
Watch support + resistance + volume + confirmation.
The next decisive move could set the tone for the broader crypto market. 👀
⚠️ Manage risk. No financial advice.
#Bitcoin #Crypto #BinanceSquareFamily #CryptoTrading #TechnicalAnalysisPost
97

·
--
Рост
📊 $BTC /$USDT Technical Analysis — Oct. 6, 2026
Market bias: Neutral → Bullish above $87K
Bitcoin is currently consolidating below the important $87,000 resistance. Sellers have rejected this area several times, while buyers continue defending the higher-low structure. This creates a potential breakout setup, but confirmation is important before entering a trade. �
CoinDesk
Key levels
🔴 Resistance: $87,000
🟢 Support: $84,500
🟢 Stronger support: $82,600
🎯 Breakout targets: $90,000 → $93,000
⚠️ Bearish confirmation: Daily close below $84,500
Trading idea:
A clean breakout and retest above $87K could strengthen the bullish case toward $90K–$93K. If BTC is rejected again and loses $84.5K, downside toward $82.6K becomes more likely. �
CoinMarketCap +1
Risk management: Don't chase a breakout. Wait for confirmation and always use a stop-loss. This is market analysis, not guaranteed financial advice.
$BTC #Binance #TechnicalAnalysisPost #TradingCommunity #CryptoTrading. #writetoearn
74

🚀 $XAUT en Zona Clave de Soporte (4H): ¿Rebote Inminente?
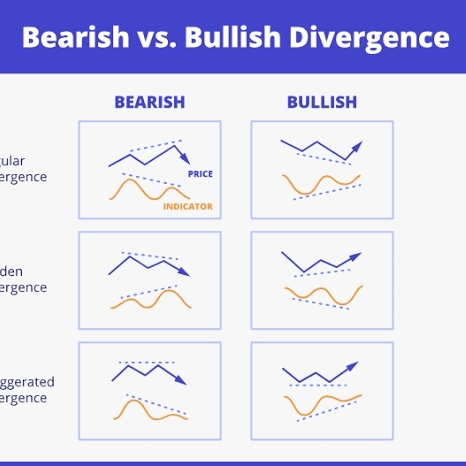
El $ORO se encuentra consolidando una base sobre la zona crítica de soporte defensivo entre $4,100 y $4,130 en temporalidad de 4 horas. El RSI en 4H muestra agotamiento vendedor y divergencia alcista cerca de sobreventa, señalando potencial de reimpulso técnico hacia resistencias superiores.
📊 PARÁMETROS OPERATIVOS
🎯 Par / Activo: $ORO / XAUUSD
📈 Sesgo: Long (Alcista en rebote)
📍 Zona de Entrada (Entry): $4,120 – $4,140
🎯 Objetivos de Ganancia (TP):
TP1: $4,185 (Resistencia inmediata)
🛑 Stop Loss (SL): $4,085 (Invalidación por debajo del nivel defensivo de $4,100)
⚙️ Gestión de Riesgo / Apalancamiento Sugerido: Riesgo máximo 1% – 2% del capital | Apalancamiento recomendado: 10x – 20x (o 1x–3x en margen conservador).
🔍 JUSTIFICACIÓN DE LA ESTRATEGIA
Defensa de Soporte Relevante: El nivel de $4,100 se mantiene como una zona compradora clave donde la demanda ha reaccionado repetidamente.
Acumulación Institucional: Los datos de flujos en ETFs de oro muestran acumulación neta en retrocesos, lo que sugiere compras institucionales en la caída actual.
Estructura Riesgo/Beneficio Favorable: Configuración con un ratio R/R superior a 1:3, permitiendo una invalidación corta si se pierden los $4,100.
Confluencia Técnica: Muestras de divergencia en el oscilador RSI en 4H y velas de absorción en los niveles mínimos locales. Utiliza siempre Stop Loss y gestiona tu capital de forma responsable.
📌 $XAUT #Trading #TechnicalAnalysisPost #GOLD
1
427
Войдите, чтобы посмотреть больше материала
Присоединяйтесь к пользователям криптовалют по всему миру на Binance Square
⚡️ Получайте новейшую и полезную информацию о криптоактивах.
💬 Нам доверяет крупнейшая в мире криптобиржа.
👍 Получите достоверные аналитические данные от верифицированных создателей контента.
Эл. почта/номер телефона
В тренде
1
#BinancekzWin
Просмотров: 32,186
90 обсуждают
2
#BinancePick
Просмотров: 1.2M
90,961 обсуждают
3
#EarningsSeason
Просмотров: 3.9M
18,566 обсуждают
4
#DowDrops653Points
Просмотров: 5,513
148 обсуждают
5
#MarketsPriceJust10%ChanceOfFedHikeNextWeek
Просмотров: 4,036
105 обсуждают
6
#OCCRemovesStablecoinSevenDayRedemptionExtension
Просмотров: 3,144
94 обсуждают
7
#USConsumerSentimentHoldsAtSecondLowestOnRecord
Просмотров: 1,790
53 обсуждают
8
#FranklinTempletonAdds$150MFundSharesToXRPLedger
Просмотров: 2,314
61 обсуждают
9
#IRSPlansLowerTaxDisclosurePenaltiesForCryptoCases
Просмотров: 65,985
683 обсуждают
10
#PepeJumps14%ToLeadAltcoinRebound
Просмотров: 132,618
1,394 обсуждают