

#rsi
rsi
Просмотров: 1.5M
4,554 обсуждают
Популярные
Новые

·
--
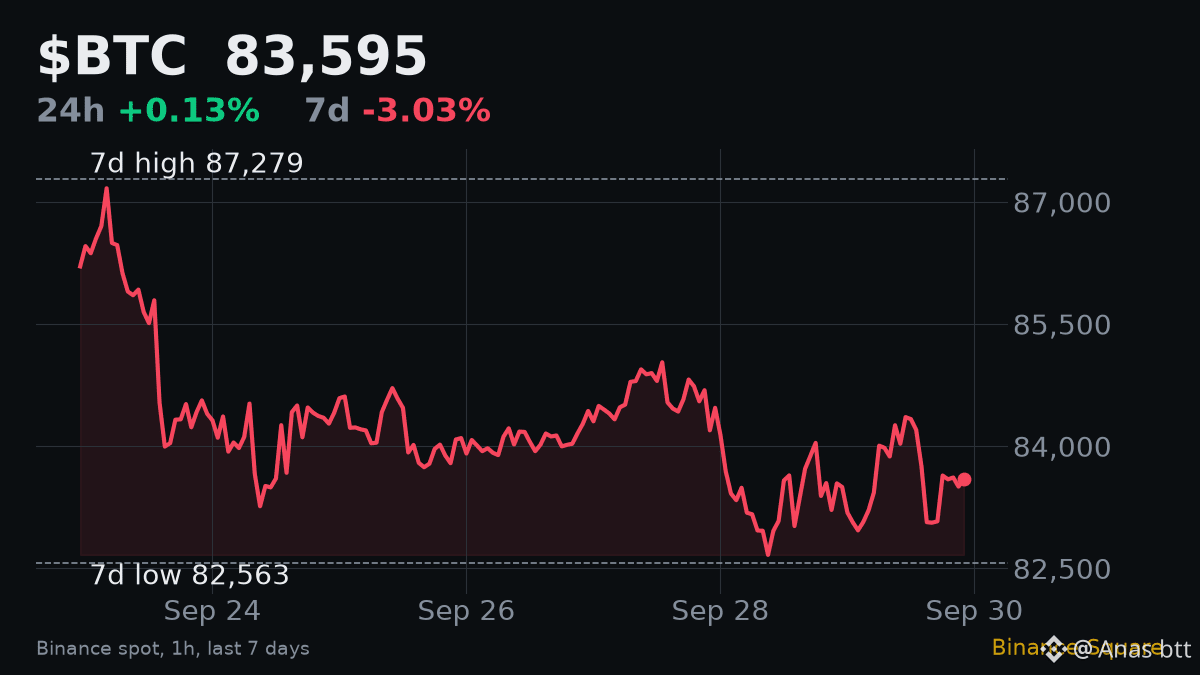
Hourly RSI on $BTC reads 49.7 right now. Most people would call that "nothing". It is actually a useful reading, if you know what RSI can and cannot tell you.
What it is: RSI compares the size of recent up moves with recent down moves and puts the result on a 0 to 100 scale. Above 70 is called overbought, below 30 oversold. Around 50, buyers and sellers are roughly balanced.
Trap 1: treating 70 as a sell signal. In a strong trend RSI can stay above 70 for a long time while price keeps climbing. High RSI means strong momentum, not a top.
Trap 2: ignoring the timeframe. The 49.7 here is on 1-hour candles. It describes roughly the last 14 hours, not the bigger picture.
Trap 3: reading RSI alone. Look at the context. BTC is at 83,595, down 3.0% on the week and 4.2% under its 7-day high of 87,279. After that drop, an hourly RSI near 50 tells me the selling pressure has faded. It does not tell me buyers have taken over. Volume at 0.81 times its weekly average agrees: nobody is pushing hard either way.
Practical takeaway: use RSI to measure how strong a move is, then confirm with price levels and volume before acting. Here, a break of the 87,279 high or the 82,563 low on rising volume would matter far more than any RSI number.
#RSI #TechnicalAnalysis
Hourly RSI on $BTC reads 49.7 right now. Most people would call that "nothing". It is actually a useful reading, if you know what RSI can and cannot tell you.
What it is: RSI compares the size of recent up moves with recent down moves and puts the result on a 0 to 100 scale. Above 70 is called overbought, below 30 oversold. Around 50, buyers and sellers are roughly balanced.
Trap 1: treating 70 as a sell signal. In a strong trend RSI can stay above 70 for a long time while price keeps climbing. High RSI means strong momentum, not a top.
Trap 2: ignoring the timeframe. The 49.7 here is on 1-hour candles. It describes roughly the last 14 hours, not the bigger picture.
Trap 3: reading RSI alone. Look at the context. BTC is at 83,595, down 3.0% on the week and 4.2% under its 7-day high of 87,279. After that drop, an hourly RSI near 50 tells me the selling pressure has faded. It does not tell me buyers have taken over. Volume at 0.81 times its weekly average agrees: nobody is pushing hard either way.
Practical takeaway: use RSI to measure how strong a move is, then confirm with price levels and volume before acting. Here, a break of the 87,279 high or the 82,563 low on rising volume would matter far more than any RSI number.
#RSI #TechnicalAnalysis
What it is: RSI compares the size of recent up moves with recent down moves and puts the result on a 0 to 100 scale. Above 70 is called overbought, below 30 oversold. Around 50, buyers and sellers are roughly balanced.
Trap 1: treating 70 as a sell signal. In a strong trend RSI can stay above 70 for a long time while price keeps climbing. High RSI means strong momentum, not a top.
Trap 2: ignoring the timeframe. The 49.7 here is on 1-hour candles. It describes roughly the last 14 hours, not the bigger picture.
Trap 3: reading RSI alone. Look at the context. BTC is at 83,595, down 3.0% on the week and 4.2% under its 7-day high of 87,279. After that drop, an hourly RSI near 50 tells me the selling pressure has faded. It does not tell me buyers have taken over. Volume at 0.81 times its weekly average agrees: nobody is pushing hard either way.
Practical takeaway: use RSI to measure how strong a move is, then confirm with price levels and volume before acting. Here, a break of the 87,279 high or the 82,563 low on rising volume would matter far more than any RSI number.
#RSI #TechnicalAnalysis
1
61
·
--
Статья
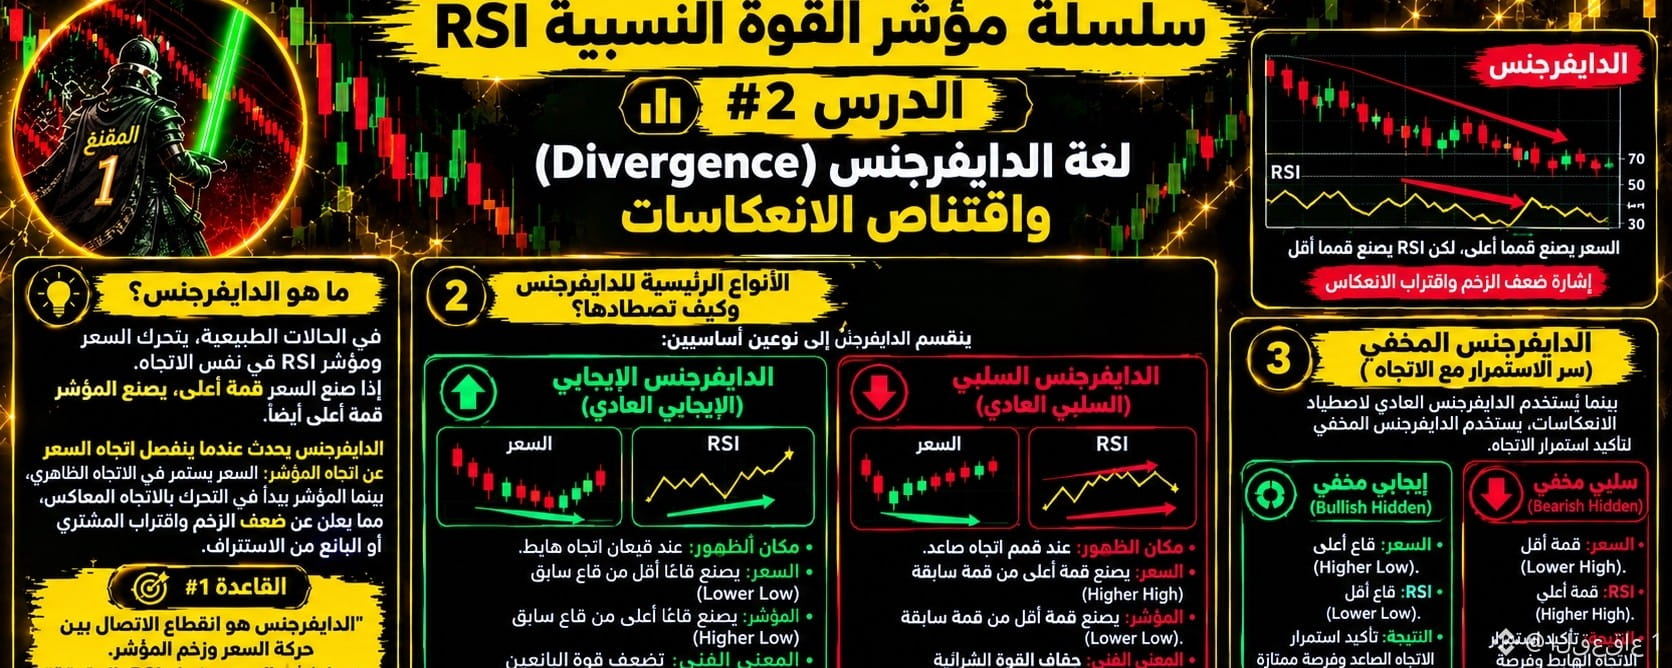
📌 سلسلة مؤشر القوة النسبية (RSI) | الدرس #2: لغة الدايفرجنس (Divergence) واقتناص الانعكاساتمرحباً بكم مجدداً زملائي المتداولين! بعد أن فهمنا في الدرس الأول الرياضيات والفلسفة خلف مؤشر RSI، ننتقل اليوم إلى واحدة من أقوى أدوات التداول الاحترافية: الدايفرجنس (الاختلاف/التباعد).
إذا كان السعر يعكس ما يحدث ظاهرياً، فإن الدايفرجنس يتيح لك رؤية ما يدور تحت السطح وقراءة نوايا صانع السوق قبل الانفجار السعري.
---
🎯 القاعدة #1: "الدايفرجنس هو انقطاع الاتصال بين حركة السعر وزخم المؤشر.. عندما يكذب السعر، يخبرك RSI بالحقيقة"
---
💡 1️⃣ ما هو الدايفرجنس (Divergence)؟
في الحالات الطبيعية، يتحرك السعر ومؤشر RSI في نفس الاتجاه؛ إذا صنع السعر قمة أعلى، يصنع المؤشر قمة أعلى أيضاً.
الدايفرجنس يحدث عندما ينفصل اتجاه السعر عن اتجاه المؤشر:
السعر يستمر في الاتجاه الظاهري، بينما المؤشر يبدأ في التحرك بالاتجاه المعاكس، مما يعلن عن ضعف الزخم واقتراب المشتري أو البائع من الاستنزاف.
---
🧬 2️⃣ الأنواع الرئيسية للدايفرجنس وكيف تصطادها؟
ينقسم الدايفرجنس إلى نوعين أساسيين:
### 🔵 1. الدايفرجنس الإيجابي/الإيجابي العادي (Bullish Divergence)
* مكان الظهور: عند قيعان اتجاه هابط.
* السلوك على الشارت:
- السعر: يصنع قاعاً أقل من قاع سابق (**Lower Low**).
- مؤشر RSI: يصنع قاعاً أعلى من قاع سابق (**Higher Low**).
* المعنى الفني: رغم أن السعر ينزل لأرقام أقل، إلا أن قوة الضغط البيعي تتضاءل؛ البائعون يستنزفون طاقتهم والمشترون يستعدون لاستلام زمام الأمور 🟢.
### 🔴 2. الدايفرجنس السلبي/السلبي العادي (Bearish Divergence)
* مكان الظهور: عند قمم اتجاه صاعد.
* السلوك على الشارت:
- السعر: يصنع قمة أعلى من قمة سابقة (**Higher High**).
- مؤشر RSI: يصنع قمة أقل من قمة سابقة (**Lower High**).
* المعنى الفني: السعر يحقق أرقاماً قياسية جديدة ولكن بنبض ضعيف؛ القوة الشرائية تجف ووصول الانهيار أو التصحيح الحاد أصبحت مسألة وقت 🔴.
---
🔍 3️⃣ الدايفرجنس المخفي (Hidden Divergence): سر الاستمرار مع الاتجاه
بينما يُستخدم الدايفرجنس العادي لاصطياد الانعكاسات، يُستخدم الدايفرجنس المخفي لتأكيد استمرار الاتجاه:
• الدايفرجنس الإيجابي المخفي (Bullish Hidden):
- السعر: يصنع قاعاً أعلى (**Higher Low**).
- RSI: يصنع قاعاً أقل (**Lower Low**).
- النتيجة: تأكيد استمرار الاتجاه الصاعد وفرصة ممتازة لإعادة الشراء مع التصحيح.
• الدايفرجنس السلبي المخفي (Bearish Hidden):
- السعر: يصنع قمة أقل (**Lower High**).
- RSI: يصنع قمة أعلى (**Higher High**).
- النتيجة: تأكيد استمرار الاتجاه الهابط وفرصة لإعادة البيع/الخروج.
---
⚠️️ أخطاء قاتلة تجنبها عند تداول الدايفرجنس:
1. الدخول الفوري بدون تأكيد: الدايفرجنس إشارة تحذيرية وليست أمر تنفيذ؛ لا تدخل حتى ترى نموذج سعر مؤكد (Price Action) مثل شمعة ابتلاعية أو كسر لخط اتجاه.
2. التداول ضد اتجاه قوي جداً: في الاتجاهات الصريحة (Strong Trends)، قد يستمر الدايفرجنس بالظهور لعدة شمعات متتالية قبل أن ينعكس السعر فعلياً.
---
⚖️ خلاصة الدرس الثاني:
"الدايفرجنس هو الأشعة السينية (X-Ray) للشارت؛ يمنحك الرؤية النافذة لمعرفة ما إذا كان الارتفاع حقيقياً أم مجرد فخ قبل الهبوط."
---
💬 شاركونا في التعليقات:
أيهما أسهل بالنسبة لك في الاكتشاف على الشارت: الدايفرجنس العادي أم الدايفرجنس المخفي؟
#cryptotrading #RSI #TechnicalAnalysis #Divergence #القعقاع_1
$ETH
{spot}(ETHUSDT)
$BTC
{spot}(BTCUSDT)
$BIO
{spot}(BIOUSDT)
📌 سلسلة مؤشر القوة النسبية (RSI) | الدرس #2: لغة الدايفرجنس (Divergence) واقتناص الانعكاسات
مرحباً بكم مجدداً زملائي المتداولين! بعد أن فهمنا في الدرس الأول الرياضيات والفلسفة خلف مؤشر RSI، ننتقل اليوم إلى واحدة من أقوى أدوات التداول الاحترافية: الدايفرجنس (الاختلاف/التباعد).
إذا كان السعر يعكس ما يحدث ظاهرياً، فإن الدايفرجنس يتيح لك رؤية ما يدور تحت السطح وقراءة نوايا صانع السوق قبل الانفجار السعري.
---
🎯 القاعدة #1: "الدايفرجنس هو انقطاع الاتصال بين حركة السعر وزخم المؤشر.. عندما يكذب السعر، يخبرك RSI بالحقيقة"
---
💡 1️⃣ ما هو الدايفرجنس (Divergence)؟
في الحالات الطبيعية، يتحرك السعر ومؤشر RSI في نفس الاتجاه؛ إذا صنع السعر قمة أعلى، يصنع المؤشر قمة أعلى أيضاً.
الدايفرجنس يحدث عندما ينفصل اتجاه السعر عن اتجاه المؤشر:
السعر يستمر في الاتجاه الظاهري، بينما المؤشر يبدأ في التحرك بالاتجاه المعاكس، مما يعلن عن ضعف الزخم واقتراب المشتري أو البائع من الاستنزاف.
---
🧬 2️⃣ الأنواع الرئيسية للدايفرجنس وكيف تصطادها؟
ينقسم الدايفرجنس إلى نوعين أساسيين:
### 🔵 1. الدايفرجنس الإيجابي/الإيجابي العادي (Bullish Divergence)
* مكان الظهور: عند قيعان اتجاه هابط.
* السلوك على الشارت:
- السعر: يصنع قاعاً أقل من قاع سابق (**Lower Low**).
- مؤشر RSI: يصنع قاعاً أعلى من قاع سابق (**Higher Low**).
* المعنى الفني: رغم أن السعر ينزل لأرقام أقل، إلا أن قوة الضغط البيعي تتضاءل؛ البائعون يستنزفون طاقتهم والمشترون يستعدون لاستلام زمام الأمور 🟢.
### 🔴 2. الدايفرجنس السلبي/السلبي العادي (Bearish Divergence)
* مكان الظهور: عند قمم اتجاه صاعد.
* السلوك على الشارت:
- السعر: يصنع قمة أعلى من قمة سابقة (**Higher High**).
- مؤشر RSI: يصنع قمة أقل من قمة سابقة (**Lower High**).
* المعنى الفني: السعر يحقق أرقاماً قياسية جديدة ولكن بنبض ضعيف؛ القوة الشرائية تجف ووصول الانهيار أو التصحيح الحاد أصبحت مسألة وقت 🔴.
---
🔍 3️⃣ الدايفرجنس المخفي (Hidden Divergence): سر الاستمرار مع الاتجاه
بينما يُستخدم الدايفرجنس العادي لاصطياد الانعكاسات، يُستخدم الدايفرجنس المخفي لتأكيد استمرار الاتجاه:
• الدايفرجنس الإيجابي المخفي (Bullish Hidden):
- السعر: يصنع قاعاً أعلى (**Higher Low**).
- RSI: يصنع قاعاً أقل (**Lower Low**).
- النتيجة: تأكيد استمرار الاتجاه الصاعد وفرصة ممتازة لإعادة الشراء مع التصحيح.
• الدايفرجنس السلبي المخفي (Bearish Hidden):
- السعر: يصنع قمة أقل (**Lower High**).
- RSI: يصنع قمة أعلى (**Higher High**).
- النتيجة: تأكيد استمرار الاتجاه الهابط وفرصة لإعادة البيع/الخروج.
---
⚠️️ أخطاء قاتلة تجنبها عند تداول الدايفرجنس:
1. الدخول الفوري بدون تأكيد: الدايفرجنس إشارة تحذيرية وليست أمر تنفيذ؛ لا تدخل حتى ترى نموذج سعر مؤكد (Price Action) مثل شمعة ابتلاعية أو كسر لخط اتجاه.
2. التداول ضد اتجاه قوي جداً: في الاتجاهات الصريحة (Strong Trends)، قد يستمر الدايفرجنس بالظهور لعدة شمعات متتالية قبل أن ينعكس السعر فعلياً.
---
⚖️ خلاصة الدرس الثاني:
"الدايفرجنس هو الأشعة السينية (X-Ray) للشارت؛ يمنحك الرؤية النافذة لمعرفة ما إذا كان الارتفاع حقيقياً أم مجرد فخ قبل الهبوط."
---
💬 شاركونا في التعليقات:
أيهما أسهل بالنسبة لك في الاكتشاف على الشارت: الدايفرجنس العادي أم الدايفرجنس المخفي؟
#cryptotrading #RSI #TechnicalAnalysis #Divergence #القعقاع_1
$ETH
$BTC
$BIO
إذا كان السعر يعكس ما يحدث ظاهرياً، فإن الدايفرجنس يتيح لك رؤية ما يدور تحت السطح وقراءة نوايا صانع السوق قبل الانفجار السعري.
---
🎯 القاعدة #1: "الدايفرجنس هو انقطاع الاتصال بين حركة السعر وزخم المؤشر.. عندما يكذب السعر، يخبرك RSI بالحقيقة"
---
💡 1️⃣ ما هو الدايفرجنس (Divergence)؟
في الحالات الطبيعية، يتحرك السعر ومؤشر RSI في نفس الاتجاه؛ إذا صنع السعر قمة أعلى، يصنع المؤشر قمة أعلى أيضاً.
الدايفرجنس يحدث عندما ينفصل اتجاه السعر عن اتجاه المؤشر:
السعر يستمر في الاتجاه الظاهري، بينما المؤشر يبدأ في التحرك بالاتجاه المعاكس، مما يعلن عن ضعف الزخم واقتراب المشتري أو البائع من الاستنزاف.
---
🧬 2️⃣ الأنواع الرئيسية للدايفرجنس وكيف تصطادها؟
ينقسم الدايفرجنس إلى نوعين أساسيين:
### 🔵 1. الدايفرجنس الإيجابي/الإيجابي العادي (Bullish Divergence)
* مكان الظهور: عند قيعان اتجاه هابط.
* السلوك على الشارت:
- السعر: يصنع قاعاً أقل من قاع سابق (**Lower Low**).
- مؤشر RSI: يصنع قاعاً أعلى من قاع سابق (**Higher Low**).
* المعنى الفني: رغم أن السعر ينزل لأرقام أقل، إلا أن قوة الضغط البيعي تتضاءل؛ البائعون يستنزفون طاقتهم والمشترون يستعدون لاستلام زمام الأمور 🟢.
### 🔴 2. الدايفرجنس السلبي/السلبي العادي (Bearish Divergence)
* مكان الظهور: عند قمم اتجاه صاعد.
* السلوك على الشارت:
- السعر: يصنع قمة أعلى من قمة سابقة (**Higher High**).
- مؤشر RSI: يصنع قمة أقل من قمة سابقة (**Lower High**).
* المعنى الفني: السعر يحقق أرقاماً قياسية جديدة ولكن بنبض ضعيف؛ القوة الشرائية تجف ووصول الانهيار أو التصحيح الحاد أصبحت مسألة وقت 🔴.
---
🔍 3️⃣ الدايفرجنس المخفي (Hidden Divergence): سر الاستمرار مع الاتجاه
بينما يُستخدم الدايفرجنس العادي لاصطياد الانعكاسات، يُستخدم الدايفرجنس المخفي لتأكيد استمرار الاتجاه:
• الدايفرجنس الإيجابي المخفي (Bullish Hidden):
- السعر: يصنع قاعاً أعلى (**Higher Low**).
- RSI: يصنع قاعاً أقل (**Lower Low**).
- النتيجة: تأكيد استمرار الاتجاه الصاعد وفرصة ممتازة لإعادة الشراء مع التصحيح.
• الدايفرجنس السلبي المخفي (Bearish Hidden):
- السعر: يصنع قمة أقل (**Lower High**).
- RSI: يصنع قمة أعلى (**Higher High**).
- النتيجة: تأكيد استمرار الاتجاه الهابط وفرصة لإعادة البيع/الخروج.
---
⚠️️ أخطاء قاتلة تجنبها عند تداول الدايفرجنس:
1. الدخول الفوري بدون تأكيد: الدايفرجنس إشارة تحذيرية وليست أمر تنفيذ؛ لا تدخل حتى ترى نموذج سعر مؤكد (Price Action) مثل شمعة ابتلاعية أو كسر لخط اتجاه.
2. التداول ضد اتجاه قوي جداً: في الاتجاهات الصريحة (Strong Trends)، قد يستمر الدايفرجنس بالظهور لعدة شمعات متتالية قبل أن ينعكس السعر فعلياً.
---
⚖️ خلاصة الدرس الثاني:
"الدايفرجنس هو الأشعة السينية (X-Ray) للشارت؛ يمنحك الرؤية النافذة لمعرفة ما إذا كان الارتفاع حقيقياً أم مجرد فخ قبل الهبوط."
---
💬 شاركونا في التعليقات:
أيهما أسهل بالنسبة لك في الاكتشاف على الشارت: الدايفرجنس العادي أم الدايفرجنس المخفي؟
#cryptotrading #RSI #TechnicalAnalysis #Divergence #القعقاع_1
$ETH
$BTC
$BIO
1
179
·
--
Статья
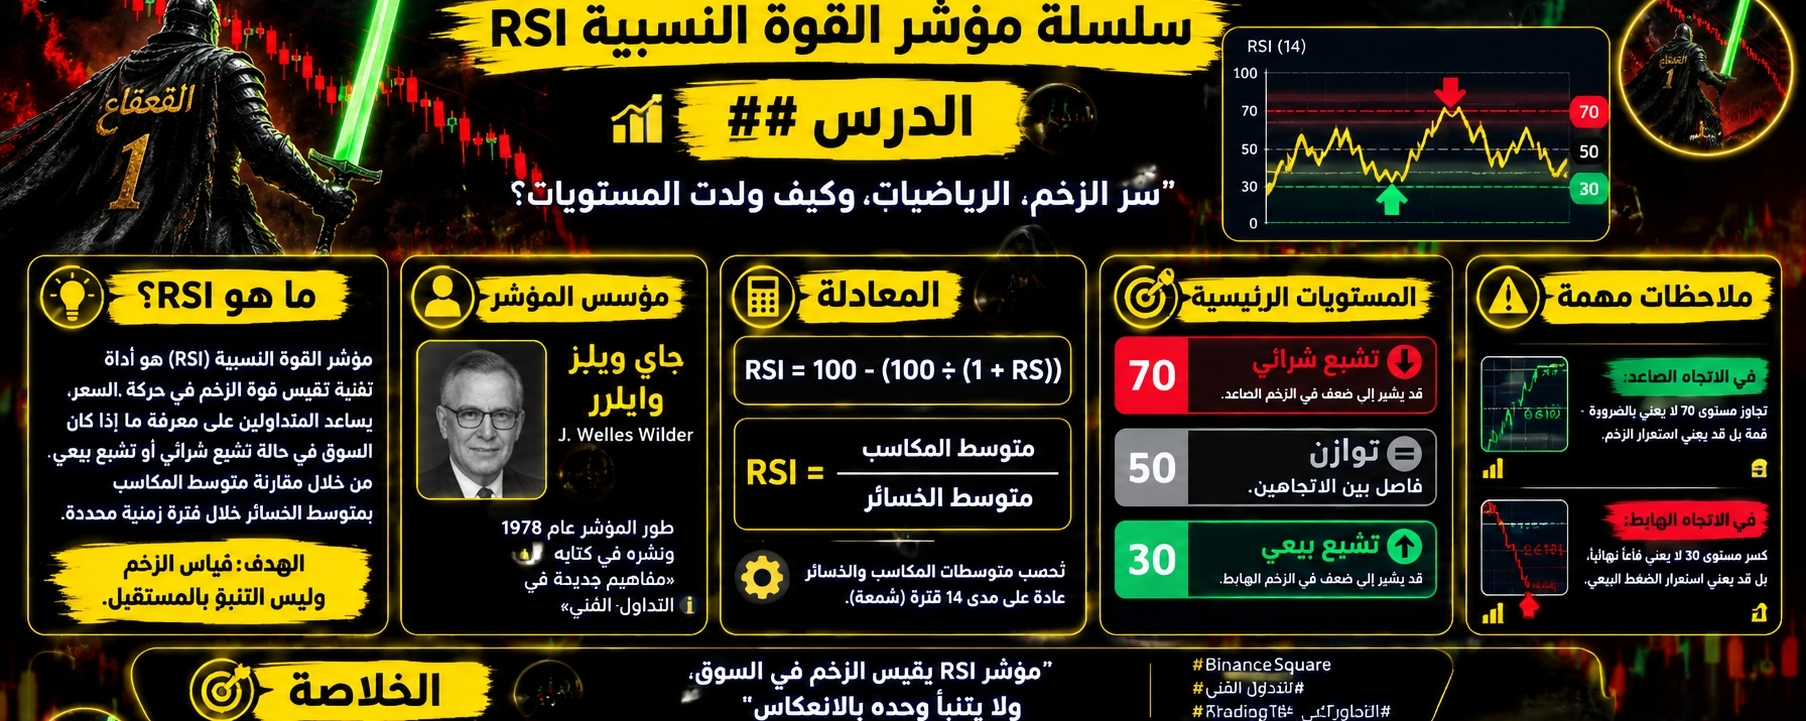
📌 سلسلة مؤشر القوة النسبية (RSI) | الدرس #1: سر الزخم، الرياضيات، وكيف ولدت المستويات؟مرحباً بكم زملائي المتداولين! أهلاً بكم في أولى محطات سلسلتنا الجديدة. لتتداول بمؤشر القوة النسبية (RSI) كالمحترفين، لا يكفي أن تضعه على الشارت وتنتظر تقاطعاته، بل يجب أن تفهم من أين جاءت هذه الأرقام، وما السحر الرياضي والقانون السلوكي الذي يكمن خلفها.
---
🎯 القاعدة #1: "مؤشر RSI ليس مجرد خط يتحرك أعلى وأسفل الشارت.. بل هو ميزان للزخم يترجم تسارع الأسعار ونفسية المتداولين إلى قيم رقمية دقيقة"
---
💡 1️⃣ من هو مؤسس المؤشر؟ وما الفلسفة خلفه؟
يعود أصل المؤشر إلى مهندس الصواريخ والمحلل المالي الأسطوري جاي ويلز وايلدر (J. Welles Wilder)، والذي قدمه للعالم عام 1978 في كتابه الشهير (New Concepts in Technical Trading Systems).
لاحظ وايلدر أن حركة السعر وحدها لا تعكس الصورة كاملة؛ فقد يصعد السعر للأعلى لكن بنبض ضعيف يُخفي خلفه انهياراً وشيكاً، أو يهبط لكن بقوة تتلاشى تدريجياً تمهيداً للانفجار. ومن هنا ولدت فكرة قياس الزخم (Momentum) أو "سرعة وقوة تغير السعر".
---
🧬 2️⃣ كيف صُنعت مستويات RSI؟ (السر الرياضي المحوري)
المعادلة التي تحرك هذا المؤشر تهدف إلى تحويل صراع المشترين والبائعين إلى مقياس محصور بين 0 و 100. هنا يكمن السر الرياضي:
• خطوة 1: حساب القوة النسبية (RS):
يتم حساب متوسط إغلاقات أيام الصعود (المكاسب) وقسمتها على متوسط إغلاقات أيام الهبوط (الخسائر) خلال فترة زمنية معينة (الإعداد الافتراضي هو 14 شمعة):
RS = متوسط المكاسب خلال 14 شمعة ÷ متوسط الخسائر خلال 14 شمعة
• خطوة 2: المعايرة والنطاق (المعادلة النهائية):
لجعل المؤشر محصوراً دائماً بين 0 و 100 بدلاً من أرقام مفتوحة، تُطبق الصيغة التالية:
RSI = 100 - (100 ÷ (1 + RS))
• ماذا تعني المستويات (70 / 30 / 50)؟
- مستوى 70 (Overbought): يعني أن متوسط المكاسب تجاوز متوسط الخسائر بفارق شاسع جداً؛ السوق في حالة "تشبع شرائي" قد تتطلب جني أرباح.
- مستوى 30 (Oversold): يعني أن الضغط البيعي وصل إلى أقصاه؛ السوق في حالة "تشبع بيعي" قد يعقبها ارتداد إيجابي.
- مستوى 50 (Midline): يمثل نقطة التعادل والتوازن المطلق بين القوة الشرائية والقوة البيعية (RS = 1).
---
🔍 3️⃣ ماذا تعني هذه الأرقام في التداول وعلى الشارت؟
في التداول، يعبر مؤشر RSI عن طاقة الحركة.
السوق يمر بدورات شهيق وزفير؛ الصعود المستمر يستهلك طاقة المشترين، والهبوط الحاد يستنزف كميات البائعين:
• تجاوز مستوى 70: لا يعني "بع فوراً"، بل يعني أن المحرك يعمل بأقصى طاقته ويحتاج إلى فترة استراحة (تصحيح أو تجميع جانبي).
• كسر مستوى 50 لأعلى: إشارة إلى أن كفة المشترين بدأت ترجح وتتحول السيطرة لهم على الإطار الزمني المحدّد.
---
⚖️ خلاصة الدرس الأول:
"مستويات RSI ليست أرقاماً عشوائية؛ بل هي ترميز رياضي لقوة الدفع والتسارع داخل الشارت، تفصل بين صانع السوق الذي يستغل الزخم والمتداول الهاوي الذي يركض خلفه."
---
💬 شاركونا في التعليقات:
هل كنت تعتمد على خط 70 و 30 كإشارات دخول وخروج مباشرة، أم كنت تنتظر دمجها مع السلوك السعري (Price Action)؟
#SpotTrading #RSI
#TechnicalAnalysi #القعقاع #القعقاع_1
$XLM
{spot}(XLMUSDT)
$BTC
{spot}(BTCUSDT)
$ETH
{spot}(ETHUSDT)
📌 سلسلة مؤشر القوة النسبية (RSI) | الدرس #1: سر الزخم، الرياضيات، وكيف ولدت المستويات؟
مرحباً بكم زملائي المتداولين! أهلاً بكم في أولى محطات سلسلتنا الجديدة. لتتداول بمؤشر القوة النسبية (RSI) كالمحترفين، لا يكفي أن تضعه على الشارت وتنتظر تقاطعاته، بل يجب أن تفهم من أين جاءت هذه الأرقام، وما السحر الرياضي والقانون السلوكي الذي يكمن خلفها.
---
🎯 القاعدة #1: "مؤشر RSI ليس مجرد خط يتحرك أعلى وأسفل الشارت.. بل هو ميزان للزخم يترجم تسارع الأسعار ونفسية المتداولين إلى قيم رقمية دقيقة"
---
💡 1️⃣ من هو مؤسس المؤشر؟ وما الفلسفة خلفه؟
يعود أصل المؤشر إلى مهندس الصواريخ والمحلل المالي الأسطوري جاي ويلز وايلدر (J. Welles Wilder)، والذي قدمه للعالم عام 1978 في كتابه الشهير (New Concepts in Technical Trading Systems).
لاحظ وايلدر أن حركة السعر وحدها لا تعكس الصورة كاملة؛ فقد يصعد السعر للأعلى لكن بنبض ضعيف يُخفي خلفه انهياراً وشيكاً، أو يهبط لكن بقوة تتلاشى تدريجياً تمهيداً للانفجار. ومن هنا ولدت فكرة قياس الزخم (Momentum) أو "سرعة وقوة تغير السعر".
---
🧬 2️⃣ كيف صُنعت مستويات RSI؟ (السر الرياضي المحوري)
المعادلة التي تحرك هذا المؤشر تهدف إلى تحويل صراع المشترين والبائعين إلى مقياس محصور بين 0 و 100. هنا يكمن السر الرياضي:
• خطوة 1: حساب القوة النسبية (RS):
يتم حساب متوسط إغلاقات أيام الصعود (المكاسب) وقسمتها على متوسط إغلاقات أيام الهبوط (الخسائر) خلال فترة زمنية معينة (الإعداد الافتراضي هو 14 شمعة):
RS = متوسط المكاسب خلال 14 شمعة ÷ متوسط الخسائر خلال 14 شمعة
• خطوة 2: المعايرة والنطاق (المعادلة النهائية):
لجعل المؤشر محصوراً دائماً بين 0 و 100 بدلاً من أرقام مفتوحة، تُطبق الصيغة التالية:
RSI = 100 - (100 ÷ (1 + RS))
• ماذا تعني المستويات (70 / 30 / 50)؟
- مستوى 70 (Overbought): يعني أن متوسط المكاسب تجاوز متوسط الخسائر بفارق شاسع جداً؛ السوق في حالة "تشبع شرائي" قد تتطلب جني أرباح.
- مستوى 30 (Oversold): يعني أن الضغط البيعي وصل إلى أقصاه؛ السوق في حالة "تشبع بيعي" قد يعقبها ارتداد إيجابي.
- مستوى 50 (Midline): يمثل نقطة التعادل والتوازن المطلق بين القوة الشرائية والقوة البيعية (RS = 1).
---
🔍 3️⃣ ماذا تعني هذه الأرقام في التداول وعلى الشارت؟
في التداول، يعبر مؤشر RSI عن طاقة الحركة.
السوق يمر بدورات شهيق وزفير؛ الصعود المستمر يستهلك طاقة المشترين، والهبوط الحاد يستنزف كميات البائعين:
• تجاوز مستوى 70: لا يعني "بع فوراً"، بل يعني أن المحرك يعمل بأقصى طاقته ويحتاج إلى فترة استراحة (تصحيح أو تجميع جانبي).
• كسر مستوى 50 لأعلى: إشارة إلى أن كفة المشترين بدأت ترجح وتتحول السيطرة لهم على الإطار الزمني المحدّد.
---
⚖️ خلاصة الدرس الأول:
"مستويات RSI ليست أرقاماً عشوائية؛ بل هي ترميز رياضي لقوة الدفع والتسارع داخل الشارت، تفصل بين صانع السوق الذي يستغل الزخم والمتداول الهاوي الذي يركض خلفه."
---
💬 شاركونا في التعليقات:
هل كنت تعتمد على خط 70 و 30 كإشارات دخول وخروج مباشرة، أم كنت تنتظر دمجها مع السلوك السعري (Price Action)؟
#SpotTrading #RSI
#TechnicalAnalysi #القعقاع #القعقاع_1
$XLM
$BTC
$ETH
---
🎯 القاعدة #1: "مؤشر RSI ليس مجرد خط يتحرك أعلى وأسفل الشارت.. بل هو ميزان للزخم يترجم تسارع الأسعار ونفسية المتداولين إلى قيم رقمية دقيقة"
---
💡 1️⃣ من هو مؤسس المؤشر؟ وما الفلسفة خلفه؟
يعود أصل المؤشر إلى مهندس الصواريخ والمحلل المالي الأسطوري جاي ويلز وايلدر (J. Welles Wilder)، والذي قدمه للعالم عام 1978 في كتابه الشهير (New Concepts in Technical Trading Systems).
لاحظ وايلدر أن حركة السعر وحدها لا تعكس الصورة كاملة؛ فقد يصعد السعر للأعلى لكن بنبض ضعيف يُخفي خلفه انهياراً وشيكاً، أو يهبط لكن بقوة تتلاشى تدريجياً تمهيداً للانفجار. ومن هنا ولدت فكرة قياس الزخم (Momentum) أو "سرعة وقوة تغير السعر".
---
🧬 2️⃣ كيف صُنعت مستويات RSI؟ (السر الرياضي المحوري)
المعادلة التي تحرك هذا المؤشر تهدف إلى تحويل صراع المشترين والبائعين إلى مقياس محصور بين 0 و 100. هنا يكمن السر الرياضي:
• خطوة 1: حساب القوة النسبية (RS):
يتم حساب متوسط إغلاقات أيام الصعود (المكاسب) وقسمتها على متوسط إغلاقات أيام الهبوط (الخسائر) خلال فترة زمنية معينة (الإعداد الافتراضي هو 14 شمعة):
RS = متوسط المكاسب خلال 14 شمعة ÷ متوسط الخسائر خلال 14 شمعة
• خطوة 2: المعايرة والنطاق (المعادلة النهائية):
لجعل المؤشر محصوراً دائماً بين 0 و 100 بدلاً من أرقام مفتوحة، تُطبق الصيغة التالية:
RSI = 100 - (100 ÷ (1 + RS))
• ماذا تعني المستويات (70 / 30 / 50)؟
- مستوى 70 (Overbought): يعني أن متوسط المكاسب تجاوز متوسط الخسائر بفارق شاسع جداً؛ السوق في حالة "تشبع شرائي" قد تتطلب جني أرباح.
- مستوى 30 (Oversold): يعني أن الضغط البيعي وصل إلى أقصاه؛ السوق في حالة "تشبع بيعي" قد يعقبها ارتداد إيجابي.
- مستوى 50 (Midline): يمثل نقطة التعادل والتوازن المطلق بين القوة الشرائية والقوة البيعية (RS = 1).
---
🔍 3️⃣ ماذا تعني هذه الأرقام في التداول وعلى الشارت؟
في التداول، يعبر مؤشر RSI عن طاقة الحركة.
السوق يمر بدورات شهيق وزفير؛ الصعود المستمر يستهلك طاقة المشترين، والهبوط الحاد يستنزف كميات البائعين:
• تجاوز مستوى 70: لا يعني "بع فوراً"، بل يعني أن المحرك يعمل بأقصى طاقته ويحتاج إلى فترة استراحة (تصحيح أو تجميع جانبي).
• كسر مستوى 50 لأعلى: إشارة إلى أن كفة المشترين بدأت ترجح وتتحول السيطرة لهم على الإطار الزمني المحدّد.
---
⚖️ خلاصة الدرس الأول:
"مستويات RSI ليست أرقاماً عشوائية؛ بل هي ترميز رياضي لقوة الدفع والتسارع داخل الشارت، تفصل بين صانع السوق الذي يستغل الزخم والمتداول الهاوي الذي يركض خلفه."
---
💬 شاركونا في التعليقات:
هل كنت تعتمد على خط 70 و 30 كإشارات دخول وخروج مباشرة، أم كنت تنتظر دمجها مع السلوك السعري (Price Action)؟
#SpotTrading #RSI
#TechnicalAnalysi #القعقاع #القعقاع_1
$XLM
$BTC
$ETH
2
304

·
--
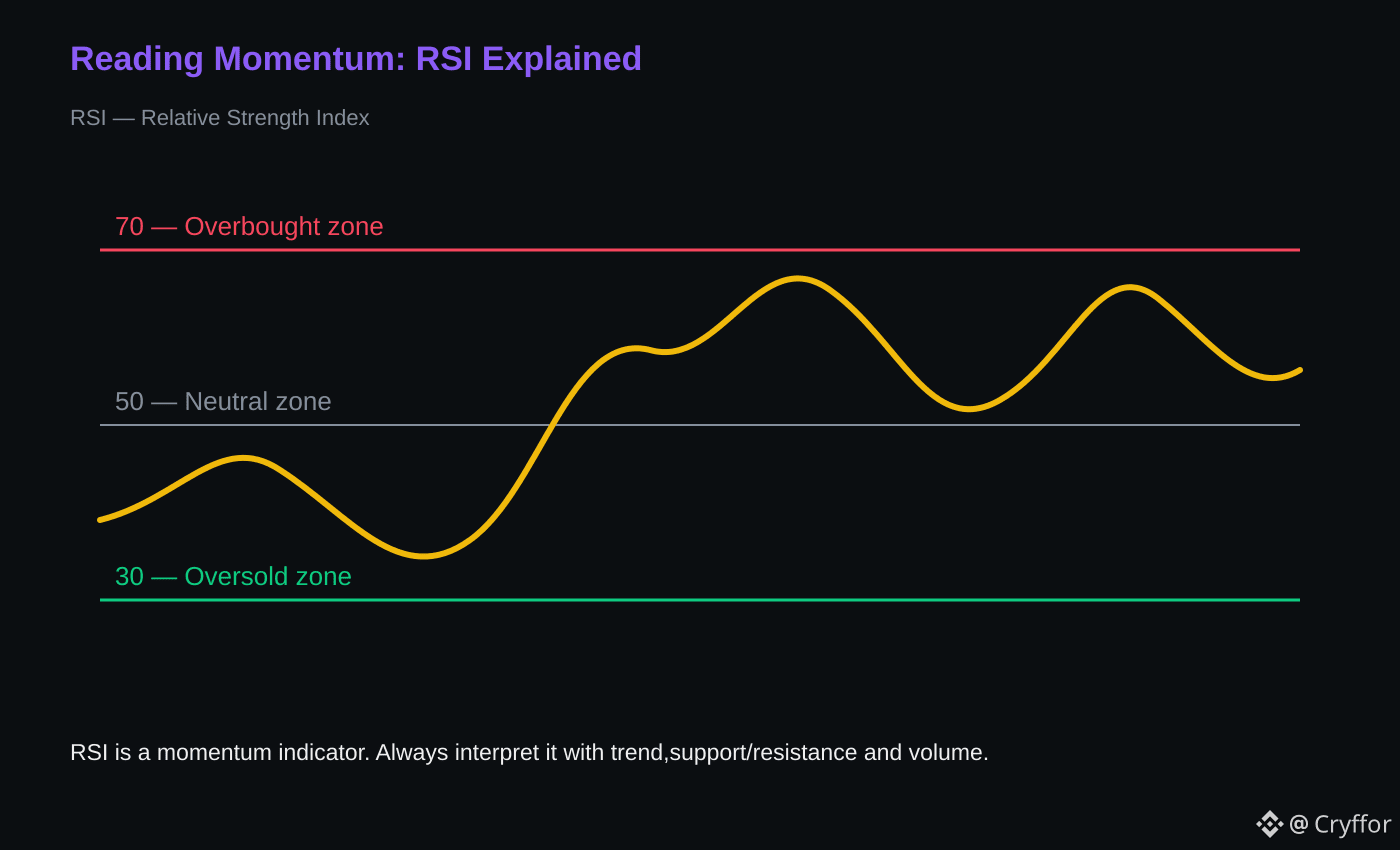
📚 Crypto Education — RSI
⚡ RSI measures momentum.
🟢 Above 70: strong momentum / potentially overextended
🟡 Around 50: balanced momentum
🔴 Below 30: weak momentum / potentially oversold
📊 RSI should not be used alone.
🔎 Price structure, volume and trend can provide confirmation.
👀 Context matters.
🤔 Do you combine RSI with another indicator?
#CryptoEducation #Binance #RSI #TechnicalAnalysis
📚 Crypto Education — RSI
⚡ RSI measures momentum.
🟢 Above 70: strong momentum / potentially overextended
🟡 Around 50: balanced momentum
🔴 Below 30: weak momentum / potentially oversold
📊 RSI should not be used alone.
🔎 Price structure, volume and trend can provide confirmation.
👀 Context matters.
🤔 Do you combine RSI with another indicator?
#CryptoEducation #Binance #RSI #TechnicalAnalysis
⚡ RSI measures momentum.
🟢 Above 70: strong momentum / potentially overextended
🟡 Around 50: balanced momentum
🔴 Below 30: weak momentum / potentially oversold
📊 RSI should not be used alone.
🔎 Price structure, volume and trend can provide confirmation.
👀 Context matters.
🤔 Do you combine RSI with another indicator?
#CryptoEducation #Binance #RSI #TechnicalAnalysis


Статья
Mastering the RSI Indicator: How to Spot Overbought and Oversold Zones in Crypto TradingIn the fast-paced world of cryptocurrency trading, timing your market entries and exits is crucial. Whether you are a spot trader aiming to stack satoshis or a futures trader looking for quick scalp opportunities, relying on intuition alone can be risky.
This is where technical analysis tools come in—and among them, the Relative Strength Index (RSI) stands out as one of the most popular and versatile momentum indicators.
In this guide, we will break down what the RSI indicator is, how it works, and how to effectively use its overbought and oversold zones to make smarter trading decisions on platforms like Binance.
1. What is the RSI Indicator?
Developed by J. Welles Wilder Jr. in 1978, the Relative Strength Index (RSI) is a momentum oscillator that measures the speed and change of price movements.
The Scale: RSI moves on a scale from 0 to 100.
Default Setting: The standard lookback period is 14 periods (e.g., 14 hours on a 1H chart, or 14 days on a Daily chart).Core Purpose: It tells you whether an asset is gaining upside momentum or succumbing to selling pressure relative to its recent history.
2. Understanding Overbought and Oversold Zones
The primary way traders utilize RSI is by looking at fixed thresholds that indicate extreme price movements:
A. The Overbought Zone (RSI > 70)
What it means: When the RSI crosses above 70, the asset has experienced rapid upward price momentum. The market may be overheating, driven by FOMO (Fear of Missing Out).
Trader Action: An RSI above 70 does not mean you should short immediately. Instead, it serves as a warning sign that momentum might be stretching thin, signaling a potential pullback or consolidation phase. It is often a good time to take partial profits or tighten stop-losses.
B. The Oversold Zone (RSI < 30)
What it means: When the RSI drops below 30, the asset has suffered heavy selling pressure in a short period. Panic selling may have pushed the price below its intrinsic short-term value.
Trader Action: An RSI below 30 signals that the selling momentum may be weakening, opening the door for a potential bounce or relief rally. Traders monitor this zone for potential buy setups.
3. Key Rules for Trading RSI Reversals
To avoid falling into common market traps, follow these essential rules when trading RSI signals:
Rule 1: Wait for the Exit Cross
Never enter a trade just because RSI touches 70 or 30. During strong trend moves, RSI can stay overbought or oversold for extended periods.
Buy Signal: Wait for RSI to dip below 30 and then cross back above 30.
Sell/Take-Profit Signal: Wait for RSI to rise above 70 and then cross back below 70.
Rule 2: Adjust Thresholds Based on Market Conditions
Market context matters. Standard 70/30 levels work best in range-bound (sideways) markets.
In Strong Uptrends (Bull Market): RSI tends to stay between 40 and 80. Look for buying opportunities when RSI pulls back to 40–50 instead of waiting for 30.
In Strong Downtrends (Bear Market): RSI tends to stay between 20 and 60. Resistance often forms near 50–60, rather than 70.
Rule 3: Look for Divergences (Advanced Confirmation)
Divergences occur when price action and the RSI indicator move in opposite directions, offering high-probability reversal signals:
Bullish Divergence: The price makes a Lower Low, but the RSI makes a Higher Low. This shows selling pressure is fading—a strong buy signal.
Bearish Divergence: The price makes a Higher High, but the RSI makes a Lower High. This shows buying pressure is fading—a strong exit or short signal.
4. Common RSI Mistakes to Avoid
Blindly Buying/Selling Extreme Levels: Entering a short trade simply because RSI hit 75 in a strong bull run can blow up your account. Always wait for confirmation.
Ignoring Lower Timeframe Noise: On 1-minute or 5-minute charts, RSI frequently spikes into overbought or oversold territory. Stick to higher timeframes (1H, 4H, 1D) for reliable signals.
Using RSI in Isolation: RSI should never be your sole decision maker. Always combine it with key support/resistance levels, candlestick patterns, or volume indicators on Binance charts.
#RSI #TechnicalAnalysis #CryptoTrading #Binance e #CryptoEducation #TradingTips #bitcoin #Altcoins #BinanceSquare
Mastering the RSI Indicator: How to Spot Overbought and Oversold Zones in Crypto Trading
In the fast-paced world of cryptocurrency trading, timing your market entries and exits is crucial. Whether you are a spot trader aiming to stack satoshis or a futures trader looking for quick scalp opportunities, relying on intuition alone can be risky.
This is where technical analysis tools come in—and among them, the Relative Strength Index (RSI) stands out as one of the most popular and versatile momentum indicators.
In this guide, we will break down what the RSI indicator is, how it works, and how to effectively use its overbought and oversold zones to make smarter trading decisions on platforms like Binance.
1. What is the RSI Indicator?
Developed by J. Welles Wilder Jr. in 1978, the Relative Strength Index (RSI) is a momentum oscillator that measures the speed and change of price movements.
The Scale: RSI moves on a scale from 0 to 100.
Default Setting: The standard lookback period is 14 periods (e.g., 14 hours on a 1H chart, or 14 days on a Daily chart).Core Purpose: It tells you whether an asset is gaining upside momentum or succumbing to selling pressure relative to its recent history.
2. Understanding Overbought and Oversold Zones
The primary way traders utilize RSI is by looking at fixed thresholds that indicate extreme price movements:
A. The Overbought Zone (RSI > 70)
What it means: When the RSI crosses above 70, the asset has experienced rapid upward price momentum. The market may be overheating, driven by FOMO (Fear of Missing Out).
Trader Action: An RSI above 70 does not mean you should short immediately. Instead, it serves as a warning sign that momentum might be stretching thin, signaling a potential pullback or consolidation phase. It is often a good time to take partial profits or tighten stop-losses.
B. The Oversold Zone (RSI < 30)
What it means: When the RSI drops below 30, the asset has suffered heavy selling pressure in a short period. Panic selling may have pushed the price below its intrinsic short-term value.
Trader Action: An RSI below 30 signals that the selling momentum may be weakening, opening the door for a potential bounce or relief rally. Traders monitor this zone for potential buy setups.
3. Key Rules for Trading RSI Reversals
To avoid falling into common market traps, follow these essential rules when trading RSI signals:
Rule 1: Wait for the Exit Cross
Never enter a trade just because RSI touches 70 or 30. During strong trend moves, RSI can stay overbought or oversold for extended periods.
Buy Signal: Wait for RSI to dip below 30 and then cross back above 30.
Sell/Take-Profit Signal: Wait for RSI to rise above 70 and then cross back below 70.
Rule 2: Adjust Thresholds Based on Market Conditions
Market context matters. Standard 70/30 levels work best in range-bound (sideways) markets.
In Strong Uptrends (Bull Market): RSI tends to stay between 40 and 80. Look for buying opportunities when RSI pulls back to 40–50 instead of waiting for 30.
In Strong Downtrends (Bear Market): RSI tends to stay between 20 and 60. Resistance often forms near 50–60, rather than 70.
Rule 3: Look for Divergences (Advanced Confirmation)
Divergences occur when price action and the RSI indicator move in opposite directions, offering high-probability reversal signals:
Bullish Divergence: The price makes a Lower Low, but the RSI makes a Higher Low. This shows selling pressure is fading—a strong buy signal.
Bearish Divergence: The price makes a Higher High, but the RSI makes a Lower High. This shows buying pressure is fading—a strong exit or short signal.
4. Common RSI Mistakes to Avoid
Blindly Buying/Selling Extreme Levels: Entering a short trade simply because RSI hit 75 in a strong bull run can blow up your account. Always wait for confirmation.
Ignoring Lower Timeframe Noise: On 1-minute or 5-minute charts, RSI frequently spikes into overbought or oversold territory. Stick to higher timeframes (1H, 4H, 1D) for reliable signals.
Using RSI in Isolation: RSI should never be your sole decision maker. Always combine it with key support/resistance levels, candlestick patterns, or volume indicators on Binance charts.
#RSI #TechnicalAnalysis #CryptoTrading #Binance e #CryptoEducation #TradingTips #bitcoin #Altcoins #BinanceSquare
This is where technical analysis tools come in—and among them, the Relative Strength Index (RSI) stands out as one of the most popular and versatile momentum indicators.
In this guide, we will break down what the RSI indicator is, how it works, and how to effectively use its overbought and oversold zones to make smarter trading decisions on platforms like Binance.
1. What is the RSI Indicator?
Developed by J. Welles Wilder Jr. in 1978, the Relative Strength Index (RSI) is a momentum oscillator that measures the speed and change of price movements.
The Scale: RSI moves on a scale from 0 to 100.
Default Setting: The standard lookback period is 14 periods (e.g., 14 hours on a 1H chart, or 14 days on a Daily chart).Core Purpose: It tells you whether an asset is gaining upside momentum or succumbing to selling pressure relative to its recent history.
2. Understanding Overbought and Oversold Zones
The primary way traders utilize RSI is by looking at fixed thresholds that indicate extreme price movements:
A. The Overbought Zone (RSI > 70)
What it means: When the RSI crosses above 70, the asset has experienced rapid upward price momentum. The market may be overheating, driven by FOMO (Fear of Missing Out).
Trader Action: An RSI above 70 does not mean you should short immediately. Instead, it serves as a warning sign that momentum might be stretching thin, signaling a potential pullback or consolidation phase. It is often a good time to take partial profits or tighten stop-losses.
B. The Oversold Zone (RSI < 30)
What it means: When the RSI drops below 30, the asset has suffered heavy selling pressure in a short period. Panic selling may have pushed the price below its intrinsic short-term value.
Trader Action: An RSI below 30 signals that the selling momentum may be weakening, opening the door for a potential bounce or relief rally. Traders monitor this zone for potential buy setups.
3. Key Rules for Trading RSI Reversals
To avoid falling into common market traps, follow these essential rules when trading RSI signals:
Rule 1: Wait for the Exit Cross
Never enter a trade just because RSI touches 70 or 30. During strong trend moves, RSI can stay overbought or oversold for extended periods.
Buy Signal: Wait for RSI to dip below 30 and then cross back above 30.
Sell/Take-Profit Signal: Wait for RSI to rise above 70 and then cross back below 70.
Rule 2: Adjust Thresholds Based on Market Conditions
Market context matters. Standard 70/30 levels work best in range-bound (sideways) markets.
In Strong Uptrends (Bull Market): RSI tends to stay between 40 and 80. Look for buying opportunities when RSI pulls back to 40–50 instead of waiting for 30.
In Strong Downtrends (Bear Market): RSI tends to stay between 20 and 60. Resistance often forms near 50–60, rather than 70.
Rule 3: Look for Divergences (Advanced Confirmation)
Divergences occur when price action and the RSI indicator move in opposite directions, offering high-probability reversal signals:
Bullish Divergence: The price makes a Lower Low, but the RSI makes a Higher Low. This shows selling pressure is fading—a strong buy signal.
Bearish Divergence: The price makes a Higher High, but the RSI makes a Lower High. This shows buying pressure is fading—a strong exit or short signal.
4. Common RSI Mistakes to Avoid
Blindly Buying/Selling Extreme Levels: Entering a short trade simply because RSI hit 75 in a strong bull run can blow up your account. Always wait for confirmation.
Ignoring Lower Timeframe Noise: On 1-minute or 5-minute charts, RSI frequently spikes into overbought or oversold territory. Stick to higher timeframes (1H, 4H, 1D) for reliable signals.
Using RSI in Isolation: RSI should never be your sole decision maker. Always combine it with key support/resistance levels, candlestick patterns, or volume indicators on Binance charts.
#RSI #TechnicalAnalysis #CryptoTrading #Binance e #CryptoEducation #TradingTips #bitcoin #Altcoins #BinanceSquare
60

O RSI DA PEPE MOSTRA O MOMENTO ATUAL!
No gráfico de 4 horas:
🔥 RSI(14): 45,6
O RSI está próximo da zona neutra de 50 e ainda permanece bem acima da região de sobrevenda.
Isso mostra que:
📊 O momentum está em uma faixa intermediária.
📊 O RSI ainda não entrou em sobrevenda.
📊 O movimento continua sendo acompanhado de perto pelo mercado.
$PEPE segue apresentando uma leitura de RSI longe dos extremos.
Agora é a hora!
{spot}(PEPEUSDT)
#PEPE #RSI #alcoinseason
O RSI DA PEPE MOSTRA O MOMENTO ATUAL!
No gráfico de 4 horas:
🔥 RSI(14): 45,6
O RSI está próximo da zona neutra de 50 e ainda permanece bem acima da região de sobrevenda.
Isso mostra que:
📊 O momentum está em uma faixa intermediária.
📊 O RSI ainda não entrou em sobrevenda.
📊 O movimento continua sendo acompanhado de perto pelo mercado.
$PEPE segue apresentando uma leitura de RSI longe dos extremos.
Agora é a hora!
#PEPE #RSI #alcoinseason
No gráfico de 4 horas:
🔥 RSI(14): 45,6
O RSI está próximo da zona neutra de 50 e ainda permanece bem acima da região de sobrevenda.
Isso mostra que:
📊 O momentum está em uma faixa intermediária.
📊 O RSI ainda não entrou em sobrevenda.
📊 O movimento continua sendo acompanhado de perto pelo mercado.
$PEPE segue apresentando uma leitura de RSI longe dos extremos.
Agora é a hora!
#PEPE #RSI #alcoinseason

2
699
·
--
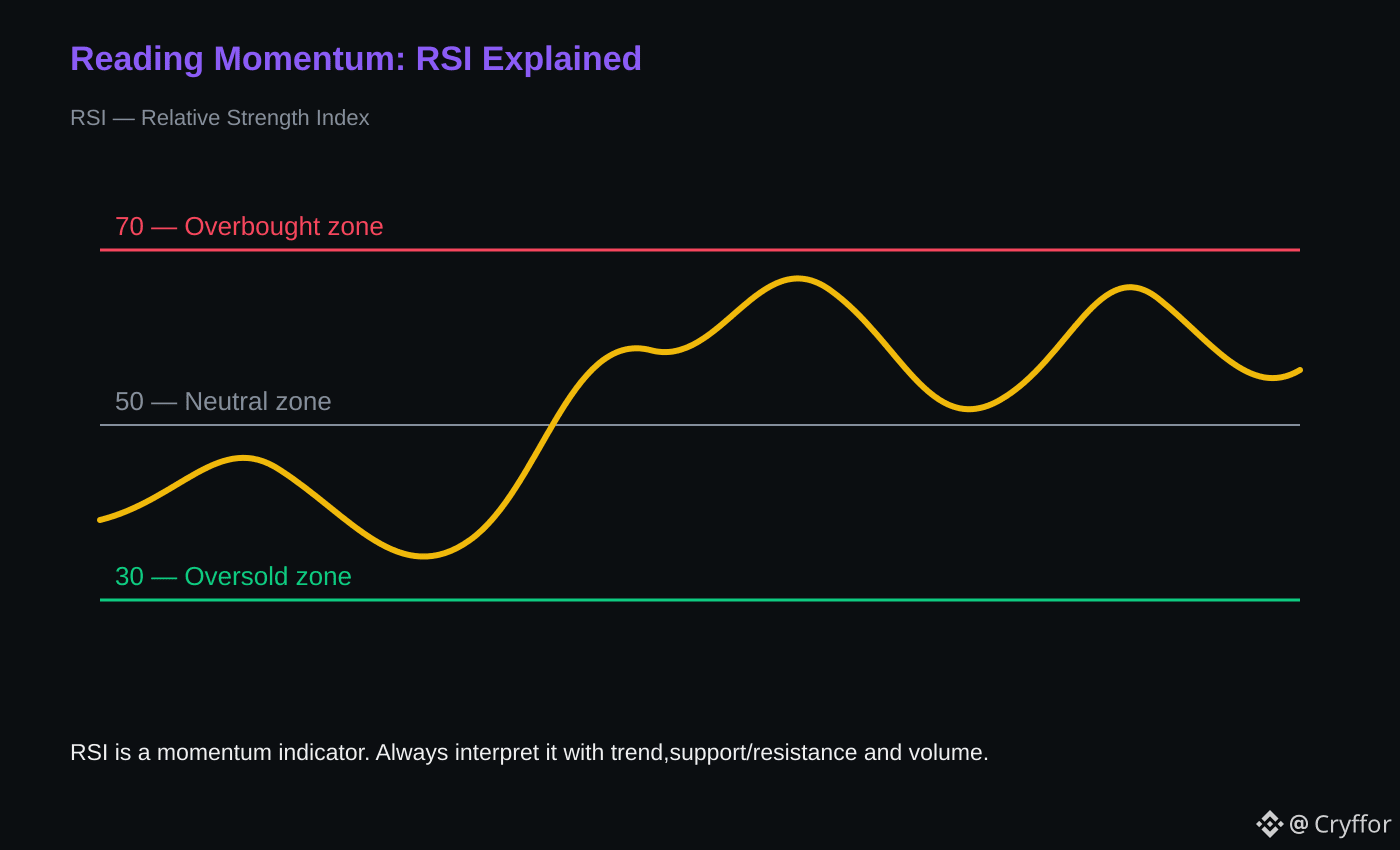
📚 Crypto Education — RSI
⚡ RSI measures momentum.
🟢 Above 70: strong momentum / potentially overextended
🟡 Around 50: balanced momentum
🔴 Below 30: weak momentum / potentially oversold
📊 RSI should not be used alone.
🔎 Price structure, volume and trend can provide confirmation.
👀 Context matters.
🤔 Do you combine RSI with another indicator?
#CryptoEducation #Binance #RSI #TechnicalAnalysis
📚 Crypto Education — RSI
⚡ RSI measures momentum.
🟢 Above 70: strong momentum / potentially overextended
🟡 Around 50: balanced momentum
🔴 Below 30: weak momentum / potentially oversold
📊 RSI should not be used alone.
🔎 Price structure, volume and trend can provide confirmation.
👀 Context matters.
🤔 Do you combine RSI with another indicator?
#CryptoEducation #Binance #RSI #TechnicalAnalysis
⚡ RSI measures momentum.
🟢 Above 70: strong momentum / potentially overextended
🟡 Around 50: balanced momentum
🔴 Below 30: weak momentum / potentially oversold
📊 RSI should not be used alone.
🔎 Price structure, volume and trend can provide confirmation.
👀 Context matters.
🤔 Do you combine RSI with another indicator?
#CryptoEducation #Binance #RSI #TechnicalAnalysis
4

🚀BITCOIN TO THE MOON? $BTC 86,000 BREAKOUT + RSI & MACD ALIGNMENT! 🔥
Kia Crypto Winter Hamesha K Liye Khatam? Ya Yeh Aik Bull Trap Hai? 🤔
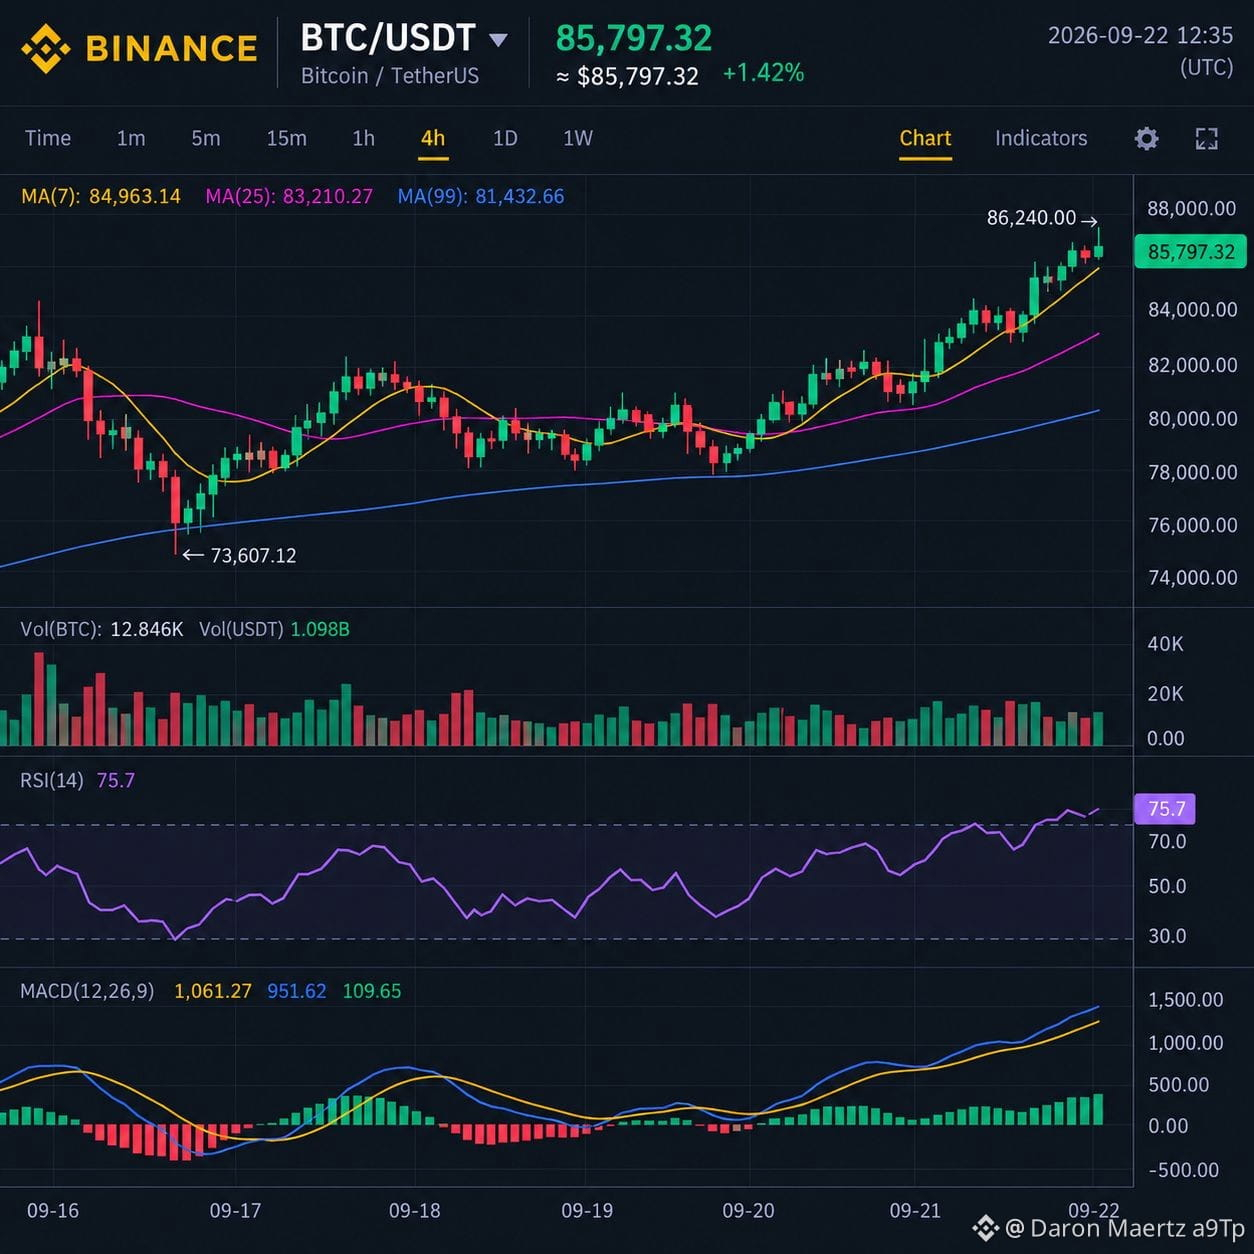
Dosto, Bitcoin ne pichle 8 mahino ki sab se oonchi satah (8-Month High) yaani $BTC 86,000 ki deewar ko tod diya hai! Is waqt market mein $648M se zyada ke shorts liquidate ho chuke hain. Lekin trade open karne se pehle chaliye dekhte hain indicators kia bol rahe hain:
📊 Technical Analysis (RSI & MACD Update):
RSI (Relative Strength Index): Daily chart par RSI is waqt 72-74 ke zone (Overbought) mein enter ho chuka hai. Yeh dikhata hai ke market mein buying momentum bohot strong hai, lekin sath hi sath aik short-term cooldown ya minor profit-taking correction bhi aa sakti hai
MACD (Moving Average Convergence Divergence): MACD line is waqt Signal line ke upar strong Bullish Crossover bana chuki hai. Iske sath hi histogram bars musalsal green ho rahe hain, jo yeh confirm karta hai ke buyers fully control mein hain aur trend abhi upar ki taraf momentum pakad raha hai.
📈 Key Levels to Watch:
Current Price: ~$85,600
Target/Resistance: Agla bara resistance target seedha $89,800 hai.
Support Zone: Pullback ki surat mein $81,200 aur $76,500 strong support ka kaam karenge.
💡 Expert Strategy:
Indicators se saaf zahir hai ke momentum bohot bullish hai lekin blind FOMO se bachein kyunki RSI overbought hai. Behtar strategy yeh hai ke direct top par buy karne ki jagah chote pullbacks ka wait kiya jaye aur hamesha Stop-Loss ke sath trade ki jaye!
👇 Aapka kia plan hai? Kya aap is level par long kar rahe hain ya short? Niche comments mein apna technical view share karein!
#BTC☀️ #RSI #MACD #BinanceSquare
$BTC
{spot}(BTCUSDT)
🚀BITCOIN TO THE MOON? $BTC 86,000 BREAKOUT + RSI & MACD ALIGNMENT! 🔥
Kia Crypto Winter Hamesha K Liye Khatam? Ya Yeh Aik Bull Trap Hai? 🤔
Dosto, Bitcoin ne pichle 8 mahino ki sab se oonchi satah (8-Month High) yaani $BTC 86,000 ki deewar ko tod diya hai! Is waqt market mein $648M se zyada ke shorts liquidate ho chuke hain. Lekin trade open karne se pehle chaliye dekhte hain indicators kia bol rahe hain:
📊 Technical Analysis (RSI & MACD Update):
RSI (Relative Strength Index): Daily chart par RSI is waqt 72-74 ke zone (Overbought) mein enter ho chuka hai. Yeh dikhata hai ke market mein buying momentum bohot strong hai, lekin sath hi sath aik short-term cooldown ya minor profit-taking correction bhi aa sakti hai
MACD (Moving Average Convergence Divergence): MACD line is waqt Signal line ke upar strong Bullish Crossover bana chuki hai. Iske sath hi histogram bars musalsal green ho rahe hain, jo yeh confirm karta hai ke buyers fully control mein hain aur trend abhi upar ki taraf momentum pakad raha hai.
📈 Key Levels to Watch:
Current Price: ~$85,600
Target/Resistance: Agla bara resistance target seedha $89,800 hai.
Support Zone: Pullback ki surat mein $81,200 aur $76,500 strong support ka kaam karenge.
💡 Expert Strategy:
Indicators se saaf zahir hai ke momentum bohot bullish hai lekin blind FOMO se bachein kyunki RSI overbought hai. Behtar strategy yeh hai ke direct top par buy karne ki jagah chote pullbacks ka wait kiya jaye aur hamesha Stop-Loss ke sath trade ki jaye!
👇 Aapka kia plan hai? Kya aap is level par long kar rahe hain ya short? Niche comments mein apna technical view share karein!
#BTC☀️ #RSI #MACD #BinanceSquare
$BTC
Kia Crypto Winter Hamesha K Liye Khatam? Ya Yeh Aik Bull Trap Hai? 🤔
Dosto, Bitcoin ne pichle 8 mahino ki sab se oonchi satah (8-Month High) yaani $BTC 86,000 ki deewar ko tod diya hai! Is waqt market mein $648M se zyada ke shorts liquidate ho chuke hain. Lekin trade open karne se pehle chaliye dekhte hain indicators kia bol rahe hain:
📊 Technical Analysis (RSI & MACD Update):
RSI (Relative Strength Index): Daily chart par RSI is waqt 72-74 ke zone (Overbought) mein enter ho chuka hai. Yeh dikhata hai ke market mein buying momentum bohot strong hai, lekin sath hi sath aik short-term cooldown ya minor profit-taking correction bhi aa sakti hai
MACD (Moving Average Convergence Divergence): MACD line is waqt Signal line ke upar strong Bullish Crossover bana chuki hai. Iske sath hi histogram bars musalsal green ho rahe hain, jo yeh confirm karta hai ke buyers fully control mein hain aur trend abhi upar ki taraf momentum pakad raha hai.
📈 Key Levels to Watch:
Current Price: ~$85,600
Target/Resistance: Agla bara resistance target seedha $89,800 hai.
Support Zone: Pullback ki surat mein $81,200 aur $76,500 strong support ka kaam karenge.
💡 Expert Strategy:
Indicators se saaf zahir hai ke momentum bohot bullish hai lekin blind FOMO se bachein kyunki RSI overbought hai. Behtar strategy yeh hai ke direct top par buy karne ki jagah chote pullbacks ka wait kiya jaye aur hamesha Stop-Loss ke sath trade ki jaye!
👇 Aapka kia plan hai? Kya aap is level par long kar rahe hain ya short? Niche comments mein apna technical view share karein!
#BTC☀️ #RSI #MACD #BinanceSquare
$BTC
69
·
--
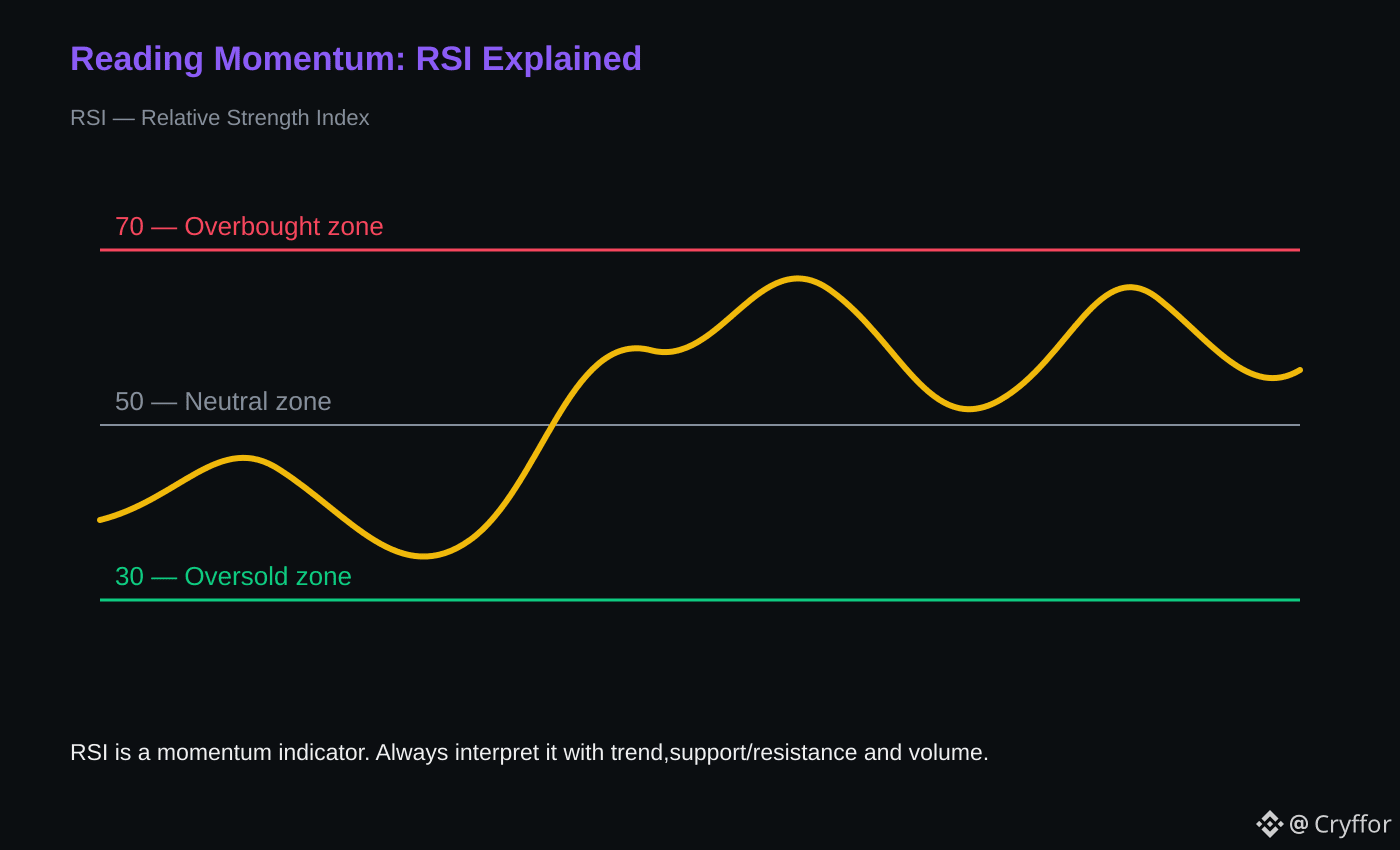
Relying on a single line to predict crypto moves is one of the fastest ways to get wrecked. Enter the Relative Strength Index (RSI), an indicator that measures momentum on a 0-100 scale.
Here is how to read the levels:
• Above 70: Typically signals strong or potentially overextended momentum. ⚡
• Around 50: Indicates balanced momentum.
• Below 30: Typically signals weak or potentially oversold momentum.
The biggest trap? Using it in isolation. 🚨 An RSI reading should never be used alone. To get proper confirmation, you must always combine RSI with price structure, volume, and the trend before making a move. 🧠
What is your favorite indicator to pair alongside RSI?
#CryptoTrading #RSI #TechnicalAnalysis #BinanceSquare
Relying on a single line to predict crypto moves is one of the fastest ways to get wrecked. Enter the Relative Strength Index (RSI), an indicator that measures momentum on a 0-100 scale.
Here is how to read the levels:
• Above 70: Typically signals strong or potentially overextended momentum. ⚡
• Around 50: Indicates balanced momentum.
• Below 30: Typically signals weak or potentially oversold momentum.
The biggest trap? Using it in isolation. 🚨 An RSI reading should never be used alone. To get proper confirmation, you must always combine RSI with price structure, volume, and the trend before making a move. 🧠
What is your favorite indicator to pair alongside RSI?
#CryptoTrading #RSI #TechnicalAnalysis #BinanceSquare
Here is how to read the levels:
• Above 70: Typically signals strong or potentially overextended momentum. ⚡
• Around 50: Indicates balanced momentum.
• Below 30: Typically signals weak or potentially oversold momentum.
The biggest trap? Using it in isolation. 🚨 An RSI reading should never be used alone. To get proper confirmation, you must always combine RSI with price structure, volume, and the trend before making a move. 🧠
What is your favorite indicator to pair alongside RSI?
#CryptoTrading #RSI #TechnicalAnalysis #BinanceSquare
1

·
--
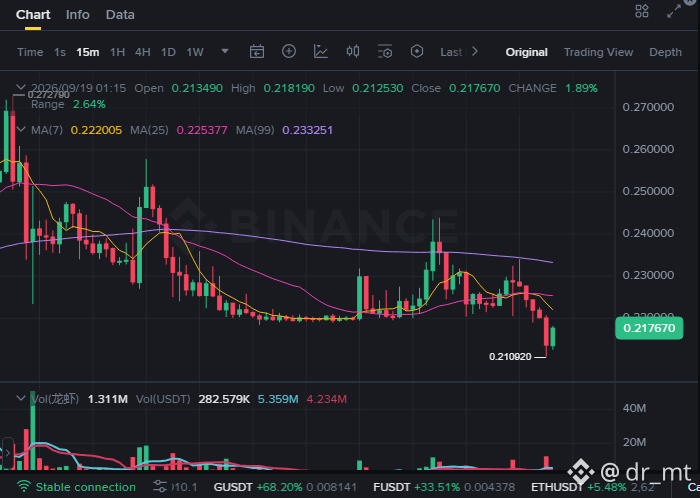
$龙虾USDT just got flushed — and now the tape is trying to bounce 🚨
This is the kind of 15M move I respect: heavy selloff first, then a strong reaction off the lows. RSI is deeply oversold, and price is trying to stabilize after tagging the lower end of the range. Not a hero call here — just a tactical long if buyers can keep defending this bounce.
ENTRY: 0.215050
That’s the area where the bounce stays actionable while price holds above the recent flush.
TP1: 0.217200
First spot to lock something in if the rebound keeps moving.
TP2: 0.219351
If momentum holds, this is the next push zone.
TP3: 0.221501
Stretch continuation target if the squeeze extends.
STOP LOSS: 0.210749
Lose that level and the long thesis is damaged.
Risk reminder: this is a fast bounce setup, not a guaranteed reversal — manage size and respect the stop ⚠️
$龙虾USDT is trying to breathe. Do you take the bounce here or wait for more confirmation? 👇
#CryptoTrading #RSI #BinanceSquare #Altcoins
$龙虾USDT just got flushed — and now the tape is trying to bounce 🚨
This is the kind of 15M move I respect: heavy selloff first, then a strong reaction off the lows. RSI is deeply oversold, and price is trying to stabilize after tagging the lower end of the range. Not a hero call here — just a tactical long if buyers can keep defending this bounce.
ENTRY: 0.215050
That’s the area where the bounce stays actionable while price holds above the recent flush.
TP1: 0.217200
First spot to lock something in if the rebound keeps moving.
TP2: 0.219351
If momentum holds, this is the next push zone.
TP3: 0.221501
Stretch continuation target if the squeeze extends.
STOP LOSS: 0.210749
Lose that level and the long thesis is damaged.
Risk reminder: this is a fast bounce setup, not a guaranteed reversal — manage size and respect the stop ⚠️
$龙虾USDT is trying to breathe. Do you take the bounce here or wait for more confirmation? 👇
#CryptoTrading #RSI #BinanceSquare #Altcoins
This is the kind of 15M move I respect: heavy selloff first, then a strong reaction off the lows. RSI is deeply oversold, and price is trying to stabilize after tagging the lower end of the range. Not a hero call here — just a tactical long if buyers can keep defending this bounce.
ENTRY: 0.215050
That’s the area where the bounce stays actionable while price holds above the recent flush.
TP1: 0.217200
First spot to lock something in if the rebound keeps moving.
TP2: 0.219351
If momentum holds, this is the next push zone.
TP3: 0.221501
Stretch continuation target if the squeeze extends.
STOP LOSS: 0.210749
Lose that level and the long thesis is damaged.
Risk reminder: this is a fast bounce setup, not a guaranteed reversal — manage size and respect the stop ⚠️
$龙虾USDT is trying to breathe. Do you take the bounce here or wait for more confirmation? 👇
#CryptoTrading #RSI #BinanceSquare #Altcoins
514

·
--
📊 قراءة فنية سريعة لعملة $BABY
• RSI على الساعة: 90.6
• السعر وقت الرصد: 0.01234
• حالة السوق: تشبع شرائي شديد
• درجة احتمال التصحيح أو الهبوط: 71%
ولا توجد حتى الآن إشارة رفض علوية قوية، لذلك يبقى التأكيد مهماً.
قد يواصل السعر الصعود مؤقتاً، لذلك لا يُفضّل البيع مباشرة. التأكيد الأفضل يكون عند ظهور بوادر الهبوط.
السعر وقت الرصد: 0.01234
👈 اضغط على $BABY لمتابعة العملة
صياد السمك
تنبيه: درجة الاحتمال تقديرية وليست ضماناً لحركة السعر.
$BABY #BABY #RSI #Futures #BinanceSquare
📊 قراءة فنية سريعة لعملة $BABY
• RSI على الساعة: 90.6
• السعر وقت الرصد: 0.01234
• حالة السوق: تشبع شرائي شديد
• درجة احتمال التصحيح أو الهبوط: 71%
ولا توجد حتى الآن إشارة رفض علوية قوية، لذلك يبقى التأكيد مهماً.
قد يواصل السعر الصعود مؤقتاً، لذلك لا يُفضّل البيع مباشرة. التأكيد الأفضل يكون عند ظهور بوادر الهبوط.
السعر وقت الرصد: 0.01234
👈 اضغط على $BABY لمتابعة العملة
صياد السمك
تنبيه: درجة الاحتمال تقديرية وليست ضماناً لحركة السعر.
$BABY #BABY #RSI #Futures #BinanceSquare
• RSI على الساعة: 90.6
• السعر وقت الرصد: 0.01234
• حالة السوق: تشبع شرائي شديد
• درجة احتمال التصحيح أو الهبوط: 71%
ولا توجد حتى الآن إشارة رفض علوية قوية، لذلك يبقى التأكيد مهماً.
قد يواصل السعر الصعود مؤقتاً، لذلك لا يُفضّل البيع مباشرة. التأكيد الأفضل يكون عند ظهور بوادر الهبوط.
السعر وقت الرصد: 0.01234
👈 اضغط على $BABY لمتابعة العملة
صياد السمك
تنبيه: درجة الاحتمال تقديرية وليست ضماناً لحركة السعر.
$BABY #BABY #RSI #Futures #BinanceSquare
222
·
--
🎓 ماذا يحدث عندما يتجاوز RSI مستوى 90؟
هذا ما يحدث الآن في $GENIUS، حيث وصل RSI إلى 92.5.
ولا توجد حتى الآن إشارة رفض علوية قوية، لذلك يبقى التأكيد مهماً.
ارتفاع RSI لا يعني هبوط السعر فوراً، لكنه يجعل مراقبة بوادر التصحيح مهمة.
📊 درجة احتمال التصحيح أو الهبوط: 75%
قد يواصل السعر الصعود مؤقتاً، لذلك لا يُفضّل البيع مباشرة. التأكيد الأفضل يكون عند ظهور بوادر الهبوط.
السعر وقت الرصد: 0.3773
👈 اضغط على $GENIUS لمتابعة العملة
صياد السمك
تنبيه: درجة الاحتمال تقديرية وليست ضماناً لحركة السعر.
$GENIUS #GENIUS #RSI #Futures #BinanceSquare
🎓 ماذا يحدث عندما يتجاوز RSI مستوى 90؟
هذا ما يحدث الآن في $GENIUS ، حيث وصل RSI إلى 92.5.
ولا توجد حتى الآن إشارة رفض علوية قوية، لذلك يبقى التأكيد مهماً.
ارتفاع RSI لا يعني هبوط السعر فوراً، لكنه يجعل مراقبة بوادر التصحيح مهمة.
📊 درجة احتمال التصحيح أو الهبوط: 75%
قد يواصل السعر الصعود مؤقتاً، لذلك لا يُفضّل البيع مباشرة. التأكيد الأفضل يكون عند ظهور بوادر الهبوط.
السعر وقت الرصد: 0.3773
👈 اضغط على $GENIUS لمتابعة العملة
صياد السمك
تنبيه: درجة الاحتمال تقديرية وليست ضماناً لحركة السعر.
$GENIUS #GENIUS #RSI #Futures #BinanceSquare
هذا ما يحدث الآن في $GENIUS ، حيث وصل RSI إلى 92.5.
ولا توجد حتى الآن إشارة رفض علوية قوية، لذلك يبقى التأكيد مهماً.
ارتفاع RSI لا يعني هبوط السعر فوراً، لكنه يجعل مراقبة بوادر التصحيح مهمة.
📊 درجة احتمال التصحيح أو الهبوط: 75%
قد يواصل السعر الصعود مؤقتاً، لذلك لا يُفضّل البيع مباشرة. التأكيد الأفضل يكون عند ظهور بوادر الهبوط.
السعر وقت الرصد: 0.3773
👈 اضغط على $GENIUS لمتابعة العملة
صياد السمك
تنبيه: درجة الاحتمال تقديرية وليست ضماناً لحركة السعر.
$GENIUS #GENIUS #RSI #Futures #BinanceSquare
50
·
--
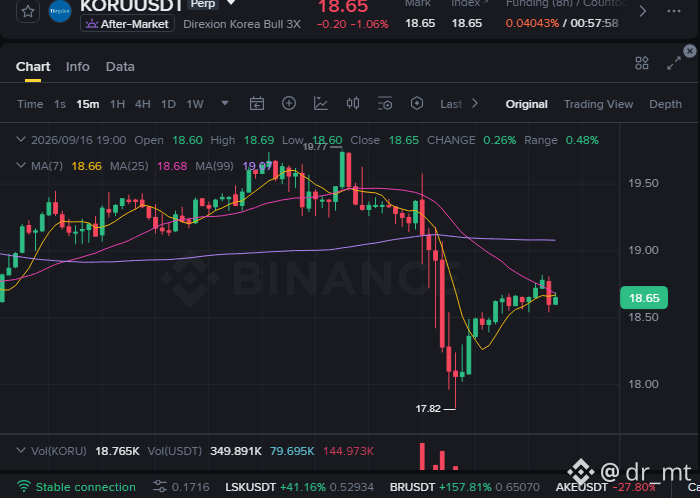
$KORU update...
RSI trade is doing its job.
Entry: 18.2900
TP1: 18.4729 ✅
TP2: 18.6558 ✅
Second target hit — nice follow-through here.
Current price: 18.6700
That’s the kind of move we want to see after an RSI setup.
Now we let the chart decide if it wants to keep extending toward TP3: 18.8387.
Manage risk. Stay sharp.
Follow for more live trade updates, and drop a comment if you’re still in this one.
#KORU #RSI #CryptoTrading
$KORU update...
RSI trade is doing its job.
Entry: 18.2900
TP1: 18.4729 ✅
TP2: 18.6558 ✅
Second target hit — nice follow-through here.
Current price: 18.6700
That’s the kind of move we want to see after an RSI setup.
Now we let the chart decide if it wants to keep extending toward TP3: 18.8387.
Manage risk. Stay sharp.
Follow for more live trade updates, and drop a comment if you’re still in this one.
#KORU #RSI #CryptoTrading
RSI trade is doing its job.
Entry: 18.2900
TP1: 18.4729 ✅
TP2: 18.6558 ✅
Second target hit — nice follow-through here.
Current price: 18.6700
That’s the kind of move we want to see after an RSI setup.
Now we let the chart decide if it wants to keep extending toward TP3: 18.8387.
Manage risk. Stay sharp.
Follow for more live trade updates, and drop a comment if you’re still in this one.
#KORU #RSI #CryptoTrading
1
199
·
--
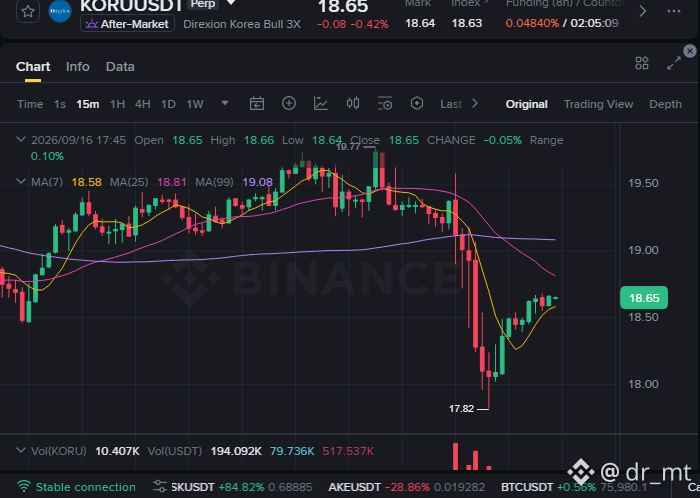
$KORU update...
TP1 at 18.4729 has been hit ✅
Entry was 18.2900
Current price: 18.6500
Nice move for the RSI setup, but now the job changes:
protect what the market has already paid you.
Some traders will scale out here...
some will move stops up...
either way, don’t let a winning trade turn into a round trip.
TP2 is 18.6558
TP3 is 18.8387
Stop loss remains 17.9242
Stay disciplined. Lock in. Let the rest run if the chart gives it to you.
Follow for more updates, and drop a comment if you’re in this one.
#KORU #CryptoTrading #RSI #BinanceSquare
$KORU update...
TP1 at 18.4729 has been hit ✅
Entry was 18.2900
Current price: 18.6500
Nice move for the RSI setup, but now the job changes:
protect what the market has already paid you.
Some traders will scale out here...
some will move stops up...
either way, don’t let a winning trade turn into a round trip.
TP2 is 18.6558
TP3 is 18.8387
Stop loss remains 17.9242
Stay disciplined. Lock in. Let the rest run if the chart gives it to you.
Follow for more updates, and drop a comment if you’re in this one.
#KORU #CryptoTrading #RSI #BinanceSquare
TP1 at 18.4729 has been hit ✅
Entry was 18.2900
Current price: 18.6500
Nice move for the RSI setup, but now the job changes:
protect what the market has already paid you.
Some traders will scale out here...
some will move stops up...
either way, don’t let a winning trade turn into a round trip.
TP2 is 18.6558
TP3 is 18.8387
Stop loss remains 17.9242
Stay disciplined. Lock in. Let the rest run if the chart gives it to you.
Follow for more updates, and drop a comment if you’re in this one.
#KORU #CryptoTrading #RSI #BinanceSquare
114
·
--
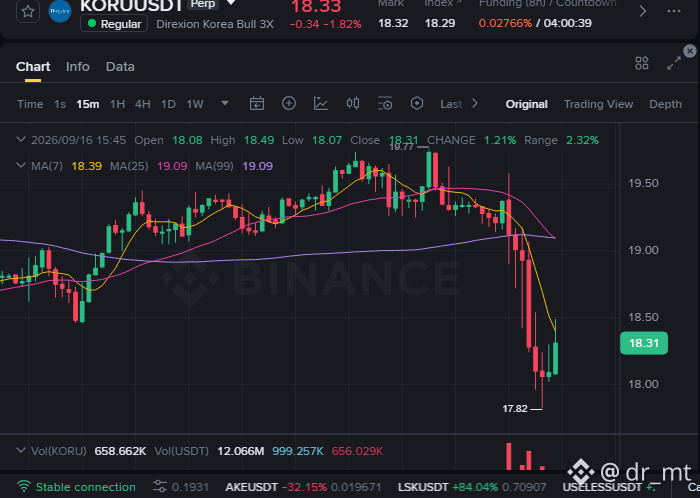
$KORU just got slammed into the floor... and buyers finally stepped in 💥
That dump to 17.82 looked heavy, but the rebound candle back into 18.30 tells me selling pressure may be cooling off here. With RSI(6) at 11.11 on the 15M, this is the kind of oversold flush where a sharp bounce can happen fast — BUT only if price keeps holding the recovery.
ENTRY: 18.2900
This is the actionable zone as the bounce tries to build.
TP1: 18.4729
First area to take some profit off the table.
TP2: 18.6558
If momentum extends, this is the next push zone.
TP3: 18.8387
Stretch target if buyers keep pressing.
STOP LOSS: 17.9242
If price loses this level, the rebound idea is broken.
Risk it properly — oversold doesn’t mean guaranteed reversal. Let the chart prove it ⚡
#KORU #CryptoTrading #RSI #Long
Are you taking the bounce or waiting for more confirmation?
$KORU just got slammed into the floor... and buyers finally stepped in 💥
That dump to 17.82 looked heavy, but the rebound candle back into 18.30 tells me selling pressure may be cooling off here. With RSI(6) at 11.11 on the 15M, this is the kind of oversold flush where a sharp bounce can happen fast — BUT only if price keeps holding the recovery.
ENTRY: 18.2900
This is the actionable zone as the bounce tries to build.
TP1: 18.4729
First area to take some profit off the table.
TP2: 18.6558
If momentum extends, this is the next push zone.
TP3: 18.8387
Stretch target if buyers keep pressing.
STOP LOSS: 17.9242
If price loses this level, the rebound idea is broken.
Risk it properly — oversold doesn’t mean guaranteed reversal. Let the chart prove it ⚡
#KORU #CryptoTrading #RSI #Long
Are you taking the bounce or waiting for more confirmation?
That dump to 17.82 looked heavy, but the rebound candle back into 18.30 tells me selling pressure may be cooling off here. With RSI(6) at 11.11 on the 15M, this is the kind of oversold flush where a sharp bounce can happen fast — BUT only if price keeps holding the recovery.
ENTRY: 18.2900
This is the actionable zone as the bounce tries to build.
TP1: 18.4729
First area to take some profit off the table.
TP2: 18.6558
If momentum extends, this is the next push zone.
TP3: 18.8387
Stretch target if buyers keep pressing.
STOP LOSS: 17.9242
If price loses this level, the rebound idea is broken.
Risk it properly — oversold doesn’t mean guaranteed reversal. Let the chart prove it ⚡
#KORU #CryptoTrading #RSI #Long
Are you taking the bounce or waiting for more confirmation?
146

·
--
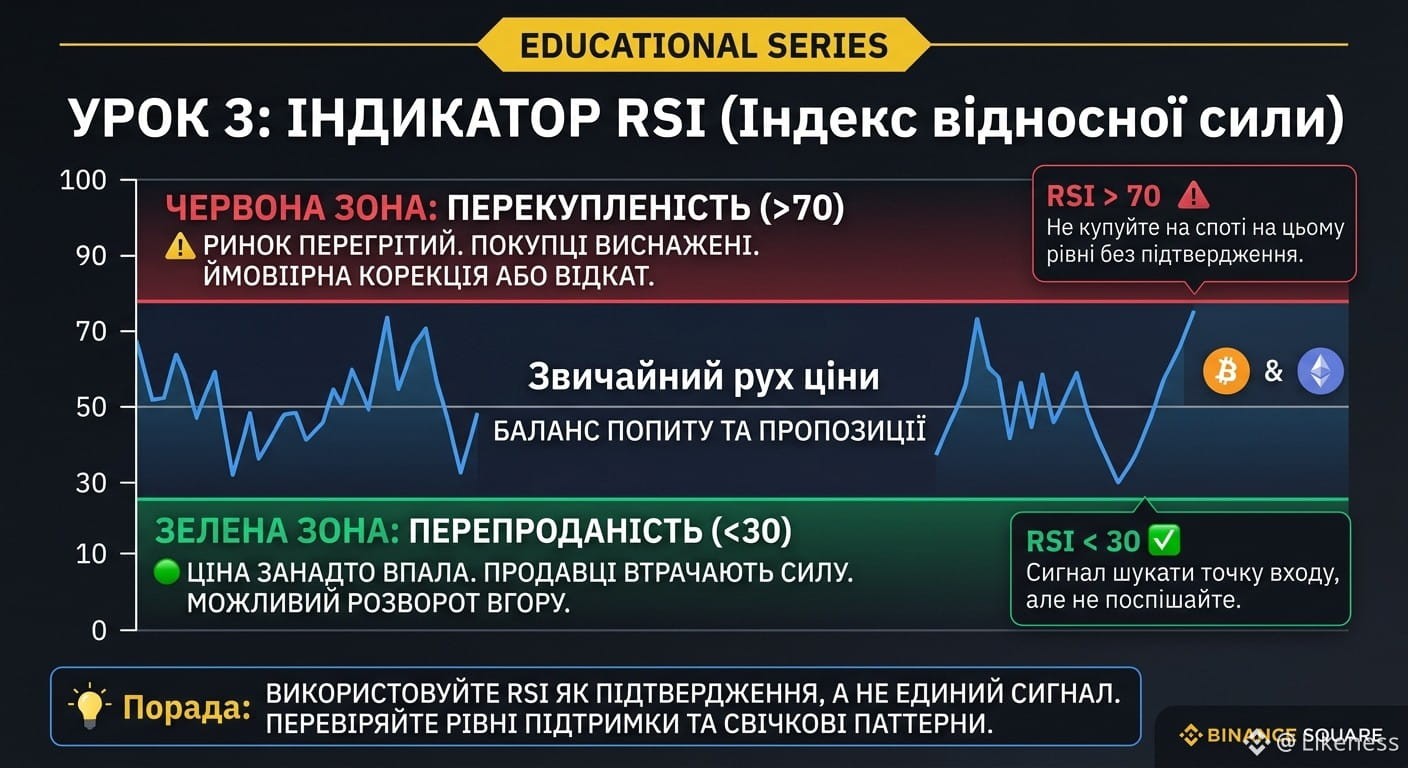
📊 ІНДИКАТОР RSI: ЯК ЗНАЙТИ ТОЧКИ РОЗВОРОТУ ЦІНИ
Як зрозуміти, що ринок "перегрітий" і ціна ось-ось почне падати, або навпаки — монета занадто впала й час купувати?
Для цього трейдери використовують осцилятор RSI (Relative Strength Index). Він коливається у діапазоні від 0 до 100:
🔴 Перекупленість (RSI > 70):
Ціна зростала занадто швидко. Покупці виснажені, висока ймовірність відкату або корекції вниз.
👉 Не найкращий час для купівлі на споті.
🟢 Перепроданість (RSI < 30):
Монету активно продавали, ціна занадто впала. Продавці втрачають силу, можливий розворот вгору.
👉 Сигнал придивитися до точок входу.
💡 Порада: Не купуйте лише тому, що RSI < 30! Завжди шукайте підтвердження на рівні підтримки або за допомогою свічкових паттернів.
👇 Чи використовуєте ви RSI під час аналізу графіків?
#Binance #RSI #індикатори #аналіз #крипта
{spot}(BTCUSDT)
{spot}(ETHUSDT)
📊 ІНДИКАТОР RSI: ЯК ЗНАЙТИ ТОЧКИ РОЗВОРОТУ ЦІНИ
Як зрозуміти, що ринок "перегрітий" і ціна ось-ось почне падати, або навпаки — монета занадто впала й час купувати?
Для цього трейдери використовують осцилятор RSI (Relative Strength Index). Він коливається у діапазоні від 0 до 100:
🔴 Перекупленість (RSI > 70):
Ціна зростала занадто швидко. Покупці виснажені, висока ймовірність відкату або корекції вниз.
👉 Не найкращий час для купівлі на споті.
🟢 Перепроданість (RSI < 30):
Монету активно продавали, ціна занадто впала. Продавці втрачають силу, можливий розворот вгору.
👉 Сигнал придивитися до точок входу.
💡 Порада: Не купуйте лише тому, що RSI < 30! Завжди шукайте підтвердження на рівні підтримки або за допомогою свічкових паттернів.
👇 Чи використовуєте ви RSI під час аналізу графіків?
#Binance #RSI #індикатори #аналіз #крипта
Як зрозуміти, що ринок "перегрітий" і ціна ось-ось почне падати, або навпаки — монета занадто впала й час купувати?
Для цього трейдери використовують осцилятор RSI (Relative Strength Index). Він коливається у діапазоні від 0 до 100:
🔴 Перекупленість (RSI > 70):
Ціна зростала занадто швидко. Покупці виснажені, висока ймовірність відкату або корекції вниз.
👉 Не найкращий час для купівлі на споті.
🟢 Перепроданість (RSI < 30):
Монету активно продавали, ціна занадто впала. Продавці втрачають силу, можливий розворот вгору.
👉 Сигнал придивитися до точок входу.
💡 Порада: Не купуйте лише тому, що RSI < 30! Завжди шукайте підтвердження на рівні підтримки або за допомогою свічкових паттернів.
👇 Чи використовуєте ви RSI під час аналізу графіків?
#Binance #RSI #індикатори #аналіз #крипта
90

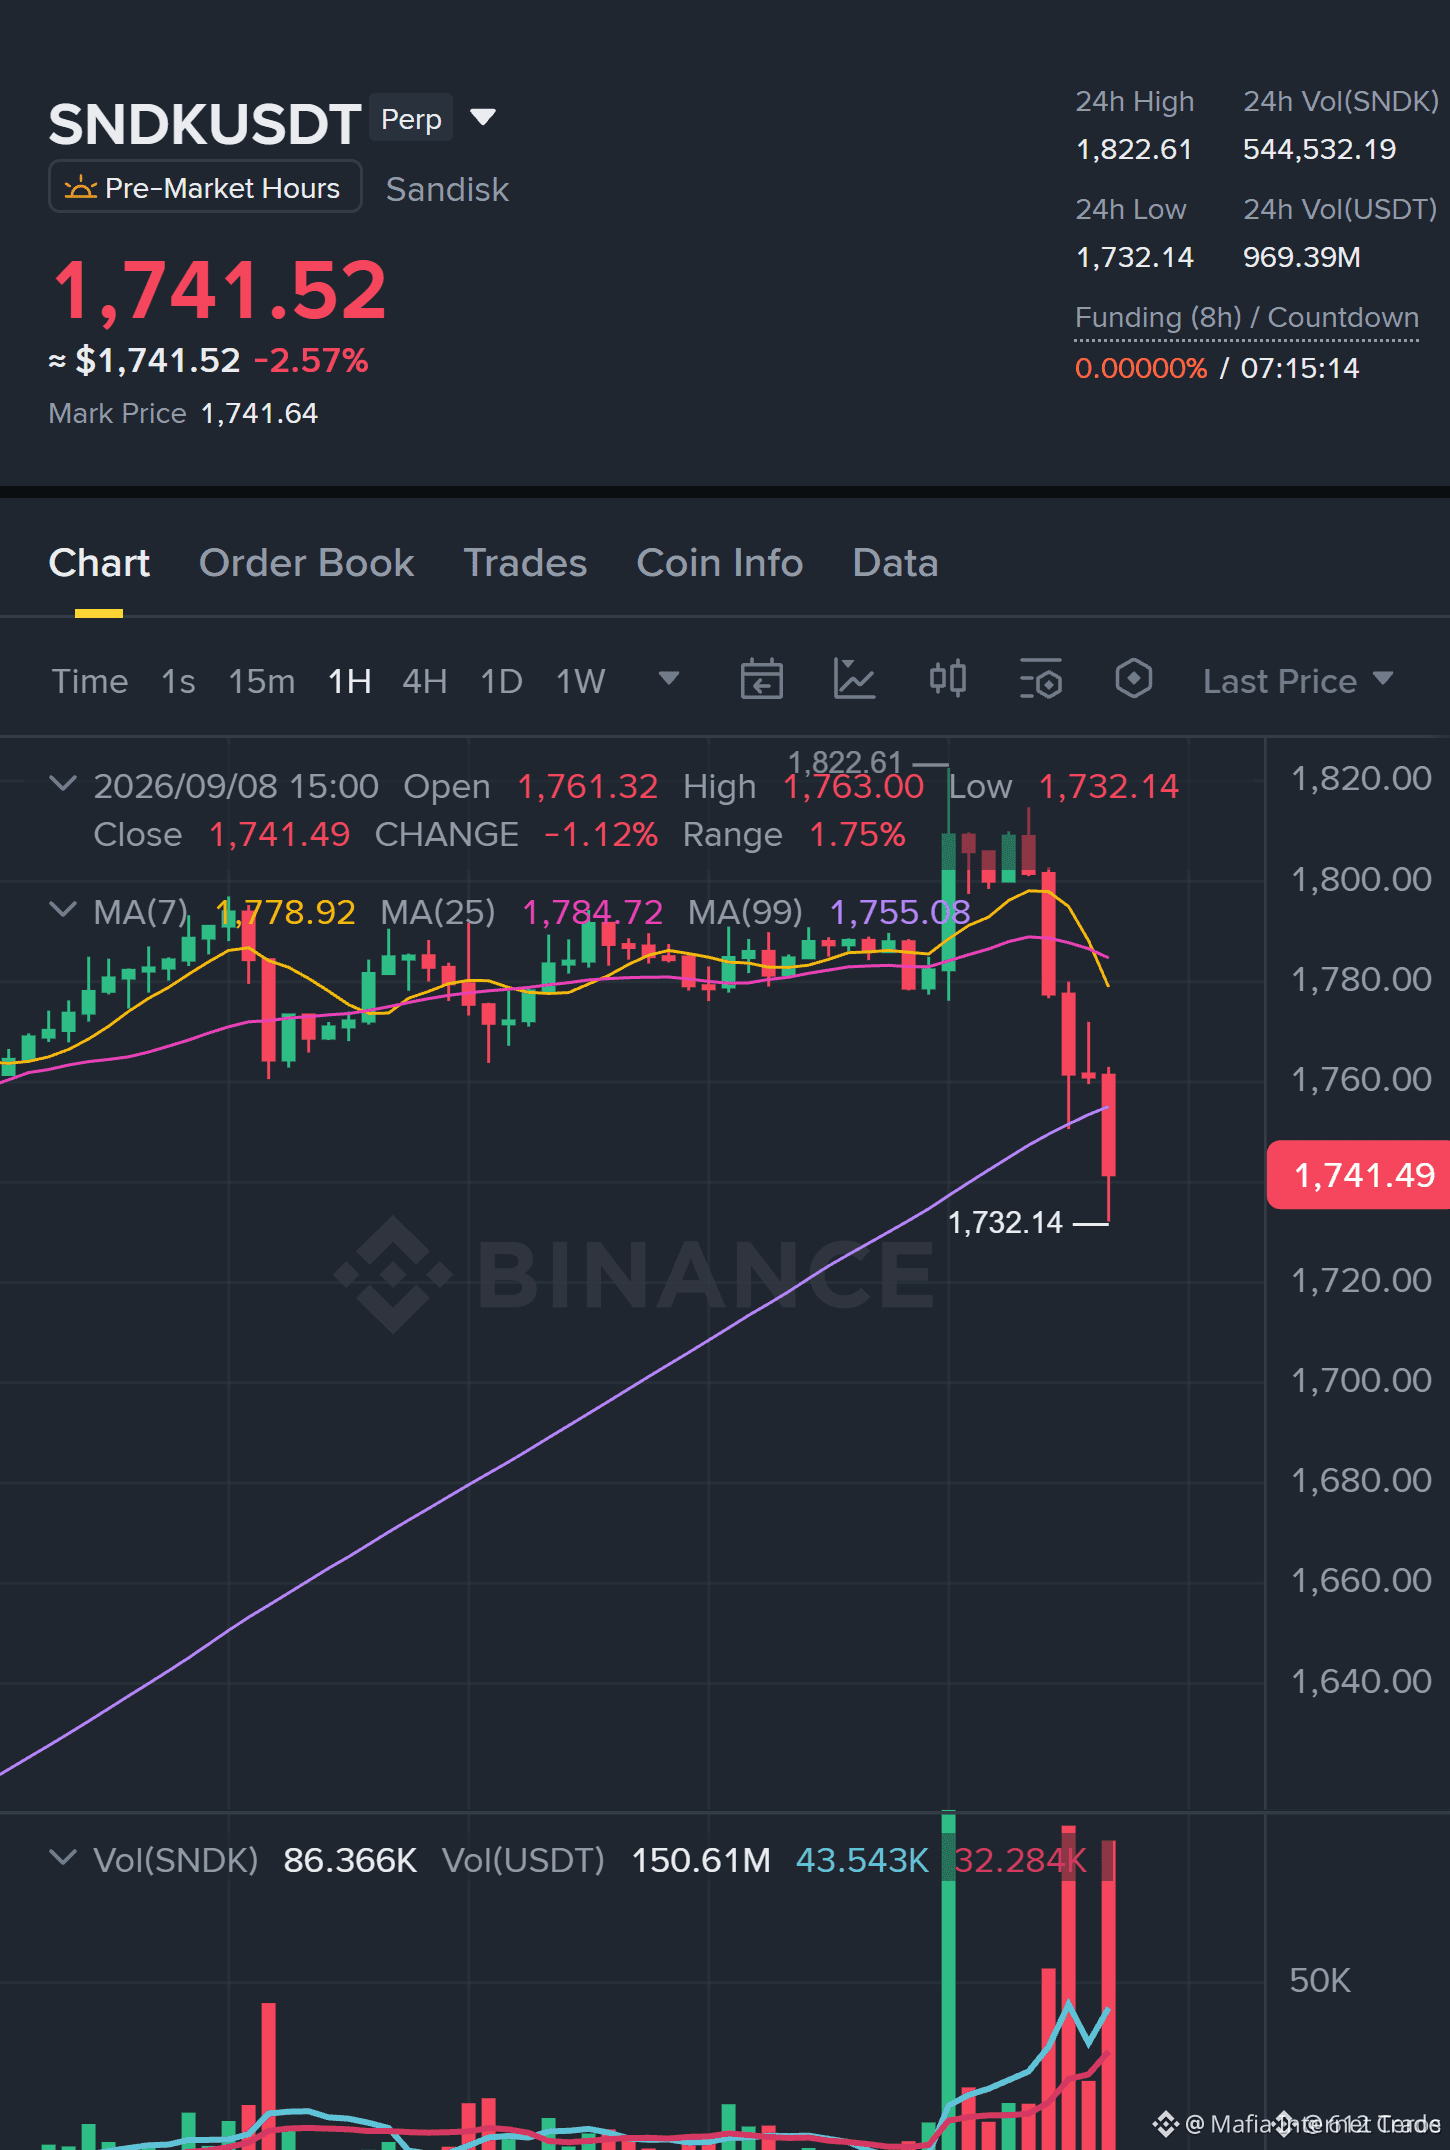
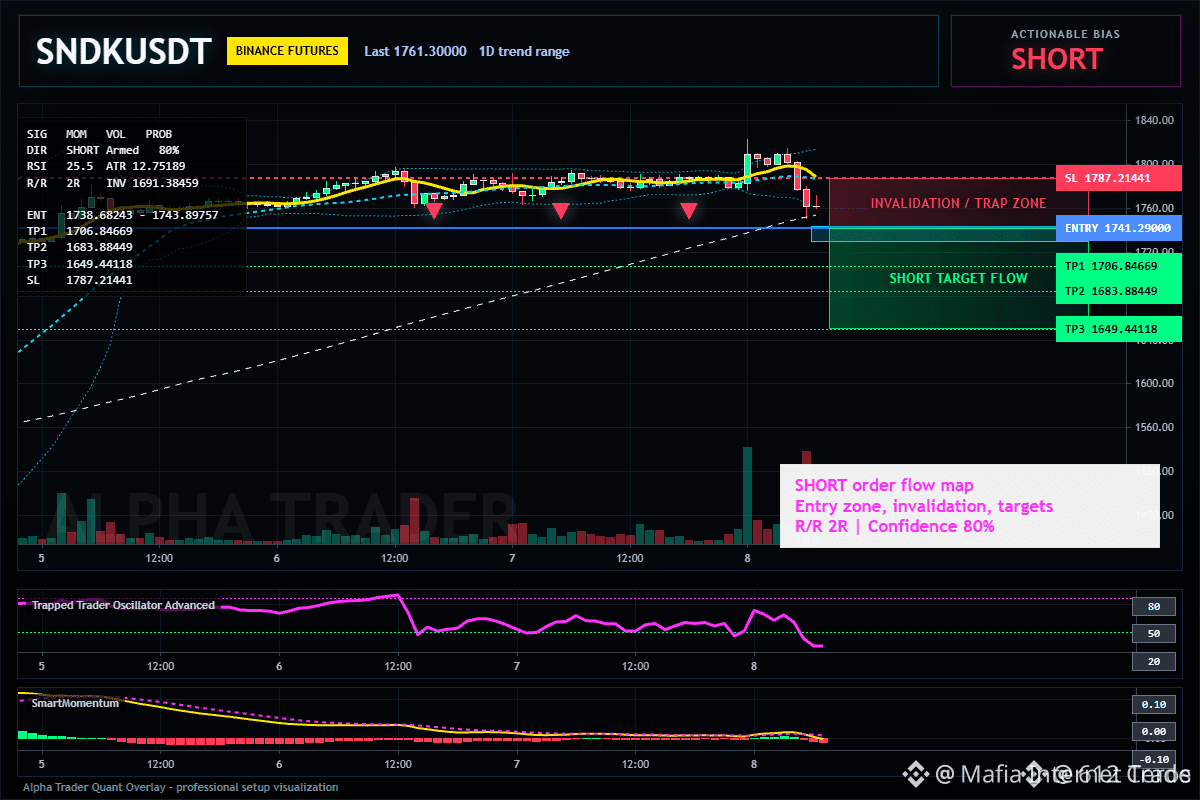
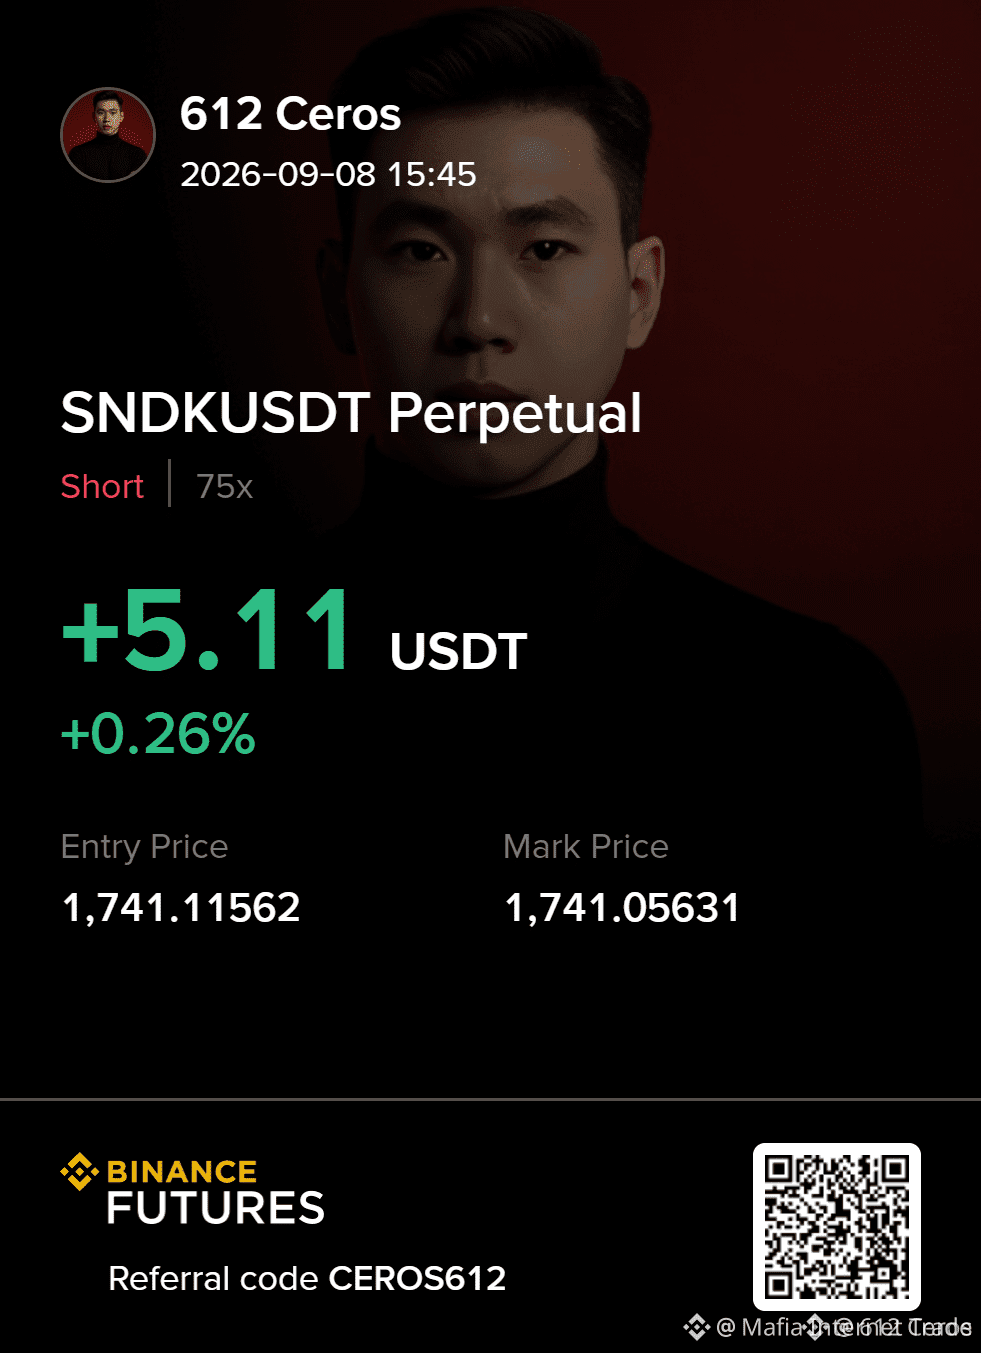
🚨 $SNDK RACES INTO DEEP OVERSOLD ZONE – SHORT ALERT! 🦈
Entry: 1738.68-1743.90 ⚡
Target: 1706.85 🚀
Stop Loss: 1787.21 ⚠️
📊 The 15‑minute RSI plunged to 25.5, flagging a severe downside stretch while the 1‑hour ATR spikes to 12.75, priming a violent wrench lower. 📈 Sellers are eyeing the tight 1741.29 zone, but the range‑bound daily backdrop sets the stage for a breakout‑driven swing. 🌊 If price respects the 1691.38 sandline, the trade fizzles; breach it, and we’re headed straight to TP2 or deeper.
💬 Are you ready to ride the short wave or waiting for the sandline to hold? 👇
⚠️ Not financial advice. Always manage your risk. 🛡️
🏷️ #SNDK #ShortSetup #RSI #Crypto
🔥 💎
🚨 $SNDK RACES INTO DEEP OVERSOLD ZONE – SHORT ALERT! 🦈
Entry: 1738.68-1743.90 ⚡
Target: 1706.85 🚀
Stop Loss: 1787.21 ⚠️
📊 The 15‑minute RSI plunged to 25.5, flagging a severe downside stretch while the 1‑hour ATR spikes to 12.75, priming a violent wrench lower. 📈 Sellers are eyeing the tight 1741.29 zone, but the range‑bound daily backdrop sets the stage for a breakout‑driven swing. 🌊 If price respects the 1691.38 sandline, the trade fizzles; breach it, and we’re headed straight to TP2 or deeper.
💬 Are you ready to ride the short wave or waiting for the sandline to hold? 👇
⚠️ Not financial advice. Always manage your risk. 🛡️
🏷️ #SNDK #ShortSetup #RSI #Crypto
🔥 💎
Entry: 1738.68-1743.90 ⚡
Target: 1706.85 🚀
Stop Loss: 1787.21 ⚠️
📊 The 15‑minute RSI plunged to 25.5, flagging a severe downside stretch while the 1‑hour ATR spikes to 12.75, priming a violent wrench lower. 📈 Sellers are eyeing the tight 1741.29 zone, but the range‑bound daily backdrop sets the stage for a breakout‑driven swing. 🌊 If price respects the 1691.38 sandline, the trade fizzles; breach it, and we’re headed straight to TP2 or deeper.
💬 Are you ready to ride the short wave or waiting for the sandline to hold? 👇
⚠️ Not financial advice. Always manage your risk. 🛡️
🏷️ #SNDK #ShortSetup #RSI #Crypto
🔥 💎
169

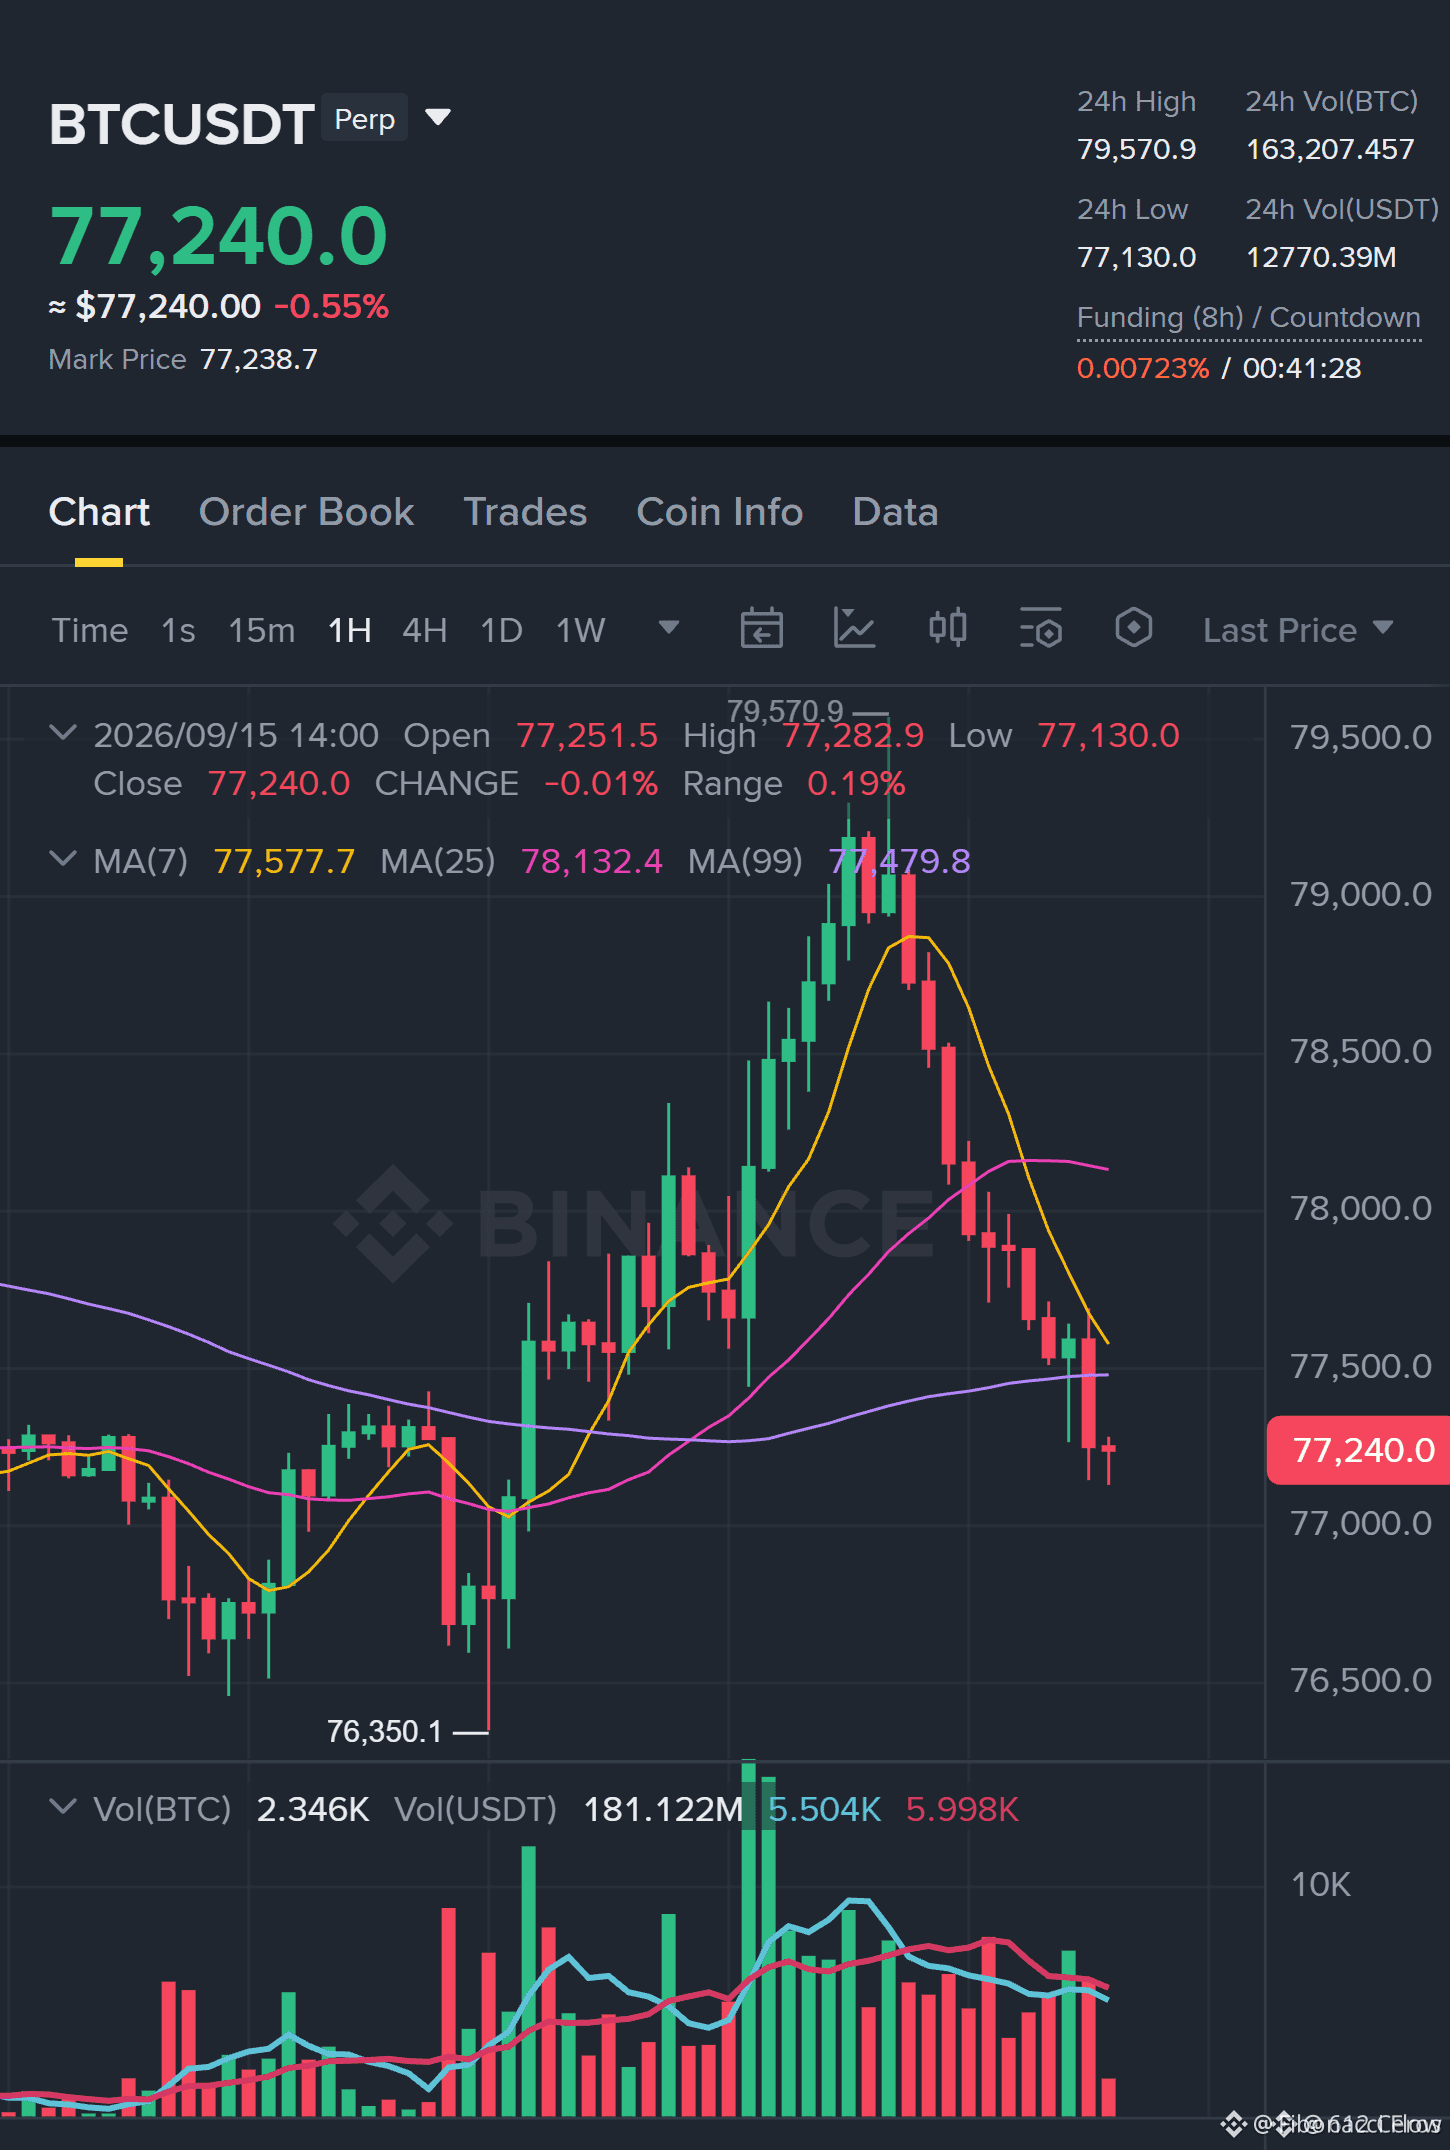
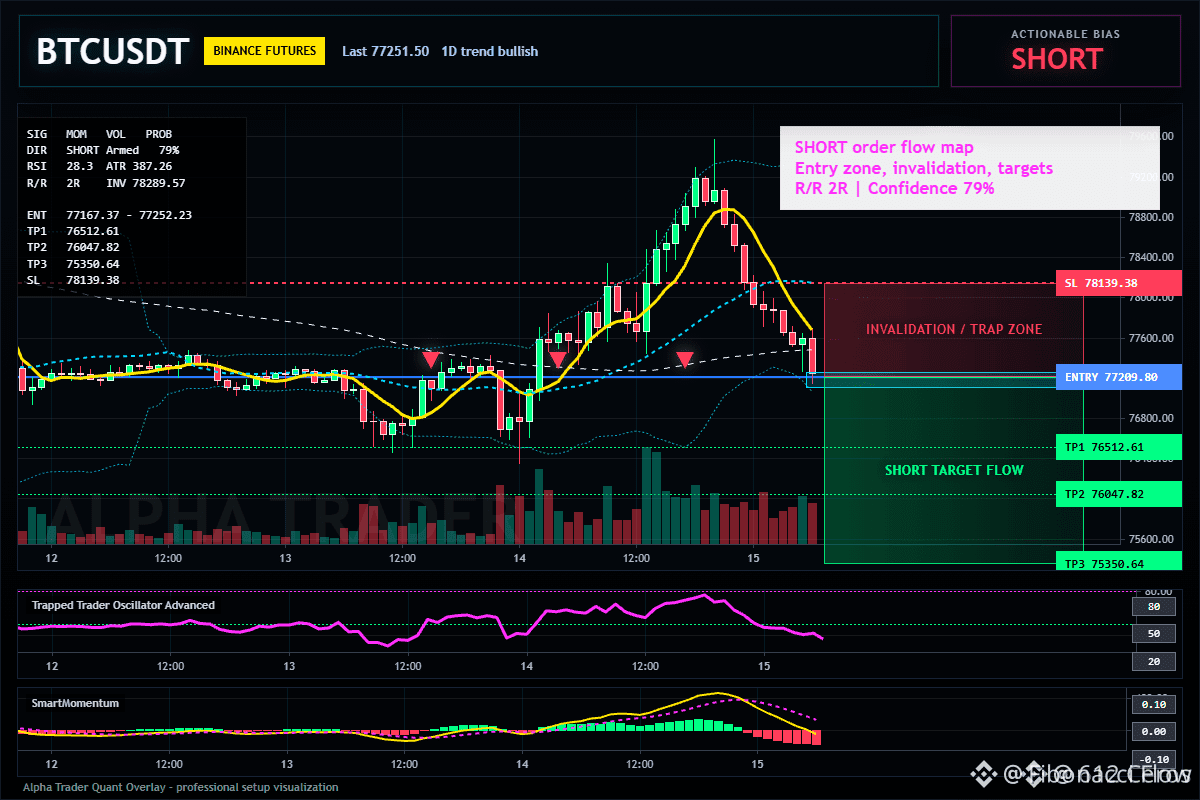
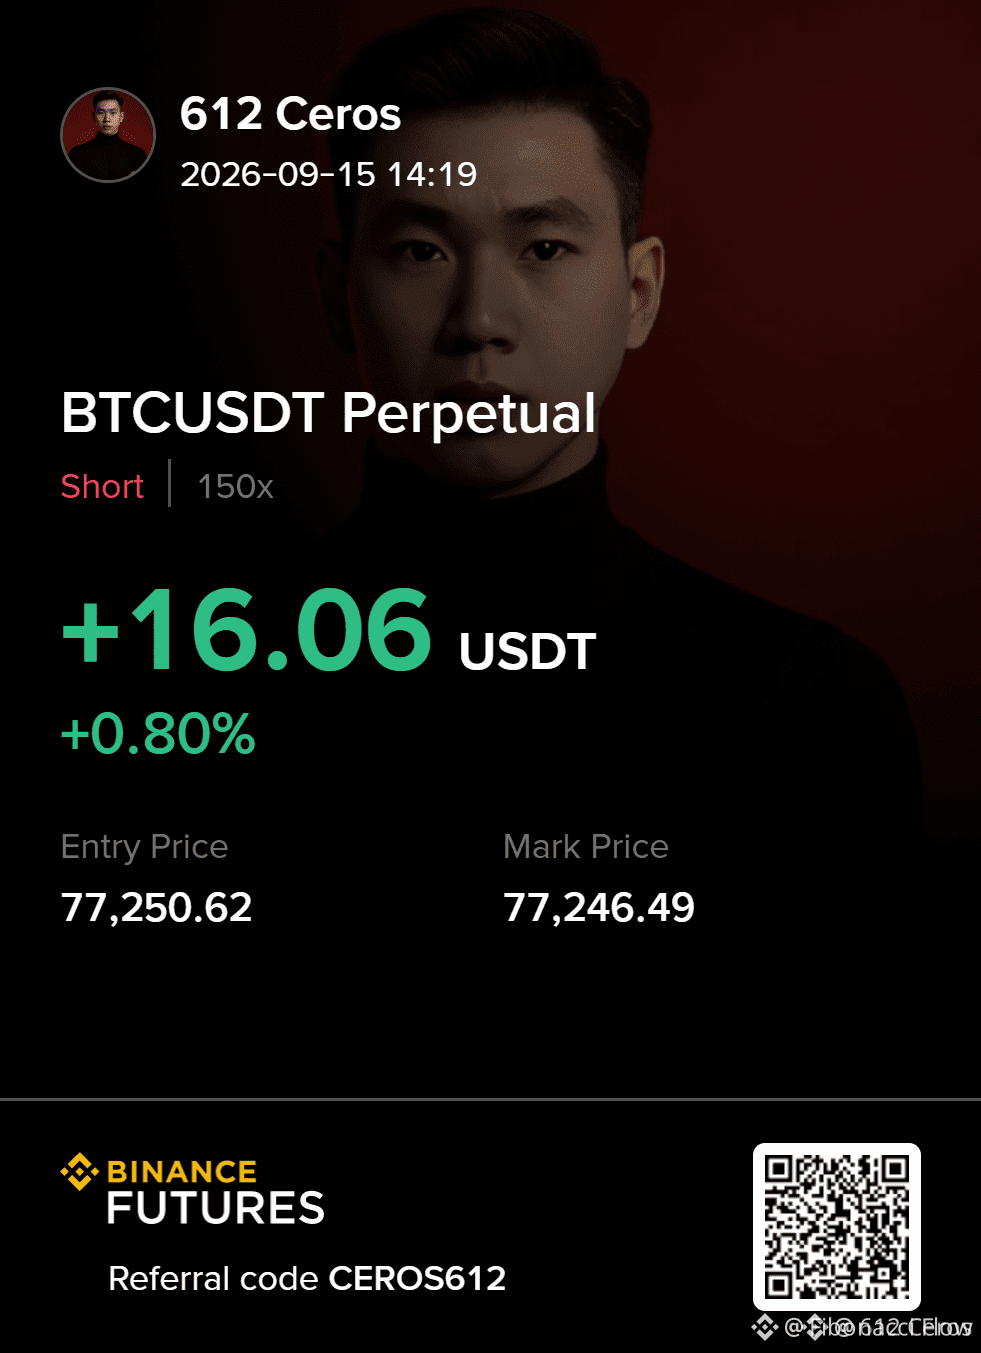
🐻 $BTC 1H SHORT ENTRY ZONE TRAPS BULLS AS RSI EXHAUSTS 🔴
Entry: 77167.37 - 77252.23 ⚡
Target: 76512.61 🚀
Target: 76047.82 🚀
Target: 75350.64 🚀
Stop Loss: 78139.38 ⚠️
The 1h chart throws $BTC straight into a short entry zone while the daily trend still paints green 📊. This isn’t a rebel counter-trend bet — it’s a volatility-driven directional short backed by a 1h ATR of 387 signaling room to run 📌.
15m RSI collapsing to 28.25 reveals buyer exhaustion right as price taps 77209.80 inside the kill box ⚡. Smart money will watch the hard invalidation at 78289.57, but our stop sits tighter at 78139.38 to protect capital 🛡️.
💬 Are you fading the daily bull or waiting for a deeper liquidity sweep before entry?
⚠️ Not financial advice. Always manage your risk. 🛡️
🏷️ #BTC #ShortSetup #RSI #Crypto
🐻 🔻
🐻 $BTC 1H SHORT ENTRY ZONE TRAPS BULLS AS RSI EXHAUSTS 🔴
Entry: 77167.37 - 77252.23 ⚡
Target: 76512.61 🚀
Target: 76047.82 🚀
Target: 75350.64 🚀
Stop Loss: 78139.38 ⚠️
The 1h chart throws $BTC straight into a short entry zone while the daily trend still paints green 📊. This isn’t a rebel counter-trend bet — it’s a volatility-driven directional short backed by a 1h ATR of 387 signaling room to run 📌.
15m RSI collapsing to 28.25 reveals buyer exhaustion right as price taps 77209.80 inside the kill box ⚡. Smart money will watch the hard invalidation at 78289.57, but our stop sits tighter at 78139.38 to protect capital 🛡️.
💬 Are you fading the daily bull or waiting for a deeper liquidity sweep before entry?
⚠️ Not financial advice. Always manage your risk. 🛡️
🏷️ #BTC #ShortSetup #RSI #Crypto
🐻 🔻
Entry: 77167.37 - 77252.23 ⚡
Target: 76512.61 🚀
Target: 76047.82 🚀
Target: 75350.64 🚀
Stop Loss: 78139.38 ⚠️
The 1h chart throws $BTC straight into a short entry zone while the daily trend still paints green 📊. This isn’t a rebel counter-trend bet — it’s a volatility-driven directional short backed by a 1h ATR of 387 signaling room to run 📌.
15m RSI collapsing to 28.25 reveals buyer exhaustion right as price taps 77209.80 inside the kill box ⚡. Smart money will watch the hard invalidation at 78289.57, but our stop sits tighter at 78139.38 to protect capital 🛡️.
💬 Are you fading the daily bull or waiting for a deeper liquidity sweep before entry?
⚠️ Not financial advice. Always manage your risk. 🛡️
🏷️ #BTC #ShortSetup #RSI #Crypto
🐻 🔻
32
·
--
🚨 هل بدأ التصحيح في $BR؟
وصل RSI على إطار الساعة إلى 90.6، وهي منطقة تشبع شرائي شديدة.
ولا توجد حتى الآن إشارة رفض علوية قوية، لذلك يبقى التأكيد مهماً.
📊 درجة احتمال التصحيح أو الهبوط: 52%
راقب القمة الحالية وانتظر إشارة هبوط واضحة مع إدارة المخاطرة.
قد يواصل السعر الصعود مؤقتاً، لذلك لا يُفضّل البيع مباشرة. التأكيد الأفضل يكون عند ظهور بوادر الهبوط.
السعر وقت الرصد: 0.37107
👈 اضغط على $BR لمتابعة العملة
صياد السمك
تنبيه: درجة الاحتمال تقديرية وليست ضماناً لحركة السعر.
$BR #BR #RSI #Futures #BinanceSquare
🚨 هل بدأ التصحيح في $BR ؟
وصل RSI على إطار الساعة إلى 90.6، وهي منطقة تشبع شرائي شديدة.
ولا توجد حتى الآن إشارة رفض علوية قوية، لذلك يبقى التأكيد مهماً.
📊 درجة احتمال التصحيح أو الهبوط: 52%
راقب القمة الحالية وانتظر إشارة هبوط واضحة مع إدارة المخاطرة.
قد يواصل السعر الصعود مؤقتاً، لذلك لا يُفضّل البيع مباشرة. التأكيد الأفضل يكون عند ظهور بوادر الهبوط.
السعر وقت الرصد: 0.37107
👈 اضغط على $BR لمتابعة العملة
صياد السمك
تنبيه: درجة الاحتمال تقديرية وليست ضماناً لحركة السعر.
$BR #BR #RSI #Futures #BinanceSquare
وصل RSI على إطار الساعة إلى 90.6، وهي منطقة تشبع شرائي شديدة.
ولا توجد حتى الآن إشارة رفض علوية قوية، لذلك يبقى التأكيد مهماً.
📊 درجة احتمال التصحيح أو الهبوط: 52%
راقب القمة الحالية وانتظر إشارة هبوط واضحة مع إدارة المخاطرة.
قد يواصل السعر الصعود مؤقتاً، لذلك لا يُفضّل البيع مباشرة. التأكيد الأفضل يكون عند ظهور بوادر الهبوط.
السعر وقت الرصد: 0.37107
👈 اضغط على $BR لمتابعة العملة
صياد السمك
تنبيه: درجة الاحتمال تقديرية وليست ضماناً لحركة السعر.
$BR #BR #RSI #Futures #BinanceSquare
140
·
--
📊 قراءة فنية سريعة لعملة $POWER
• RSI على الساعة: 90.3
• السعر وقت الرصد: 0.10525
• حالة السوق: تشبع شرائي شديد
• درجة احتمال التصحيح أو الهبوط: 71%
ولا توجد حتى الآن إشارة رفض علوية قوية، لذلك يبقى التأكيد مهماً.
قد يواصل السعر الصعود مؤقتاً، لذلك لا يُفضّل البيع مباشرة. التأكيد الأفضل يكون عند ظهور بوادر الهبوط.
السعر وقت الرصد: 0.10525
👈 اضغط على $POWER لمتابعة العملة
صياد السمك
تنبيه: درجة الاحتمال تقديرية وليست ضماناً لحركة السعر.
$POWER #POWER #RSI #Futures #BinanceSquare
📊 قراءة فنية سريعة لعملة $POWER
• RSI على الساعة: 90.3
• السعر وقت الرصد: 0.10525
• حالة السوق: تشبع شرائي شديد
• درجة احتمال التصحيح أو الهبوط: 71%
ولا توجد حتى الآن إشارة رفض علوية قوية، لذلك يبقى التأكيد مهماً.
قد يواصل السعر الصعود مؤقتاً، لذلك لا يُفضّل البيع مباشرة. التأكيد الأفضل يكون عند ظهور بوادر الهبوط.
السعر وقت الرصد: 0.10525
👈 اضغط على $POWER لمتابعة العملة
صياد السمك
تنبيه: درجة الاحتمال تقديرية وليست ضماناً لحركة السعر.
$POWER #POWER #RSI #Futures #BinanceSquare
• RSI على الساعة: 90.3
• السعر وقت الرصد: 0.10525
• حالة السوق: تشبع شرائي شديد
• درجة احتمال التصحيح أو الهبوط: 71%
ولا توجد حتى الآن إشارة رفض علوية قوية، لذلك يبقى التأكيد مهماً.
قد يواصل السعر الصعود مؤقتاً، لذلك لا يُفضّل البيع مباشرة. التأكيد الأفضل يكون عند ظهور بوادر الهبوط.
السعر وقت الرصد: 0.10525
👈 اضغط على $POWER لمتابعة العملة
صياد السمك
تنبيه: درجة الاحتمال تقديرية وليست ضماناً لحركة السعر.
$POWER #POWER #RSI #Futures #BinanceSquare
211
Войдите, чтобы посмотреть больше материала
Присоединяйтесь к пользователям криптовалют по всему миру на Binance Square
⚡️ Получайте новейшую и полезную информацию о криптоактивах.
💬 Нам доверяет крупнейшая в мире криптобиржа.
👍 Получите достоверные аналитические данные от верифицированных создателей контента.
Эл. почта/номер телефона
В тренде
1
#BinanceKZ
Просмотров: 12,129
66 обсуждают
2
#EarningsSeason
Просмотров: 345,931
2,637 обсуждают
3
#BitwiseLaunchesFirstSpotNEARETF
Просмотров: 34,875
603 обсуждают
4
#USJobOpeningsFallToFiveMonthLow
Просмотров: 43,093
458 обсуждают
5
#ECBToTestAIAgentsInDigitalEuroPayments
Просмотров: 30,407
564 обсуждают
6
#JapanFSABacksFourthStablecoinTradeSettlementPilot
Просмотров: 35,102
597 обсуждают
7
#BitgetHackerFailsToMoveStolenFunds
Просмотров: 51,058
648 обсуждают
8
#BitMineETHHoldingsTop6Million
Просмотров: 40,849
727 обсуждают
9
#StrategyAdds1666BTCHoldingsReach847666
Просмотров: 33,073
506 обсуждают
10
#NvidiaApproves$150BBuyback
Просмотров: 5,748
76 обсуждают