
#priceprojections
priceprojections
Просмотров: 468,905
178 обсуждают
Популярные
Новые

·
--
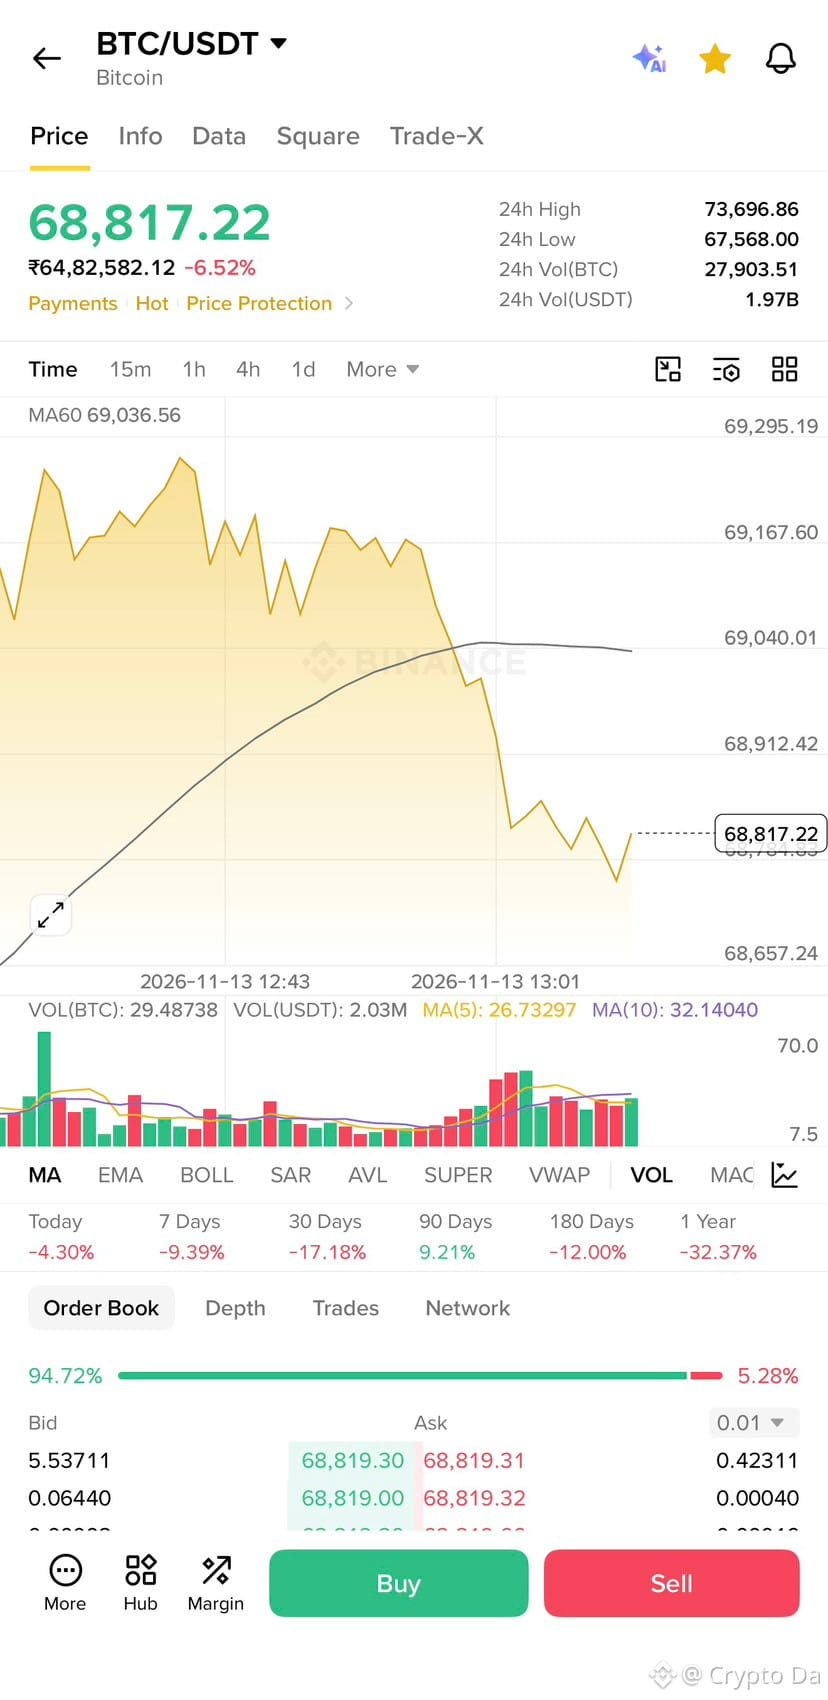
Bitcoin at support zone 68-65k if it breaks then next dupport is 59k .
#bitcoin $BTC
#Bitcoinhaving #MarketCrashOrBounce #PriceProjections #prediction ☹️
Bitcoin at support zone 68-65k if it breaks then next dupport is 59k .
#bitcoin $BTC
#Bitcoinhaving #MarketCrashOrBounce #PriceProjections #prediction ☹️
#bitcoin $BTC
#Bitcoinhaving #MarketCrashOrBounce #PriceProjections #prediction ☹️
58

Статья
### NVIDIA (NVDAB/USDT) – Complete market analysis and price 👇Worked for 14s
{future}(NVDAUSDT)
NVIDIA ($NVDA )
{spot}(NVDABUSDT)
Strong bearish technical signal
12 November 2026 · Based on your screenshot and current market news
Your Binance $NVDAB price
### 161.08 USDT
24-hour change
-8.31%
24-hour high 177.67
24-hour low 155.10
Previous chart high 243.35
### 1\. Technical analysis of your daily chart
Your indicators show a significant bearish trend.
| Indicator | Your value | Signal |
| ---------- | ---------- | -------------- |
| MA(7) | 175.36 | Bearish |
| MA(25) | 200.19 | Strong bearish |
| MA(99) | 217.67 | Strong bearish |
| Supertrend | 192.75 | Bearish |
Important observation: The price is below all four major trend indicators. The fall from 243.35 to 155.10 is substantial.
The green price movement near 161 could be an initial bounce, but it is not yet proof of a reversal.
### 2\. What is happening internationally?

NVIDIA leadership crisis
This is currently the biggest company-specific risk. Reuters reported on November 12 that Nvidia's board was considering Jensen Huang's future following reports concerning his personal relationships. No departure has been confirmed.
This uncertainty is damaging investor confidence. reuters.com +2

US-China chip restrictions
Baird downgraded Nvidia to Neutral and cut its target from $500 to $200, citing export restrictions and uncertainty about future AI demand. investing.com

US inflation and interest rates
Higher-than-expected inflation has increased expectations of another Federal Reserve rate increase. Higher rates can put pressure on expensive technology shares. reuters.com +1

AI industry
Despite the market decline, demand for AI computing remains substantial. This is an important long-term positive for Nvidia. investor.nvidia.com +1
### 3\. NVIDIA financial strength
The most important thing is to distinguish the company's business performance from its share-price performance.
Strong reported business results
Second-quarter FY2027 results
### $96.22 billion
Quarterly revenue · +106% year over year
| Financial indicator | Result |
| ----------------------------- | ---------- |
| Total revenue | $96.22B |
| Data-centre revenue | $89.0B |
| Net income (non-GAAP) | $53.95B |
| Gross margin (non-GAAP) | 75% |
| EPS (non-GAAP) | $2.22 |
| Next-quarter revenue guidance | $108B ± 2% |
Official NVIDIA results, August 26, 2026. investor.nvidia.com +1
My assessment: The business is still financially powerful. The current share-price weakness is not simply because Nvidia has stopped making money. Leadership uncertainty, valuation pressure, export restrictions and market sentiment are important contributors.
### 4\. Upcoming earnings – very important
17 November 2026
NVIDIA is scheduled to report its third-quarter FY2027 results on November 17.
This could be a major catalyst for the next price movement.
Three things I would watch:
* Whether revenue beats the approximately $108 billion guidance.
* Whether management provides strong future AI demand guidance.
* Whether the company gives investors clarity about leadership and governance.
A strong earnings report could trigger a sharp recovery. A disappointing outlook or further leadership uncertainty could cause another selloff. investor.nvidia.com +1
### 5\. Wall Street analyst predictions
Analyst opinions have become divided.
| Institution | Latest reported view |
| --------------- | -------------------- |
| Baird | Neutral, $200 |
| Bernstein | Market Perform, $200 |
| Stifel | Buy, $205 |
| Citi | Buy, $225 |
| Bank of America | Buy, $350 |
investing.com +3
Notice something important: several analysts have reduced their targets substantially, while others still see long-term upside.
These are underlying NVDA share targets, not direct Binance token targets. They are also subject to further revisions.
### 6\. NVIDIA live stock chart
NVIDIA Corp (NVDA)
### $173.73
-$20.95 (11.52%)
Nov 5, 2026 – Nov 12, 2026
$160.98
-$12.75
(7.34%)
After Hours
5D1M6MYTD1Y5YMAX
Open
-
Volume
16.2M
Market Cap
4.22T
Day Low
-
Year Low
164.27
EPS (TTM)
7.97
Day High
-
Year High
243.37
P/E Ratio
21.8
The underlying stock and Binance NVDAB token may differ slightly because of pricing, conversion and trading conditions.
### 7\. My NVIDIA price prediction
Scenario-based forecast
My estimates for the next 1–7 trading days, based on your chart and current news:
Bearish scenario
40%
### 140–155
If 155 support breaks, selling pressure could continue towards 150 and 140.
Sideways scenario
35%
### 155–175
Price stabilizes while the market waits for earnings and leadership news.
Bullish recovery
25%
### 175–193
A strong rebound could happen if leadership concerns ease and buyers return.
Subjective probabilities, not statistically validated forecasts or guarantees.
### 8\. Critical trading levels
| Price | Importance |
| ------ | ------------------------ |
| 140 | Lower downside target |
| 150 | Psychological support |
| 155.10 | Immediate major support |
| 161.08 | Current screenshot price |
| 175.36 | MA(7) resistance |
| 177.67 | 24-hour high |
| 183.77 | Next resistance |
| 192.75 | Supertrend resistance |
| 200.19 | MA(25) resistance |
My trading interpretation:
* Above 175: recovery begins to look stronger.
* Above 184: bullish momentum improves.
* Above 193: stronger reversal signal.
* Below 155: serious bearish warning.
* Below 150: further downside risk.
### 9\. Final verdict
### Short-term: BEARISH
### Long-term: FUNDAMENTALLY BULLISH
My preferred expectation is consolidation or another support test before a sustainable recovery.
I would not rush into buying at 161 simply because the price has dropped.
The November 17 earnings announcement and leadership developments are particularly important.
### 10\. Tell me your investment position
I want to calculate your actual risk and potential profit rather than give you generic targets.
Your NVDAB trading details
I already hold NVDAB
I want to buy now
I am waiting for a lower price
Entry price (USDT)
Number of tokens
Investment period
7 days
30 days
3 months
12 months
Calculate
my $NVIDIA strategy
I can also monitor NVIDIA's earnings, leadership news and important price levels every day.
Please remember: tokenized bStocks have issuer, liquidity and tracking risks in addition to the risks of the underlying stock. Never risk money you cannot afford to lose.#Binance #BTC走势分析 #moneymanagement #PriceProjections #prediction...
### NVIDIA (NVDAB/USDT) – Complete market analysis and price 👇
Worked for 14s
NVIDIA ($NVDA )
Strong bearish technical signal
12 November 2026 · Based on your screenshot and current market news
Your Binance $NVDAB price
### 161.08 USDT
24-hour change
-8.31%
24-hour high 177.67
24-hour low 155.10
Previous chart high 243.35
### 1\. Technical analysis of your daily chart
Your indicators show a significant bearish trend.
| Indicator | Your value | Signal |
| ---------- | ---------- | -------------- |
| MA(7) | 175.36 | Bearish |
| MA(25) | 200.19 | Strong bearish |
| MA(99) | 217.67 | Strong bearish |
| Supertrend | 192.75 | Bearish |
Important observation: The price is below all four major trend indicators. The fall from 243.35 to 155.10 is substantial.
The green price movement near 161 could be an initial bounce, but it is not yet proof of a reversal.
### 2\. What is happening internationally?

NVIDIA leadership crisis
This is currently the biggest company-specific risk. Reuters reported on November 12 that Nvidia's board was considering Jensen Huang's future following reports concerning his personal relationships. No departure has been confirmed.
This uncertainty is damaging investor confidence. reuters.com +2

US-China chip restrictions
Baird downgraded Nvidia to Neutral and cut its target from $500 to $200, citing export restrictions and uncertainty about future AI demand. investing.com

US inflation and interest rates
Higher-than-expected inflation has increased expectations of another Federal Reserve rate increase. Higher rates can put pressure on expensive technology shares. reuters.com +1

AI industry
Despite the market decline, demand for AI computing remains substantial. This is an important long-term positive for Nvidia. investor.nvidia.com +1
### 3\. NVIDIA financial strength
The most important thing is to distinguish the company's business performance from its share-price performance.
Strong reported business results
Second-quarter FY2027 results
### $96.22 billion
Quarterly revenue · +106% year over year
| Financial indicator | Result |
| ----------------------------- | ---------- |
| Total revenue | $96.22B |
| Data-centre revenue | $89.0B |
| Net income (non-GAAP) | $53.95B |
| Gross margin (non-GAAP) | 75% |
| EPS (non-GAAP) | $2.22 |
| Next-quarter revenue guidance | $108B ± 2% |
Official NVIDIA results, August 26, 2026. investor.nvidia.com +1
My assessment: The business is still financially powerful. The current share-price weakness is not simply because Nvidia has stopped making money. Leadership uncertainty, valuation pressure, export restrictions and market sentiment are important contributors.
### 4\. Upcoming earnings – very important
17 November 2026
NVIDIA is scheduled to report its third-quarter FY2027 results on November 17.
This could be a major catalyst for the next price movement.
Three things I would watch:
* Whether revenue beats the approximately $108 billion guidance.
* Whether management provides strong future AI demand guidance.
* Whether the company gives investors clarity about leadership and governance.
A strong earnings report could trigger a sharp recovery. A disappointing outlook or further leadership uncertainty could cause another selloff. investor.nvidia.com +1
### 5\. Wall Street analyst predictions
Analyst opinions have become divided.
| Institution | Latest reported view |
| --------------- | -------------------- |
| Baird | Neutral, $200 |
| Bernstein | Market Perform, $200 |
| Stifel | Buy, $205 |
| Citi | Buy, $225 |
| Bank of America | Buy, $350 |
investing.com +3
Notice something important: several analysts have reduced their targets substantially, while others still see long-term upside.
These are underlying NVDA share targets, not direct Binance token targets. They are also subject to further revisions.
### 6\. NVIDIA live stock chart
NVIDIA Corp (NVDA)
### $173.73
-$20.95 (11.52%)
Nov 5, 2026 – Nov 12, 2026
$160.98
-$12.75
(7.34%)
After Hours
5D1M6MYTD1Y5YMAX
Open
-
Volume
16.2M
Market Cap
4.22T
Day Low
-
Year Low
164.27
EPS (TTM)
7.97
Day High
-
Year High
243.37
P/E Ratio
21.8
The underlying stock and Binance NVDAB token may differ slightly because of pricing, conversion and trading conditions.
### 7\. My NVIDIA price prediction
Scenario-based forecast
My estimates for the next 1–7 trading days, based on your chart and current news:
Bearish scenario
40%
### 140–155
If 155 support breaks, selling pressure could continue towards 150 and 140.
Sideways scenario
35%
### 155–175
Price stabilizes while the market waits for earnings and leadership news.
Bullish recovery
25%
### 175–193
A strong rebound could happen if leadership concerns ease and buyers return.
Subjective probabilities, not statistically validated forecasts or guarantees.
### 8\. Critical trading levels
| Price | Importance |
| ------ | ------------------------ |
| 140 | Lower downside target |
| 150 | Psychological support |
| 155.10 | Immediate major support |
| 161.08 | Current screenshot price |
| 175.36 | MA(7) resistance |
| 177.67 | 24-hour high |
| 183.77 | Next resistance |
| 192.75 | Supertrend resistance |
| 200.19 | MA(25) resistance |
My trading interpretation:
* Above 175: recovery begins to look stronger.
* Above 184: bullish momentum improves.
* Above 193: stronger reversal signal.
* Below 155: serious bearish warning.
* Below 150: further downside risk.
### 9\. Final verdict
### Short-term: BEARISH
### Long-term: FUNDAMENTALLY BULLISH
My preferred expectation is consolidation or another support test before a sustainable recovery.
I would not rush into buying at 161 simply because the price has dropped.
The November 17 earnings announcement and leadership developments are particularly important.
### 10\. Tell me your investment position
I want to calculate your actual risk and potential profit rather than give you generic targets.
Your NVDAB trading details
I already hold NVDAB
I want to buy now
I am waiting for a lower price
Entry price (USDT)
Number of tokens
Investment period
7 days
30 days
3 months
12 months
Calculate
my $NVIDIA strategy
I can also monitor NVIDIA's earnings, leadership news and important price levels every day.
Please remember: tokenized bStocks have issuer, liquidity and tracking risks in addition to the risks of the underlying stock. Never risk money you cannot afford to lose.#Binance #BTC走势分析 #moneymanagement #PriceProjections #prediction...
NVIDIA ($NVDA )
Strong bearish technical signal
12 November 2026 · Based on your screenshot and current market news
Your Binance $NVDAB price
### 161.08 USDT
24-hour change
-8.31%
24-hour high 177.67
24-hour low 155.10
Previous chart high 243.35
### 1\. Technical analysis of your daily chart
Your indicators show a significant bearish trend.
| Indicator | Your value | Signal |
| ---------- | ---------- | -------------- |
| MA(7) | 175.36 | Bearish |
| MA(25) | 200.19 | Strong bearish |
| MA(99) | 217.67 | Strong bearish |
| Supertrend | 192.75 | Bearish |
Important observation: The price is below all four major trend indicators. The fall from 243.35 to 155.10 is substantial.
The green price movement near 161 could be an initial bounce, but it is not yet proof of a reversal.
### 2\. What is happening internationally?

NVIDIA leadership crisis
This is currently the biggest company-specific risk. Reuters reported on November 12 that Nvidia's board was considering Jensen Huang's future following reports concerning his personal relationships. No departure has been confirmed.
This uncertainty is damaging investor confidence. reuters.com +2

US-China chip restrictions
Baird downgraded Nvidia to Neutral and cut its target from $500 to $200, citing export restrictions and uncertainty about future AI demand. investing.com

US inflation and interest rates
Higher-than-expected inflation has increased expectations of another Federal Reserve rate increase. Higher rates can put pressure on expensive technology shares. reuters.com +1

AI industry
Despite the market decline, demand for AI computing remains substantial. This is an important long-term positive for Nvidia. investor.nvidia.com +1
### 3\. NVIDIA financial strength
The most important thing is to distinguish the company's business performance from its share-price performance.
Strong reported business results
Second-quarter FY2027 results
### $96.22 billion
Quarterly revenue · +106% year over year
| Financial indicator | Result |
| ----------------------------- | ---------- |
| Total revenue | $96.22B |
| Data-centre revenue | $89.0B |
| Net income (non-GAAP) | $53.95B |
| Gross margin (non-GAAP) | 75% |
| EPS (non-GAAP) | $2.22 |
| Next-quarter revenue guidance | $108B ± 2% |
Official NVIDIA results, August 26, 2026. investor.nvidia.com +1
My assessment: The business is still financially powerful. The current share-price weakness is not simply because Nvidia has stopped making money. Leadership uncertainty, valuation pressure, export restrictions and market sentiment are important contributors.
### 4\. Upcoming earnings – very important
17 November 2026
NVIDIA is scheduled to report its third-quarter FY2027 results on November 17.
This could be a major catalyst for the next price movement.
Three things I would watch:
* Whether revenue beats the approximately $108 billion guidance.
* Whether management provides strong future AI demand guidance.
* Whether the company gives investors clarity about leadership and governance.
A strong earnings report could trigger a sharp recovery. A disappointing outlook or further leadership uncertainty could cause another selloff. investor.nvidia.com +1
### 5\. Wall Street analyst predictions
Analyst opinions have become divided.
| Institution | Latest reported view |
| --------------- | -------------------- |
| Baird | Neutral, $200 |
| Bernstein | Market Perform, $200 |
| Stifel | Buy, $205 |
| Citi | Buy, $225 |
| Bank of America | Buy, $350 |
investing.com +3
Notice something important: several analysts have reduced their targets substantially, while others still see long-term upside.
These are underlying NVDA share targets, not direct Binance token targets. They are also subject to further revisions.
### 6\. NVIDIA live stock chart
NVIDIA Corp (NVDA)
### $173.73
-$20.95 (11.52%)
Nov 5, 2026 – Nov 12, 2026
$160.98
-$12.75
(7.34%)
After Hours
5D1M6MYTD1Y5YMAX
Open
-
Volume
16.2M
Market Cap
4.22T
Day Low
-
Year Low
164.27
EPS (TTM)
7.97
Day High
-
Year High
243.37
P/E Ratio
21.8
The underlying stock and Binance NVDAB token may differ slightly because of pricing, conversion and trading conditions.
### 7\. My NVIDIA price prediction
Scenario-based forecast
My estimates for the next 1–7 trading days, based on your chart and current news:
Bearish scenario
40%
### 140–155
If 155 support breaks, selling pressure could continue towards 150 and 140.
Sideways scenario
35%
### 155–175
Price stabilizes while the market waits for earnings and leadership news.
Bullish recovery
25%
### 175–193
A strong rebound could happen if leadership concerns ease and buyers return.
Subjective probabilities, not statistically validated forecasts or guarantees.
### 8\. Critical trading levels
| Price | Importance |
| ------ | ------------------------ |
| 140 | Lower downside target |
| 150 | Psychological support |
| 155.10 | Immediate major support |
| 161.08 | Current screenshot price |
| 175.36 | MA(7) resistance |
| 177.67 | 24-hour high |
| 183.77 | Next resistance |
| 192.75 | Supertrend resistance |
| 200.19 | MA(25) resistance |
My trading interpretation:
* Above 175: recovery begins to look stronger.
* Above 184: bullish momentum improves.
* Above 193: stronger reversal signal.
* Below 155: serious bearish warning.
* Below 150: further downside risk.
### 9\. Final verdict
### Short-term: BEARISH
### Long-term: FUNDAMENTALLY BULLISH
My preferred expectation is consolidation or another support test before a sustainable recovery.
I would not rush into buying at 161 simply because the price has dropped.
The November 17 earnings announcement and leadership developments are particularly important.
### 10\. Tell me your investment position
I want to calculate your actual risk and potential profit rather than give you generic targets.
Your NVDAB trading details
I already hold NVDAB
I want to buy now
I am waiting for a lower price
Entry price (USDT)
Number of tokens
Investment period
7 days
30 days
3 months
12 months
Calculate
my $NVIDIA strategy
I can also monitor NVIDIA's earnings, leadership news and important price levels every day.
Please remember: tokenized bStocks have issuer, liquidity and tracking risks in addition to the risks of the underlying stock. Never risk money you cannot afford to lose.#Binance #BTC走势分析 #moneymanagement #PriceProjections #prediction...
157

·
--
Рост
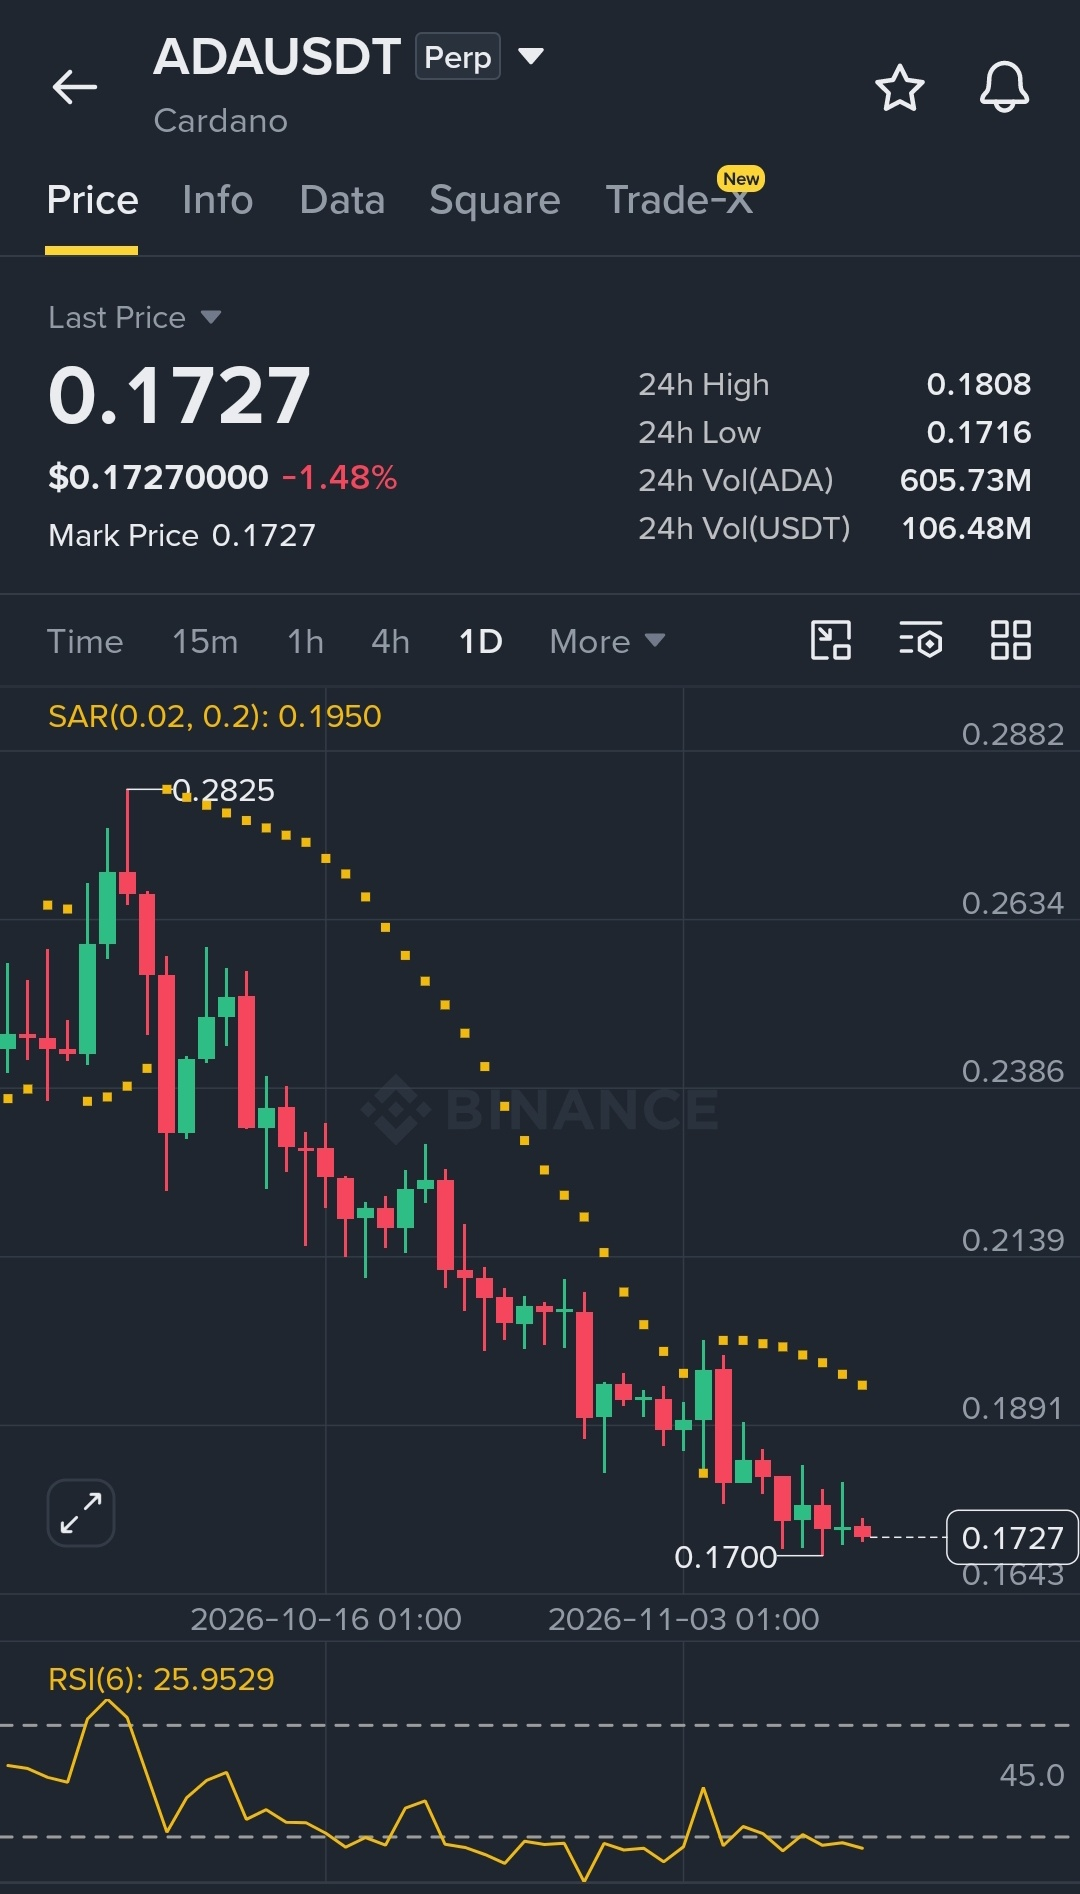
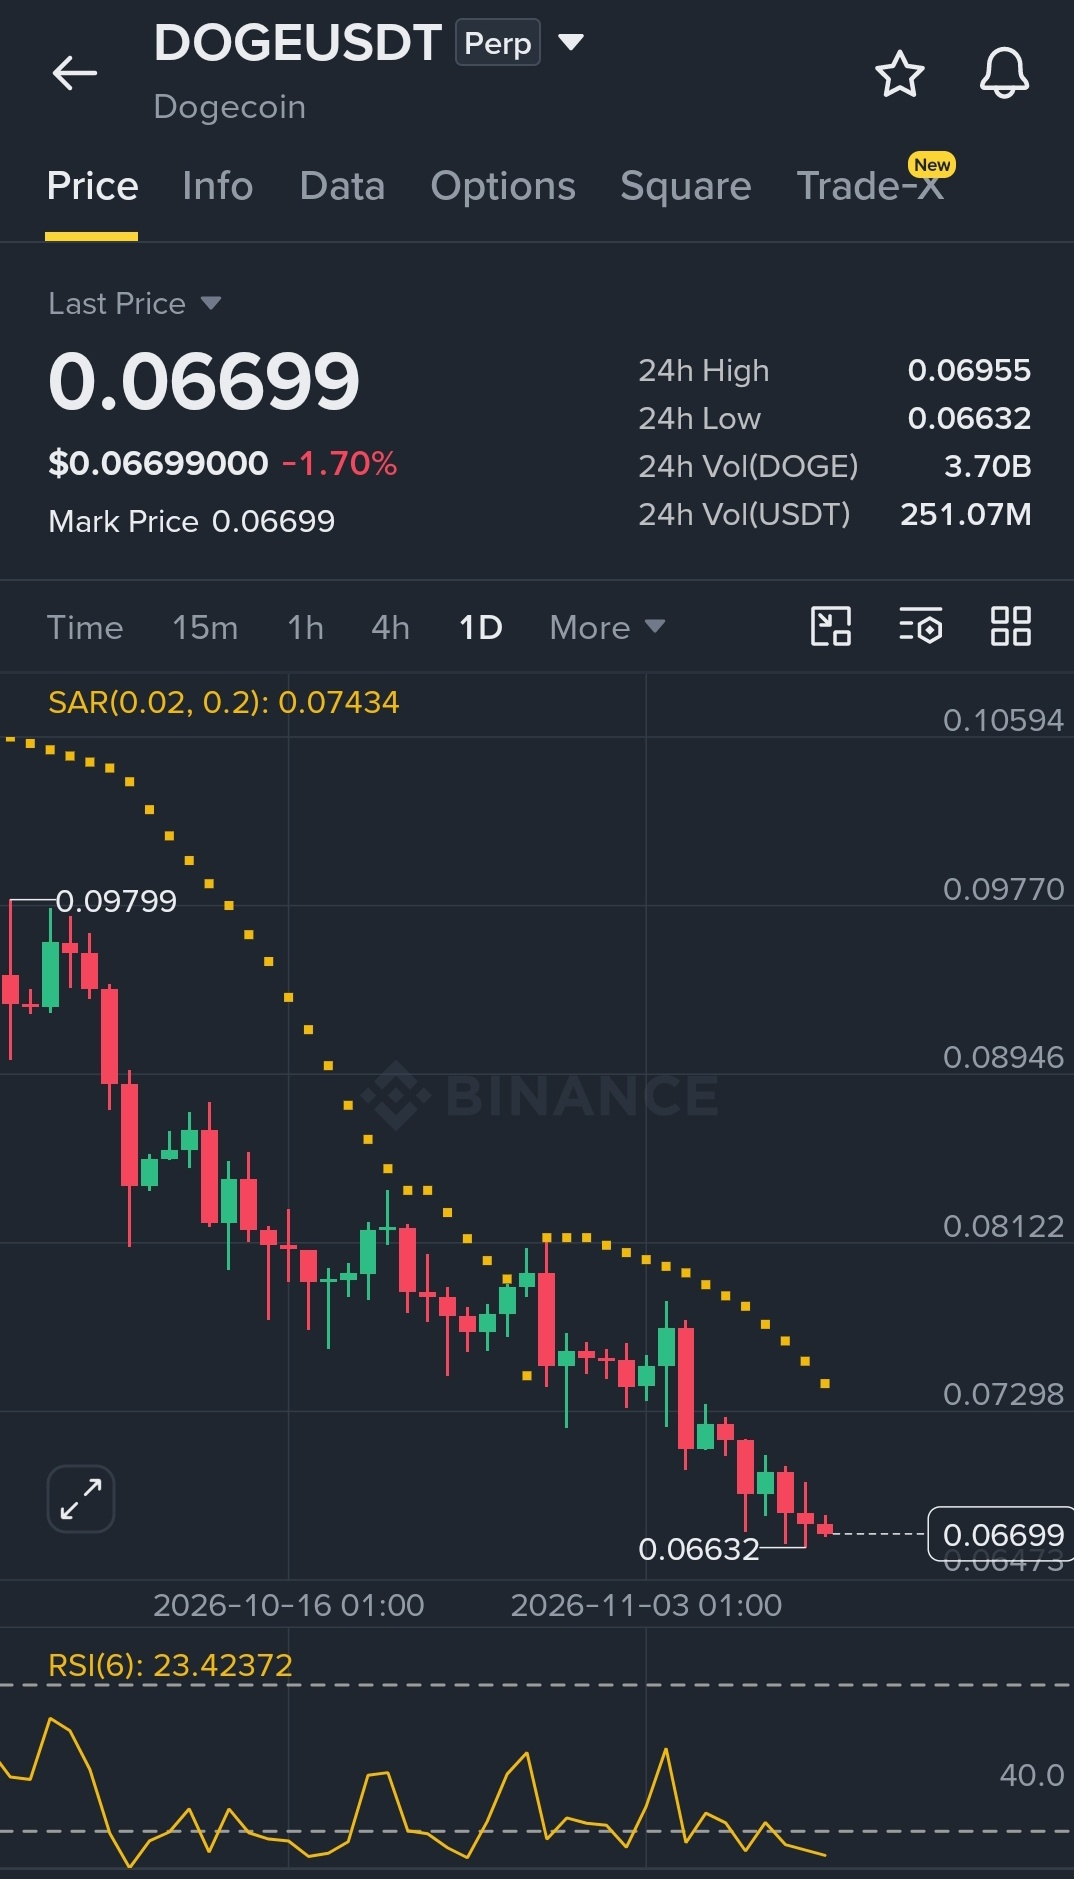
$ADA | $SOL | $DOGE set for a massive pump?👀🚀
Their charts📊 are already showing the same pattern. I hope these coins brings in massive profit🤑 before the week ends.
Massive pump incoming 🚀
DYOR - Protect your capital 👌
#PriceProjections
{future}(ADAUSDT)
{future}(SOLUSDT)
{future}(DOGEUSDT)
$ADA | $SOL | $DOGE set for a massive pump?👀🚀
Their charts📊 are already showing the same pattern. I hope these coins brings in massive profit🤑 before the week ends.
Massive pump incoming 🚀
DYOR - Protect your capital 👌
#PriceProjections
Their charts📊 are already showing the same pattern. I hope these coins brings in massive profit🤑 before the week ends.
Massive pump incoming 🚀
DYOR - Protect your capital 👌
#PriceProjections



BlockchainBaller
·
--
guy's long $ADA l $SOL l $DOGE
ADA SHORT
Entry: 0.1720 - 0.1745
Stop Loss: 0.1775
TP1: 0.1700
TP2: 0.1675
TP3: 0.1640
TP4: 0.1600
SOL LONG
Entry: 82.20 - 82.80
Stop Loss: 81.50
TP1: 83.80
TP2: 84.80
TP3: 85.80
TP4: 87.50
DOGE SHORT
Entry: 0.06680 - 0.06730
Stop Loss: 0.06800
TP1: 0.06630
TP2: 0.06580
TP3: 0.06500
TP4: 0.06380
ADA SHORT
Entry: 0.1720 - 0.1745
Stop Loss: 0.1775
TP1: 0.1700
TP2: 0.1675
TP3: 0.1640
TP4: 0.1600
SOL LONG
Entry: 82.20 - 82.80
Stop Loss: 81.50
TP1: 83.80
TP2: 84.80
TP3: 85.80
TP4: 87.50
DOGE SHORT
Entry: 0.06680 - 0.06730
Stop Loss: 0.06800
TP1: 0.06630
TP2: 0.06580
TP3: 0.06500
TP4: 0.06380
1
95
·
--
Рост
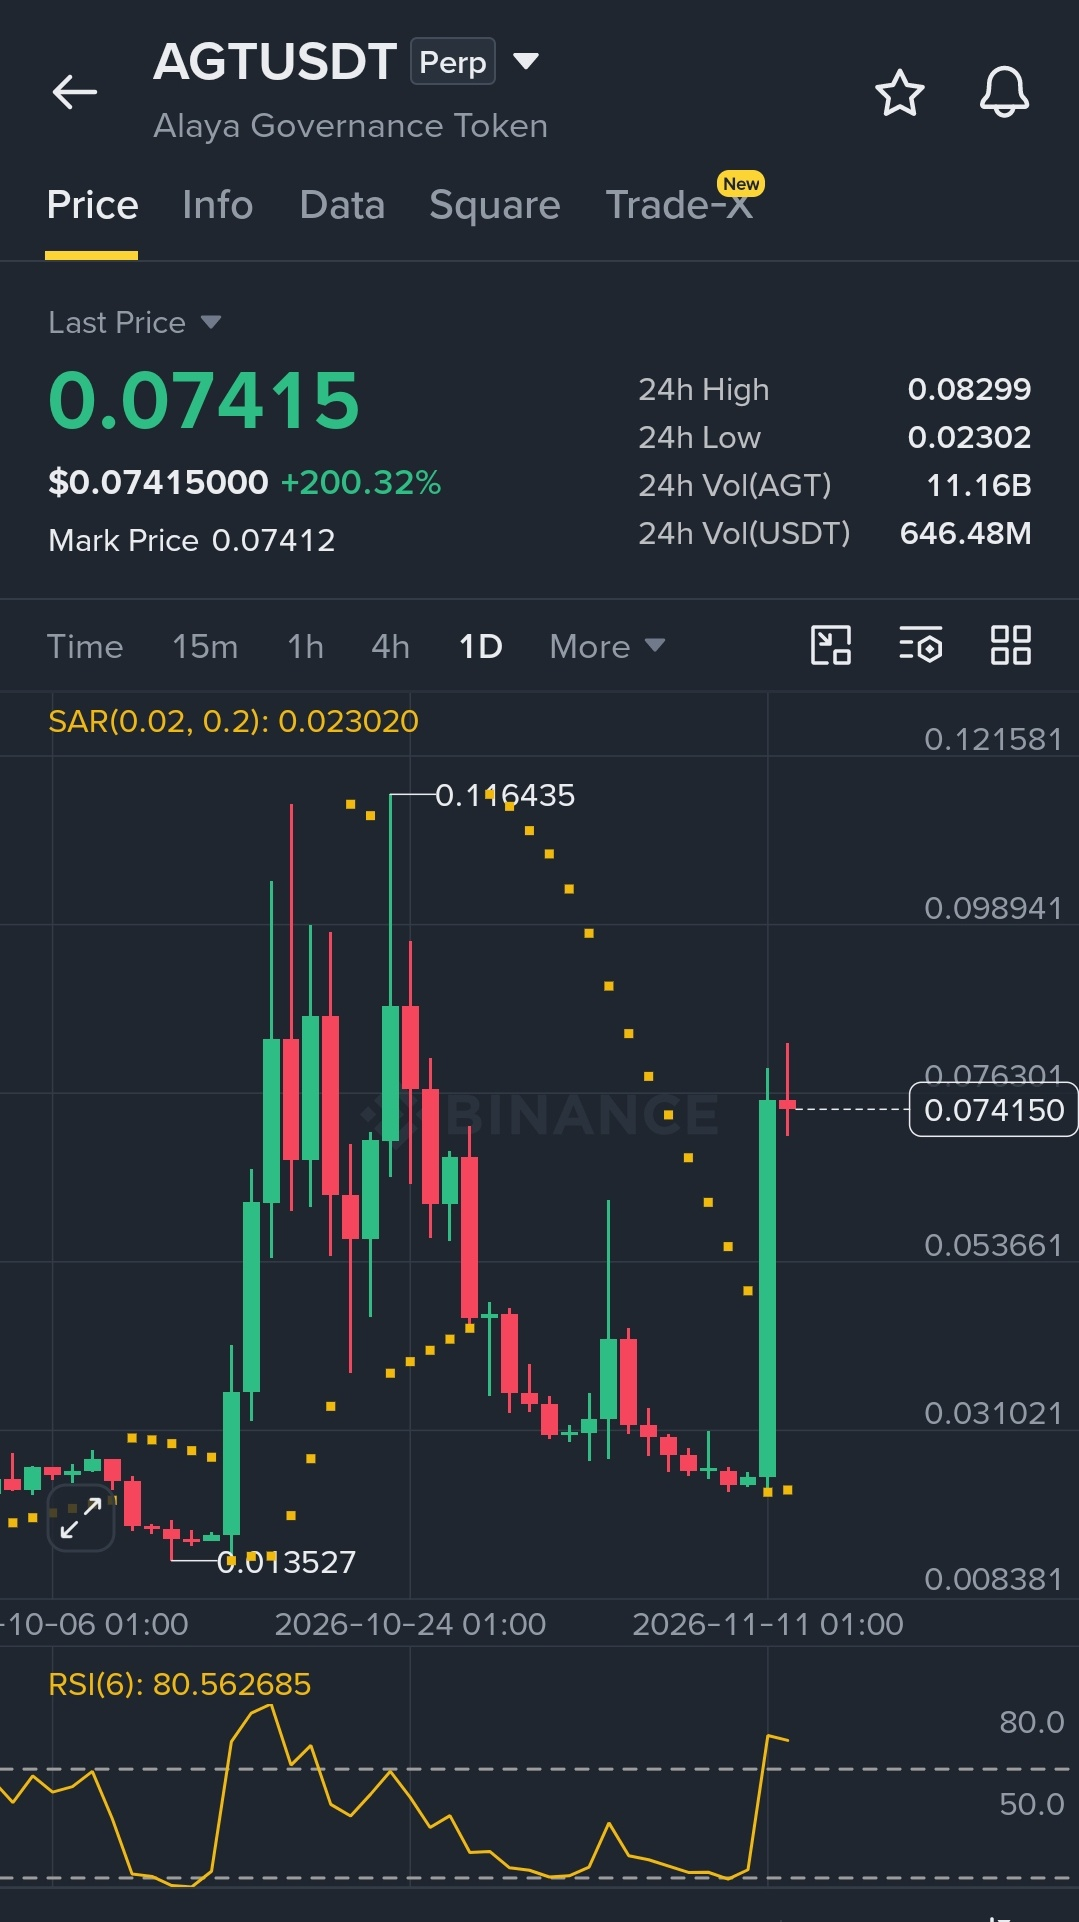
$AGT still pumping and those who short it too quickly are being swept off by the almost unending pump 🥶
I don't think AGT is ready to give up just yet. If you don't have enough cap. to hold your position try cutting your loss.
#AGTtothemmoon #PriceProjections
{future}(AGTUSDT)
$BLUAI
{future}(BLUAIUSDT)
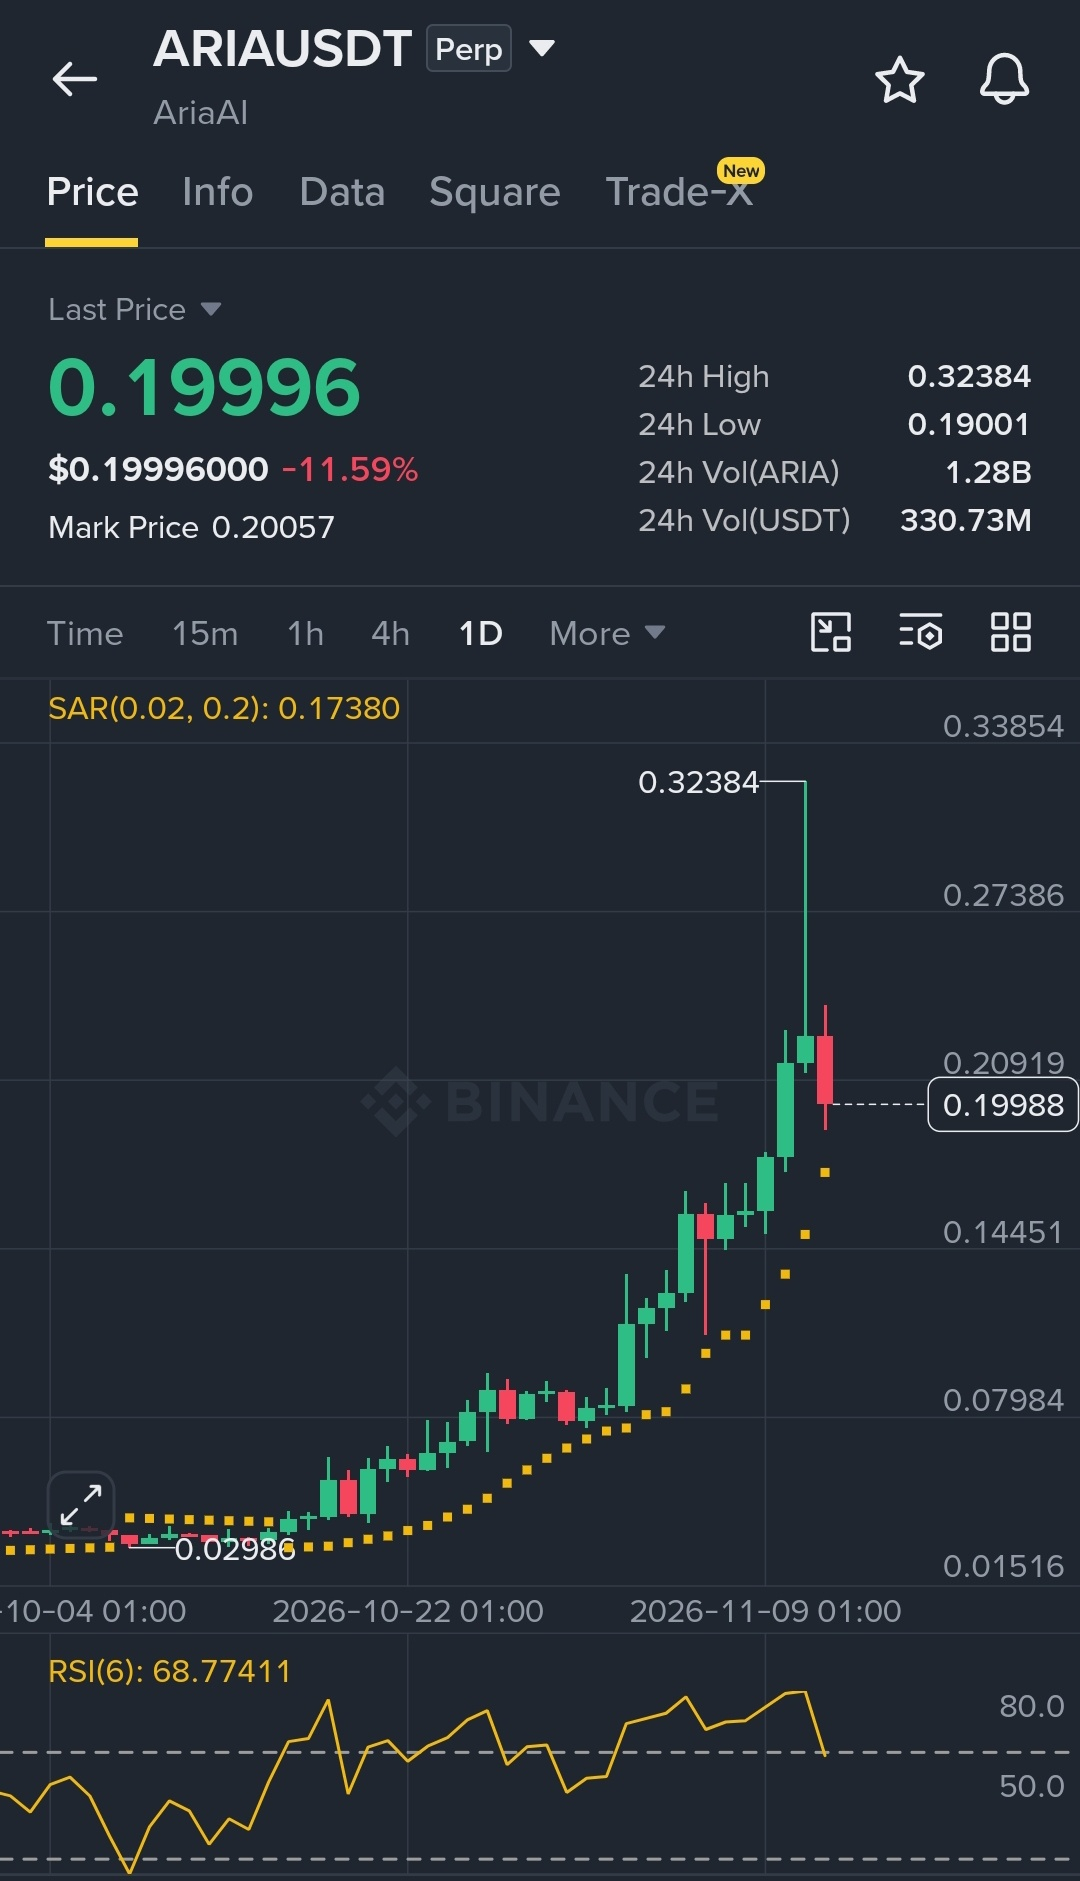
$ARIA
{future}(ARIAUSDT)
$AGT still pumping and those who short it too quickly are being swept off by the almost unending pump 🥶
I don't think AGT is ready to give up just yet. If you don't have enough cap. to hold your position try cutting your loss.
#AGTtothemmoon #PriceProjections
$BLUAI
$ARIA
I don't think AGT is ready to give up just yet. If you don't have enough cap. to hold your position try cutting your loss.
#AGTtothemmoon #PriceProjections
$BLUAI
$ARIA


大化商行
·
--
$AGT 死咯,进场太快了,
1
716
·
--
Рост
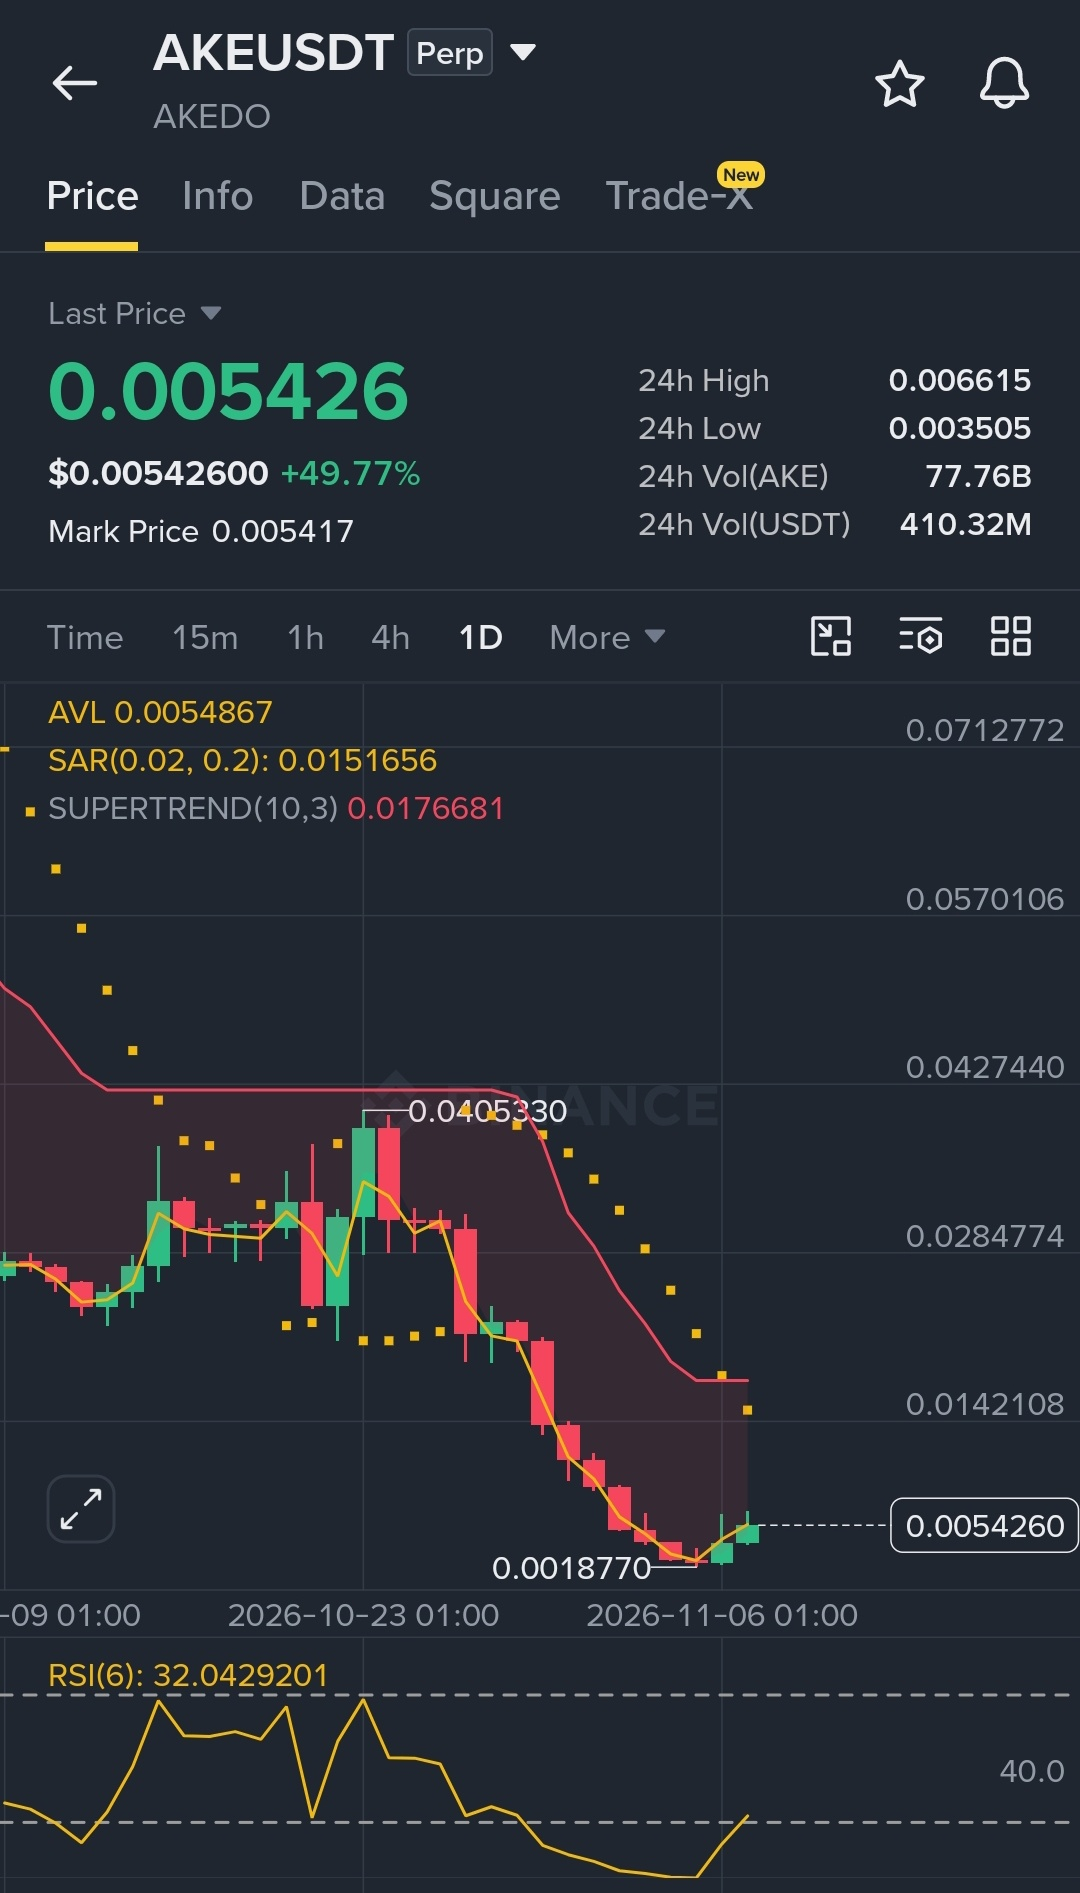
$AKE is indeed a Grandpa 😂 refusing to die down since yesterday
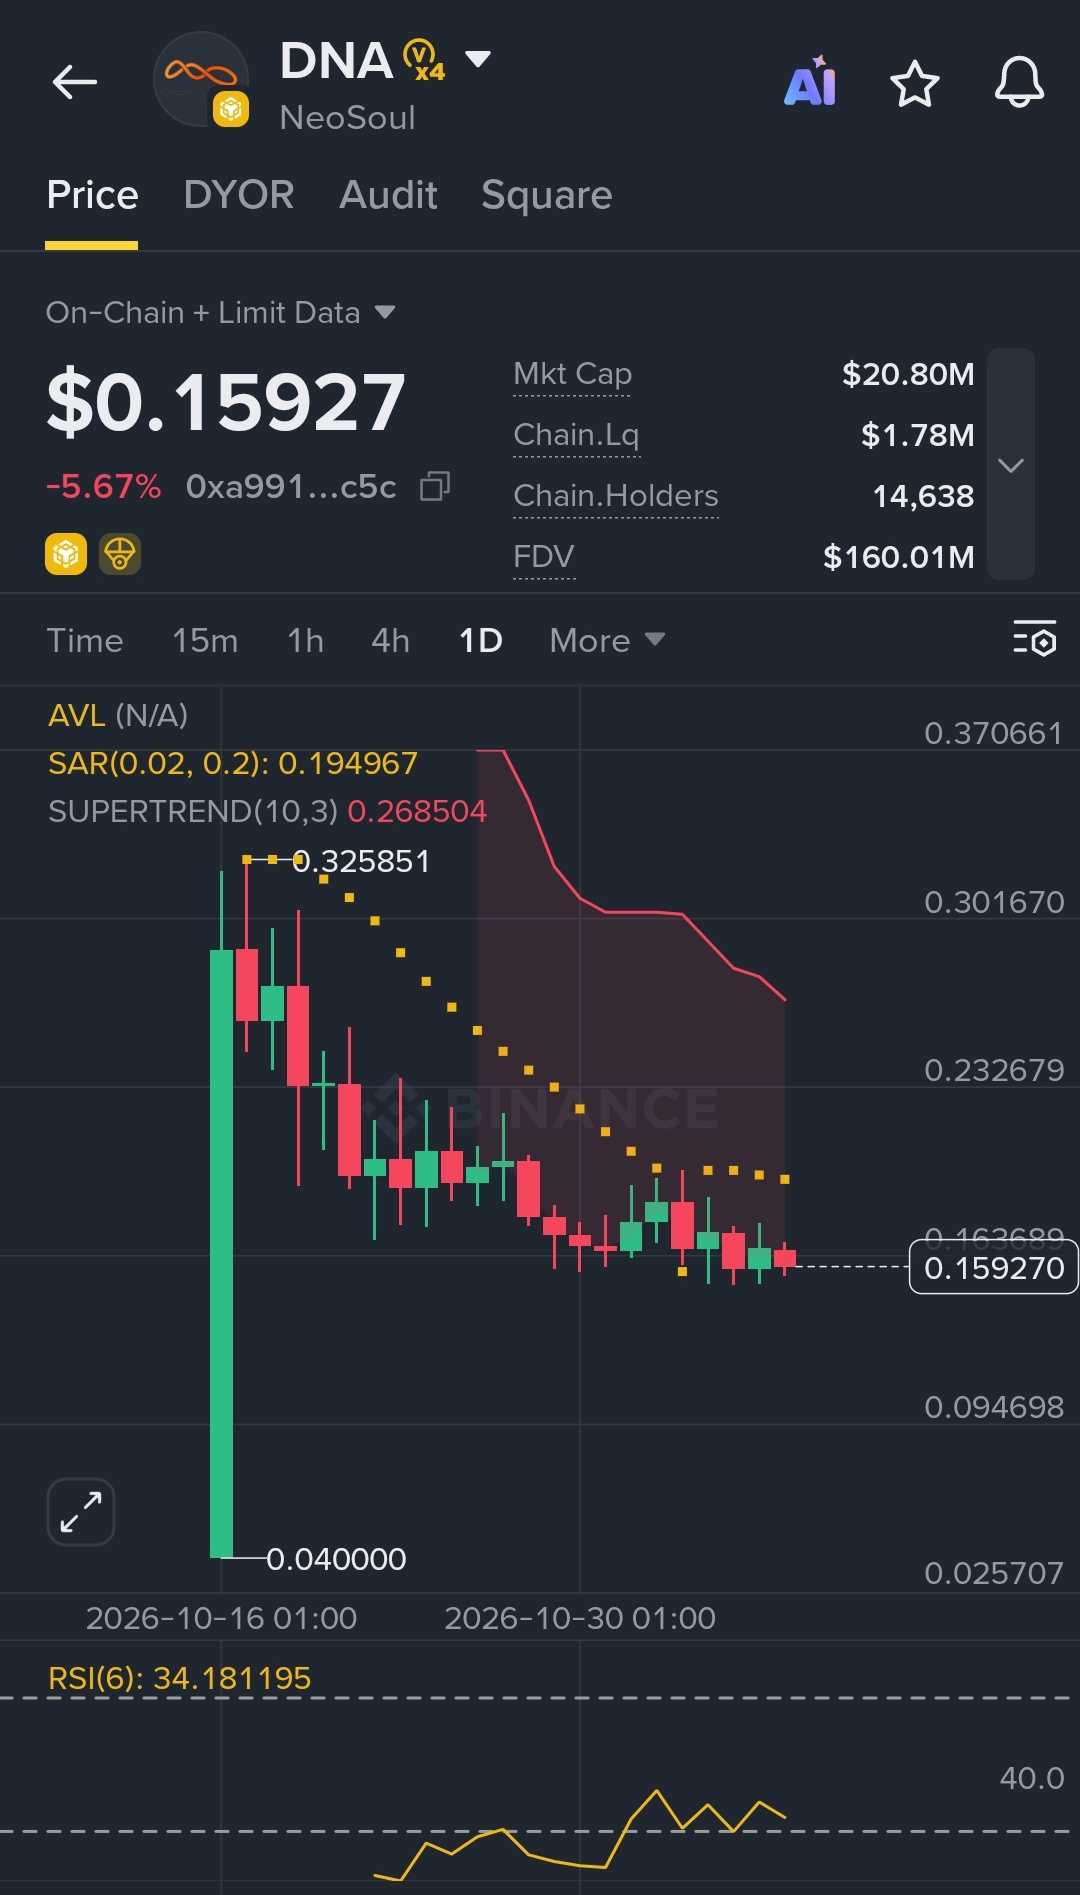
And I think $ONE is likely to have a similar $DNA 😂
#PriceProjections #PriceCorrection
{future}(AKEUSDT)
{future}(ONEUSDT)
{alpha}(560xa991f61940095aea0724ef54077223b048c5cf7b)
$AKE is indeed a Grandpa 😂 refusing to die down since yesterday
And I think $ONE is likely to have a similar $DNA 😂
#PriceProjections #PriceCorrection
And I think $ONE is likely to have a similar $DNA 😂
#PriceProjections #PriceCorrection


赚个10u就跑
·
--
$AKE 爷爷我再也不敢空你了,让我解套吧爷爷
1
1.1k
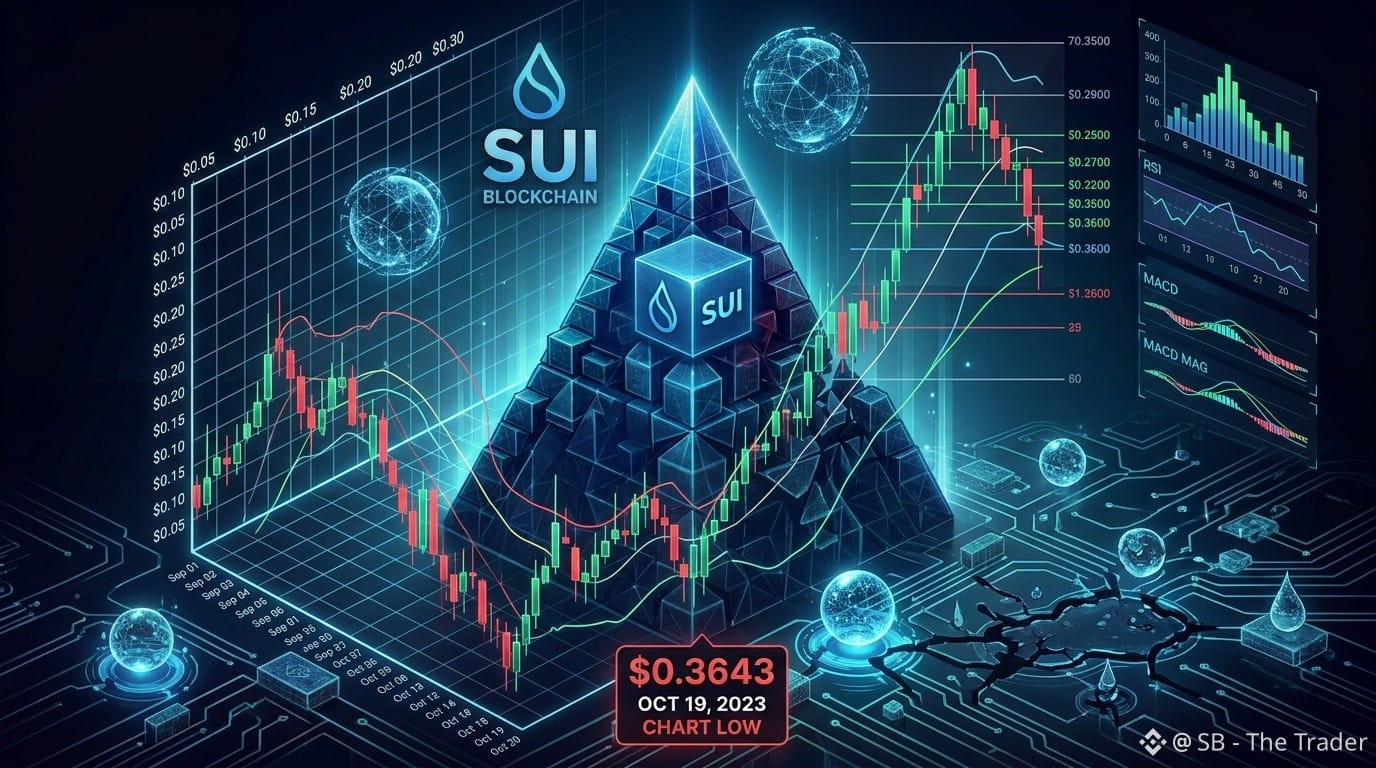
SUI: September 2026 Technical Outlook
$SUI
{spot}(SUIUSDT)
is trading around $0.71, approximately 86.7% below its $5.35 ATH. CoinMarketCap shows about 4.09B SUI circulating from a 10B maximum supply.
From a market-structure perspective, SUI remains well below its ATH and is currently trading near the lower end of its broader range.
Key level: $0.70
Major upside reference: $5.35 ATH
Key downside reference: $0.364 ATL
#SUİ #sui #PriceProjections
SUI: September 2026 Technical Outlook
$SUI
is trading around $0.71, approximately 86.7% below its $5.35 ATH. CoinMarketCap shows about 4.09B SUI circulating from a 10B maximum supply.
From a market-structure perspective, SUI remains well below its ATH and is currently trading near the lower end of its broader range.
Key level: $0.70
Major upside reference: $5.35 ATH
Key downside reference: $0.364 ATL
#SUİ #sui #PriceProjections
$SUI
is trading around $0.71, approximately 86.7% below its $5.35 ATH. CoinMarketCap shows about 4.09B SUI circulating from a 10B maximum supply.
From a market-structure perspective, SUI remains well below its ATH and is currently trading near the lower end of its broader range.
Key level: $0.70
Major upside reference: $5.35 ATH
Key downside reference: $0.364 ATL
#SUİ #sui #PriceProjections
54

·
--
Падение
Render (RENDER) 30-Day Outlook: Is the Bottom In?
Render network has seen a significant pullback over the last month, down 22.39% to trade at around ₹144.63 (~$1.53 USDT).
While the short-to-medium term charts look a bit bloody, looking at the bigger picture gives us a very different story. Let’s break down the key data points from the chart:
📊 The Key Numbers
Current Price: ₹144.63 ($1.53 USDT)
24-Hour Change: 🔴 -1.97%
30-Day Change: 🔴 -22.39%
90-Day Change: 🔴 -11.03%
YTD (Year-to-Date): 🟢 +19.24%
#RenderNetwork
#aritificial #PriceProjections
Render (RENDER) 30-Day Outlook: Is the Bottom In?
Render network has seen a significant pullback over the last month, down 22.39% to trade at around ₹144.63 (~$1.53 USDT).
While the short-to-medium term charts look a bit bloody, looking at the bigger picture gives us a very different story. Let’s break down the key data points from the chart:
📊 The Key Numbers
Current Price: ₹144.63 ($1.53 USDT)
24-Hour Change: 🔴 -1.97%
30-Day Change: 🔴 -22.39%
90-Day Change: 🔴 -11.03%
YTD (Year-to-Date): 🟢 +19.24%
#RenderNetwork
#aritificial #PriceProjections
Render network has seen a significant pullback over the last month, down 22.39% to trade at around ₹144.63 (~$1.53 USDT).
While the short-to-medium term charts look a bit bloody, looking at the bigger picture gives us a very different story. Let’s break down the key data points from the chart:
📊 The Key Numbers
Current Price: ₹144.63 ($1.53 USDT)
24-Hour Change: 🔴 -1.97%
30-Day Change: 🔴 -22.39%
90-Day Change: 🔴 -11.03%
YTD (Year-to-Date): 🟢 +19.24%
#RenderNetwork
#aritificial #PriceProjections
133
·
--
Падение
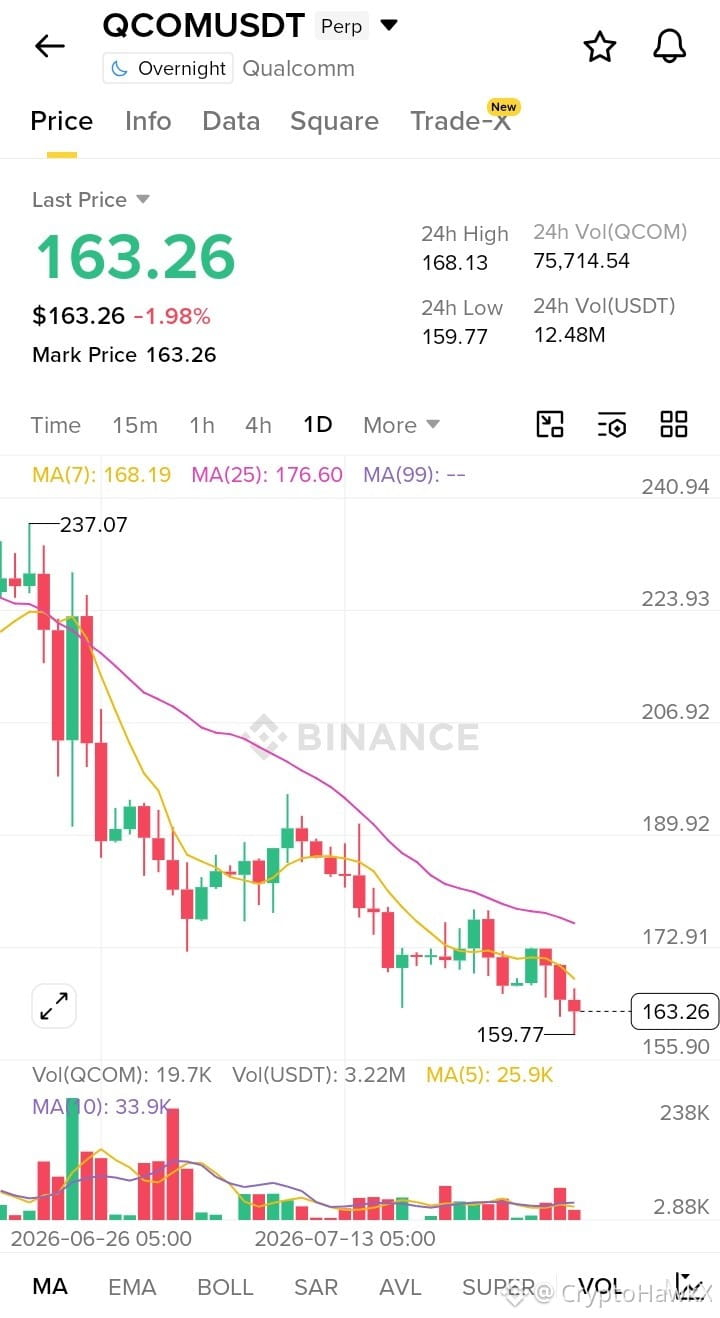
$QCOM.US QCOMUSDT Market Update 📉
QCOMUSDT is trading around $163.26, remaining under pressure after failing to reclaim key resistance. The price is trading below both the MA7 and MA25, signaling that sellers are still in control in the short term. Unless buyers push the price back above these moving averages, the overall momentum is likely to remain weak.
Market Sentiment: Bearish 🔻
#QCOMUSDT #$ # #Price-Prediction # #PriceProjections #Trading #market_tips #MarketMeltdown #
$QCOM.US QCOMUSDT Market Update 📉
QCOMUSDT is trading around $163.26, remaining under pressure after failing to reclaim key resistance. The price is trading below both the MA7 and MA25, signaling that sellers are still in control in the short term. Unless buyers push the price back above these moving averages, the overall momentum is likely to remain weak.
Market Sentiment: Bearish 🔻
#QCOMUSDT #$ # #Price-Prediction # #PriceProjections #Trading #market_tips #MarketMeltdown #
QCOMUSDT is trading around $163.26, remaining under pressure after failing to reclaim key resistance. The price is trading below both the MA7 and MA25, signaling that sellers are still in control in the short term. Unless buyers push the price back above these moving averages, the overall momentum is likely to remain weak.
Market Sentiment: Bearish 🔻
#QCOMUSDT #$ # #Price-Prediction # #PriceProjections #Trading #market_tips #MarketMeltdown #
14
·
--
Падение
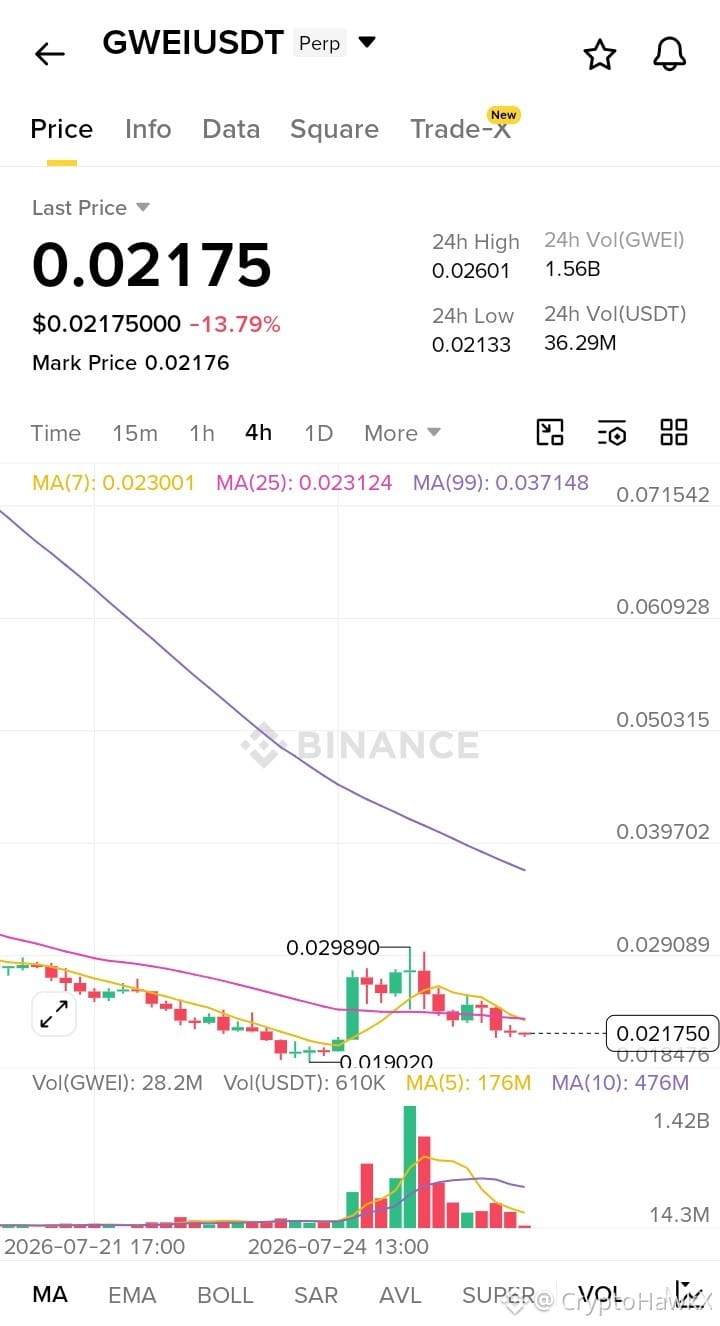
📉$GWEI GWEI/USDT Market Update (4H)
GWEI is trading around $0.02175, facing strong selling pressure after failing to hold recent gains. The price is trading below the MA(7), MA(25), and MA(99), confirming that sellers remain in control and the overall trend is weak.
The $0.0213 area is acting as immediate support. If this level breaks, further downside is possible. A recovery above $0.0231 would be the first sign of improving momentum, but buyers need stronger volume to shift the trend.
Market Sentiment: 🔴 Bearish
#GWEI #GWEIUSDT #Crypto #PriceProjections #CryptoTransition nicalAnalysis #PriceShift Action #Bearish #Altcoins #TechnicalAnalysis_Tickeron #MarketUpdate
📉$GWEI GWEI/USDT Market Update (4H)
GWEI is trading around $0.02175, facing strong selling pressure after failing to hold recent gains. The price is trading below the MA(7), MA(25), and MA(99), confirming that sellers remain in control and the overall trend is weak.
The $0.0213 area is acting as immediate support. If this level breaks, further downside is possible. A recovery above $0.0231 would be the first sign of improving momentum, but buyers need stronger volume to shift the trend.
Market Sentiment: 🔴 Bearish
#GWEI #GWEIUSDT #Crypto #PriceProjections #CryptoTransition nicalAnalysis #PriceShift Action #Bearish #Altcoins #TechnicalAnalysis_Tickeron #MarketUpdate
GWEI is trading around $0.02175, facing strong selling pressure after failing to hold recent gains. The price is trading below the MA(7), MA(25), and MA(99), confirming that sellers remain in control and the overall trend is weak.
The $0.0213 area is acting as immediate support. If this level breaks, further downside is possible. A recovery above $0.0231 would be the first sign of improving momentum, but buyers need stronger volume to shift the trend.
Market Sentiment: 🔴 Bearish
#GWEI #GWEIUSDT #Crypto #PriceProjections #CryptoTransition nicalAnalysis #PriceShift Action #Bearish #Altcoins #TechnicalAnalysis_Tickeron #MarketUpdate
102
·
--
Рост
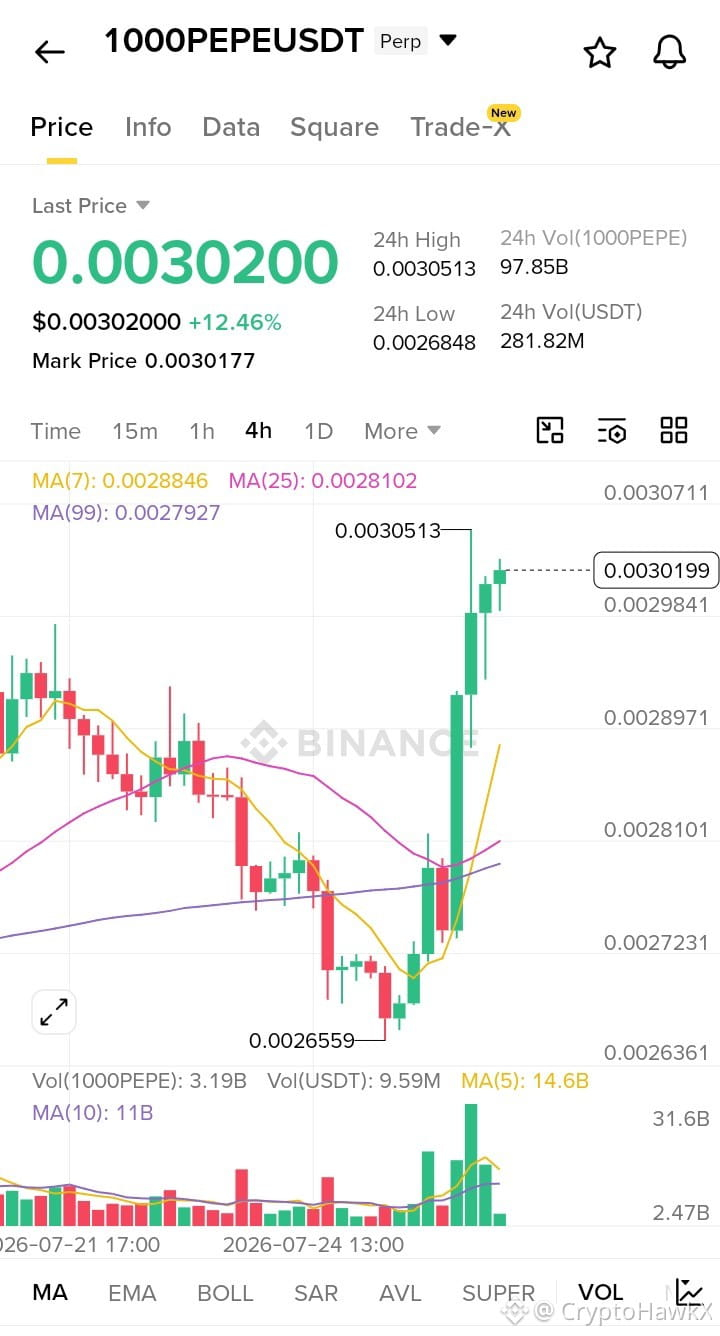
🐸$1000PEPE 1000PEPEUSDT Market Update (4H)
1000PEPEUSDT has delivered a strong bullish breakout, surging above the MA(7), MA(25), and MA(99) with a significant increase in buying volume. The price is trading near the $0.00305 resistance after rallying from the $0.00266 support zone. If buyers maintain momentum and break above $0.00305, the uptrend could continue. Holding above $0.00290 would keep the bullish structure intact.
Market Sentiment: Bullish 🟢
Hashtags:
#PriceProjections EPE #PEPE #1000peepeusdt #Crypto #MemeWatch2024 #TechnicalAnalysis #CryptoTrends2024 #Binance #Bullish
🐸$1000PEPE 1000PEPEUSDT Market Update (4H)
1000PEPEUSDT has delivered a strong bullish breakout, surging above the MA(7), MA(25), and MA(99) with a significant increase in buying volume. The price is trading near the $0.00305 resistance after rallying from the $0.00266 support zone. If buyers maintain momentum and break above $0.00305, the uptrend could continue. Holding above $0.00290 would keep the bullish structure intact.
Market Sentiment: Bullish 🟢
Hashtags:
#PriceProjections EPE #PEPE #1000peepeusdt #Crypto #MemeWatch2024 #TechnicalAnalysis #CryptoTrends2024 #Binance #Bullish
1000PEPEUSDT has delivered a strong bullish breakout, surging above the MA(7), MA(25), and MA(99) with a significant increase in buying volume. The price is trading near the $0.00305 resistance after rallying from the $0.00266 support zone. If buyers maintain momentum and break above $0.00305, the uptrend could continue. Holding above $0.00290 would keep the bullish structure intact.
Market Sentiment: Bullish 🟢
Hashtags:
#PriceProjections EPE #PEPE #1000peepeusdt #Crypto #MemeWatch2024 #TechnicalAnalysis #CryptoTrends2024 #Binance #Bullish
69
·
--
Падение
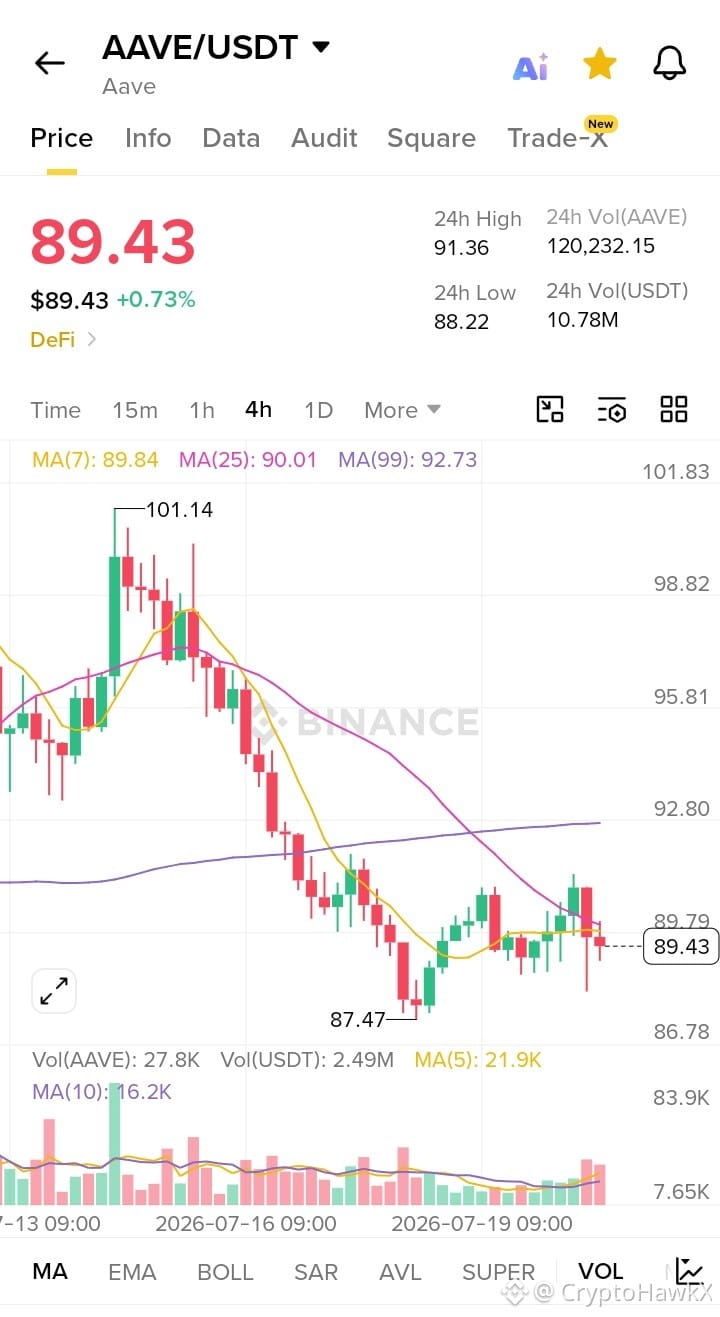
$AAVE AAVE/USDT Analysis – Bearish 🔴
AAVE/USDT is showing bearish momentum on the 4H timeframe. The price is trading around 89.43, below the MA(7), MA(25), and MA(99), indicating that sellers still have control of the broader trend. Recent recovery attempts have struggled to break above resistance, leading to continued weakness.
As long as AAVE remains below the 90.00–92.70 resistance zone, downside pressure may continue. Key support lies around 88.20–87.50. A break below this area could extend the decline, while a strong move above 92.70 would be needed to shift momentum back in favor of the bulls.
Overall Sentiment: Bearish 🔴
#AAVE #AAVEUSDT #DeFi #Crypto #CryptoTrading #Binance #Altcoins #TechnicalAnalysis_Tickeron icalAnalysis #Bearish #Trading #Robertkiyosaki ket #PriceProjections eAction #SupportAndWin Resistance #Robert iskManagement
$AAVE AAVE/USDT Analysis – Bearish 🔴
AAVE/USDT is showing bearish momentum on the 4H timeframe. The price is trading around 89.43, below the MA(7), MA(25), and MA(99), indicating that sellers still have control of the broader trend. Recent recovery attempts have struggled to break above resistance, leading to continued weakness.
As long as AAVE remains below the 90.00–92.70 resistance zone, downside pressure may continue. Key support lies around 88.20–87.50. A break below this area could extend the decline, while a strong move above 92.70 would be needed to shift momentum back in favor of the bulls.
Overall Sentiment: Bearish 🔴
#AAVE #AAVEUSDT #DeFi #Crypto #CryptoTrading #Binance #Altcoins #TechnicalAnalysis_Tickeron icalAnalysis #Bearish #Trading #Robertkiyosaki ket #PriceProjections eAction #SupportAndWin Resistance #Robert iskManagement
AAVE/USDT is showing bearish momentum on the 4H timeframe. The price is trading around 89.43, below the MA(7), MA(25), and MA(99), indicating that sellers still have control of the broader trend. Recent recovery attempts have struggled to break above resistance, leading to continued weakness.
As long as AAVE remains below the 90.00–92.70 resistance zone, downside pressure may continue. Key support lies around 88.20–87.50. A break below this area could extend the decline, while a strong move above 92.70 would be needed to shift momentum back in favor of the bulls.
Overall Sentiment: Bearish 🔴
#AAVE #AAVEUSDT #DeFi #Crypto #CryptoTrading #Binance #Altcoins #TechnicalAnalysis_Tickeron icalAnalysis #Bearish #Trading #Robertkiyosaki ket #PriceProjections eAction #SupportAndWin Resistance #Robert iskManagement
55
·
--
I am patiently waiting for:
$1,500 for $ZEC
$90 for $DASH
$0.5 for $ARB
Then shorting it again
Although $zec went from $800 to $1200+ in just 2 days but it can't keep going forever.
And DASH currently at $67 went from $45 to $78 in just 24 hours. If today's moves closes below it 2day's ago position, then comes the dump.
If you have been skeptical, there is still more time to accumulate more DASH and ARB
I am BUYING more of those two... I missed out on zec's big move I don't want to repeat the same for DASH and ARB 💪🏻
🎯 I LONG:
DASH $90
ZeC: $1,500
Then
🎯SHORT IT Once the long is hit
#PriceProjections
{future}(ZECUSDT)
{future}(DASHUSDT)
{future}(ARBUSDT)
I am patiently waiting for:
$1,500 for $ZEC
$90 for $DASH
$0.5 for $ARB
Then shorting it again
Although $zec went from $800 to $1200+ in just 2 days but it can't keep going forever.
And DASH currently at $67 went from $45 to $78 in just 24 hours. If today's moves closes below it 2day's ago position, then comes the dump.
If you have been skeptical, there is still more time to accumulate more DASH and ARB
I am BUYING more of those two... I missed out on zec's big move I don't want to repeat the same for DASH and ARB 💪🏻
🎯 I LONG:
DASH $90
ZeC: $1,500
Then
🎯SHORT IT Once the long is hit
#PriceProjections
$1,500 for $ZEC
$90 for $DASH
$0.5 for $ARB
Then shorting it again
Although $zec went from $800 to $1200+ in just 2 days but it can't keep going forever.
And DASH currently at $67 went from $45 to $78 in just 24 hours. If today's moves closes below it 2day's ago position, then comes the dump.
If you have been skeptical, there is still more time to accumulate more DASH and ARB
I am BUYING more of those two... I missed out on zec's big move I don't want to repeat the same for DASH and ARB 💪🏻
🎯 I LONG:
DASH $90
ZeC: $1,500
Then
🎯SHORT IT Once the long is hit
#PriceProjections
1
287

·
--
Рост
#Analysis #PriceProjections #priceaction
{spot}(RENDERUSDT)
$RENDER
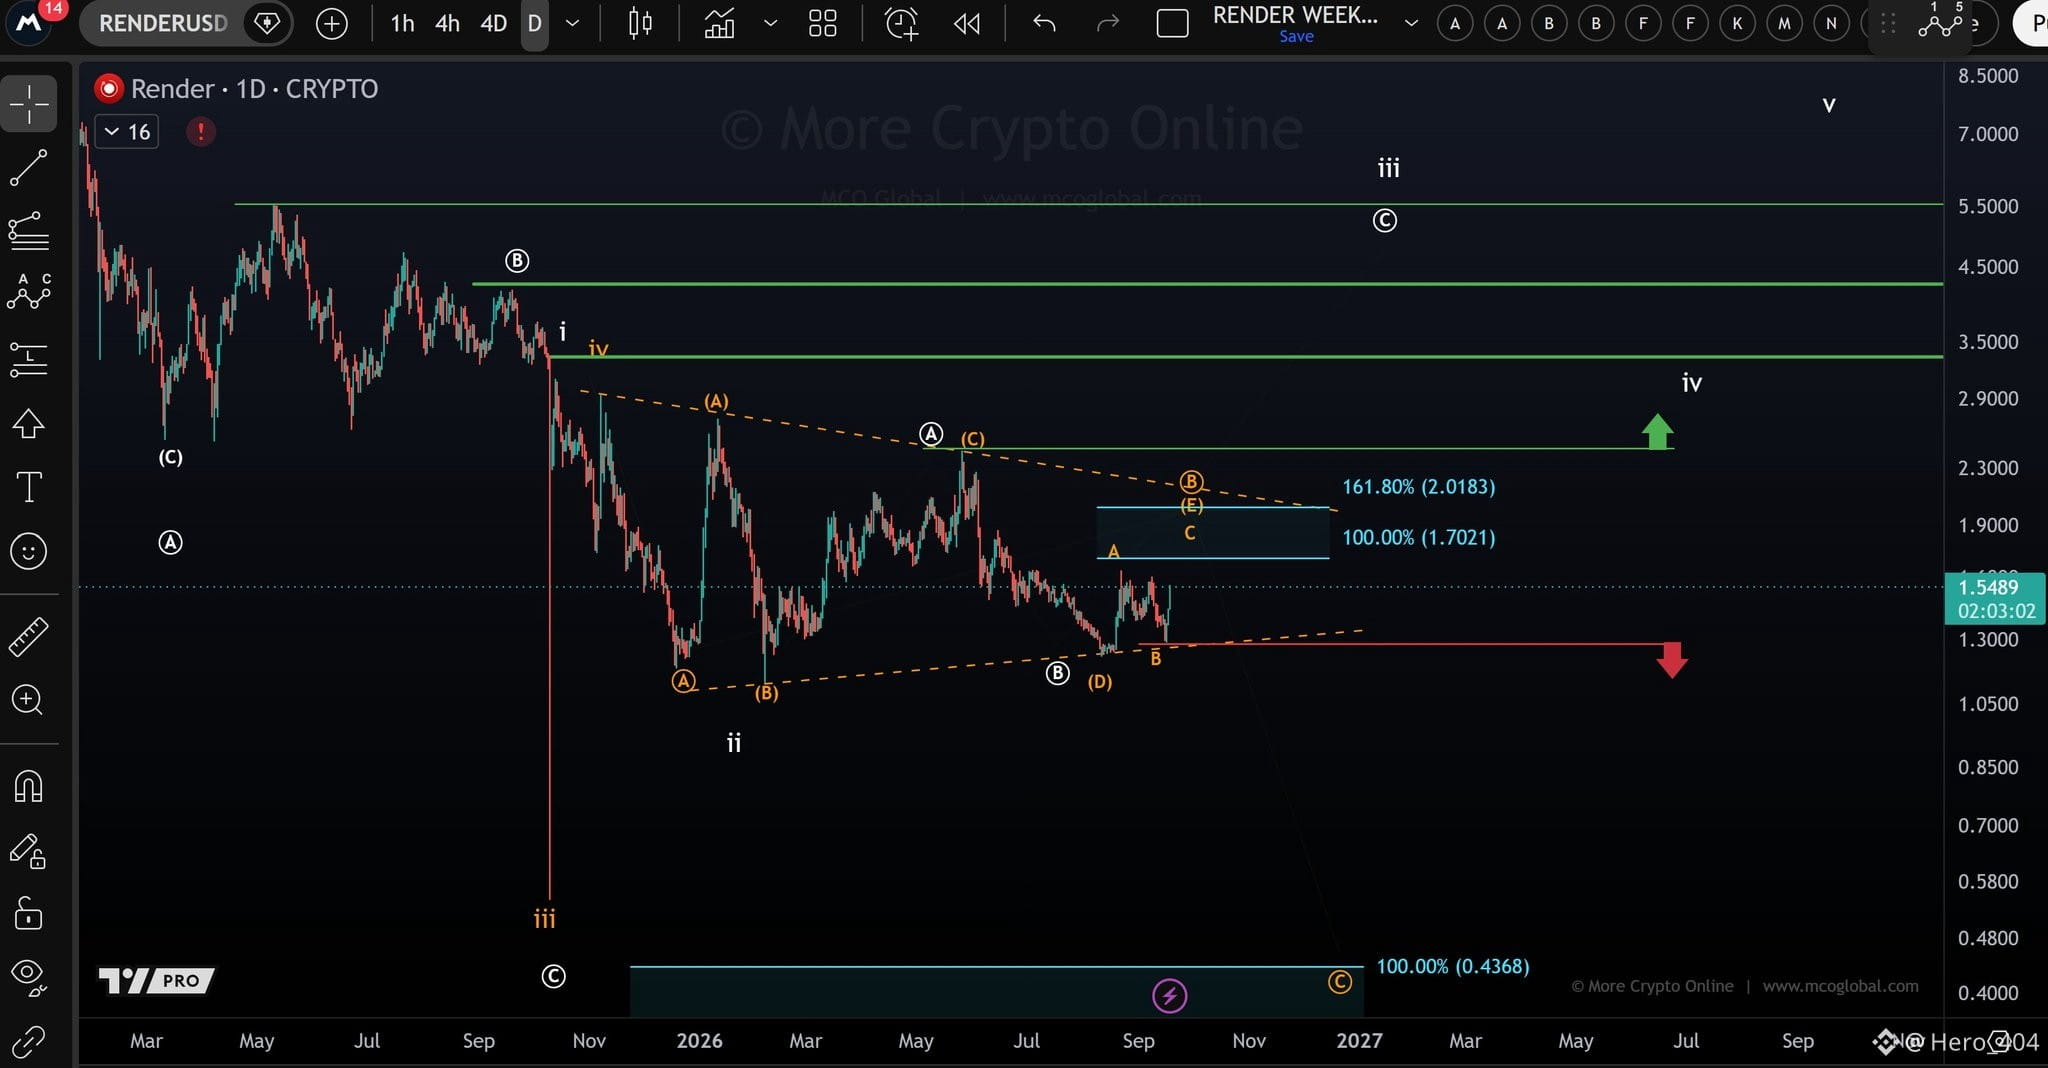
Short-term upside momentum remains intact but if this is going to turn into a larger uptrend is not decided yet. The next micro resistance levels are located between $1.70 and $2.01 and are the next immediate upside targets.
#Analysis #PriceProjections #priceaction
$RENDER
Short-term upside momentum remains intact but if this is going to turn into a larger uptrend is not decided yet. The next micro resistance levels are located between $1.70 and $2.01 and are the next immediate upside targets.
$RENDER
Short-term upside momentum remains intact but if this is going to turn into a larger uptrend is not decided yet. The next micro resistance levels are located between $1.70 and $2.01 and are the next immediate upside targets.
2
2.2k
·
--
Падение
$AIN & $BARD any big move?🤔
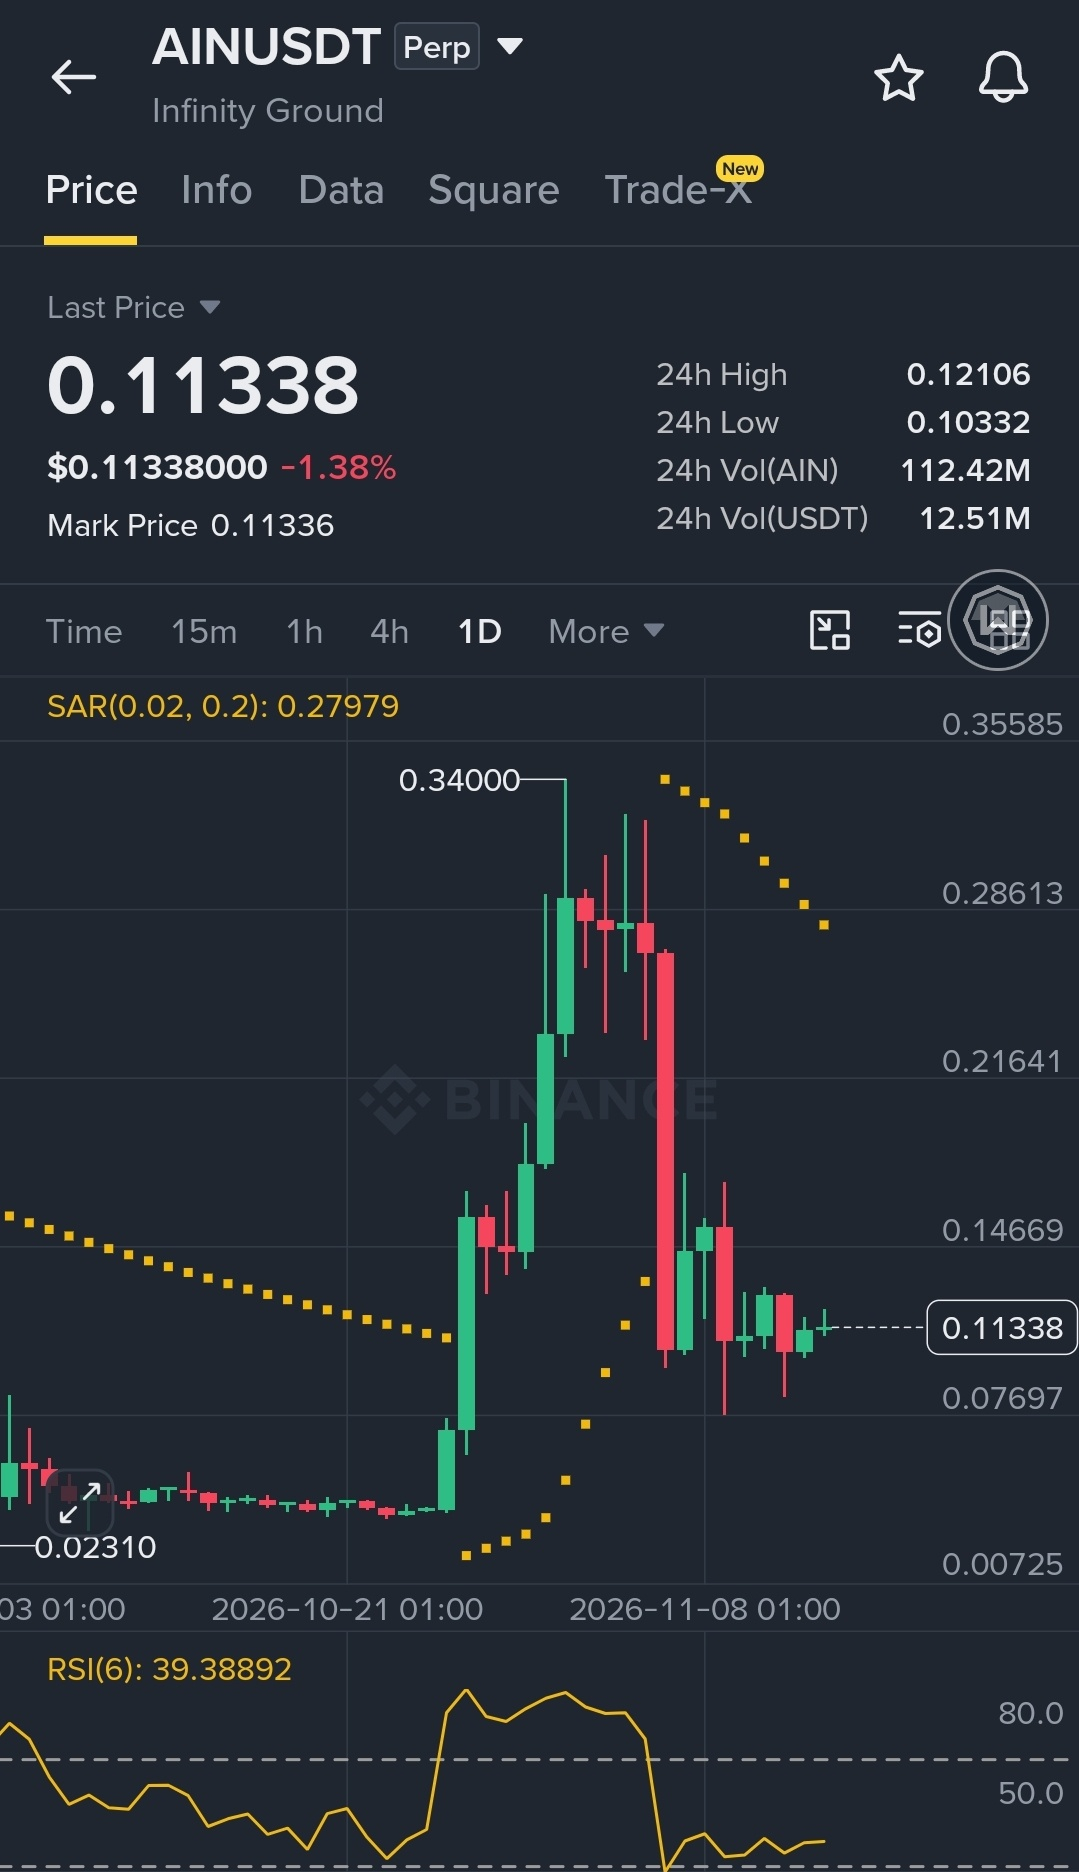
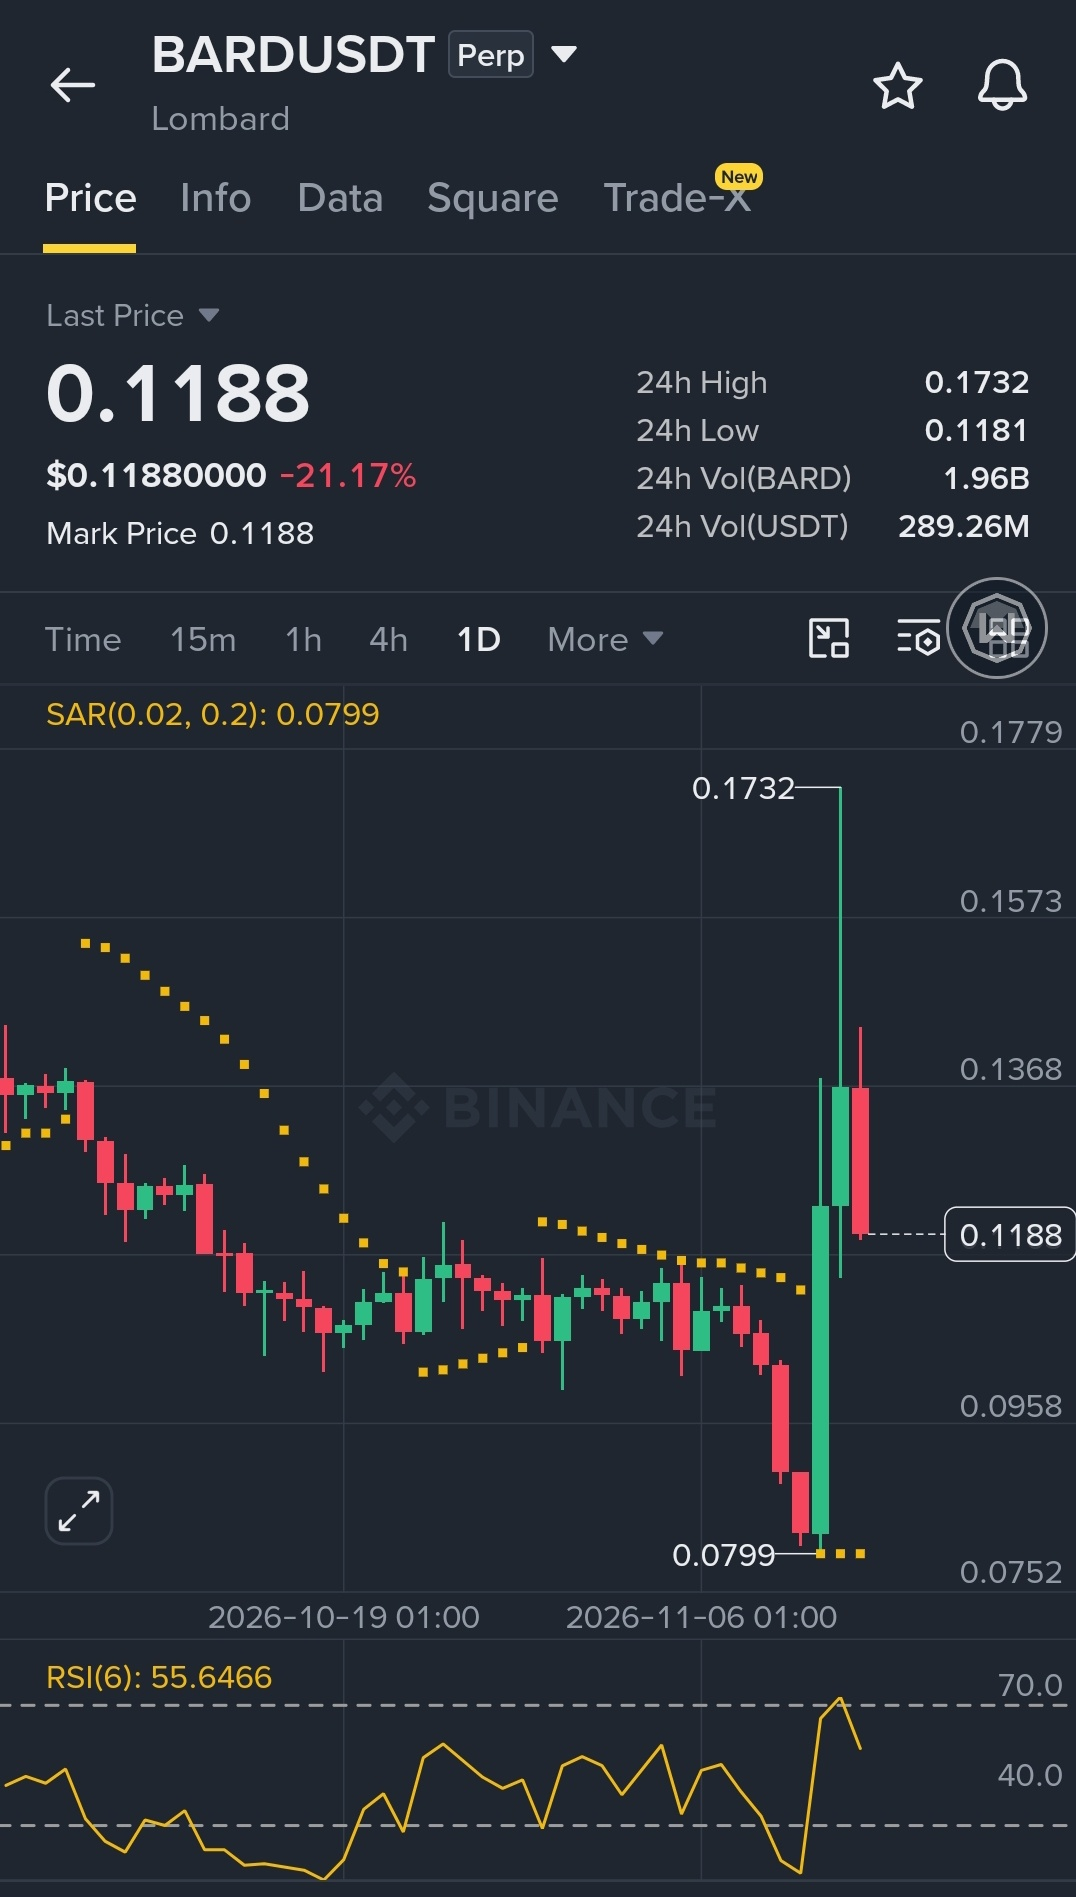
The charts patterns 📊 are gradually becoming interesting.. I guess a pump is on it way 🚀
#PriceProjections
{future}(AINUSDT)
{future}(BARDUSDT)
$AIN & $BARD any big move?🤔
The charts patterns 📊 are gradually becoming interesting.. I guess a pump is on it way 🚀
#PriceProjections
The charts patterns 📊 are gradually becoming interesting.. I guess a pump is on it way 🚀
#PriceProjections


ORVILLO
·
--
$AIN and $BARD are following same pattern
Massive pump incoming 🔥
Massive pump incoming 🔥
1
2
237
·
--
Рост
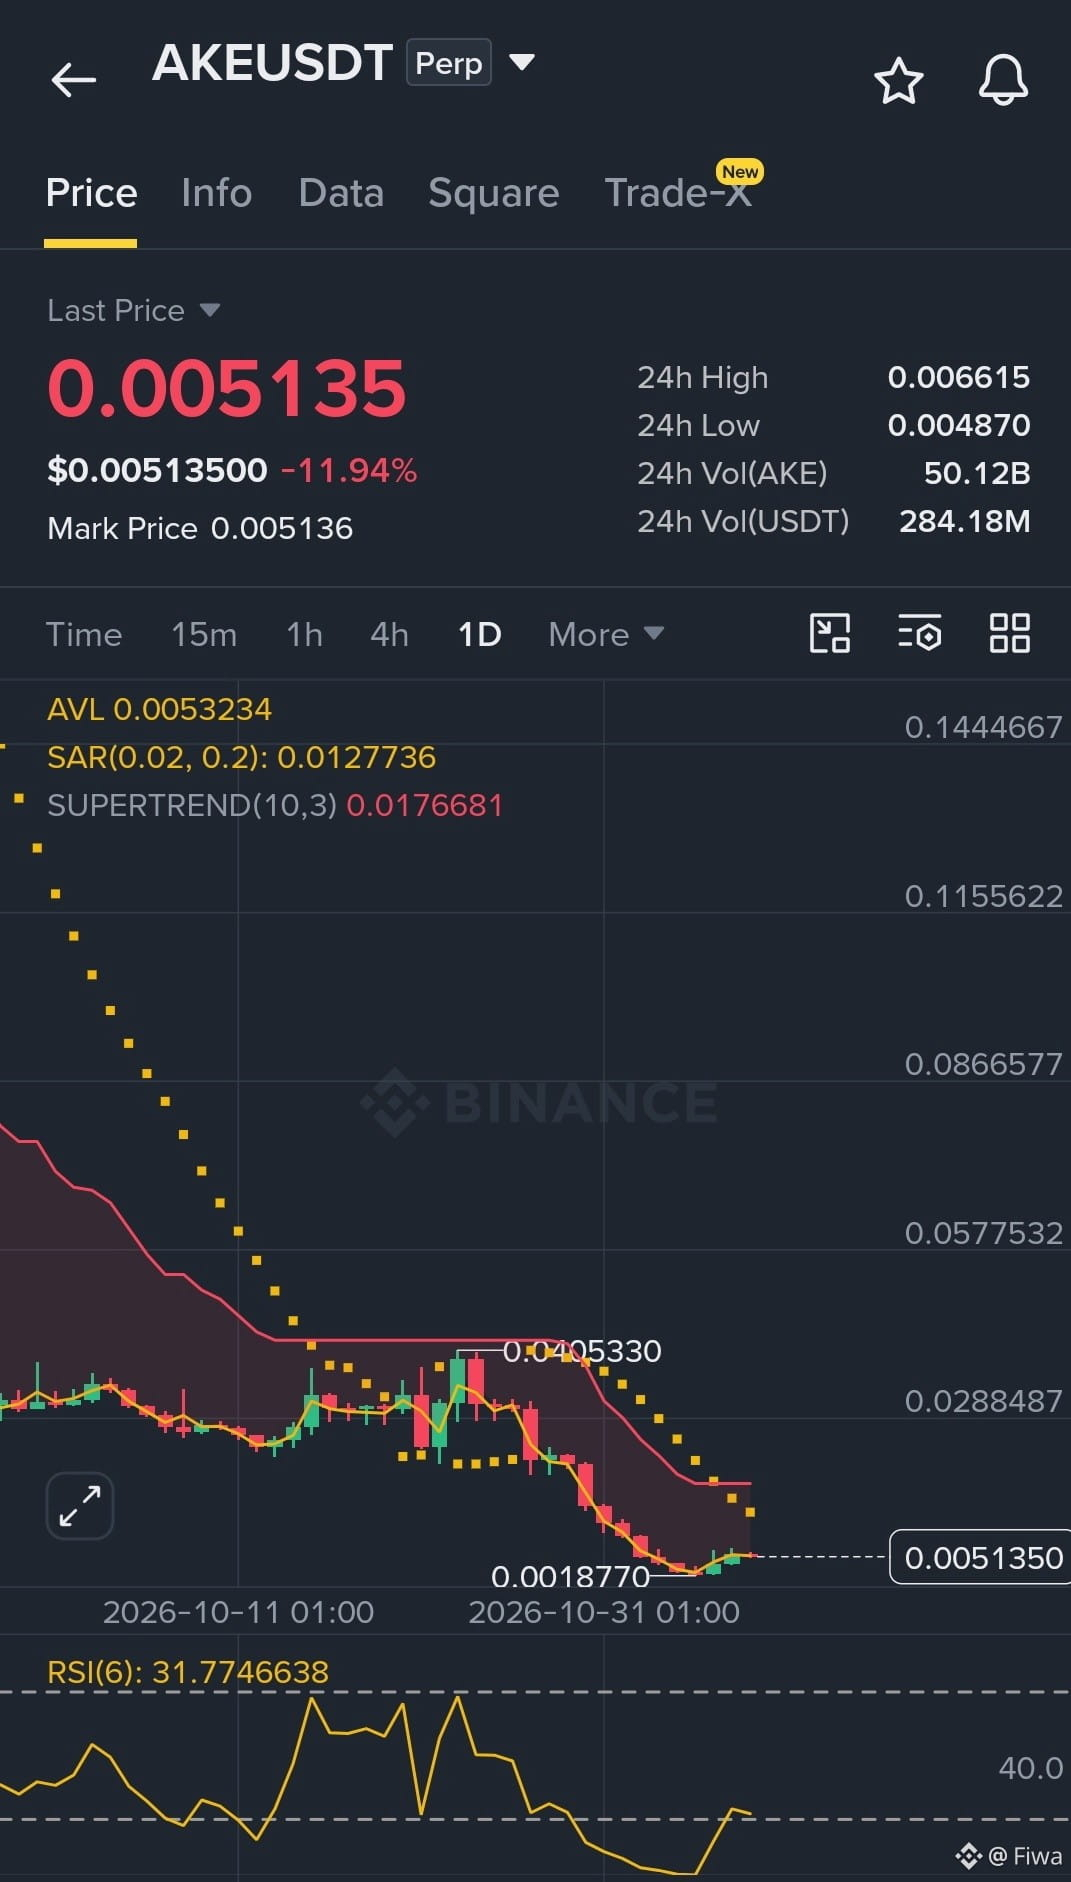
$KORU and $AKE shorters are definitely smiling right now. 😅
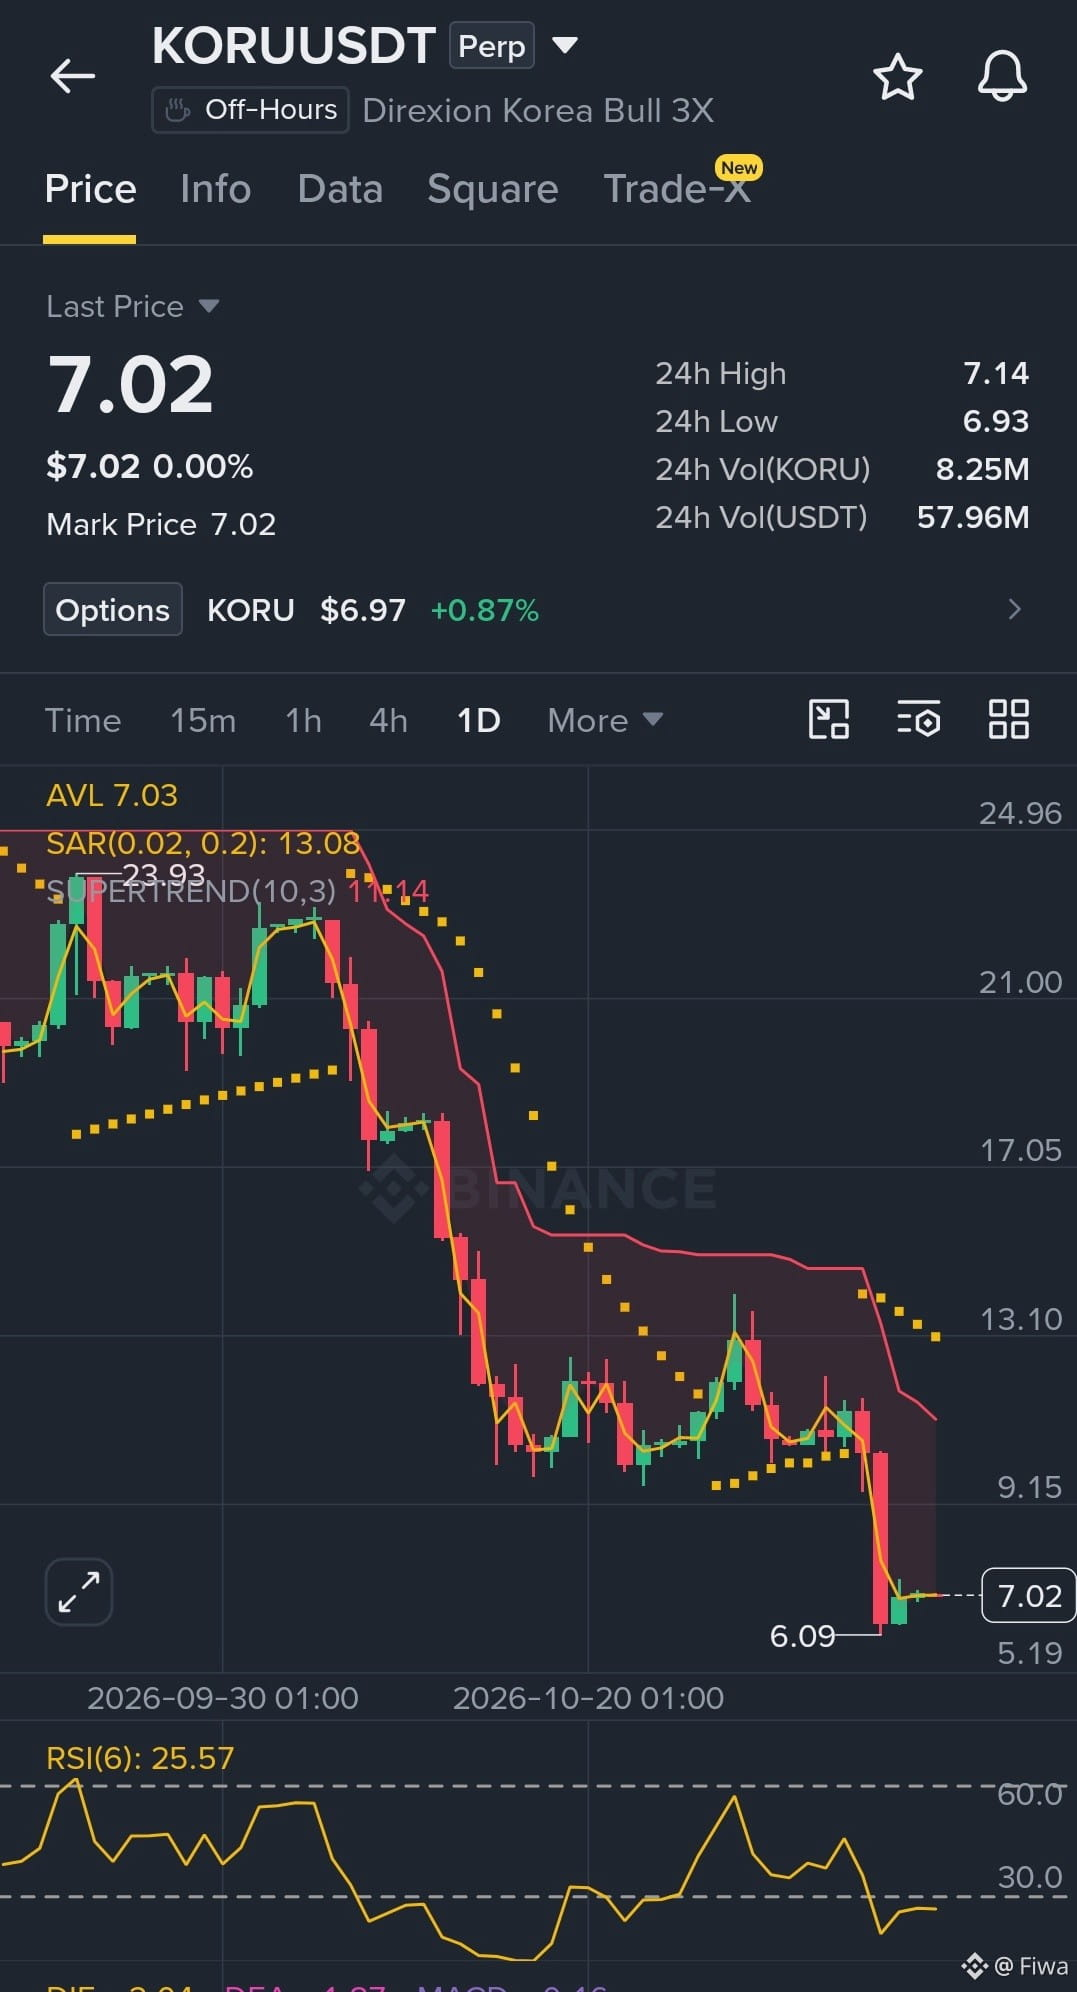
But think the market is about to experience another upward shit. 🚀
Buyers are getting ready to milk🤑
like 👍 and follow if you are also watching the market.
#PriceProjections #Price-Prediction
{future}(KORUUSDT)
{future}(AKEUSDT)
$KORU and $AKE shorters are definitely smiling right now. 😅
But think the market is about to experience another upward shit. 🚀
Buyers are getting ready to milk🤑
like 👍 and follow if you are also watching the market.
#PriceProjections #Price-Prediction
But think the market is about to experience another upward shit. 🚀
Buyers are getting ready to milk🤑
like 👍 and follow if you are also watching the market.
#PriceProjections #Price-Prediction

Fiwa
·
--
Падение$AGT still playing hard to get 🥺
$AKE broke my heart 💔
Waiting for $AGT to say yes to me🤔
#AGTPriceAnalyisis
$AKE broke my heart 💔
Waiting for $AGT to say yes to me🤔
#AGTPriceAnalyisis
1
1.1k
·
--
Рост
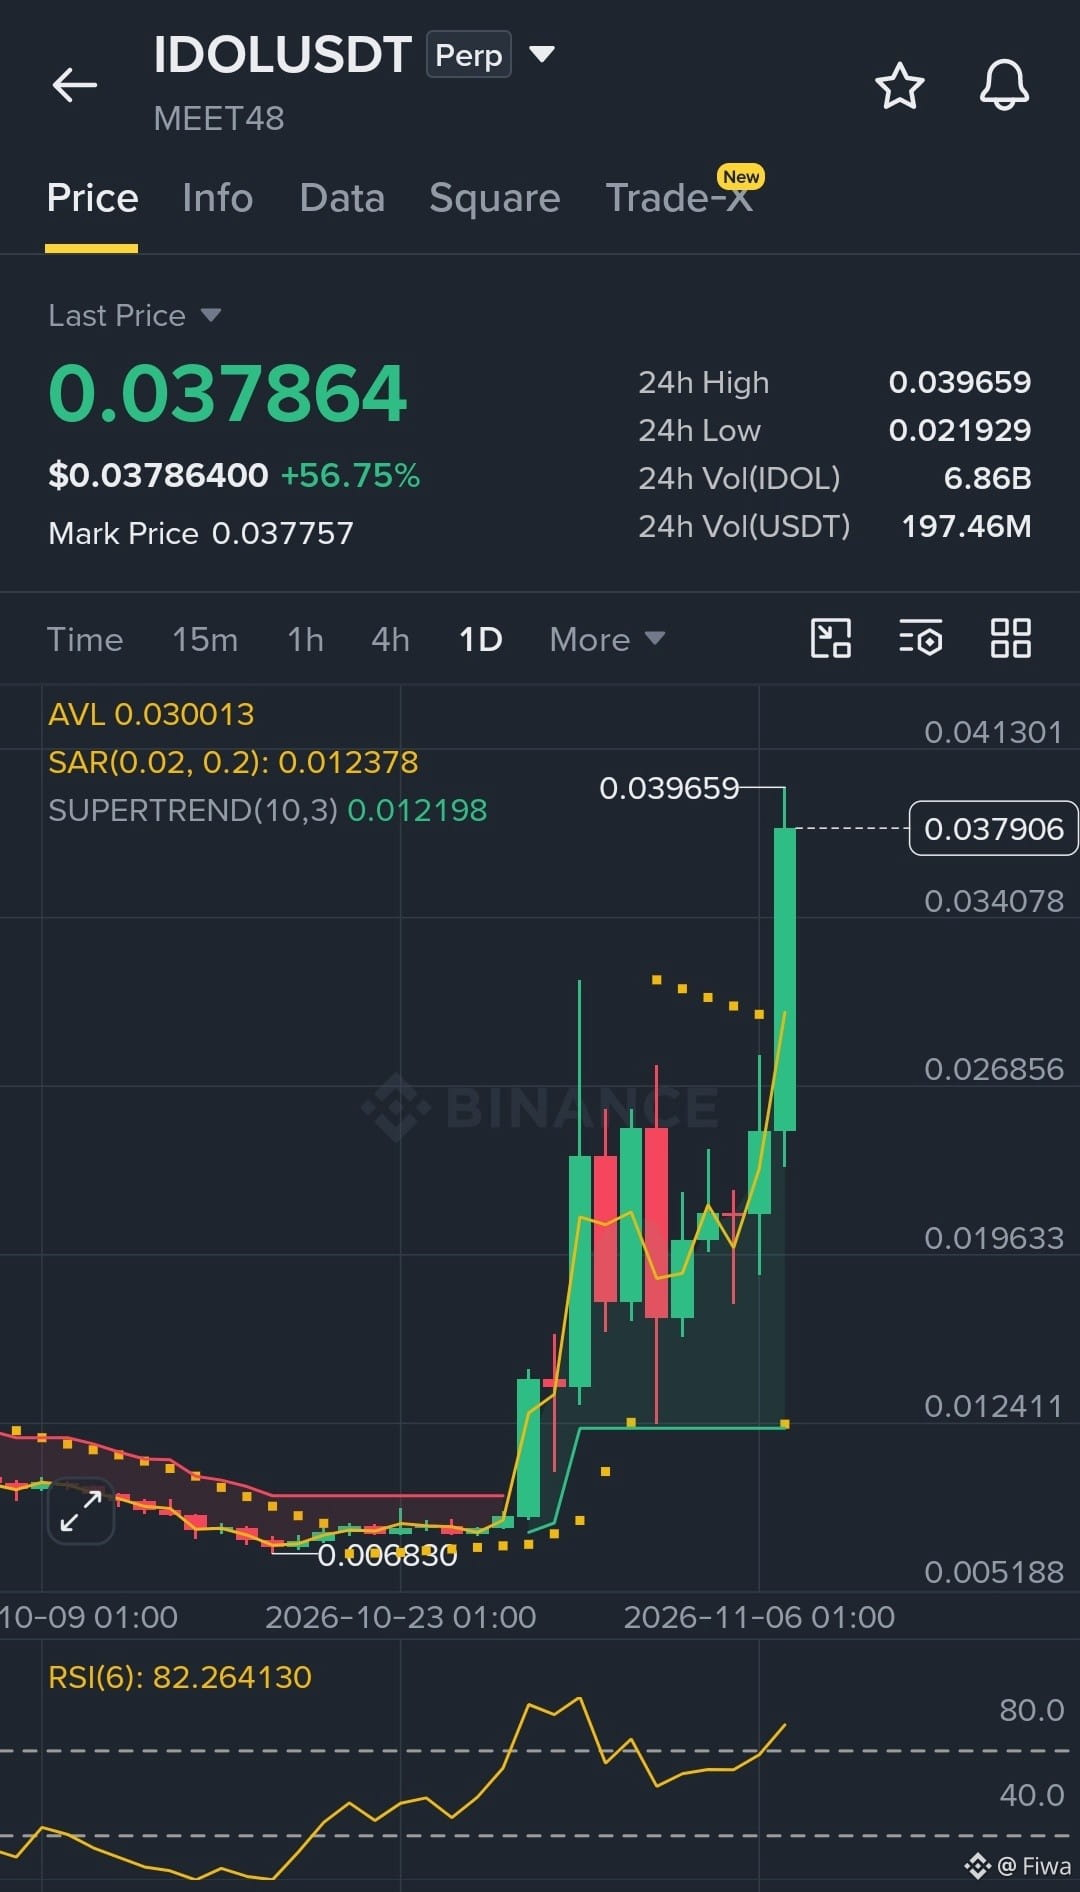
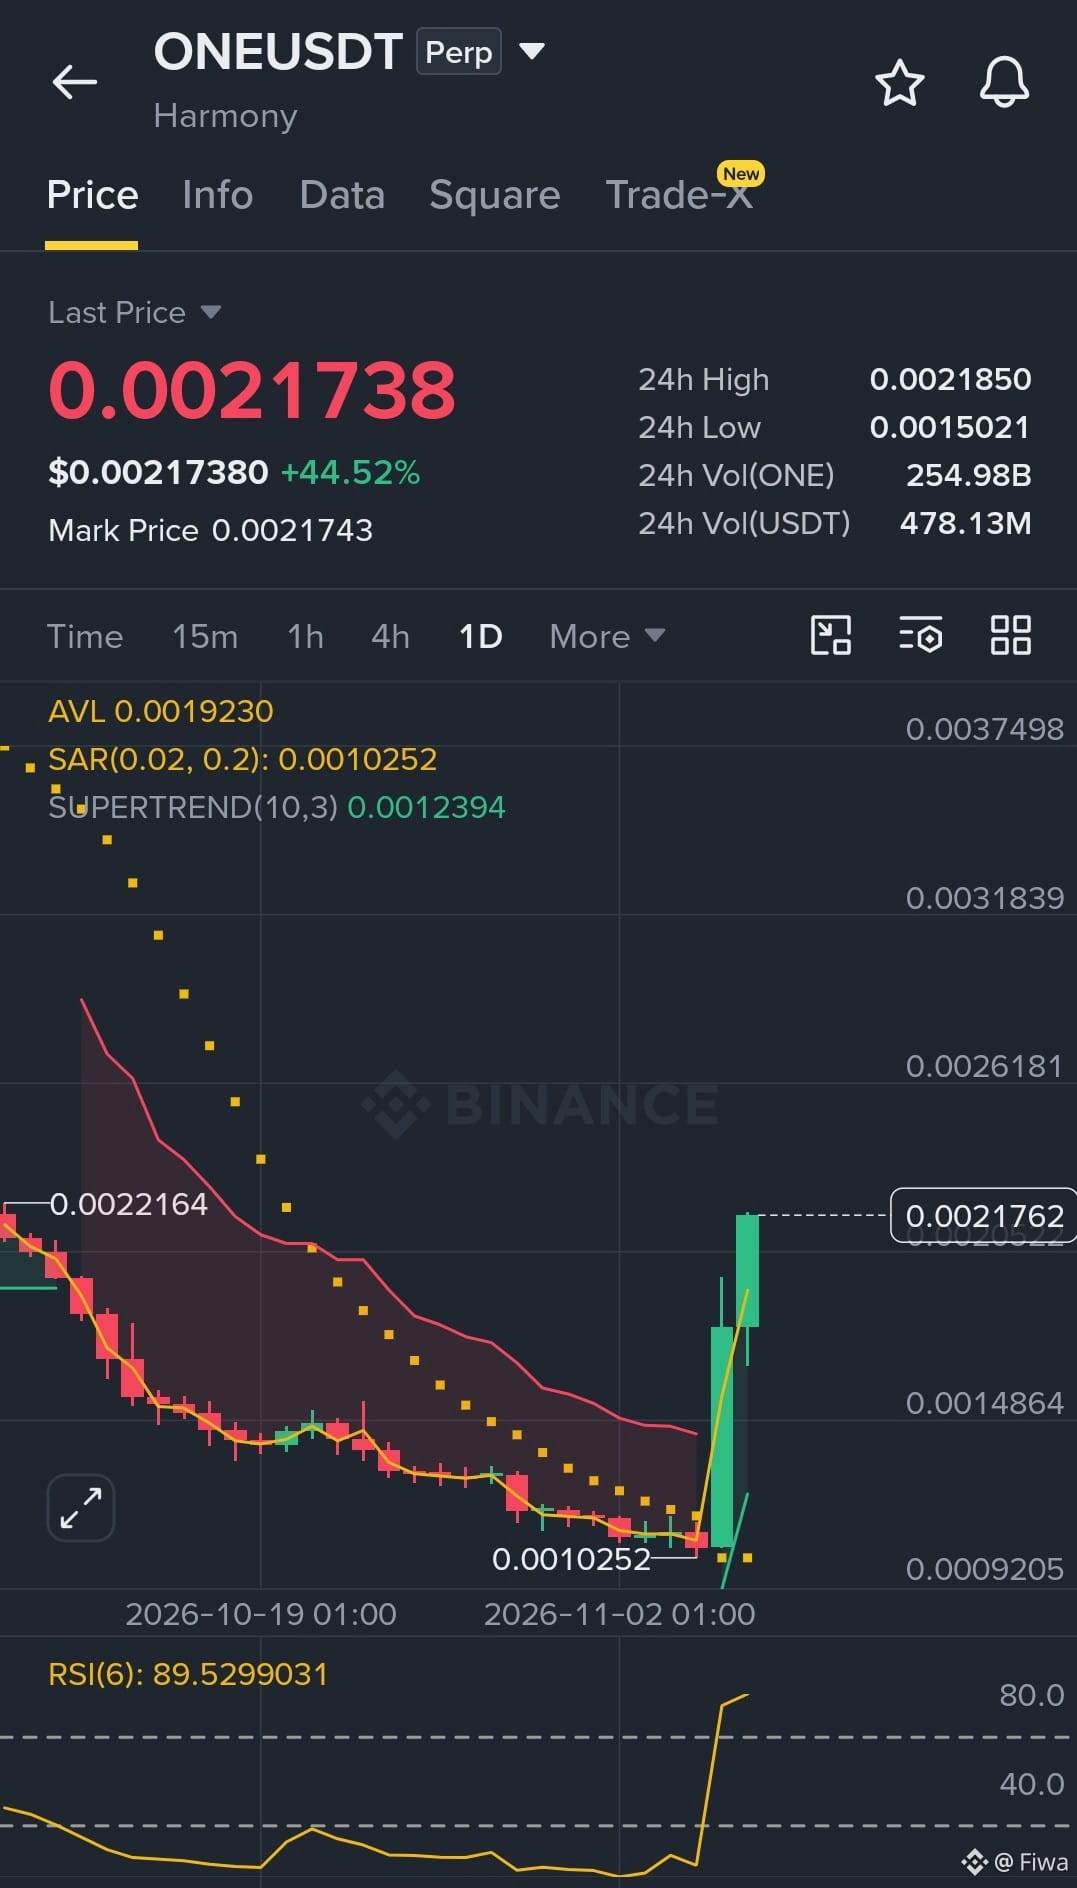
👀 THREE CHARTS, ONE THING IN COMMON: MOMENTUM!🚀
$ONE $AIN and $IDOL are starting to make some interesting moves, and I'm keeping all three on my radar.
Crypto rewards patience as much as it rewards timing. Don't get distracted by every market move. Stay focused, watch your levels, and enjoy the journey. 📈🔥
Which of these three are you watching most closely?🤔
#PriceProjections
{future}(ONEUSDT)
{future}(AINUSDT)
{future}(IDOLUSDT)
👀 THREE CHARTS, ONE THING IN COMMON: MOMENTUM!🚀
$ONE $AIN and $IDOL are starting to make some interesting moves, and I'm keeping all three on my radar.
Crypto rewards patience as much as it rewards timing. Don't get distracted by every market move. Stay focused, watch your levels, and enjoy the journey. 📈🔥
Which of these three are you watching most closely?🤔
#PriceProjections
$ONE $AIN and $IDOL are starting to make some interesting moves, and I'm keeping all three on my radar.
Crypto rewards patience as much as it rewards timing. Don't get distracted by every market move. Stay focused, watch your levels, and enjoy the journey. 📈🔥
Which of these three are you watching most closely?🤔
#PriceProjections

Fiwa
·
--
РостTruly $AKE cannot be trusted😂
As beautiful as the pump is🚀 so brutal will the dump be.
Got so profit from AKE yesterday? congratulations. You are trying to get some today, trade carefully. 👌
Do you think AKE still have some stunts to pull today?🤔
$ONE
$LYN
As beautiful as the pump is🚀 so brutal will the dump be.
Got so profit from AKE yesterday? congratulations. You are trying to get some today, trade carefully. 👌
Do you think AKE still have some stunts to pull today?🤔
$ONE
$LYN
1
833
·
--
Рост
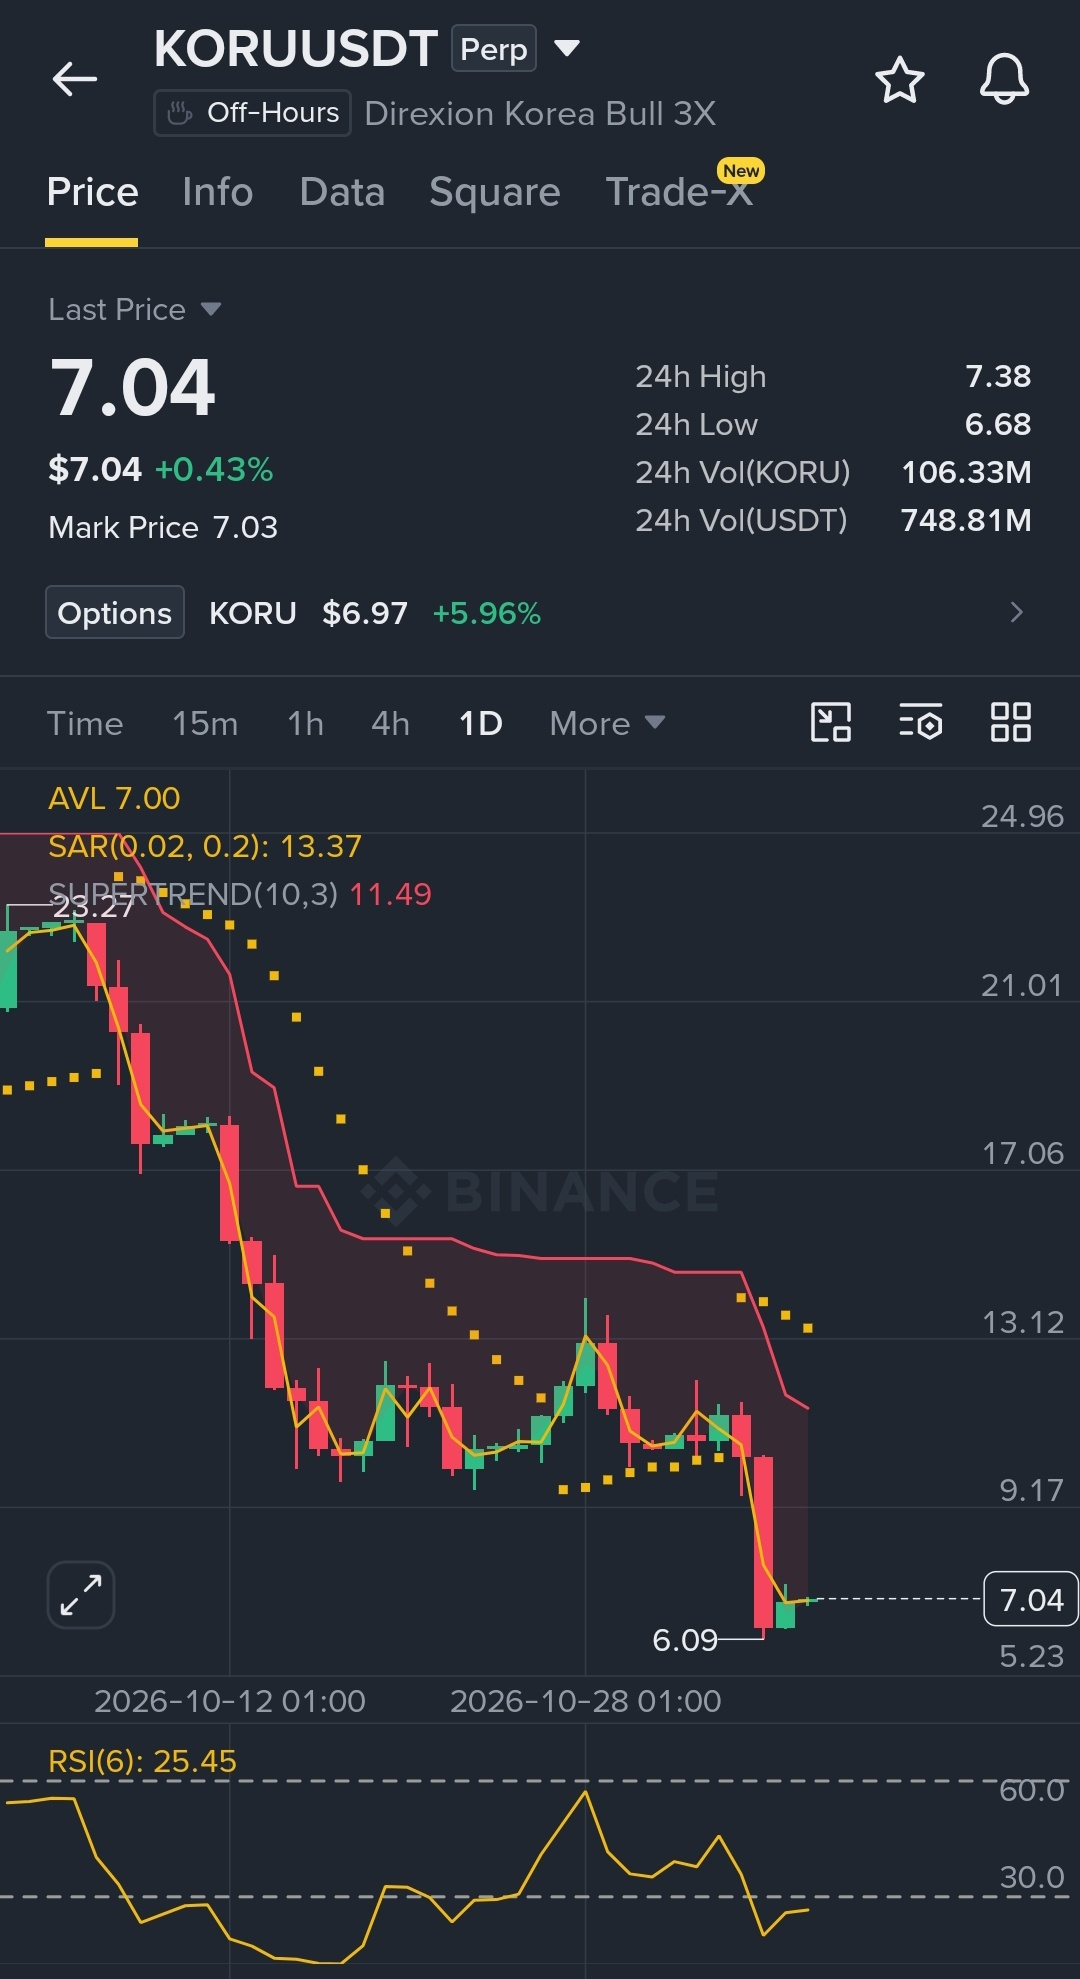
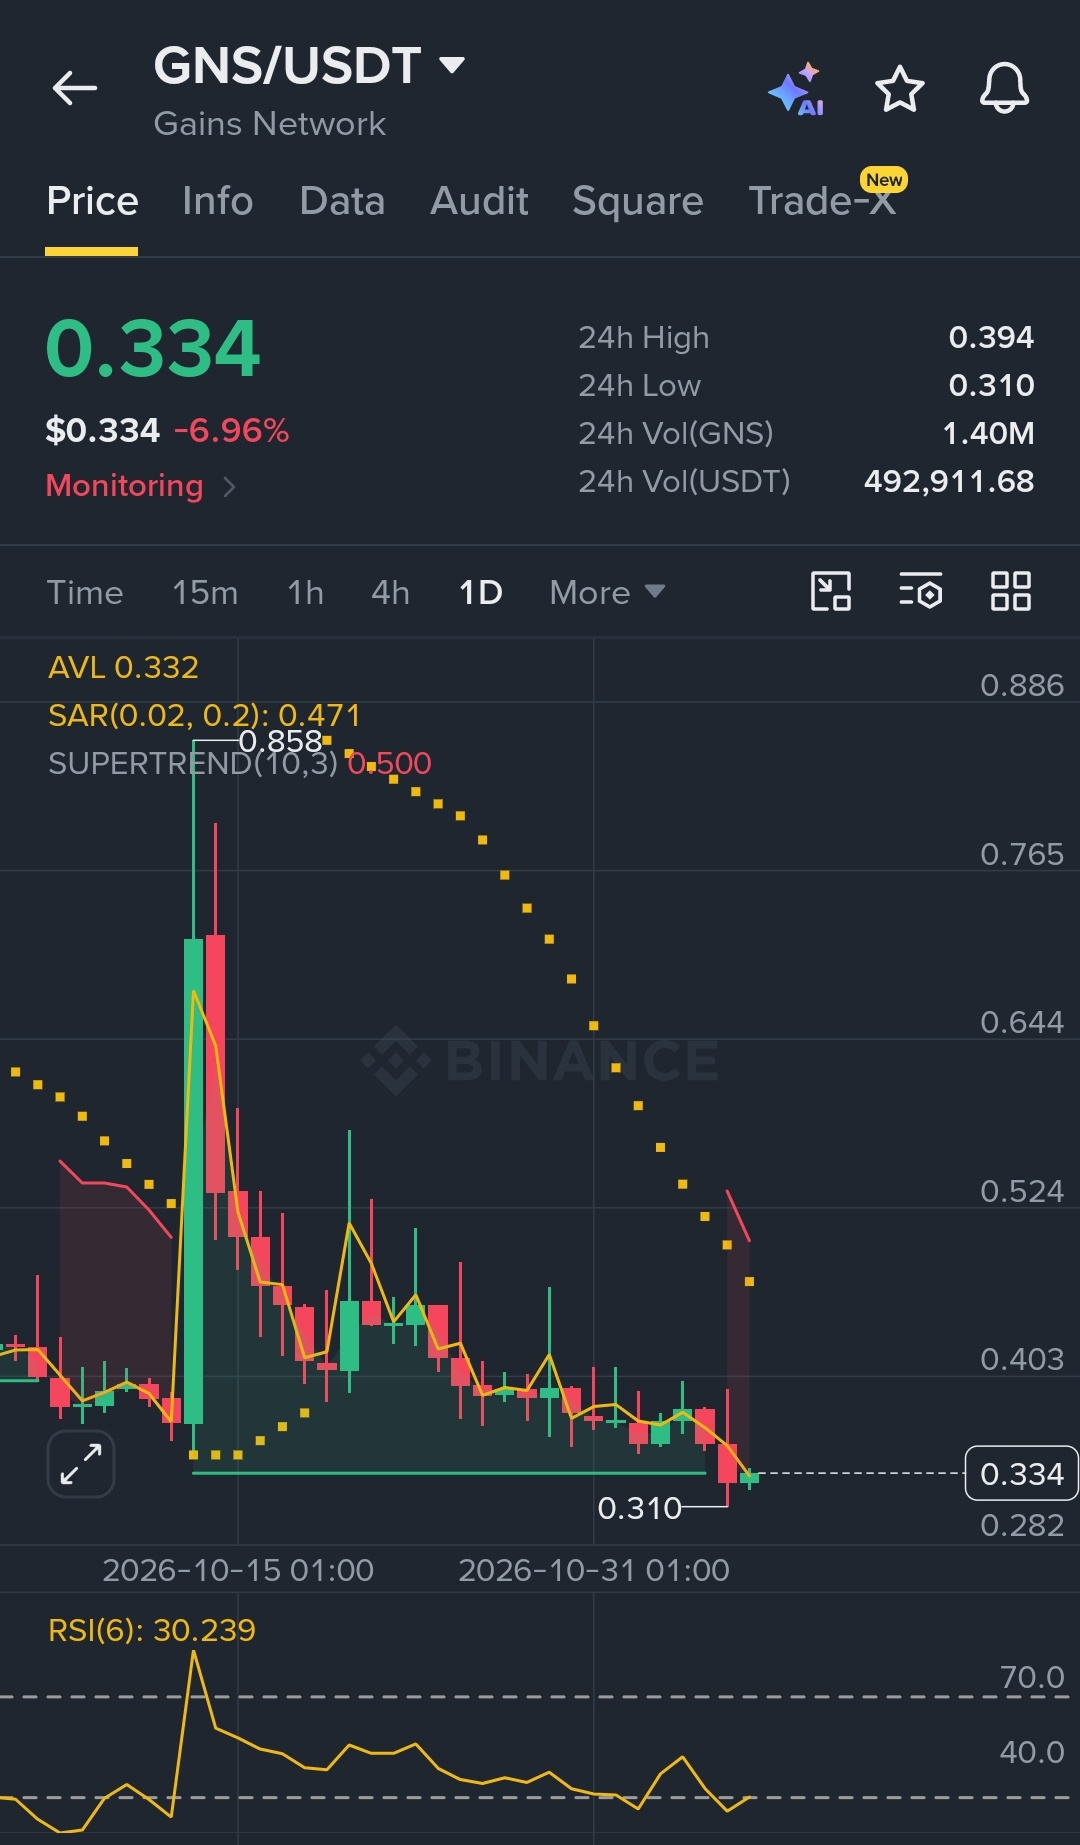
Is $KORU back ?👀
After it consecutively dumped from $25.77 to $6 it has successfully crossed into the $7 area with the RSI divergence giving a strong bullish signal.🚀
If you check the chart 📊 you'd see $GNS is also preparing for a massive pump.
Do you think $KORU is truly back or this is just a normal up and down swing?🤔
Like 👍 follow and share your thoughts 👌
#PriceProjections
{future}(KORUUSDT)
{spot}(GNSUSDT)
Is $KORU back ?👀
After it consecutively dumped from $25.77 to $6 it has successfully crossed into the $7 area with the RSI divergence giving a strong bullish signal.🚀
If you check the chart 📊 you'd see $GNS is also preparing for a massive pump.
Do you think $KORU is truly back or this is just a normal up and down swing?🤔
Like 👍 follow and share your thoughts 👌
#PriceProjections
After it consecutively dumped from $25.77 to $6 it has successfully crossed into the $7 area with the RSI divergence giving a strong bullish signal.🚀
If you check the chart 📊 you'd see $GNS is also preparing for a massive pump.
Do you think $KORU is truly back or this is just a normal up and down swing?🤔
Like 👍 follow and share your thoughts 👌
#PriceProjections


一杯冰美式--
·
--
$KORU 8块时期来临了,曾经有3次机会跑,没跑,跟着小韩一起毁灭吧
1
673
·
--
Падение
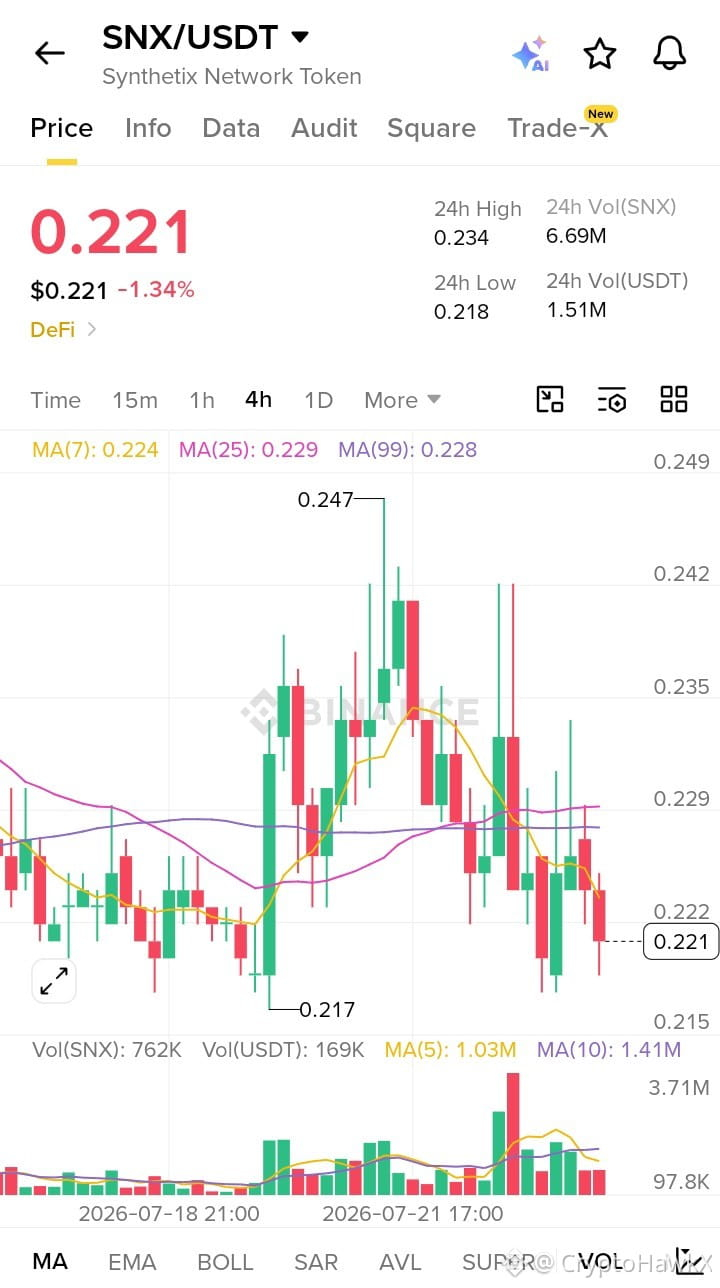
📉 $SNX SNX/USDT Market Update
SNX is trading under pressure on the 4H timeframe, with price slipping below the short-term moving averages. Recent candles show weak buying momentum and sellers continue to dominate in the short term. Unless SNX reclaims key resistance levels, the trend is likely to remain cautious with the risk of further downside.
Market Sentiment: 🐻 Bearish
#SNX #technicalanalyst USDT # #Crypto #CryptoTrading #BinanceHerYerde #TechnicalAnalysis_Tickeron #PriceProjections #Bearish #Trading #CryptoMarket #Support #Resistance # #USDT #MarketUpdate
📉 $SNX SNX/USDT Market Update
SNX is trading under pressure on the 4H timeframe, with price slipping below the short-term moving averages. Recent candles show weak buying momentum and sellers continue to dominate in the short term. Unless SNX reclaims key resistance levels, the trend is likely to remain cautious with the risk of further downside.
Market Sentiment: 🐻 Bearish
#SNX #technicalanalyst USDT # #Crypto #CryptoTrading #BinanceHerYerde #TechnicalAnalysis_Tickeron #PriceProjections #Bearish #Trading #CryptoMarket #Support #Resistance # #USDT #MarketUpdate
SNX is trading under pressure on the 4H timeframe, with price slipping below the short-term moving averages. Recent candles show weak buying momentum and sellers continue to dominate in the short term. Unless SNX reclaims key resistance levels, the trend is likely to remain cautious with the risk of further downside.
Market Sentiment: 🐻 Bearish
#SNX #technicalanalyst USDT # #Crypto #CryptoTrading #BinanceHerYerde #TechnicalAnalysis_Tickeron #PriceProjections #Bearish #Trading #CryptoMarket #Support #Resistance # #USDT #MarketUpdate
37


Войдите, чтобы посмотреть больше материала
Присоединяйтесь к пользователям криптовалют по всему миру на Binance Square
⚡️ Получайте новейшую и полезную информацию о криптоактивах.
💬 Нам доверяет крупнейшая в мире криптобиржа.
👍 Получите достоверные аналитические данные от верифицированных создателей контента.
Эл. почта/номер телефона
В тренде
1
#WhoWillSucceedJensenHuangatNvidia?
Просмотров: 126,147
1,458 обсуждают
2
#WhatWillDriveCryptoandStocks’NextRebound?
Просмотров: 514,221
3,316 обсуждают
3
#BitcoinActiveSupplyInProfitDropsBelow45%
Просмотров: 52,916
592 обсуждают
4
#KavaSaysAbnormalActivityLimitedToKavaLend
Просмотров: 26,733
325 обсуждают
5
#USSpotXRPETFsSeeLargestWeeklyOutflowIn8Months
Просмотров: 20,552
280 обсуждают
6
#USPPIMissMayEaseBTCPressure
Просмотров: 257,936
2,183 обсуждают
7
#WORPTLetsTouristsConvertCryptoToThaiBaht
Просмотров: 7,277
79 обсуждают
8
#TONStrategyReports$23.97MQ3NetLoss
Просмотров: 7,795
41 обсуждают
9
#PolkadotCommunityApprovesNewStrategyWith97%Vote
Просмотров: 24,137
277 обсуждают
10
#dYdXPlansV9.9UpgradeToShiftUSDCToInjective
Просмотров: 19,344
231 обсуждают