marketsentimenttoday

Просмотров: 19.8M
34,627 обсуждают
AFRIDIzmn
·
--
🚀 THE BIGGEST CRYPTO PUMP MAY COME WHEN NOBODY EXPECTS IT! The crypto market has a fascinating habit: it often surprises the majority. When everyone starts believing that the market is dying, prices keep falling, confidence disappears, and investors begin losing hope — that is when the market may be approaching an unexpected turning point. 📉 Fear grows. 😰 Investors panic. 🐻 Bearish sentiment dominates. 💰 Weak hands sell their holdings. But remember one thing: Markets don't necessarily bottom when everyone is optimistic. Sometimes, the strongest recoveries begin when almost everyone has given up hope. The next major crypto rally could begin at a moment when the majority expects another crash. Don't blindly follow the crowd. Study the market, manage your risk, and stay prepared. 🔥 When fear reaches its peak, opportunity may be closer than you think. #CryptoPsychology #MarketSentimentToday #BinanceSquare #cryptotrading #bullish
🚀 THE BIGGEST CRYPTO PUMP MAY COME WHEN NOBODY EXPECTS IT!

The crypto market has a fascinating habit: it often surprises the majority.

When everyone starts believing that the market is dying, prices keep falling, confidence disappears, and investors begin losing hope — that is when the market may be approaching an unexpected turning point.

📉 Fear grows.
😰 Investors panic.
🐻 Bearish sentiment dominates.
💰 Weak hands sell their holdings.

But remember one thing:

Markets don't necessarily bottom when everyone is optimistic. Sometimes, the strongest recoveries begin when almost everyone has given up hope.

The next major crypto rally could begin at a moment when the majority expects another crash.

Don't blindly follow the crowd. Study the market, manage your risk, and stay prepared.

🔥 When fear reaches its peak, opportunity may be closer than you think.

#CryptoPsychology #MarketSentimentToday #BinanceSquare #cryptotrading #bullish
·
--
📊 [MARKET SENTIMENT DIGEST] — Fact Sheet ⚡ No hype, no opinions — just raw market metrics and key industry commentary. 💡 ​⚡ Macro Alert: All eyes are on today's crucial U.S. Consumer Price Index (CPI) inflation release. Volatility is expected across risk assets as markets gauge the Fed's next policy stance. ​1️⃣ Crypto Fear & Greed Index ​Current Score: 37 / 100 (Fear) ​Status: Fear & Greed Index, maintaining a cautious stance in the fear band ahead of macro data releases. ​2️⃣ Derivatives & Funding Rates ​BTC Perpetual 8h Funding Rate: +0.0078% (OI-Weighted) ​Market Condition: Open interest remains stable with neutral-to-modest positive funding rates, reflecting balanced leverage without speculative crowding. ​3️⃣ Institutional ETF Net Daily Inflows ​US Spot BTC ETFs: -$411.55 Million (Net Outflow) ​Trend: ETF Analytics, highlighting net redemptions across spot funds in the latest session. ​4️⃣ 24-Hour Liquidation Heatmap ​Total Wiped Volume: ~$154.20 Million ​Ratio: ~62% Longs / ~38% Shorts ​Market Impact: Liquidation cascades primarily cleared out late-arriving long positions during minor intraday downside pullbacks. ​5️⃣ Bitcoin Dominance (BTC.D) ​Current Level: ~60.3% ​Capital Flow: Sourced from CoinMarketCap Dominance Analytics, BTC dominance holds firm above 60%, keeping broader altcoin liquidity constrained. ​6️⃣ Stablecoin Dominance (USDT.D + USDC.D) ​Current Level: ~11.1% (Total Stablecoin Market Cap ~$295.6B) ​Dry Powder Indicator: Elevated stablecoin market share indicates significant sidelined liquidity waiting for clear trend direction. ​💬 How are you interpreting these numbers today? Are you holding cash or deploying capital? Drop your thoughts below! 👇 ​#MarketSentimentToday #CryptoData $BTC (Data source: Public market indicators. Provided for informational purposes only. Not financial advice.)
📊 [MARKET SENTIMENT DIGEST] — Fact Sheet ⚡

No hype, no opinions — just raw market metrics and key industry commentary. 💡

​⚡ Macro Alert: All eyes are on today's crucial U.S. Consumer Price Index (CPI) inflation release. Volatility is expected across risk assets as markets gauge the Fed's next policy stance.

​1️⃣ Crypto Fear & Greed Index

​Current Score: 37 / 100 (Fear)

​Status: Fear & Greed Index, maintaining a cautious stance in the fear band ahead of macro data releases.

​2️⃣ Derivatives & Funding Rates

​BTC Perpetual 8h Funding Rate: +0.0078% (OI-Weighted)

​Market Condition: Open interest remains stable with neutral-to-modest positive funding rates, reflecting balanced leverage without speculative crowding.

​3️⃣ Institutional ETF Net Daily Inflows

​US Spot BTC ETFs: -$411.55 Million (Net Outflow)

​Trend: ETF Analytics, highlighting net redemptions across spot funds in the latest session.

​4️⃣ 24-Hour Liquidation Heatmap

​Total Wiped Volume: ~$154.20 Million

​Ratio: ~62% Longs / ~38% Shorts

​Market Impact: Liquidation cascades primarily cleared out late-arriving long positions during minor intraday downside pullbacks.

​5️⃣ Bitcoin Dominance (BTC.D)

​Current Level: ~60.3%

​Capital Flow: Sourced from CoinMarketCap Dominance Analytics, BTC dominance holds firm above 60%, keeping broader altcoin liquidity constrained.

​6️⃣ Stablecoin Dominance (USDT.D + USDC.D)

​Current Level: ~11.1% (Total Stablecoin Market Cap ~$295.6B)

​Dry Powder Indicator: Elevated stablecoin market share indicates significant sidelined liquidity waiting for clear trend direction.

​💬 How are you interpreting these numbers today? Are you holding cash or deploying capital? Drop your thoughts below! 👇

​#MarketSentimentToday #CryptoData $BTC
(Data source: Public market indicators. Provided for informational purposes only. Not financial advice.)

Crypto red again. Here's what's going on 🔴 If your feed is full of panic today, you're not imagining it. Bitcoin and Ethereum are both sliding, and a handful of things landed at once. 🏦 The Fed. October's jobs report came in at 165K when the forecast was 65K. That made a December rate hike look a lot more likely (markets are pricing it around 77%), and a sell-off in tech and AI stocks dragged risk appetite down with it. 💸 ETF money leaving. US spot Bitcoin ETFs shed roughly $1.3B last week, their worst weekly outflow since June. ⚡ Liquidations. Plenty of traders were over-leveraged on longs. Once prices dipped, forced selling kicked in and turned small drops into bigger ones. 🗳️ Politics. Democrats took both the House and the Senate in the midterms. Bitcoin poked above $80K on Nov 4, then handed it back. The CLARITY Act, the crypto market-structure bill, now looks shakier. 🌍 Mixed signals abroad. Russia will let retail investors buy Bitcoin, Ether and USDT starting Nov 17, but only up to 300,000 rubles a year, which won't make up for the ETF outflows. On top of that, a huge Binance hack (reported at around $6.3B, with North Korea-linked attackers suspected) shook confidence. 😨 The Fear and Greed index is sitting near 28. Sentiment is moving faster than fundamentals, and we've seen days like this before. This market loves to surprise people on both sides. So, is Ethereum getting hit harder than Bitcoin right now? And where do you stand today: buying the dip or sitting on your hands? Tell me below. 💬 #MarketSentimentToday #BinanceMegadrop #Write2Earn! $BTC {spot}(BTCUSDT)
Crypto red again. Here's what's going on 🔴

If your feed is full of panic today, you're not imagining it. Bitcoin and Ethereum are both sliding, and a handful of things landed at once.

🏦 The Fed. October's jobs report came in at 165K when the forecast was 65K. That made a December rate hike look a lot more likely (markets are pricing it around 77%), and a sell-off in tech and AI stocks dragged risk appetite down with it.

💸 ETF money leaving. US spot Bitcoin ETFs shed roughly $1.3B last week, their worst weekly outflow since June.

⚡ Liquidations. Plenty of traders were over-leveraged on longs. Once prices dipped, forced selling kicked in and turned small drops into bigger ones.

🗳️ Politics. Democrats took both the House and the Senate in the midterms. Bitcoin poked above $80K on Nov 4, then handed it back. The CLARITY Act, the crypto market-structure bill, now looks shakier.

🌍 Mixed signals abroad. Russia will let retail investors buy Bitcoin, Ether and USDT starting Nov 17, but only up to 300,000 rubles a year, which won't make up for the ETF outflows. On top of that, a huge Binance hack (reported at around $6.3B, with North Korea-linked attackers suspected) shook confidence.

😨 The Fear and Greed index is sitting near 28. Sentiment is moving faster than fundamentals, and we've seen days like this before. This market loves to surprise people on both sides.

So, is Ethereum getting hit harder than Bitcoin right now? And where do you stand today: buying the dip or sitting on your hands? Tell me below. 💬
#MarketSentimentToday #BinanceMegadrop #Write2Earn!
$BTC
Live price of the still-open 2026-11-09 candle; 1-day moves measured against the open on 2026-11-09All four are lower on the day and across all three windows, with $ETH the weakest on the day and SOL the weakest over a week and a month. Total crypto market cap stands at about $2.49 trillion, with the source's change reading -2.25% (it does not state the window for that change).   Sentiment   The Crypto Fear & Greed Index reads 28 (Fear) for 2026-11-09, so it is current. That is 1 point below yesterday's 29 (Fear), 5 points below last week's 33 (Fear), and 28 points below last month's 56 (Neutral) — sentiment has shifted from neutral into fear over the past month and has. stayed there The past year's high was 82 (27 Aug 2026) and its low was 5 (6 Feb 2026).   News Nov, Drivers   9 Benzinga: majors slid overnight as investors awaited inflation data; roughly $1 billion was liquidated across crypto in 24 hours, predominantly from long positions (Coinglass), and BTC open interest slipped 0.75%. US CPI is due Tuesday and PPI Friday.   9 Nov, Benzinga: US spot crypto ETF flows stayed negative — $BTC funds saw over $411 million of outflows on Friday and about $1.2 billion this month; ETH funds about $365 million this month; $SOL ETFs over $26 million in November. The same piece notes markets now price a possible Fed hike at the December meeting.   8 Nov, Benzinga: SOL extended its sell-off after ETF redemptions continued for a fifth straight week, with the token technically in a bear market from its October high and trading below its 50- and 200-day EMAs.   Facts above are as reported; the interpretation that flows and macro expectations are driving the weakness is the cited outlets' framing, not a verified cause.   What to Watch and Limits   Open items from the data: the Tuesday CPI and Friday PPI prints, December Fed pricing, whether ETF outflows persist, and whether sentiment stabilizes above or slips further into fear. All four assets are down across 7- and 30-day windows, so this is a broad move rather than one asset's story.   This is a data summary, not a forecast or trading advice — short-term direction cannot be reliably predicted. #MarketSentimentToday #Market_Update #BTC #ETH {future}(BTCUSDT) {future}(ETHUSDT) {future}(SOLUSDT)

Live price of the still-open 2026-11-09 candle; 1-day moves measured against the open on 2026-11-09

All four are lower on the day and across all three windows, with $ETH the weakest on the day and SOL the weakest over a week and a month. Total crypto market cap stands at about $2.49 trillion, with the source's change reading -2.25% (it does not state the window for that change).

Sentiment

The Crypto Fear & Greed Index reads 28 (Fear) for 2026-11-09, so it is current. That is 1 point below yesterday's 29 (Fear), 5 points below last week's 33 (Fear), and 28 points below last month's 56 (Neutral) — sentiment has shifted from neutral into fear over the past month and has. stayed there The past year's high was 82 (27 Aug 2026) and its low was 5 (6 Feb 2026).

News Nov, Drivers

9 Benzinga: majors slid overnight as investors awaited inflation data; roughly $1 billion was liquidated across crypto in 24 hours, predominantly from long positions (Coinglass), and BTC open interest slipped 0.75%. US CPI is due Tuesday and PPI Friday.

9 Nov, Benzinga: US spot crypto ETF flows stayed negative — $BTC funds saw over $411 million of outflows on Friday and about $1.2 billion this month; ETH funds about $365 million this month; $SOL ETFs over $26 million in November. The same piece notes markets now price a possible Fed hike at the December meeting.

8 Nov, Benzinga: SOL extended its sell-off after ETF redemptions continued for a fifth straight week, with the token technically in a bear market from its October high and trading below its 50- and 200-day EMAs.

Facts above are as reported; the interpretation that flows and macro expectations are driving the weakness is the cited outlets' framing, not a verified cause.

What to Watch and Limits

Open items from the data: the Tuesday CPI and Friday PPI prints, December Fed pricing, whether ETF outflows persist, and whether sentiment stabilizes above or slips further into fear. All four assets are down across 7- and 30-day windows, so this is a broad move rather than one asset's story.

This is a data summary, not a forecast or trading advice — short-term direction cannot be reliably predicted.
#MarketSentimentToday #Market_Update #BTC #ETH

·
--
📊 [MARKET SENTIMENT DIGEST] — Fact Sheet ⚡ No hype, no opinions — just raw market metrics and key industry commentary. 💡 ​1️⃣ Crypto Fear & Greed Index ​Current Score: 26 / 100 (Fear) ​Status: Market participants maintain defensive positioning. ​2️⃣ Derivatives & Funding Rates ​BTC Perpetual 8h Funding Rate: +0.0075% (OI-Weighted) ​Market Condition: Funding rates remain modestly positive; open interest stays stable across major venues without excessive speculative crowding. ​3️⃣ Institutional ETF Net Daily Inflows ​US Spot BTC ETFs: -$411.90 Million (Net Outflow) ​Trend: ETF Analytics showing net institutional redemptions across spot products. ​4️⃣ 24-Hour Liquidation Heatmap ​Total Wiped Volume: ~$158.40 Million ​Ratio: ~63% Longs / ~37% Shorts ​Market Impact: Intraday price pullbacks selectively flushed out overleveraged long positions during choppy range-bound action. ​5️⃣ Bitcoin Dominance (BTC.D) ​Current Level: ~59.6% ​Capital Flow: BTC dominance holds strong near the 60% threshold, ensuring capital concentration stays firmly anchored in Bitcoin while altcoin liquidity remains constrained. ​6️⃣ Stablecoin Dominance (USDT.D + USDC.D) ​Current Level: ~11.1% (Total Stablecoin Market Cap ~$295.4B) ​Dry Powder Indicator: Substantial sidelined stablecoin reserves remain parked on the sidelines, acting as dry powder waiting for a clear market breakout signal. ​💬 How are you interpreting these numbers today? Are you holding cash or deploying capital? Drop your thoughts below! 👇 ​#MarketSentimentToday $BTC (Data source: Provided for informational purposes only. Not financial advice.)
📊 [MARKET SENTIMENT DIGEST] — Fact Sheet ⚡

No hype, no opinions — just raw market metrics and key industry commentary. 💡

​1️⃣ Crypto Fear & Greed Index

​Current Score: 26 / 100 (Fear)

​Status: Market participants maintain defensive positioning.

​2️⃣ Derivatives & Funding Rates

​BTC Perpetual 8h Funding Rate: +0.0075% (OI-Weighted)

​Market Condition: Funding rates remain modestly positive; open interest stays stable across major venues without excessive speculative crowding.

​3️⃣ Institutional ETF Net Daily Inflows

​US Spot BTC ETFs: -$411.90 Million (Net Outflow)

​Trend: ETF Analytics showing net institutional redemptions across spot products.

​4️⃣ 24-Hour Liquidation Heatmap

​Total Wiped Volume: ~$158.40 Million

​Ratio: ~63% Longs / ~37% Shorts

​Market Impact: Intraday price pullbacks selectively flushed out overleveraged long positions during choppy range-bound action.

​5️⃣ Bitcoin Dominance (BTC.D)

​Current Level: ~59.6%

​Capital Flow: BTC dominance holds strong near the 60% threshold, ensuring capital concentration stays firmly anchored in Bitcoin while altcoin liquidity remains constrained.

​6️⃣ Stablecoin Dominance (USDT.D + USDC.D)

​Current Level: ~11.1% (Total Stablecoin Market Cap ~$295.4B)

​Dry Powder Indicator: Substantial sidelined stablecoin reserves remain parked on the sidelines, acting as dry powder waiting for a clear market breakout signal.

​💬 How are you interpreting these numbers today? Are you holding cash or deploying capital? Drop your thoughts below! 👇

​#MarketSentimentToday $BTC

(Data source: Provided for informational purposes only. Not financial advice.)
Статья
Basis: 8 Nov 2026, Asia/Singapore (day open, still prices are the live candle close).The tape is flat to slightly negative on the day after a sharp sell-off earlier in the week — $BTC is holding just above 75.7k, $ETH near 2,235, and $SOL is the weakest over both the 7-day and 30-day windows.   Sentiment   Fear & Greed Index: 32 — Fear, dated 8 Nov 2026 (matches today, so not stale).   Yesterday: 32 (Fear) — unchanged   Last week: 36 (Fear)   Last month: 56 (Neutral) — a clear slide from neutral into fear over the past four weeks   One year ago: 25 (Fear); yearly high 82 (Extreme greed, 27 Aug 2026), yearly low 5 (6 Feb 2026)   Aggregate context from the same source: total crypto market cap ≈ $2.54T, down 0.32% over the period measured, with total volume ≈ $30.1B, down 56.9% — thin participation alongside the fear reading.   News drivers   6–7 Nov, Benzinga: Broad crypto sell-off alongside equities, with BTC touching its lowest since mid-September and ETH hitting a ~10-week low; roughly $1.2B liquidated from leveraged crypto positions in 24 hours, mostly longs. Sentiment indicators reverted to fear. (Fact; the causal attribution to AI-sector risk pricing is the article's interpretation.)   7 Nov, Benzinga: Analysts quoted by Coin Bureau/podcasts describe the market as possibly near a bottom but see risk of one more decline first — cited: elevated VIX, stable Treasury yields, and continued project revenue. This is commentary and forecasting, not observed data.   6 Nov, Benzinga: Democrats are reportedly preparing a rewrite of the CLARITY Act that would expand SEC oversight and limit CFTC authority; the industry's policy window is described as narrowing. Regulatory uncertainty is a live macro input.   What to watch and limits   Whether BTC holds the low-75k area it swept this week; ETH and SOL have both fallen further from their 30-day levels than BTC.   Volume is running very light, which tends to amplify moves in both directions.   Index is at 32 but unchanged day-over-day — fear is persistent rather than accelerating.   This is a data summary from spot market data, the Fear & Greed Index, and dated news; nothing here is a forecast, and it is not investment or trading advice. Want me to check a specific pair's chart or turn any of this into a rules-based strategy you can backtest? #MarketSentimentToday #BTC #ETH #solana {future}(BTCUSDT) {future}(ETHUSDT) {future}(SOLUSDT)

Basis: 8 Nov 2026, Asia/Singapore (day open, still prices are the live candle close).

The tape is flat to slightly negative on the day after a sharp sell-off earlier in the week — $BTC is holding just above 75.7k, $ETH near 2,235, and $SOL is the weakest over both the 7-day and 30-day windows.

Sentiment

Fear & Greed Index: 32 — Fear, dated 8 Nov 2026 (matches today, so not stale).

Yesterday: 32 (Fear) — unchanged

Last week: 36 (Fear)

Last month: 56 (Neutral) — a clear slide from neutral into fear over the past four weeks

One year ago: 25 (Fear); yearly high 82 (Extreme greed, 27 Aug 2026), yearly low 5 (6 Feb 2026)

Aggregate context from the same source: total crypto market cap ≈ $2.54T, down 0.32% over the period measured, with total volume ≈ $30.1B, down 56.9% — thin participation alongside the fear reading.

News drivers

6–7 Nov, Benzinga: Broad crypto sell-off alongside equities, with BTC touching its lowest since mid-September and ETH hitting a ~10-week low; roughly $1.2B liquidated from leveraged crypto positions in 24 hours, mostly longs. Sentiment indicators reverted to fear. (Fact; the causal attribution to AI-sector risk pricing is the article's interpretation.)

7 Nov, Benzinga: Analysts quoted by Coin Bureau/podcasts describe the market as possibly near a bottom but see risk of one more decline first — cited: elevated VIX, stable Treasury yields, and continued project revenue. This is commentary and forecasting, not observed data.

6 Nov, Benzinga: Democrats are reportedly preparing a rewrite of the CLARITY Act that would expand SEC oversight and limit CFTC authority; the industry's policy window is described as narrowing. Regulatory uncertainty is a live macro input.

What to watch and limits

Whether BTC holds the low-75k area it swept this week; ETH and SOL have both fallen further from their 30-day levels than BTC.

Volume is running very light, which tends to amplify moves in both directions.

Index is at 32 but unchanged day-over-day — fear is persistent rather than accelerating.

This is a data summary from spot market data, the Fear & Greed Index, and dated news; nothing here is a forecast, and it is not investment or trading advice. Want me to check a specific pair's chart or turn any of this into a rules-based strategy you can backtest?
#MarketSentimentToday #BTC #ETH #solana

·
--
📊 [MARKET SENTIMENT DIGEST] — Fact Sheet ⚡ No hype, no opinions — just raw market metrics and key industry commentary. 💡 1️⃣ Crypto Fear & Greed Index Current Score: 32 / 100 (Fear) Status: Fear & Greed Index, reflecting persistent caution across the broader crypto market. 2️⃣ Derivatives & Funding Rates BTC Perpetual 8h Funding Rate: +0.0071% Market Condition: Open interest remains stable with minimal positive funding skew, indicating balanced leverage without aggressive speculative crowding. 3️⃣ Institutional ETF Net Daily Inflows US Spot BTC ETFs: +$430.20 Million (Net Inflow) Trend:ETF Data, showing a sharp rebound in institutional net buying power across spot products. 4️⃣ 24-Hour Liquidation Heatmap Total Wiped Volume: ~$182.50 Million Ratio: ~58% Longs / ~42% Shorts Market Impact: Mild intraday price chops selectively swept overleveraged long positions while keeping overall leverage fairly contained. 5️⃣ Social Sentiment & Leader Spotlight Leader Spotlight: Macro & Institutional Flows Key Commentary: "Institutional capital returning to spot ETFs highlights underlying demand resilience beneath short-term macro noise." Impact: Social channels are shifting focus toward structural accumulation and long-term liquidity support. 6️⃣ Bitcoin Dominance (BTC.D) Current Level: ~59.9% Capital Flow: BTC dominance stays firm near the 60% threshold, keeping capital concentration anchored in Bitcoin while altcoin liquidity stays tightly restricted. 7️⃣ Stablecoin Dominance (USDT.D + USDC.D) Current Level: ~10.9% (Total Stablecoin Market Cap ~$296.5B) Dry Powder Indicator: Elevated stablecoin supply points to robust sideline capital reserves waiting for clearer trend confirmation. #MarketSentimentToday #CryptoData $BTC #CryptoMetrics (Data source: Provided for informational purposes only. Not financial advice.)
📊 [MARKET SENTIMENT DIGEST] — Fact Sheet ⚡
No hype, no opinions — just raw market metrics and key industry commentary. 💡
1️⃣ Crypto Fear & Greed Index
Current Score: 32 / 100 (Fear)
Status: Fear & Greed Index, reflecting persistent caution across the broader crypto market.
2️⃣ Derivatives & Funding Rates
BTC Perpetual 8h Funding Rate: +0.0071%
Market Condition: Open interest remains stable with minimal positive funding skew, indicating balanced leverage without aggressive speculative crowding.
3️⃣ Institutional ETF Net Daily Inflows
US Spot BTC ETFs: +$430.20 Million (Net Inflow)
Trend:ETF Data, showing a sharp rebound in institutional net buying power across spot products.
4️⃣ 24-Hour Liquidation Heatmap
Total Wiped Volume: ~$182.50 Million
Ratio: ~58% Longs / ~42% Shorts
Market Impact: Mild intraday price chops selectively swept overleveraged long positions while keeping overall leverage fairly contained.
5️⃣ Social Sentiment & Leader Spotlight
Leader Spotlight: Macro & Institutional Flows
Key Commentary: "Institutional capital returning to spot ETFs highlights underlying demand resilience beneath short-term macro noise."
Impact: Social channels are shifting focus toward structural accumulation and long-term liquidity support.
6️⃣ Bitcoin Dominance (BTC.D)
Current Level: ~59.9%
Capital Flow: BTC dominance stays firm near the 60% threshold, keeping capital concentration anchored in Bitcoin while altcoin liquidity stays tightly restricted.
7️⃣ Stablecoin Dominance (USDT.D + USDC.D)
Current Level: ~10.9% (Total Stablecoin Market Cap ~$296.5B)
Dry Powder Indicator: Elevated stablecoin supply points to robust sideline capital reserves waiting for clearer trend confirmation.
#MarketSentimentToday #CryptoData $BTC #CryptoMetrics
(Data source: Provided for informational purposes only. Not financial advice.)
·
--
Рост
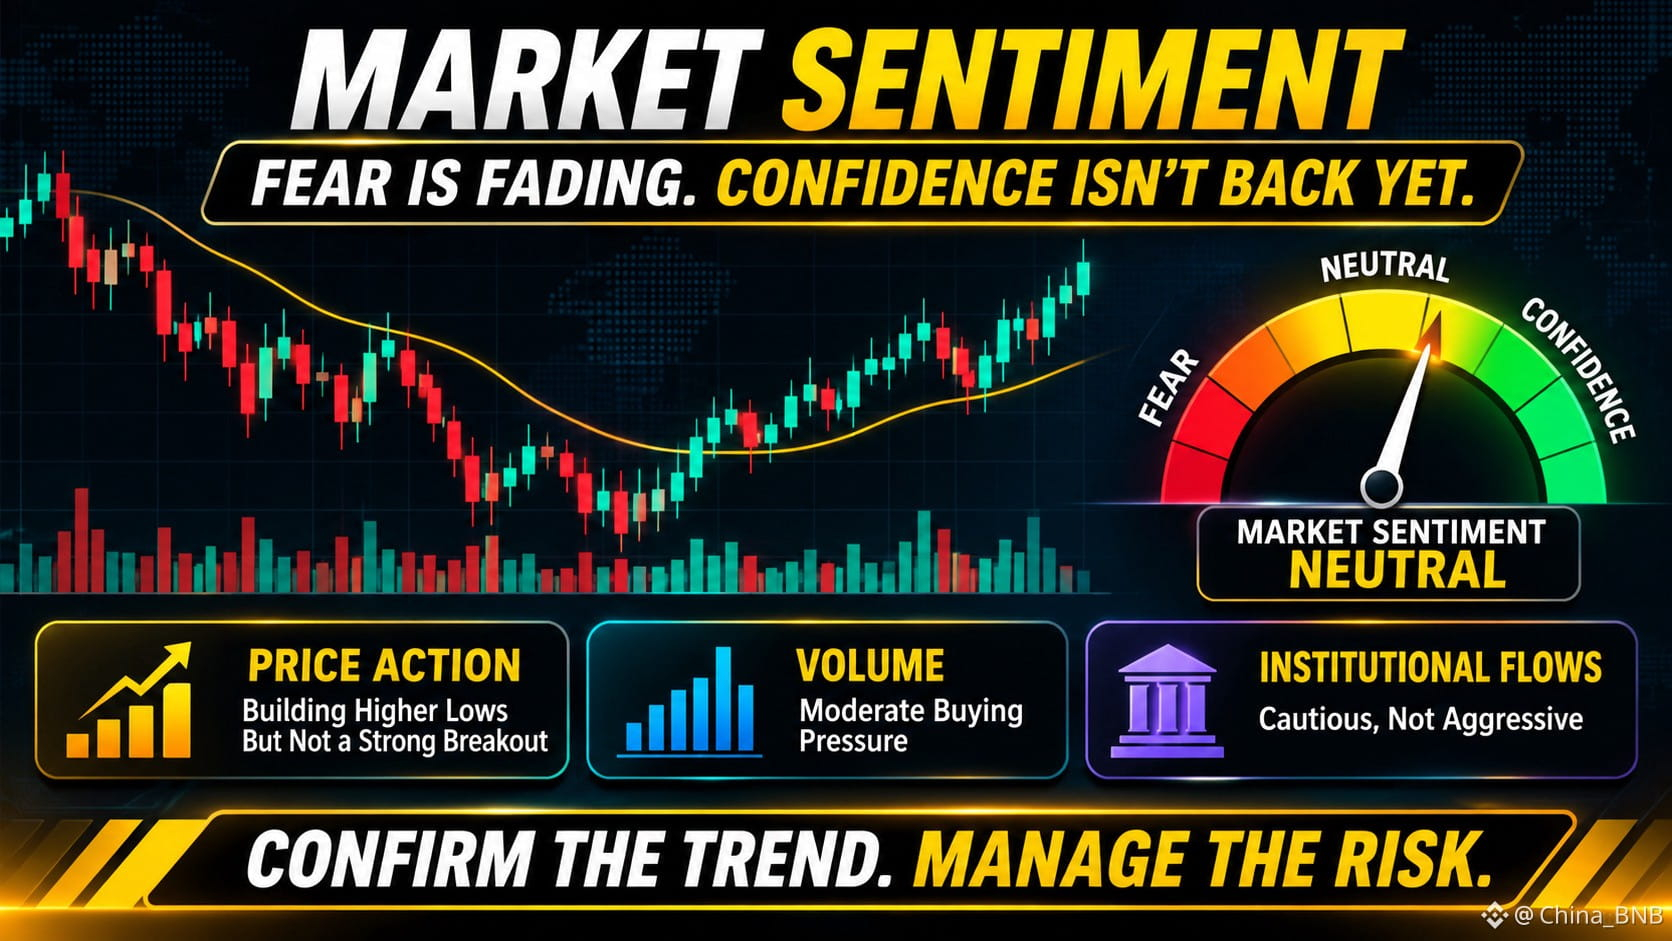
Market Sentiment: Fear Is Fading, But Confidence Has Not Returned Yet The market is not driven by price alone. It is driven by what investors believe will happen next. When fear dominates, traders become cautious, liquidity weakens, and even positive news can trigger selling. When confidence returns, buyers begin looking for opportunities before the broader market confirms a recovery. Currently, market sentiment remains a battle between uncertainty and opportunity. Investors are watching Bitcoin's price action, institutional money flows, macroeconomic developments, and whether buying pressure can sustain the next move. The key signals to watch:🔑 💰- Bitcoin price action: Is the market building higher lows or struggling to recover? 📊- Volume: Is buying momentum supported by real participation? 📜- Institutional flows: Are investors accumulating or reducing exposure? ✳️- Market psychology: Are traders buying with confidence or reacting emotionally? The most important lesson is that sentiment can change before the trend becomes obvious, but not every bounce signals a bullish reversal. Smart traders focus on confirmation, manage risk, and avoid making decisions based on fear or excitement. The market rewards patience more than predictions. The next opportunity may come from understanding the sentiment shift before the crowd fully reacts. #MarketSentimentToday
Market Sentiment: Fear Is Fading, But Confidence Has Not Returned Yet

The market is not driven by price alone. It is driven by what investors believe will happen next.

When fear dominates, traders become cautious, liquidity weakens, and even positive news can trigger selling. When confidence returns, buyers begin looking for opportunities before the broader market confirms a recovery.

Currently, market sentiment remains a battle between uncertainty and opportunity. Investors are watching Bitcoin's price action, institutional money flows, macroeconomic developments, and whether buying pressure can sustain the next move.

The key signals to watch:🔑

💰- Bitcoin price action: Is the market building higher lows or struggling to recover?
📊- Volume: Is buying momentum supported by real participation?
📜- Institutional flows: Are investors accumulating or reducing exposure?
✳️- Market psychology: Are traders buying with confidence or reacting emotionally?

The most important lesson is that sentiment can change before the trend becomes obvious, but not every bounce signals a bullish reversal.

Smart traders focus on confirmation, manage risk, and avoid making decisions based on fear or excitement.

The market rewards patience more than predictions.

The next opportunity may come from understanding the sentiment shift before the crowd fully reacts.

#MarketSentimentToday
🌍 CRYPTO MARKET: A moment of uncertainty The crypto market is showing mixed signals. 📉 Total market capitalization is down 1.96%, currently standing at $2.56 trillion. 📈 However, 24-hour trading volume has increased by 42.40%, reaching $63.80 billion. What does this tell us? ⚖️ Selling pressure may be increasing, but so is market participation. This could indicate growing uncertainty, repositioning, or opportunistic buying. 😨 The Fear & Greed Index recently recorded: * 45 — Neutral * 67 — Greed * 36 — Fear ₿ Bitcoin is trading around $76,660, down 2.09%. 🚀 Meanwhile, some altcoins are showing strength. Holo (HOT), for example, is up 18.28%. My perspective: The market is not giving a clear directional signal yet. Rather than chasing green candles or panicking over red ones, I believe this is a moment to watch volume, Bitcoin’s direction, and altcoin resilience. 🔍 What do you think? Are we looking at a healthy correction, or the beginning of a deeper market decline? #crypto #bitcoin #Binance #MarketSentimentToday #Altcoins
🌍 CRYPTO MARKET: A moment of uncertainty

The crypto market is showing mixed signals.

📉 Total market capitalization is down 1.96%, currently standing at $2.56 trillion.

📈 However, 24-hour trading volume has increased by 42.40%, reaching $63.80 billion.

What does this tell us?

⚖️ Selling pressure may be increasing, but so is market participation. This could indicate growing uncertainty, repositioning, or opportunistic buying.

😨 The Fear & Greed Index recently recorded:

* 45 — Neutral
* 67 — Greed
* 36 — Fear

₿ Bitcoin is trading around $76,660, down 2.09%.

🚀 Meanwhile, some altcoins are showing strength. Holo (HOT), for example, is up 18.28%.

My perspective: The market is not giving a clear directional signal yet. Rather than chasing green candles or panicking over red ones, I believe this is a moment to watch volume, Bitcoin’s direction, and altcoin resilience.

🔍 What do you think? Are we looking at a healthy correction, or the beginning of a deeper market decline?

#crypto #bitcoin #Binance #MarketSentimentToday #Altcoins
·
--
📊 [MARKET SENTIMENT DIGEST] — Fact Sheet ⚡ No hype, no opinions — just raw market metrics and key industry commentary. 💡 1️⃣ Crypto Fear & Greed Index Current Score: 41 / 100 (Fear) Status: Sitting firmly in Fear territory following recent price pullbacks and market-wide spot consolidation. 2️⃣ Derivatives & Funding Rates BTC Perpetual 8h Funding Rate: +0.0052% (OI-Weighted) Market Condition: Funding rates remain slightly positive but subdued, reflecting calm leverage conditions without aggressive long positioning. 3️⃣ Institutional ETF Net Daily Inflows US Spot BTC ETFs: -$27.6 Million (Net Outflow) Trend: Institutional flows flipped slightly negative in the most recent session, mirroring short-term spot caution. 4️⃣ 24-Hour Liquidation Heatmap Total Wiped Volume: ~$1.57 billion Ratio: 82% Longs ($92.1M) / 18% Shorts ($56.4M) Market Impact: Long positions took the brunt of recent intraday dips as leverage continues to be flushed out. 5️⃣ Social Sentiment & Leader Spotlight Leader Spotlight: Michael Saylor Key Commentary: "Bitcoin is digital property; capital preservation precedes speculation." Impact: Long-term treasury holders remain focused on macro accumulation while short-term retail leverage resets. 6️⃣ Bitcoin Dominance (BTC.D) Current Level: ~60.4% Capital Flow: BTC dominance stays at multi-year highs, locking up liquidity and keeping altcoin action muted. 7️⃣ Stablecoin Dominance (USDT.D + USDC.D) Current Level: ~10.8% (Total Market Cap ~$301B) Dry Powder Indicator: Stablecoin reserves remain high on the sidelines as traders hold cash waiting for a clear breakout confirmation. 💬 How are you interpreting these numbers today? Are you holding cash or deploying capital? Drop your thoughts below! 👇 #MarketSentimentToday $BTC #BinanceSquare #CryptoMetrics (Data source: Public market indicators. Provided for informational purposes only. Not financial advice.)

📊 [MARKET SENTIMENT DIGEST] — Fact Sheet ⚡
No hype, no opinions — just raw market metrics and key industry commentary. 💡
1️⃣ Crypto Fear & Greed Index
Current Score: 41 / 100 (Fear)
Status: Sitting firmly in Fear territory following recent price pullbacks and market-wide spot consolidation.
2️⃣ Derivatives & Funding Rates
BTC Perpetual 8h Funding Rate: +0.0052% (OI-Weighted)
Market Condition: Funding rates remain slightly positive but subdued, reflecting calm leverage conditions without aggressive long positioning.
3️⃣ Institutional ETF Net Daily Inflows
US Spot BTC ETFs: -$27.6 Million (Net Outflow)
Trend: Institutional flows flipped slightly negative in the most recent session, mirroring short-term spot caution.
4️⃣ 24-Hour Liquidation Heatmap
Total Wiped Volume: ~$1.57 billion
Ratio: 82% Longs ($92.1M) / 18% Shorts ($56.4M)
Market Impact: Long positions took the brunt of recent intraday dips as leverage continues to be flushed out.
5️⃣ Social Sentiment & Leader Spotlight
Leader Spotlight: Michael Saylor
Key Commentary: "Bitcoin is digital property; capital preservation precedes speculation."
Impact: Long-term treasury holders remain focused on macro accumulation while short-term retail leverage resets.
6️⃣ Bitcoin Dominance (BTC.D)
Current Level: ~60.4%
Capital Flow: BTC dominance stays at multi-year highs, locking up liquidity and keeping altcoin action muted.
7️⃣ Stablecoin Dominance (USDT.D + USDC.D)
Current Level: ~10.8% (Total Market Cap ~$301B)
Dry Powder Indicator: Stablecoin reserves remain high on the sidelines as traders hold cash waiting for a clear breakout confirmation.
💬 How are you interpreting these numbers today? Are you holding cash or deploying capital? Drop your thoughts below! 👇
#MarketSentimentToday $BTC #BinanceSquare #CryptoMetrics
(Data source: Public market indicators. Provided for informational purposes only. Not financial advice.)

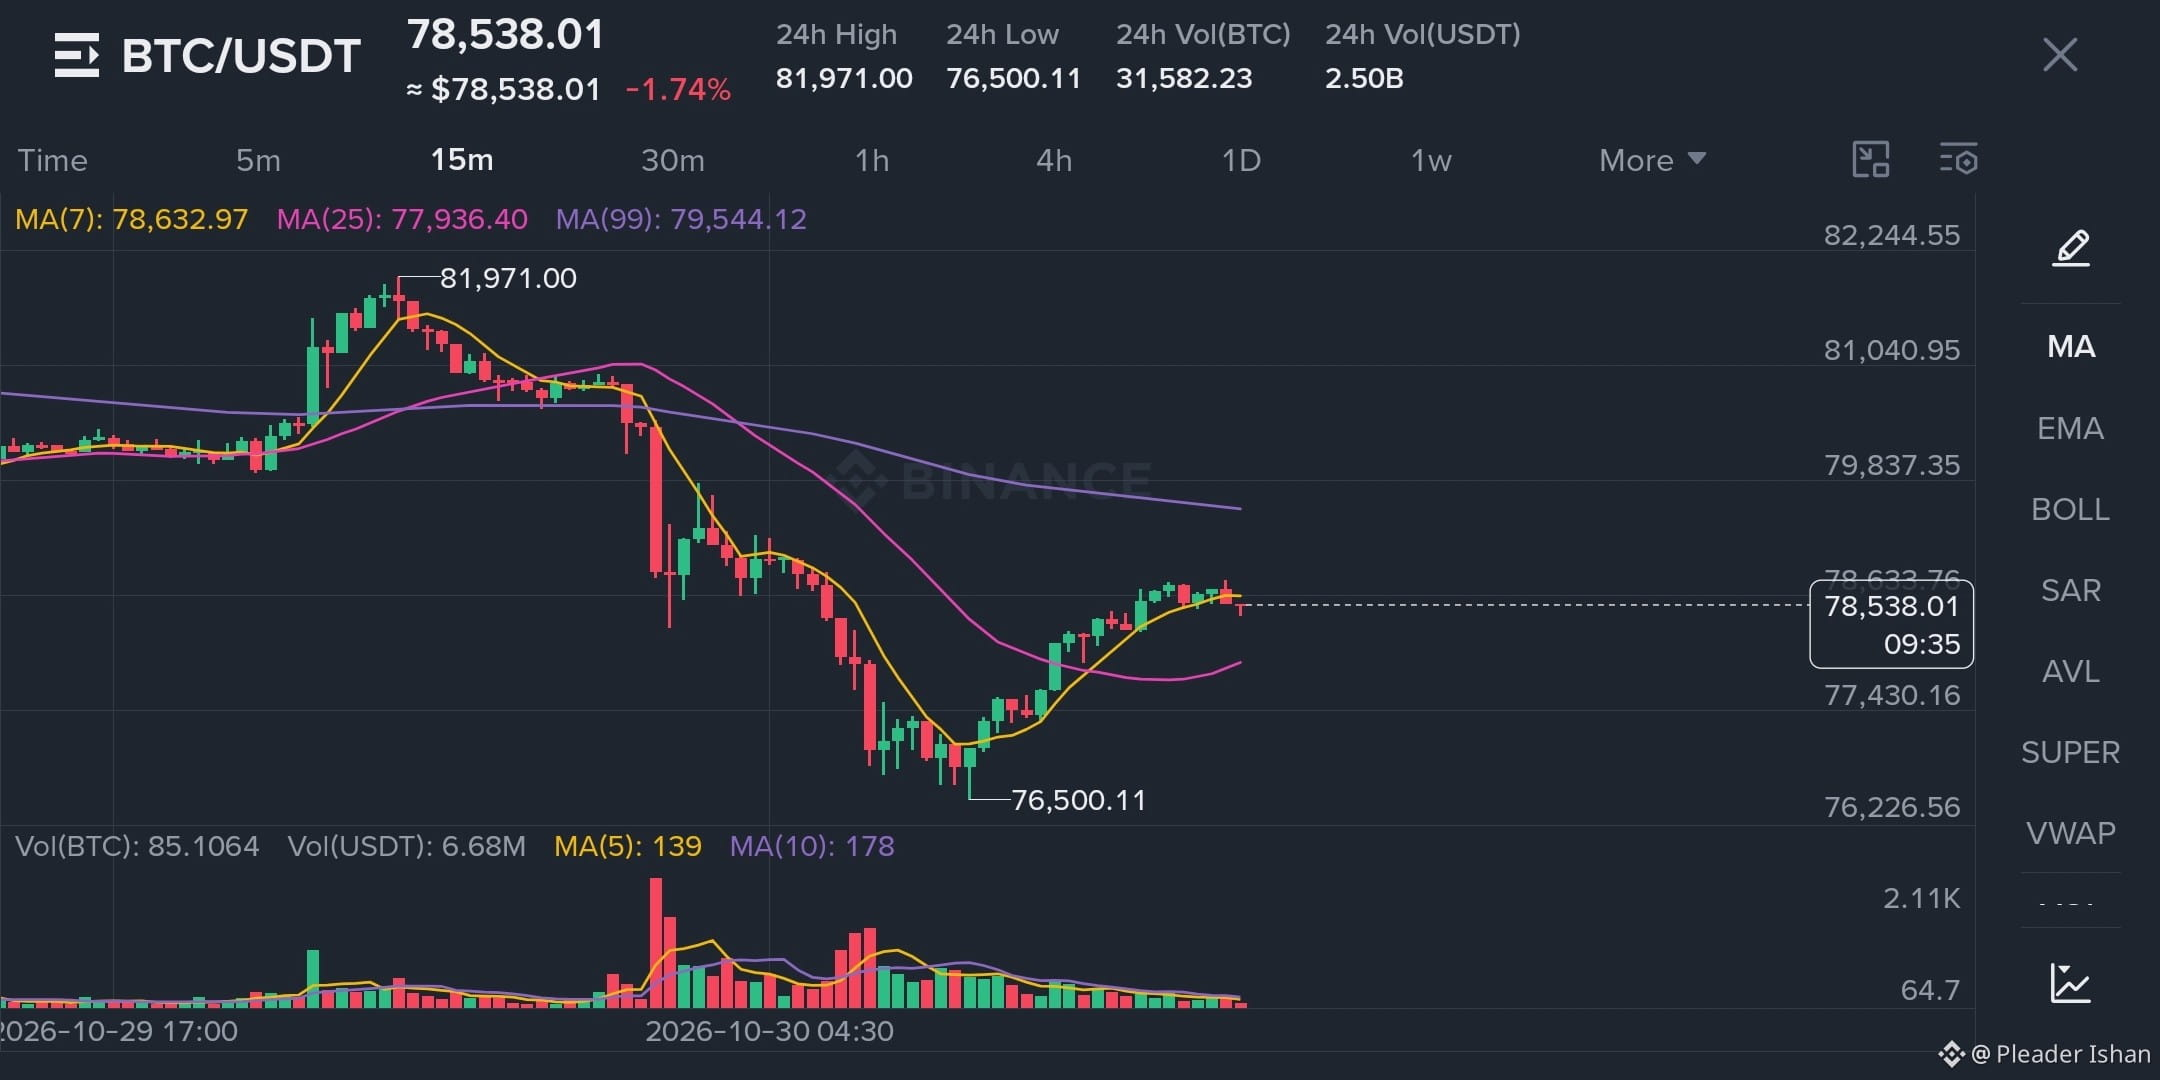
🔻 Crypto Sell-Off Check: Sentiment Slides to FEAR (38) The mood shifted fast. The Fear & Greed Index is at 38 (Fear). It was 47 a week ago and 67 a month ago. Majors on the daily chart | Coin | Price (USDT) | 1D | 30D | RSI(12) | | $BTC | 78,545.72 | -3.95% | -5.46% | 33.86 | | $ETH | 2,247.65 | -5.13% | -15.96% | 28.60 | | $BNB | 715.25 | -4.65% | -5.09% | 34.60 | | $SOL | 98.05 | -4.53% | -17.08% | 26.60 | What the indicators show RSI is low across the board. All four are in the 26–35 range, and ETH and SOL are the lowest. Low RSI means selling momentum is stretched. It doesn't say what happens next. Bollinger bands: BTC (lower band ~79,000) and ETH (~2,275) are trading below their lower bands. BNB and SOL sit just above theirs. Moving averages: BTC is still above its 99-day MA (~76,184). SOL (~97.86) is hovering right at its 99-day MA. ETH is below its 99-day MA (~2,339). MACD: the MACD DIF line is negative on all four coins, so momentum is bearish. BTC's range today: it traded between 76,500 and 78,804. Bigger picture: total market cap is down about 1.71% on the day. BTC and BNB are down far less than ETH and SOL over 30 days. Levels in the news: Glassnode flagged $77,900 and $75,800 as on-chain support, and $84,000–85,000 as a resistance zone. BTC has already traded near the lower of those levels today. Key question: does BTC hold its 99-day MA, or does ETH keep underperforming? 💬 How are you positioned: calm or cautious? Tell me below 👇 A reading of the data, not financial advice. Do your own research. Today, Oct 30, 2026. Prices come from the still-open daily candle (pulled around 14:46 SGT), and the changes are measured for Oct 30 in Singapore time. #MarketSentimentToday #TechnicalAnalysis
🔻 Crypto Sell-Off Check: Sentiment Slides to FEAR (38)

The mood shifted fast. The Fear & Greed Index is at 38 (Fear). It was 47 a week ago and 67 a month ago.

Majors on the daily chart

| Coin | Price (USDT) | 1D | 30D | RSI(12) |

| $BTC | 78,545.72 | -3.95% | -5.46% | 33.86 |
| $ETH | 2,247.65 | -5.13% | -15.96% | 28.60 |
| $BNB | 715.25 | -4.65% | -5.09% | 34.60 |
| $SOL | 98.05 | -4.53% | -17.08% | 26.60 |

What the indicators show
RSI is low across the board. All four are in the 26–35 range, and ETH and SOL are the lowest. Low RSI means selling momentum is stretched. It doesn't say what happens next.

Bollinger bands: BTC (lower band ~79,000) and ETH (~2,275) are trading below their lower bands. BNB and SOL sit just above theirs.
Moving averages: BTC is still above its 99-day MA (~76,184). SOL (~97.86) is hovering right at its 99-day MA. ETH is below its 99-day MA (~2,339).
MACD: the MACD DIF line is negative on all four coins, so momentum is bearish.
BTC's range today: it traded between 76,500 and 78,804.

Bigger picture: total market cap is down about 1.71% on the day. BTC and BNB are down far less than ETH and SOL over 30 days.

Levels in the news: Glassnode flagged $77,900 and $75,800 as on-chain support, and $84,000–85,000 as a resistance zone. BTC has already traded near the lower of those levels today.

Key question: does BTC hold its 99-day MA, or does ETH keep underperforming?

💬 How are you positioned: calm or cautious? Tell me below 👇

A reading of the data, not financial advice.
Do your own research.
Today, Oct 30, 2026.
Prices come from the still-open daily candle (pulled around 14:46 SGT), and the changes are measured for Oct 30 in Singapore time.
#MarketSentimentToday
#TechnicalAnalysis
·
--
📊 [MARKET SENTIMENT DIGEST] — Fact Sheet ⚡ No hype, no opinions — just raw market metrics and key industry commentary. 💡 1️⃣ Crypto Fear & Greed Index Current Score: 45 / 100 (Neutral) Status: Sitting firmly in neutral/cautious territory as the market holds position around the $80K–$83K BTC structural consolidation zone. 2️⃣ Derivatives & Funding Rates BTC Perpetual 8h Funding Rate: +0.0085% (OI-Weighted) Market Condition: Funding rates remain balanced with a minimal long bias, reflecting quiet position building rather than aggressive retail leverage. 3️⃣ Institutional ETF Net Daily Inflows US Spot BTC ETFs: +$102.7 Million (Net Inflow) Trend: Net positive capital flows persist across spot products, confirming sustained institutional bid during local range consolidation. 4️⃣ 24-Hour Liquidation Heatmap Total Wiped Volume: ~$142.8 Million Ratio: 61% Longs ($87.1M) / 39% Shorts ($55.7M) Market Impact: Subdued volatility flushed out tight overleveraged positions on intraday dips, leaving order books clean ahead of weekend liquidity shifts. 5️⃣ Social Sentiment & Leader Spotlight Leader Spotlight: Larry Fink Key Commentary: "Bitcoin is an asset class that provides an alternative store of value against systemic currency debasement." Impact: Institutional focus remains locked on macro capital preservation and long-term treasury allocation over short-term speculative rotations. 6️⃣ Bitcoin Dominance (BTC.D) Current Level: ~59.8% Capital Flow: BTC.D holds near multi-year highs, indicating capital concentration in Bitcoin remains steady while altcoins await a macro liquidity signal. 💬 How are you interpreting these numbers today? Are you holding cash or deploying capital? Drop your thoughts below! 👇 #MarketSentimentToday #CryptoData #BinanceSquare #CryptoMetrics $BTC (Data source: Public market indicators. Provided for informational purposes only. Not financial advice.
📊 [MARKET SENTIMENT DIGEST] — Fact Sheet ⚡
No hype, no opinions — just raw market metrics and key industry commentary. 💡
1️⃣ Crypto Fear & Greed Index
Current Score: 45 / 100 (Neutral)
Status: Sitting firmly in neutral/cautious territory as the market holds position around the $80K–$83K BTC structural consolidation zone.
2️⃣ Derivatives & Funding Rates
BTC Perpetual 8h Funding Rate: +0.0085% (OI-Weighted)
Market Condition: Funding rates remain balanced with a minimal long bias, reflecting quiet position building rather than aggressive retail leverage.
3️⃣ Institutional ETF Net Daily Inflows
US Spot BTC ETFs: +$102.7 Million (Net Inflow)
Trend: Net positive capital flows persist across spot products, confirming sustained institutional bid during local range consolidation.
4️⃣ 24-Hour Liquidation Heatmap
Total Wiped Volume: ~$142.8 Million
Ratio: 61% Longs ($87.1M) / 39% Shorts ($55.7M)
Market Impact: Subdued volatility flushed out tight overleveraged positions on intraday dips, leaving order books clean ahead of weekend liquidity shifts.
5️⃣ Social Sentiment & Leader Spotlight
Leader Spotlight: Larry Fink
Key Commentary: "Bitcoin is an asset class that provides an alternative store of value against systemic currency debasement."
Impact: Institutional focus remains locked on macro capital preservation and long-term treasury allocation over short-term speculative rotations.
6️⃣ Bitcoin Dominance (BTC.D)
Current Level: ~59.8%
Capital Flow: BTC.D holds near multi-year highs, indicating capital concentration in Bitcoin remains steady while altcoins await a macro liquidity signal.
💬 How are you interpreting these numbers today? Are you holding cash or deploying capital? Drop your thoughts below! 👇
#MarketSentimentToday #CryptoData #BinanceSquare #CryptoMetrics $BTC
(Data source: Public market indicators. Provided for informational purposes only. Not financial advice.
Crypto Market Sentiment Update — October 27, 2026 Market sentiment is neutral with a cautious bearish tilt. The Fear & Greed Index sits at 44/100, showing that optimism has cooled from recent levels without turning into outright panic. the total market cap is testing its recent swing low at $2.68T with an RSI (14) of 33.13, nearing oversold territory What this means: This is neutral-to-bearish for the short term. High volume with low open interest points to churn and a lack of sustained directional bets. The weak RSI and price testing lows confirm selling pressure, though oversold conditions could set up for a bounce. #MarketSentimentToday #FOMCWatch
Crypto Market Sentiment Update — October 27, 2026
Market sentiment is neutral with a cautious bearish tilt. The Fear & Greed Index sits at 44/100, showing that optimism has cooled from recent levels without turning into outright panic.

the total market cap is testing its recent swing low at $2.68T with an RSI (14) of 33.13, nearing oversold territory

What this means: This is neutral-to-bearish for the short term. High volume with low open interest points to churn and a lack of sustained directional bets. The weak RSI and price testing lows confirm selling pressure, though oversold conditions could set up for a bounce.
#MarketSentimentToday #FOMCWatch
Market SummaryCurrent market sentiment is Neutral (Fear & Greed Index: 42/100). Key highlights: ​Fear & Greed Index – Score of 42, down 7 points in a week, signaling a cautious shift from neutral toward fear. ​Social Sentiment Net score of 5.62/10 shows mildly bullish chatter mixed with bearish warnings. ​Market & Technicals Total cap down 1.24% in 24h with low derivatives leverage, suggesting a potential stabilization phase. 1. CMC Fear & Greed Index: Neutral with a Bearish Drift The index reads 42 ("Neutral") as of 26 October 2026, down 1 point from yesterday and 7 points from last week's 49. This steady week-long decline out of neutral territory reflects growing caution. This is bearish because the trend shows sentiment deteriorating, which can precede further selling if negative catalysts emerge. 2. Social Media Buzz Mildly Bullish but Divided The aggregate net sentiment score is 5.62/10, indicating a slightly positive bias. However, top posts reveal a split: bullish calls target XRP and memecoin explosions, while bearish voices warn of a "Black Monday" and predict Bitcoin falling to the "$60k" range.
"$XRP will be an investment which will change your life…"
— @_Crypto_Barbie (119K followers) "Fade the bounce I added more shorts here btw to new lows."
— @astronomer_zero (65.7K followers) What this means: This is neutral because the conflicting narratives show a lack of consensus, typical during consolidation. 3. Market Health Weak Price Action, Stabilizing Leverage The total crypto market cap is $2.67T, down 1.24% in 24h. Technically, the 7-day RSI of 33.52 suggests the market is nearing oversold territory. Concurrently, total derivatives open interest is near its yearly low at $332.45B, and 24h BTC liquidations plummeted 93.96% to $10.64M. This is neutral-to-bullish because while price action is weak, the washout in leveraged positions reduces systemic risk and creates conditions for a bounce. Conclusion Market sentiment is currently neutral with a bearish tilt, caught between mildly hopeful social chatter and clear technical weakness. The significant drop in leverage and liquidations suggests the market may be digesting recent losses, setting up for a directional move. Monitor the CMC Fear & Greed Index over the next 48 hours for a break below 40 (into "Fear") or a recovery above 45, which would signal the next short-term bias. #MarketSentimentToday #Market_Update #Crypto {spot}(XRPUSDT) {spot}(XLMUSDT) {spot}(ONDOUSDT)

Market Summary

Current market sentiment is Neutral (Fear & Greed Index: 42/100). Key highlights:
​Fear & Greed Index – Score of 42, down 7 points in a week, signaling a cautious shift from neutral toward fear.
​Social Sentiment
Net score of 5.62/10 shows mildly bullish chatter mixed with bearish warnings.
​Market & Technicals
Total cap down 1.24% in 24h with low derivatives leverage, suggesting a potential stabilization phase.
1. CMC Fear & Greed Index:
Neutral with a Bearish Drift
The index reads 42 ("Neutral") as of 26 October 2026, down 1 point from yesterday and 7 points from last week's 49. This steady week-long decline out of neutral territory reflects growing caution.
This is bearish because the trend shows sentiment deteriorating, which can precede further selling if negative catalysts emerge.
2. Social Media Buzz
Mildly Bullish but Divided
The aggregate net sentiment score is 5.62/10, indicating a slightly positive bias. However, top posts reveal a split: bullish calls target XRP and memecoin explosions, while bearish voices warn of a "Black Monday" and predict Bitcoin falling to the "$60k" range.
"$XRP will be an investment which will change your life…"
— @_Crypto_Barbie (119K followers)
"Fade the bounce
I added more shorts here btw to new lows."
— @astronomer_zero (65.7K followers)
What this means: This is neutral because the conflicting narratives show a lack of consensus, typical during consolidation.
3. Market Health
Weak Price Action, Stabilizing Leverage
The total crypto market cap is $2.67T, down 1.24% in 24h. Technically, the 7-day RSI of 33.52 suggests the market is nearing oversold territory. Concurrently, total derivatives open interest is near its yearly low at $332.45B, and 24h BTC liquidations plummeted 93.96% to $10.64M.
This is neutral-to-bullish because while price action is weak, the washout in leveraged positions reduces systemic risk and creates conditions for a bounce.
Conclusion
Market sentiment is currently neutral with a bearish tilt, caught between mildly hopeful social chatter and clear technical weakness. The significant drop in leverage and liquidations suggests the market may be digesting recent losses, setting up for a directional move. Monitor the CMC Fear & Greed Index over the next 48 hours for a break below 40 (into "Fear") or a recovery above 45, which would signal the next short-term bias.
#MarketSentimentToday #Market_Update #Crypto
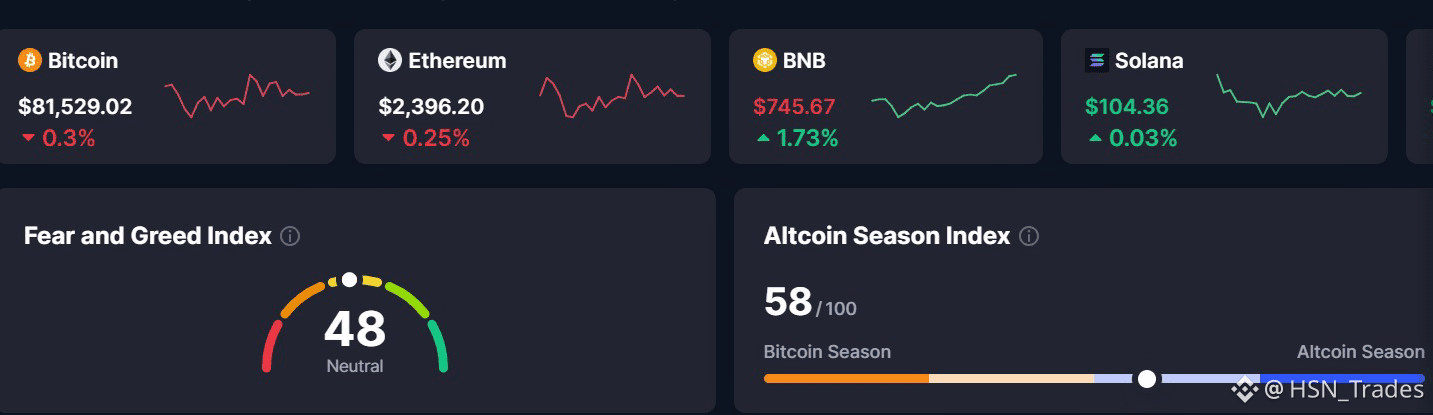
MARKET OVERVIEW 🚨 Crypto sentiments is NEUTRAL ‼️ While tha Altcoins season is modestly titled towards altcoins but not at an extreme. The combined signal is a cautious rotation setup, altcoins have improved relative to last month, but $BTC still controls roughly 60% of the market and broader market capitalization is declining. #MarketSentimentToday
MARKET OVERVIEW 🚨

Crypto sentiments is NEUTRAL ‼️
While tha Altcoins season is modestly titled towards altcoins but not at an extreme.
The combined signal is a cautious rotation setup, altcoins have improved relative to last month, but $BTC still controls roughly 60% of the market and broader market capitalization is declining.
#MarketSentimentToday
·
--
Рост
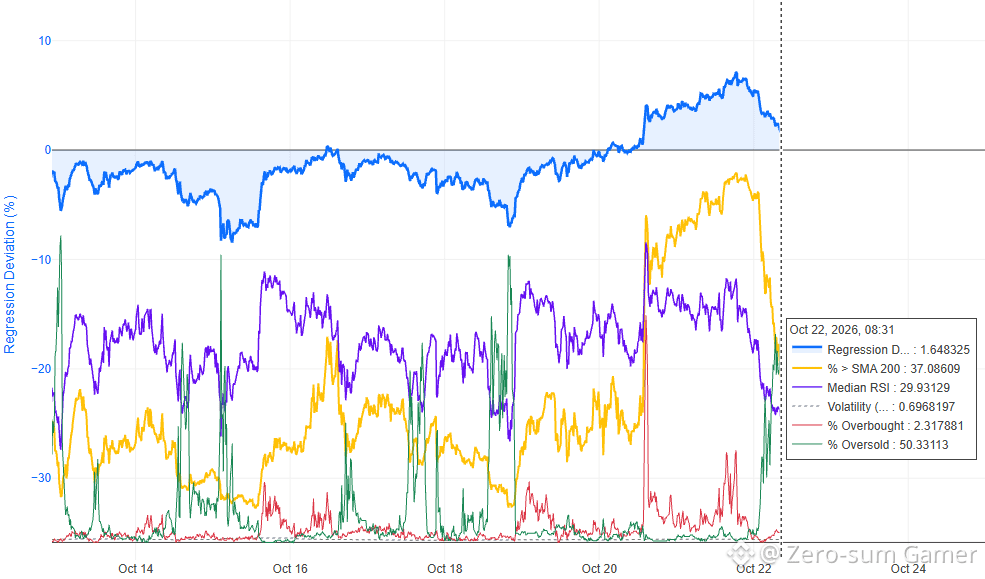
📊 Market Median / October 22, 2026 📌 30m slice: RegDev +1.65%, above SMA200 37.09%, Median RSI 29.93. Yesterday’s risk-on move reversed fast as Middle East tensions flared again, oil jumped, and markets moved back into risk-off. Breadth collapsed from 81.38% to 37.09%, while RSI fell from 58.25 to 29.93. Oversold has already reached 50.33%. 📉 Chasing shorts here is late. Half the market is already oversold, so local bounce risk is high. Trade plan: RegDev around 0 is market balance, not a guaranteed bottom. For us, it is closer to a short take-profit zone. Longs from zero are early; proper scaling starts deeper when the Median moves into lower zones. ⚠️ Common mistake: treating zero on Market Median as an automatic reversal level and flipping straight into longs. 🔗 #MarketMedian is free for anyone to use #MarketSentimentToday #analysis $MAGMA $IRYS $M
📊 Market Median / October 22, 2026

📌 30m slice: RegDev +1.65%, above SMA200 37.09%, Median RSI 29.93.

Yesterday’s risk-on move reversed fast as Middle East tensions flared again, oil jumped, and markets moved back into risk-off. Breadth collapsed from 81.38% to 37.09%, while RSI fell from 58.25 to 29.93. Oversold has already reached 50.33%.

📉 Chasing shorts here is late. Half the market is already oversold, so local bounce risk is high.

Trade plan: RegDev around 0 is market balance, not a guaranteed bottom. For us, it is closer to a short take-profit zone. Longs from zero are early; proper scaling starts deeper when the Median moves into lower zones.

⚠️ Common mistake: treating zero on Market Median as an automatic reversal level and flipping straight into longs.

🔗 #MarketMedian is free for anyone to use
#MarketSentimentToday #analysis $MAGMA $IRYS $M
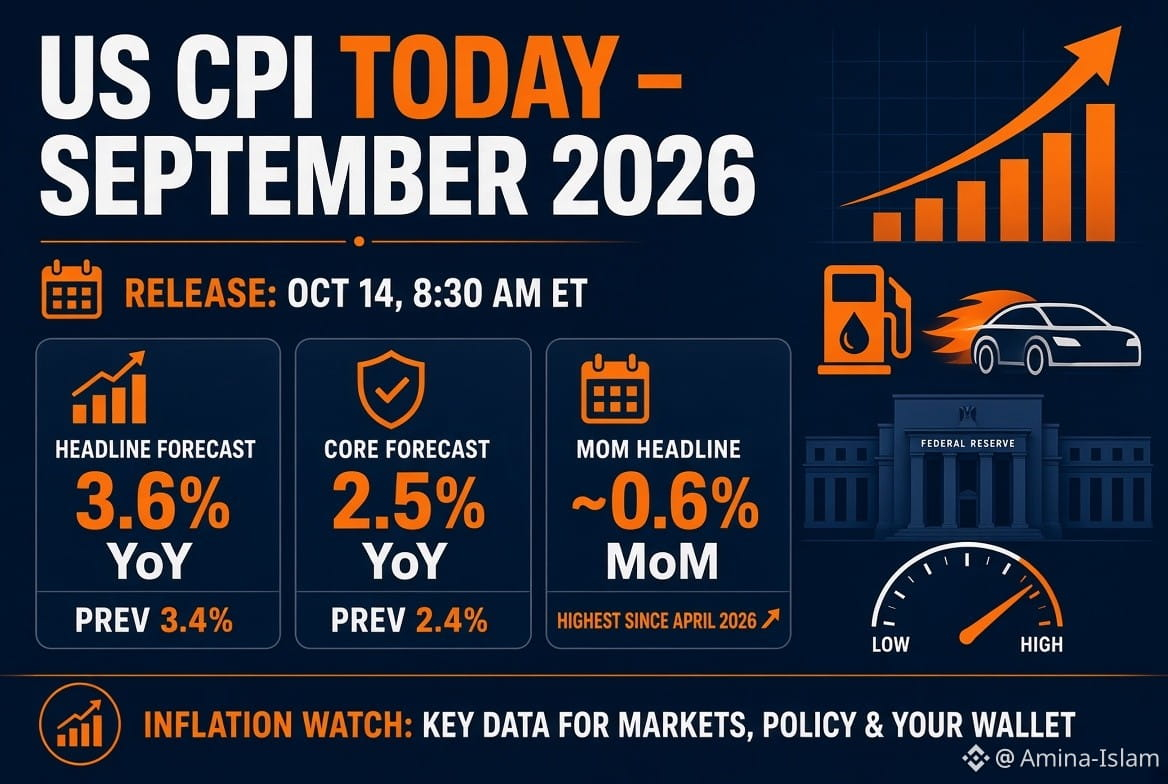
If the CPI lands near my earlier guess (headline ~3.6% y/y, possibly 3.7%; monthly ~+0.5–0.6%; core ~2.5% y/y and +0.2% m/m), here’s the most likely market reaction framework. Base case — In-line or only mildly hot headline, core contained This is the highest-probability outcome given current forecasts. Bonds / yields: Limited move or modest rise in short-term yields. Markets already price a low chance of an October Fed hike (~20–25% in recent pricing), so an in-line print mostly confirms “higher for longer” without forcing a big re-pricing. USD: Mild firmness or little change. A pure energy-driven headline is often discounted. Equities: Neutral to slightly positive after the initial volatility. Growth/tech can hold up if core doesn’t surprise higher. Bank earnings already in the mix may matter more for the session. Gold: Soft or range-bound (higher real yields are a headwind, but no shock). Crypto: Mild pressure or chop; Bitcoin often sells the headline and then stabilizes if core is tame. #cpi $XAU $BTC #MarketSentimentToday
If the CPI lands near my earlier guess (headline ~3.6% y/y, possibly 3.7%; monthly ~+0.5–0.6%; core ~2.5% y/y and +0.2% m/m), here’s the most likely market reaction framework.

Base case — In-line or only mildly hot headline, core contained
This is the highest-probability outcome given current forecasts.

Bonds / yields: Limited move or modest rise in short-term yields. Markets already price a low chance of an October Fed hike (~20–25% in recent pricing), so an in-line print mostly confirms “higher for longer” without forcing a big re-pricing.

USD: Mild firmness or little change. A pure energy-driven headline is often discounted.

Equities: Neutral to slightly positive after the initial volatility. Growth/tech can hold up if core doesn’t surprise higher. Bank earnings already in the mix may matter more for the session.

Gold: Soft or range-bound (higher real yields are a headwind, but no shock).

Crypto: Mild pressure or chop; Bitcoin often sells the headline and then stabilizes if core is tame.

#cpi $XAU $BTC #MarketSentimentToday
·
--
Рост
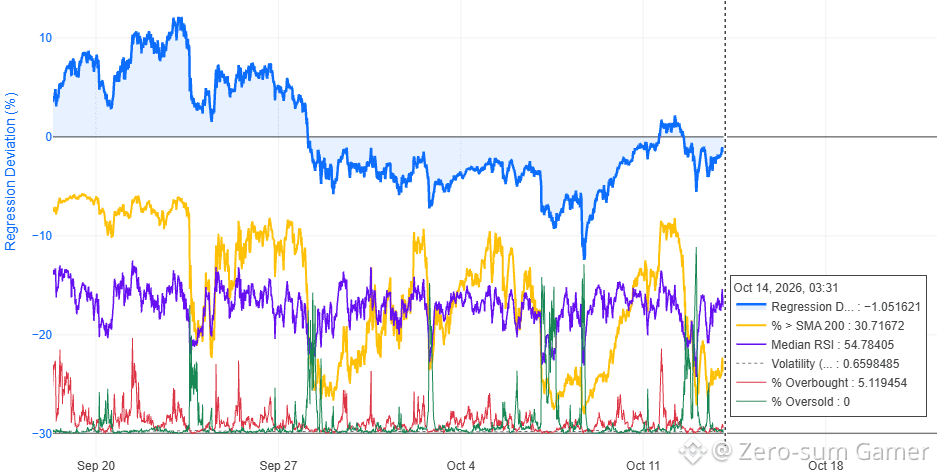
📊 Market Median / October 14, 2026 📌 30m slice: RegDev −1.05%, above SMA200 30.72%, Median RSI 54.78. The bounce continues: RSI rose from 53.17 to 54.78, while RegDev improved slightly from −1.30% to −1.05%. Breadth, however, slipped from 33.70% to 30.72%. 📊 RSI looks stronger than the broader market. Only 31% of coins are above SMA200 and RegDev remains negative. Overbought is 5.12%, oversold 0%. No broad long setup yet. Trade plan: longs need breadth back above 50% and RegDev continuing higher. Shorts get cleaner if RSI loses 50 while breadth stays weak. ⚠️ Common mistake: treating RSI near 55 as a full-market recovery while almost 70% of coins remain below SMA200. #MarketMedian #MarketSentimentToday #analysis $BTW $Q $PONS
📊 Market Median / October 14, 2026

📌 30m slice: RegDev −1.05%, above SMA200 30.72%, Median RSI 54.78.

The bounce continues: RSI rose from 53.17 to 54.78, while RegDev improved slightly from −1.30% to −1.05%. Breadth, however, slipped from 33.70% to 30.72%.

📊 RSI looks stronger than the broader market. Only 31% of coins are above SMA200 and RegDev remains negative. Overbought is 5.12%, oversold 0%. No broad long setup yet.

Trade plan: longs need breadth back above 50% and RegDev continuing higher. Shorts get cleaner if RSI loses 50 while breadth stays weak.

⚠️ Common mistake: treating RSI near 55 as a full-market recovery while almost 70% of coins remain below SMA200.

#MarketMedian #MarketSentimentToday #analysis $BTW $Q $PONS
Статья
Market Sentiments1. Fear & Greed Index: Sustained Greed Overview: The Fear & Greed Index reads 73 ("Greed") as of September 25, unchanged over 24 hours and 7 days. This marks a week of stable, elevated sentiment, though it has cooled from "Extreme Greed" (80) a month ago. What this means: This is bullish because it reflects consistent investor confidence, but the pause at 73, rather than pushing higher, suggests the market is digesting gains without flipping to fear. 2. Social Media: Bullish Hype vs. Bearish Warnings Overview: The net social sentiment score is 5.35/10, indicating a mildly bullish bias. However, the conversation is sharply divided. "Now that Crypto is about to have its moment and go on the biggest pump we've ever seen..." — @GodsBurnt (132.8K followers) "I just opened a $300k SHORT position in $SOL. The market is about to fall." — @Crypto__Haris (83.5K followers) What this means: This is neutral because extreme optimism is being countered by tangible warnings of over-leverage and potential liquidations, creating a balanced but tense atmosphere.   3. Institutional Flows: ETF Demand Persists Overview: U.S. spot Bitcoin ETFs recorded a net inflow of $190.65M on September 24, led by BlackRock. This extends a multi-day inflow streak, with total ETF AUM for BTC rising to $111.25B from $107.83B yesterday. What this means: This is bullish because it demonstrates resilient institutional buying pressure, providing a fundamental floor for prices even amid macroeconomic uncertainty. Conclusion Market sentiment is currently bullish, underpinned by steady greed and strong institutional inflows. However, this optimism is tempered by clear warnings on social media about over-leverage and a significant hack at another exchange. For the next 24–48 hours, monitor Bitcoin's price action around the $87,000 resistance level; a clean breakout could validate the bullish sentiment, while a rejection may amplify the bearish warnings. #MarketSentimentToday #market #bullish #bullishmarket

Market Sentiments

1. Fear & Greed Index: Sustained Greed
Overview: The Fear & Greed Index reads 73 ("Greed") as of September 25, unchanged over 24 hours and 7 days. This marks a week of stable, elevated sentiment, though it has cooled from "Extreme Greed" (80) a month ago.
What this means: This is bullish because it reflects consistent investor confidence, but the pause at 73, rather than pushing higher, suggests the market is digesting gains without flipping to fear.
2. Social Media: Bullish Hype vs. Bearish Warnings
Overview: The net social sentiment score is 5.35/10, indicating a mildly bullish bias. However, the conversation is sharply divided. "Now that Crypto is about to have its moment and go on the biggest pump we've ever seen..." — @GodsBurnt (132.8K followers) "I just opened a $300k SHORT position in $SOL. The market is about to fall." — @Crypto__Haris (83.5K followers)
What this means: This is neutral because extreme optimism is being countered by tangible warnings of over-leverage and potential liquidations, creating a balanced but tense atmosphere.

3. Institutional Flows: ETF Demand Persists
Overview: U.S. spot Bitcoin ETFs recorded a net inflow of $190.65M on September 24, led by BlackRock. This extends a multi-day inflow streak, with total ETF AUM for BTC rising to $111.25B from $107.83B yesterday.
What this means: This is bullish because it demonstrates resilient institutional buying pressure, providing a fundamental floor for prices even amid macroeconomic uncertainty.
Conclusion
Market sentiment is currently bullish, underpinned by steady greed and strong institutional inflows. However, this optimism is tempered by clear warnings on social media about over-leverage and a significant hack at another exchange. For the next 24–48 hours, monitor Bitcoin's price action around the $87,000 resistance level; a clean breakout could validate the bullish sentiment, while a rejection may amplify the bearish warnings.
#MarketSentimentToday #market #bullish #bullishmarket
·
--
Рост
HOW MARKET IS FEELING RIGHT NOW Bitcoin (BTC): ~$62,840 ↘️ -0.4% — resting around $63K support ​ Ethereum (ETH): ~$1,875 ↘️ -0.4% — calm and steady ​ $BNB : ~$601.60 ↘️ -1.0% — slight pullback ​ $XRP : ~$0.99 ↘️ -1.1% — holding round number ​ Solana (SOL): ~$75.20 ↗️ +0.3% — tiny green ​ Weekly trend: $BTC down ~3% — quiet consolidation   THE HONEST MESSAGE — BEHIND THE NUMBERS Look at the chart. What do you actually see? Not pumps. Not panic. Just… patience being tested. Bitcoin has hovered near $63,000 for days now. Up a little, down a little. Tired news, tired charts, everyone waiting. And this — this quiet, unexciting pause — is exactly where most people lose heart. Because it’s human nature: we want movement NOW. We want green candles NOW. We want results NOW. But markets don’t work on our schedule. They pause to catch their breath. They consolidate to build strength. Right now — the market is simply resting before the next move.  WHAT I WANT YOU TO REMEMBER TODAY Prices are steady = your portfolio is SAFE, not stagnant Quiet days = perfect time to LEARN, not panic Everyone is waiting = smart hands are building positions quietly Don’t sell your patience just because nothing is happening today "The strongest trees don't grow fastest. They grow slow, deep roots, while the world waits." The market doesn't owe you a move today. It moves when it’s ready. Your job is to stay calm, stay informed, and stay patient. Stay strong. Stay patient. Better days are coming #Market_Update #Marketstructure #pakistancryptonews #MarketSentimentToday @Square-Creator-0e31a5469396e
HOW MARKET IS FEELING RIGHT NOW

Bitcoin (BTC): ~$62,840 ↘️ -0.4% — resting around $63K support
​
Ethereum (ETH): ~$1,875 ↘️ -0.4% — calm and steady
​
$BNB : ~$601.60 ↘️ -1.0% — slight pullback
​
$XRP : ~$0.99 ↘️ -1.1% — holding round number
​
Solana (SOL): ~$75.20 ↗️ +0.3% — tiny green
​
Weekly trend: $BTC down ~3% — quiet consolidation


THE HONEST MESSAGE — BEHIND THE NUMBERS

Look at the chart. What do you actually see?

Not pumps. Not panic. Just… patience being tested.

Bitcoin has hovered near $63,000 for days now. Up a little, down a little. Tired news, tired charts, everyone waiting. And this — this quiet, unexciting pause — is exactly where most people lose heart.

Because it’s human nature: we want movement NOW. We want green candles NOW. We want results NOW.

But markets don’t work on our schedule. They pause to catch their breath. They consolidate to build strength. Right now — the market is simply resting before the next move.

WHAT I WANT YOU TO REMEMBER TODAY

Prices are steady = your portfolio is SAFE, not stagnant
Quiet days = perfect time to LEARN, not panic
Everyone is waiting = smart hands are building positions quietly
Don’t sell your patience just because nothing is happening today

"The strongest trees don't grow fastest. They grow slow, deep roots, while the world waits."

The market doesn't owe you a move today.
It moves when it’s ready. Your job is to stay calm, stay informed, and stay patient.
Stay strong. Stay patient. Better days are coming
#Market_Update #Marketstructure
#pakistancryptonews #MarketSentimentToday
@AyshaAli
Bitcoin Up or Down on August 17?

Bitcoin Up or Down on August 17?

99%Up1%Down
Объем $106,144.98
Войдите, чтобы посмотреть больше материала
Присоединяйтесь к пользователям криптовалют по всему миру на Binance Square
⚡️ Получайте новейшую и полезную информацию о криптоактивах.
💬 Нам доверяет крупнейшая в мире криптобиржа.
👍 Получите достоверные аналитические данные от верифицированных создателей контента.
Эл. почта/номер телефона