
#longtermgain
longtermgain
Просмотров: 207,719
462 обсуждают
Популярные
Новые

·
--
Статья
Why I’m not worried about Alphabet’s drop (and what I’m watching instead)Alphabet ($GOOGLB ) is down hard, and my timeline is full of people calling it broken. I don’t see it that way. If you plan to hold for years, this looks more like an opening than a warning.
Start with the monthly chart. Alphabet ran from about $141 to a high near $407, one of the strongest moves in Big Tech. A pullback after a run like that is normal. Price has now come back to roughly $279, almost exactly the 50% retracement of the whole move at $274. That’s the line between “premium” and “discount” territory, and it’s the area where long-term buyers have historically started paying attention.
If selling continues, the next level to watch is the 61.8% retracement near $243. There’s also a bullish fair value gap sitting in that zone, an area where price moved up so fast it left little trading behind. Price often returns to fill gaps like that before continuing higher. I’m not saying it will go there. I’m saying that’s where I’d expect buyers to show up if it does.
Some traders think big institutions push price down on purpose to build positions at better prices before the next leg up. I can’t prove that, and nobody outside those desks can. What I can say is that sharp drops on bad headlines are when large buyers tend to get the best entries, and when retail tends to sell.
The headlines aren’t pretty. Earnings missed on profit, Search growth slowed, and free cash flow went negative because of heavy AI spending. But Cloud revenue more than doubled, and the spending is building capacity the company expects to use for years. A business that still grew revenue 25% is not a broken business.
I’d rather buy something good while people are scared than chase it after the recovery. If you’re investing for five or ten years, the daily noise matters a lot less than the price you pay. Scaling in across the 50% to 61.8% zone beats betting everything at one level.
None of this is a guarantee. Fibonacci levels are guides, not floors, and price can slice through them. The AI spending bet could take longer to pay off than investors will tolerate. Size your position so a further drop doesn’t force you to sell.
Found this helpful? 👍 Like it, 🔁 share it, and ➕ follow so you don’t miss the next one.
$GOOGLB #LongTermGain #Googlestock #TrendingTopic
Why I’m not worried about Alphabet’s drop (and what I’m watching instead)
Alphabet ($GOOGLB ) is down hard, and my timeline is full of people calling it broken. I don’t see it that way. If you plan to hold for years, this looks more like an opening than a warning.
Start with the monthly chart. Alphabet ran from about $141 to a high near $407, one of the strongest moves in Big Tech. A pullback after a run like that is normal. Price has now come back to roughly $279, almost exactly the 50% retracement of the whole move at $274. That’s the line between “premium” and “discount” territory, and it’s the area where long-term buyers have historically started paying attention.
If selling continues, the next level to watch is the 61.8% retracement near $243. There’s also a bullish fair value gap sitting in that zone, an area where price moved up so fast it left little trading behind. Price often returns to fill gaps like that before continuing higher. I’m not saying it will go there. I’m saying that’s where I’d expect buyers to show up if it does.
Some traders think big institutions push price down on purpose to build positions at better prices before the next leg up. I can’t prove that, and nobody outside those desks can. What I can say is that sharp drops on bad headlines are when large buyers tend to get the best entries, and when retail tends to sell.
The headlines aren’t pretty. Earnings missed on profit, Search growth slowed, and free cash flow went negative because of heavy AI spending. But Cloud revenue more than doubled, and the spending is building capacity the company expects to use for years. A business that still grew revenue 25% is not a broken business.
I’d rather buy something good while people are scared than chase it after the recovery. If you’re investing for five or ten years, the daily noise matters a lot less than the price you pay. Scaling in across the 50% to 61.8% zone beats betting everything at one level.
None of this is a guarantee. Fibonacci levels are guides, not floors, and price can slice through them. The AI spending bet could take longer to pay off than investors will tolerate. Size your position so a further drop doesn’t force you to sell.
Found this helpful? 👍 Like it, 🔁 share it, and ➕ follow so you don’t miss the next one.
$GOOGLB #LongTermGain #Googlestock #TrendingTopic
Start with the monthly chart. Alphabet ran from about $141 to a high near $407, one of the strongest moves in Big Tech. A pullback after a run like that is normal. Price has now come back to roughly $279, almost exactly the 50% retracement of the whole move at $274. That’s the line between “premium” and “discount” territory, and it’s the area where long-term buyers have historically started paying attention.
If selling continues, the next level to watch is the 61.8% retracement near $243. There’s also a bullish fair value gap sitting in that zone, an area where price moved up so fast it left little trading behind. Price often returns to fill gaps like that before continuing higher. I’m not saying it will go there. I’m saying that’s where I’d expect buyers to show up if it does.
Some traders think big institutions push price down on purpose to build positions at better prices before the next leg up. I can’t prove that, and nobody outside those desks can. What I can say is that sharp drops on bad headlines are when large buyers tend to get the best entries, and when retail tends to sell.
The headlines aren’t pretty. Earnings missed on profit, Search growth slowed, and free cash flow went negative because of heavy AI spending. But Cloud revenue more than doubled, and the spending is building capacity the company expects to use for years. A business that still grew revenue 25% is not a broken business.
I’d rather buy something good while people are scared than chase it after the recovery. If you’re investing for five or ten years, the daily noise matters a lot less than the price you pay. Scaling in across the 50% to 61.8% zone beats betting everything at one level.
None of this is a guarantee. Fibonacci levels are guides, not floors, and price can slice through them. The AI spending bet could take longer to pay off than investors will tolerate. Size your position so a further drop doesn’t force you to sell.
Found this helpful? 👍 Like it, 🔁 share it, and ➕ follow so you don’t miss the next one.
$GOOGLB #LongTermGain #Googlestock #TrendingTopic
1
420

·
--
Рост
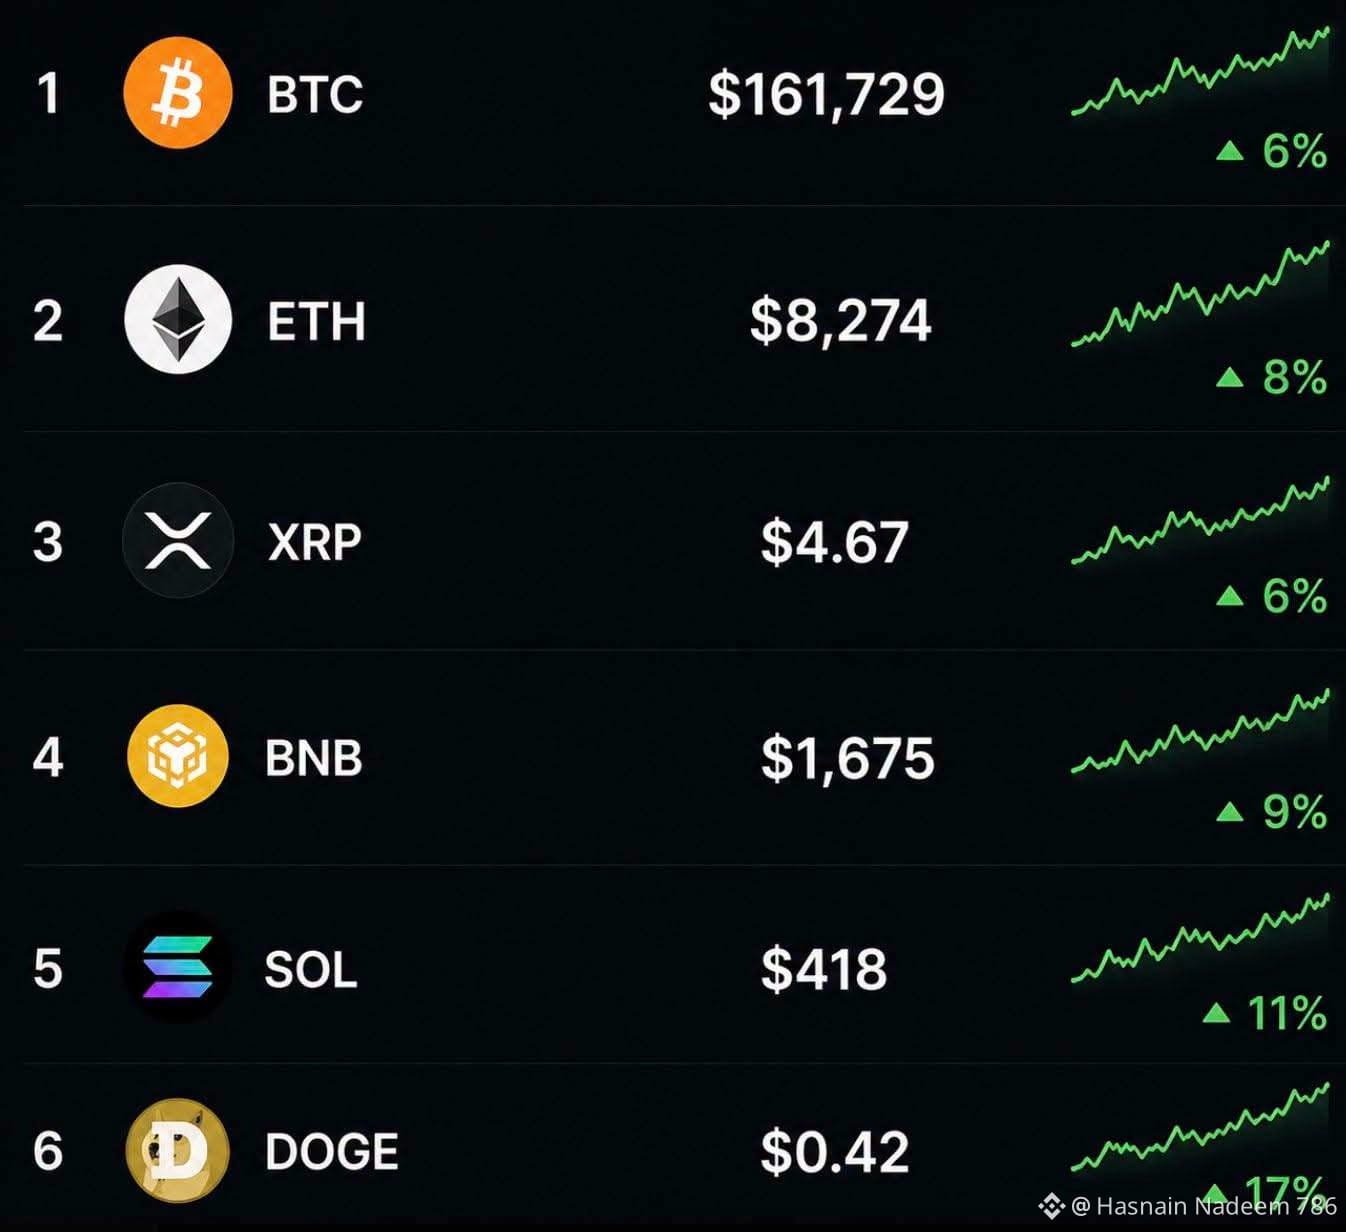
Screenshot from the second quarter of 2027.
what do you think it's happen in 2027 share your thoughts in comments💬
Long-term Holders Buy just this 6 coins save and strong Coins.
1) Buy Here 👉$BTC /USDT
2) Buy Here 👉$ETH /USDT
3) Buy Here 👉$XRP /USDT
4) Buy Here 👉$BNB/USDT
5) Buy Here 👉$SOL/USDT
6) Buy Here 👉$DOGE/USDT
Follow me for daily profitable signals.
#LongTermGain #BTC #ETH #bnb #HASNAINNADEEM786
{future}(XRPUSDT)
{future}(ETHUSDT)
Screenshot from the second quarter of 2027.
what do you think it's happen in 2027 share your thoughts in comments💬
Long-term Holders Buy just this 6 coins save and strong Coins.
1) Buy Here 👉$BTC /USDT
2) Buy Here 👉$ETH /USDT
3) Buy Here 👉$XRP /USDT
4) Buy Here 👉$BNB/USDT
5) Buy Here 👉$SOL/USDT
6) Buy Here 👉$DOGE/USDT
Follow me for daily profitable signals.
#LongTermGain #BTC #ETH #bnb #HASNAINNADEEM786
what do you think it's happen in 2027 share your thoughts in comments💬
Long-term Holders Buy just this 6 coins save and strong Coins.
1) Buy Here 👉$BTC /USDT
2) Buy Here 👉$ETH /USDT
3) Buy Here 👉$XRP /USDT
4) Buy Here 👉$BNB/USDT
5) Buy Here 👉$SOL/USDT
6) Buy Here 👉$DOGE/USDT
Follow me for daily profitable signals.
#LongTermGain #BTC #ETH #bnb #HASNAINNADEEM786
195


·
--
Рост
$XAU Guys Long 🖤 💪 🎯
Current plan:
Entry 4,342.29 - 4,364.11
Targets 4,563.75 - 4,732.19
SL 4,212.02
#XAU #LongTermGain #XAUUSD❤️
$XAU Guys Long 🖤 💪 🎯
Current plan:
Entry 4,342.29 - 4,364.11
Targets 4,563.75 - 4,732.19
SL 4,212.02
#XAU #LongTermGain #XAUUSD❤️
Current plan:
Entry 4,342.29 - 4,364.11
Targets 4,563.75 - 4,732.19
SL 4,212.02
#XAU #LongTermGain #XAUUSD❤️
70

·
--
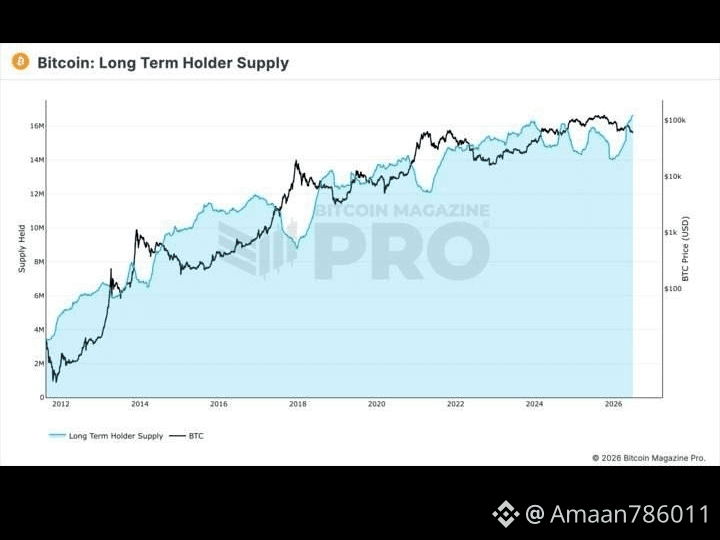
🚀 #HIGH $BTC The amount of Bitcoin held in long-term holder addresses has reached a new all-time high.
#LongTermGain
🚀 #HIGH $BTC The amount of Bitcoin held in long-term holder addresses has reached a new all-time high.
#LongTermGain
#LongTermGain
50

·
--
Рост
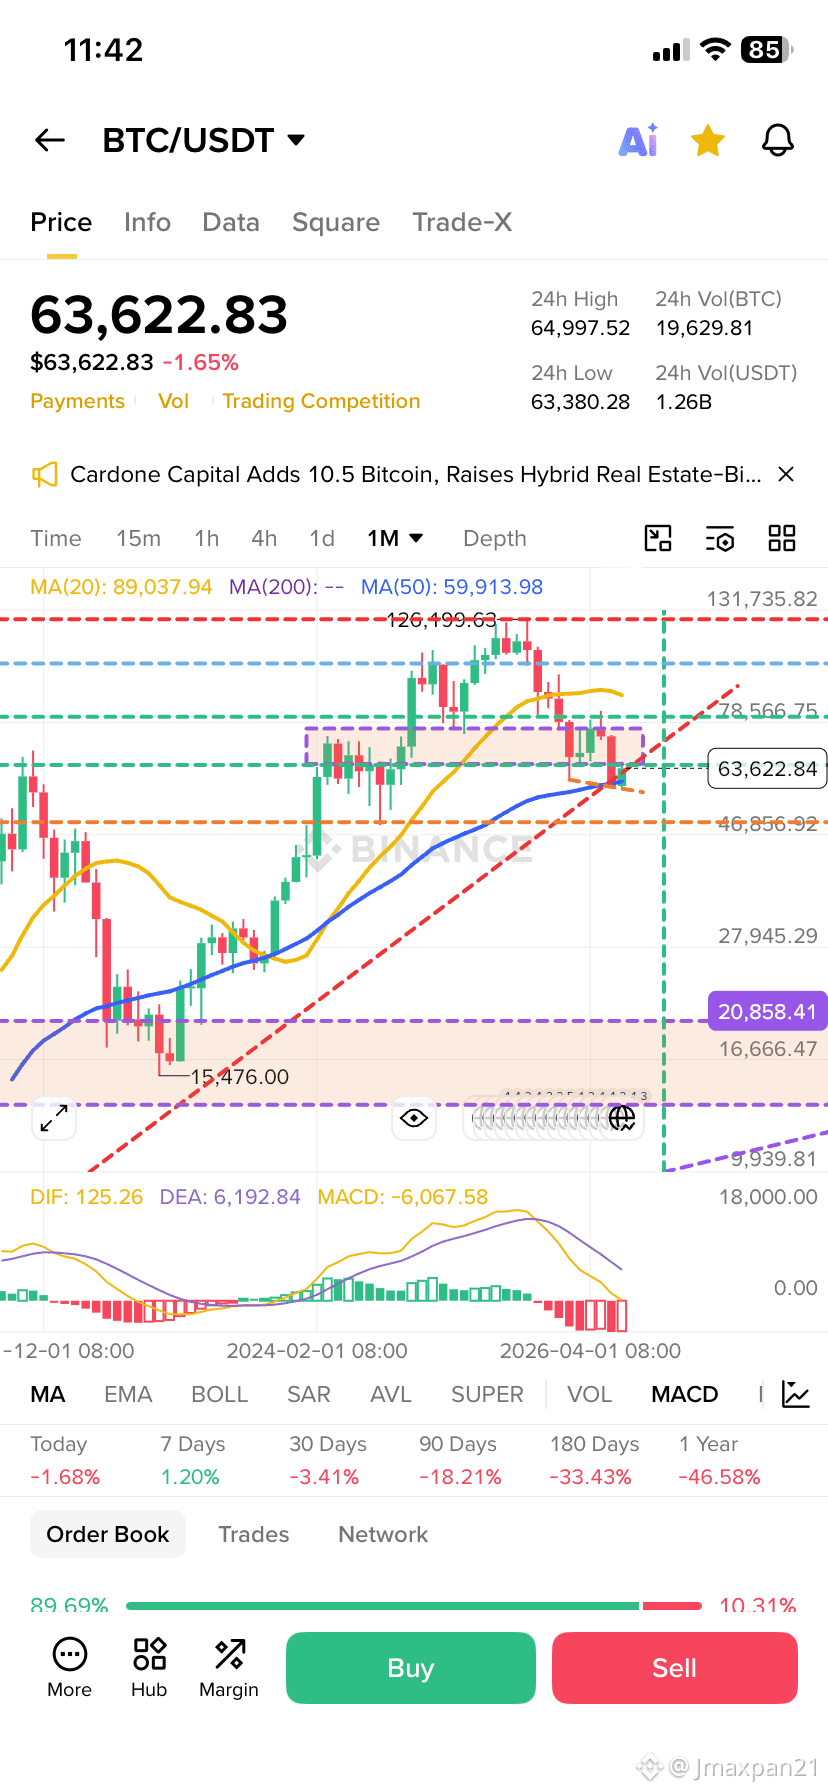
“Patience pays off” using two indicators, MA and MACD on one month timeframe. Buy low and Sell high strategy. Jus select 3 or 4 coins with strong fundamentals, proven utility, and widespread institutional adoption. $BTC $ETH $SOL #conviction #LongTermGain
“Patience pays off” using two indicators, MA and MACD on one month timeframe. Buy low and Sell high strategy. Jus select 3 or 4 coins with strong fundamentals, proven utility, and widespread institutional adoption. $BTC $ETH $SOL #conviction #LongTermGain
1
187



·
--
Рост
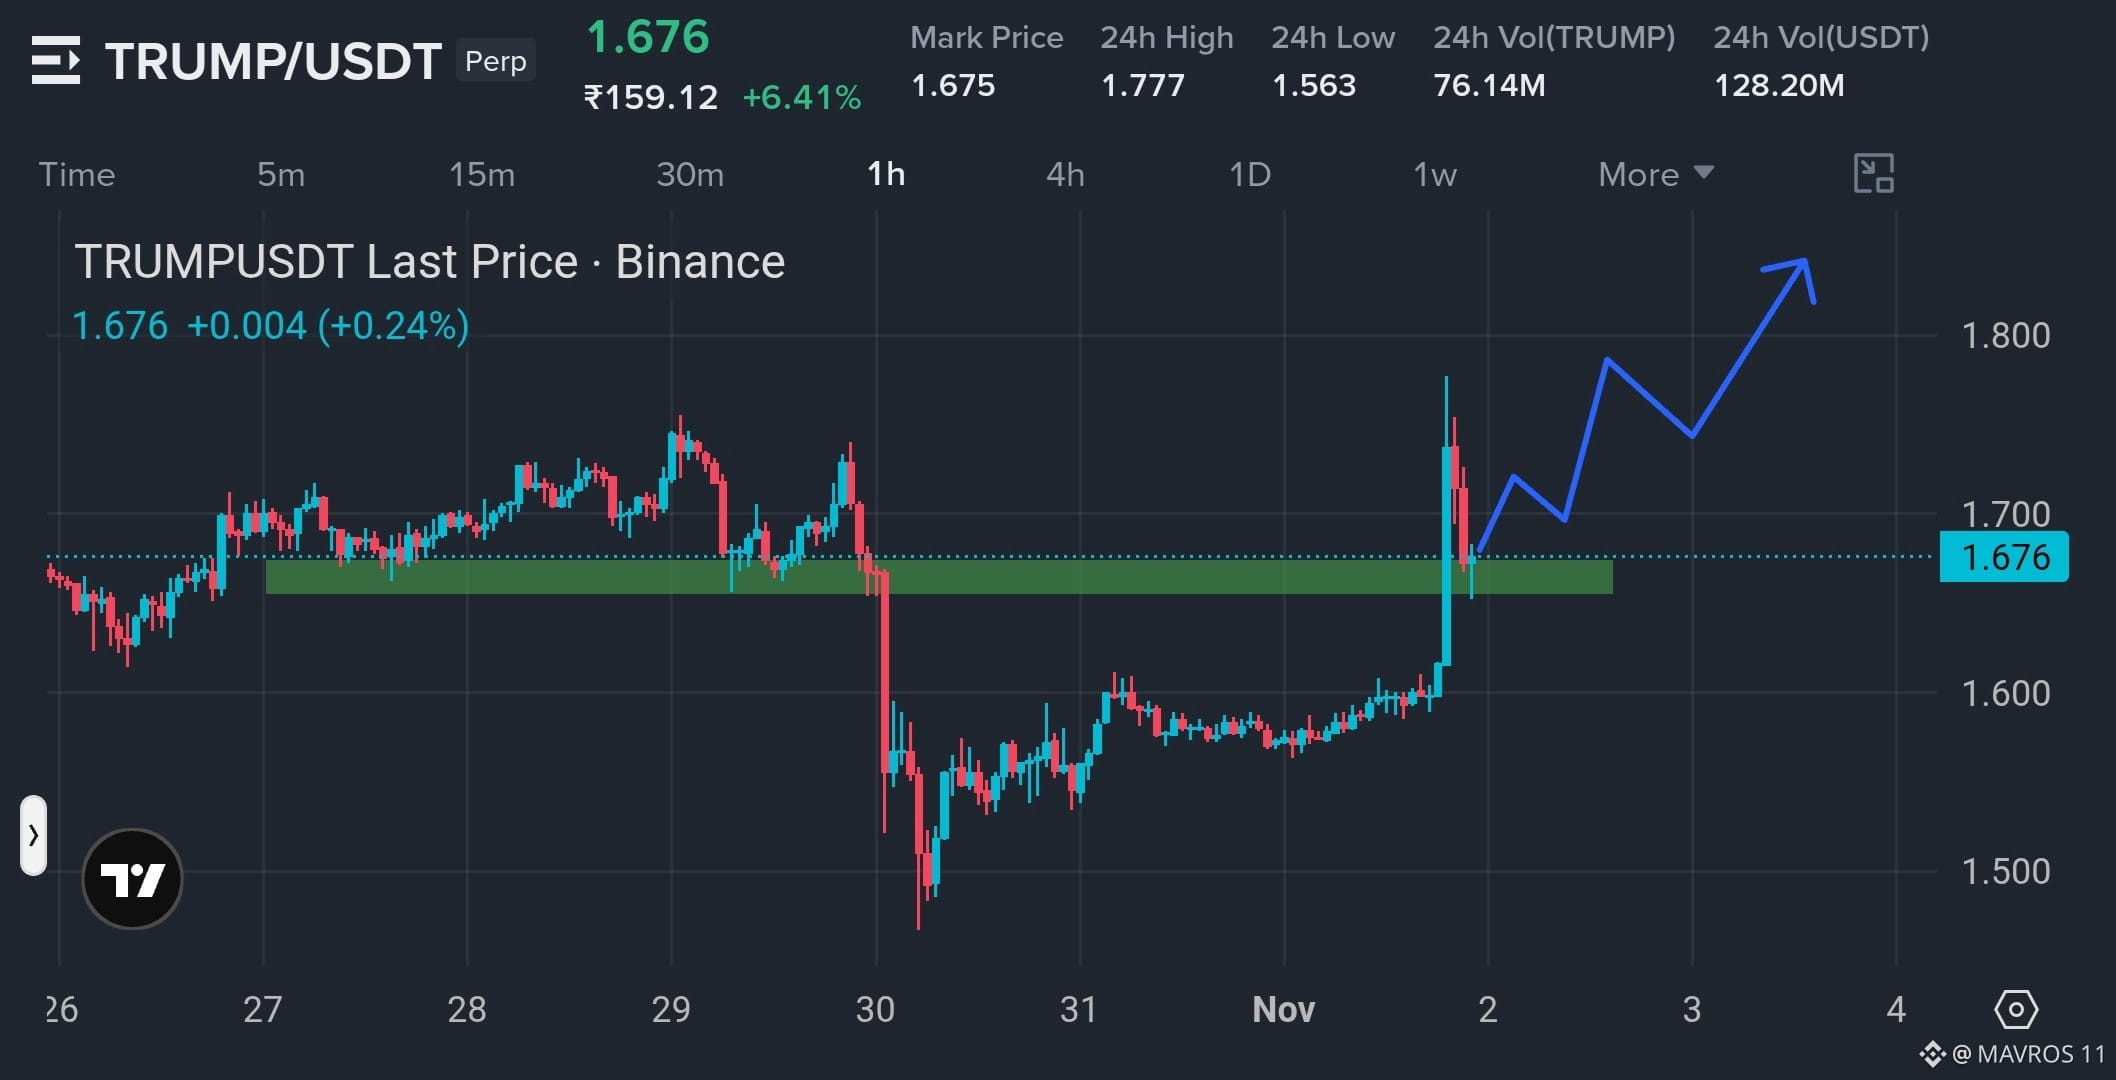
Hold on Guys $TRUMP Is Another Big Move Coming? 🚀
After spending time in consolidation, $TRUMP finally made a strong breakout. Now price is pulling back toward the $1.66–$1.68 zone, which could be an important support area.
If buyers defend this zone, I think another push toward $1.80 and beyond is possible.
I'm watching this pullback closely. Bulls need to hold the breakout zone to keep the momentum alive. 👀
Watch👇👉$TRUMP
{future}(TRUMPUSDT)
#TRUMP #bullish_pepe #LongTermGain
Hold on Guys $TRUMP Is Another Big Move Coming? 🚀
After spending time in consolidation, $TRUMP finally made a strong breakout. Now price is pulling back toward the $1.66–$1.68 zone, which could be an important support area.
If buyers defend this zone, I think another push toward $1.80 and beyond is possible.
I'm watching this pullback closely. Bulls need to hold the breakout zone to keep the momentum alive. 👀
Watch👇👉$TRUMP
#TRUMP #bullish_pepe #LongTermGain
After spending time in consolidation, $TRUMP finally made a strong breakout. Now price is pulling back toward the $1.66–$1.68 zone, which could be an important support area.
If buyers defend this zone, I think another push toward $1.80 and beyond is possible.
I'm watching this pullback closely. Bulls need to hold the breakout zone to keep the momentum alive. 👀
Watch👇👉$TRUMP
#TRUMP #bullish_pepe #LongTermGain
309

·
--
Рост
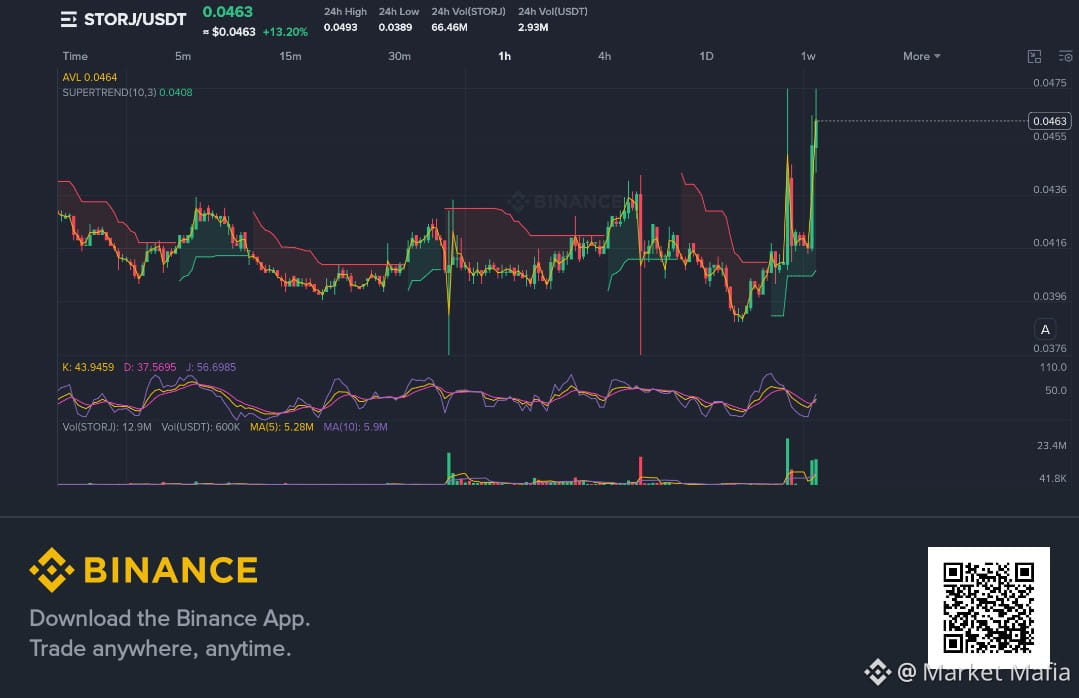
🚀 $STORJ Long Trade Signal — Premium Bullish Recovery Setup
$STORJ is trading at 0.0464, up 13.45%, showing a strong recovery from the recent lows. Price is holding around AVL 0.0464 and remains comfortably above Supertrend 0.0408, keeping the broader short-term structure bullish. K/D/J (44.34 / 37.70 / 57.61) also indicates improving buying momentum.
📍 Entry Zone: 0.0458 – 0.0466
💎 Ideal Entry: 0.0461 – 0.0464
🎯 Take Profit Targets:
TP1: 0.0471
TP2: 0.0493
TP3: 0.0500
TP4: 0.0530
TP5: 0.0560
🛑 Stop Loss: 0.0438
📊 Key Technical Levels:
• AVL: 0.0464
• Support: 0.0442
• Major Support: 0.0413
• Resistance: 0.0471
• Breakout Resistance: 0.0493 – 0.0500
• Supertrend: 0.0408
🔥 Bullish Scenario: If $STORJ holds above 0.0464 and breaks 0.0493 with strong volume, momentum could accelerate toward 0.0500 → 0.0530 → 0.0560.
⚠️ Risk Warning: #STORJ is scheduled for delisting on September 3, 2026 at 08:00 UTC+5. Delisting-related volatility and liquidity risk can be extremely high. Avoid oversized positions and do not rely on the targets being reached.
❌ Invalidation: A sustained move below 0.0438 weakens the long setup significantly.
💰 Trade #STORJ with disciplined risk management — protect capital first, profits second.
{future}(STORJUSDT)
#LongTermGain #LONG✅ 👇
🚀 $STORJ Long Trade Signal — Premium Bullish Recovery Setup
$STORJ is trading at 0.0464, up 13.45%, showing a strong recovery from the recent lows. Price is holding around AVL 0.0464 and remains comfortably above Supertrend 0.0408, keeping the broader short-term structure bullish. K/D/J (44.34 / 37.70 / 57.61) also indicates improving buying momentum.
📍 Entry Zone: 0.0458 – 0.0466
💎 Ideal Entry: 0.0461 – 0.0464
🎯 Take Profit Targets:
TP1: 0.0471
TP2: 0.0493
TP3: 0.0500
TP4: 0.0530
TP5: 0.0560
🛑 Stop Loss: 0.0438
📊 Key Technical Levels:
• AVL: 0.0464
• Support: 0.0442
• Major Support: 0.0413
• Resistance: 0.0471
• Breakout Resistance: 0.0493 – 0.0500
• Supertrend: 0.0408
🔥 Bullish Scenario: If $STORJ holds above 0.0464 and breaks 0.0493 with strong volume, momentum could accelerate toward 0.0500 → 0.0530 → 0.0560.
⚠️ Risk Warning: #STORJ is scheduled for delisting on September 3, 2026 at 08:00 UTC+5. Delisting-related volatility and liquidity risk can be extremely high. Avoid oversized positions and do not rely on the targets being reached.
❌ Invalidation: A sustained move below 0.0438 weakens the long setup significantly.
💰 Trade #STORJ with disciplined risk management — protect capital first, profits second.
#LongTermGain #LONG✅ 👇
$STORJ is trading at 0.0464, up 13.45%, showing a strong recovery from the recent lows. Price is holding around AVL 0.0464 and remains comfortably above Supertrend 0.0408, keeping the broader short-term structure bullish. K/D/J (44.34 / 37.70 / 57.61) also indicates improving buying momentum.
📍 Entry Zone: 0.0458 – 0.0466
💎 Ideal Entry: 0.0461 – 0.0464
🎯 Take Profit Targets:
TP1: 0.0471
TP2: 0.0493
TP3: 0.0500
TP4: 0.0530
TP5: 0.0560
🛑 Stop Loss: 0.0438
📊 Key Technical Levels:
• AVL: 0.0464
• Support: 0.0442
• Major Support: 0.0413
• Resistance: 0.0471
• Breakout Resistance: 0.0493 – 0.0500
• Supertrend: 0.0408
🔥 Bullish Scenario: If $STORJ holds above 0.0464 and breaks 0.0493 with strong volume, momentum could accelerate toward 0.0500 → 0.0530 → 0.0560.
⚠️ Risk Warning: #STORJ is scheduled for delisting on September 3, 2026 at 08:00 UTC+5. Delisting-related volatility and liquidity risk can be extremely high. Avoid oversized positions and do not rely on the targets being reached.
❌ Invalidation: A sustained move below 0.0438 weakens the long setup significantly.
💰 Trade #STORJ with disciplined risk management — protect capital first, profits second.
#LongTermGain #LONG✅ 👇
1
149
·
--
Рост
🚀 $BNB Long Trade Signal — Strong Bullish Momentum
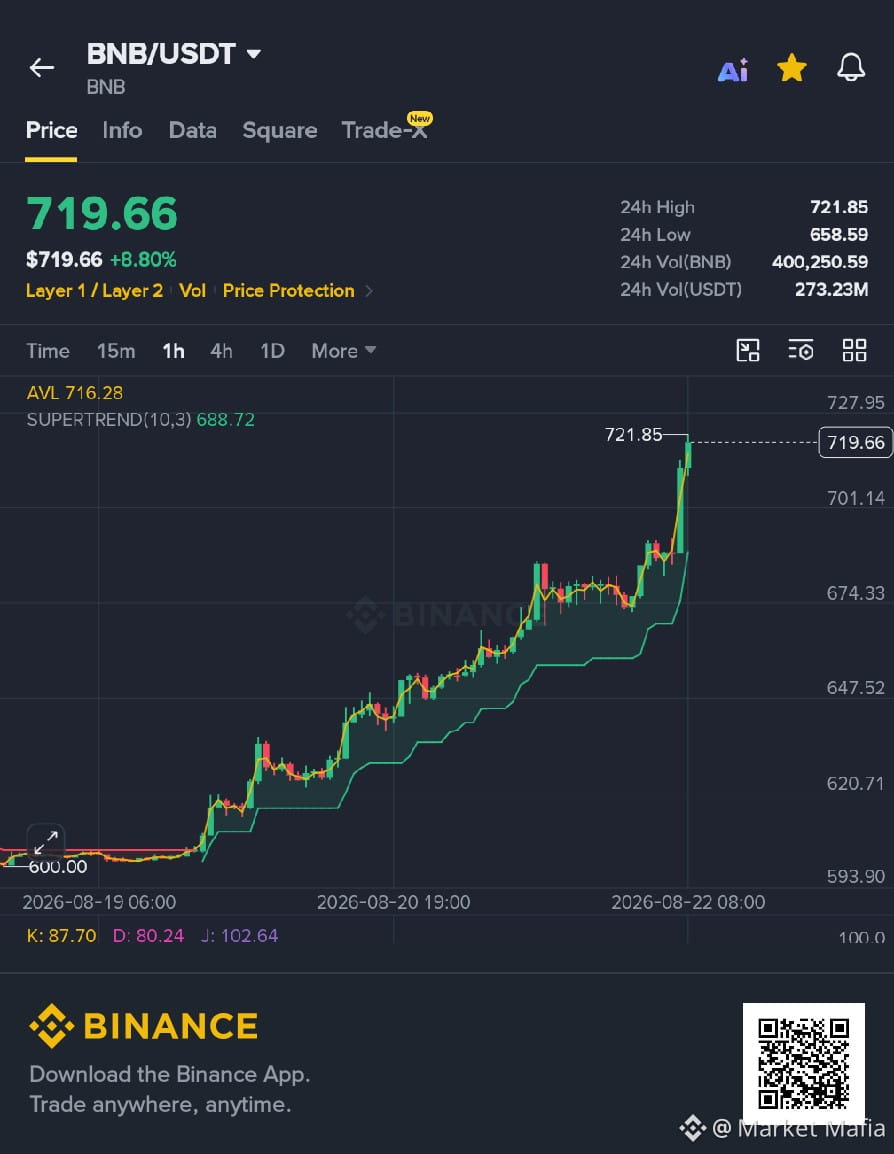
$BNB is trading at 719.66, up 8.80%, with price above AVL 716.28 and Supertrend 688.72. K/D/J (87.70 / 80.24 / 102.64) confirms strong bullish momentum.
📍 Entry Zone: 714 – 722
🎯 Take Profit Targets:
TP1: 727.95
TP2: 740
TP3: 755
TP4: 775
🛑 Stop Loss: 701
📊 Key Support: 716.28 → 701.14
📈 Resistance: 727.95 → 740
✅ Confirmation: Hold above 716 and break 727.95 with strong volume.
⚠️ $BNB is already strongly extended, so avoid chasing a sudden spike. If 701 breaks, the long setup is invalidated.
🔥 Buy #BNB and trade with proper risk management.
{spot}(BNBUSDT)
#LongTermGain 👇
#BNBUSDT Here ✅
🚀 $BNB Long Trade Signal — Strong Bullish Momentum
$BNB is trading at 719.66, up 8.80%, with price above AVL 716.28 and Supertrend 688.72. K/D/J (87.70 / 80.24 / 102.64) confirms strong bullish momentum.
📍 Entry Zone: 714 – 722
🎯 Take Profit Targets:
TP1: 727.95
TP2: 740
TP3: 755
TP4: 775
🛑 Stop Loss: 701
📊 Key Support: 716.28 → 701.14
📈 Resistance: 727.95 → 740
✅ Confirmation: Hold above 716 and break 727.95 with strong volume.
⚠️ $BNB is already strongly extended, so avoid chasing a sudden spike. If 701 breaks, the long setup is invalidated.
🔥 Buy #BNB and trade with proper risk management.
#LongTermGain 👇
#BNBUSDT Here ✅
$BNB is trading at 719.66, up 8.80%, with price above AVL 716.28 and Supertrend 688.72. K/D/J (87.70 / 80.24 / 102.64) confirms strong bullish momentum.
📍 Entry Zone: 714 – 722
🎯 Take Profit Targets:
TP1: 727.95
TP2: 740
TP3: 755
TP4: 775
🛑 Stop Loss: 701
📊 Key Support: 716.28 → 701.14
📈 Resistance: 727.95 → 740
✅ Confirmation: Hold above 716 and break 727.95 with strong volume.
⚠️ $BNB is already strongly extended, so avoid chasing a sudden spike. If 701 breaks, the long setup is invalidated.
🔥 Buy #BNB and trade with proper risk management.
#LongTermGain 👇
#BNBUSDT Here ✅
1
29

·
--
🟢 $CYS — LONG Setup
📊 Trade Plan
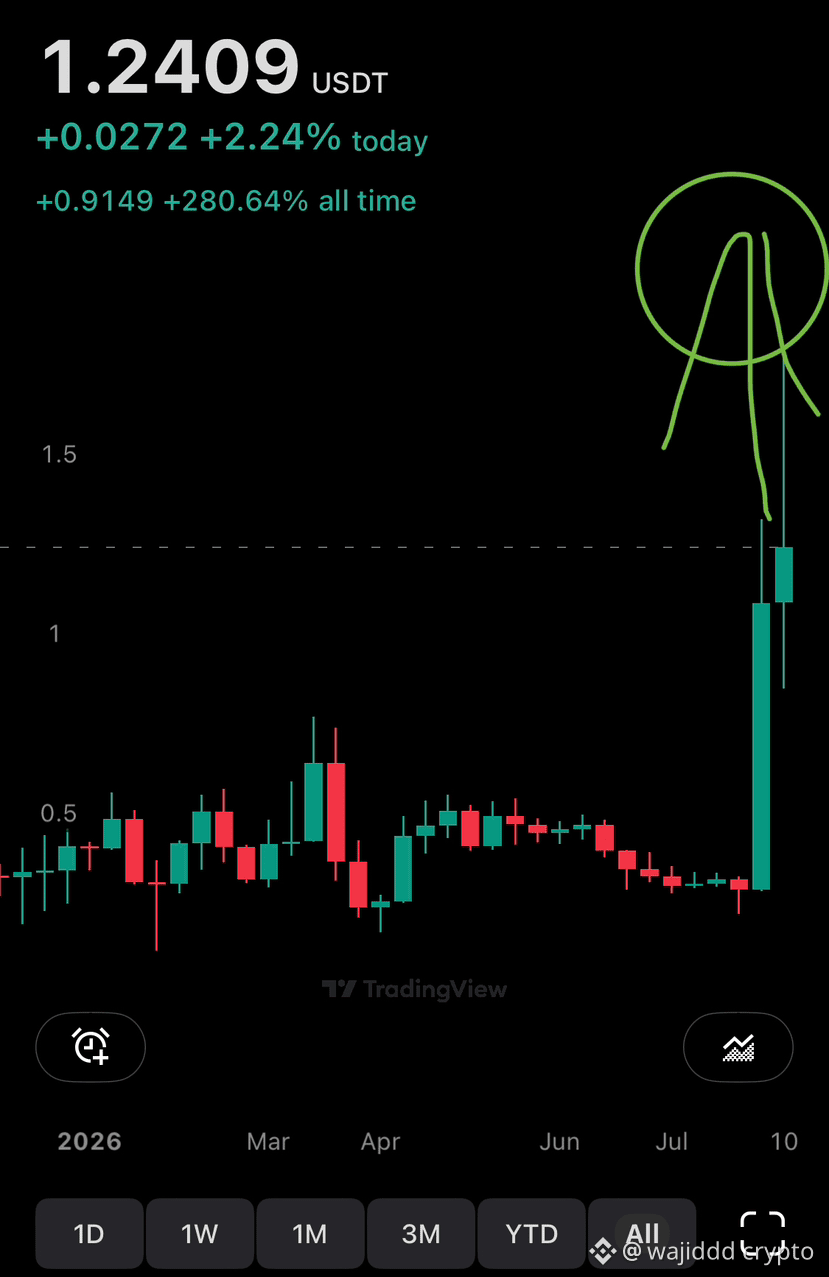
Entry Zone: 1.2065 – 1.2287
Stop Loss (SL): 0.8472
Take Profit Targets:
TP1: 1.4954
TP2: 1.6807
TP3: 1.9585
🔍 Key Catalyst & Technical Drivers
Multi-Timeframe Alignment: The 1D trend remains cleanly bullish, while the 4H bias favors the upside (66% confidence rating). We’re trading with the broader macro trend, not fighting the current.
Momentum & Volatility:
RSI (15m): Sitting around 56.5, indicating plenty of headroom before reaching overbought conditions.
ATR (1H): Currently at 0.1029, confirming sufficient volatility to fuel a expansion toward higher targets (a potential 23%–38% upside move toward TP1/TP2).
Risk Management: The structure invalidates if price breaks down below the critical support floor.
#cys #LongTermGain
{future}(CYSUSDT)
🟢 $CYS — LONG Setup
📊 Trade Plan
Entry Zone: 1.2065 – 1.2287
Stop Loss (SL): 0.8472
Take Profit Targets:
TP1: 1.4954
TP2: 1.6807
TP3: 1.9585
🔍 Key Catalyst & Technical Drivers
Multi-Timeframe Alignment: The 1D trend remains cleanly bullish, while the 4H bias favors the upside (66% confidence rating). We’re trading with the broader macro trend, not fighting the current.
Momentum & Volatility:
RSI (15m): Sitting around 56.5, indicating plenty of headroom before reaching overbought conditions.
ATR (1H): Currently at 0.1029, confirming sufficient volatility to fuel a expansion toward higher targets (a potential 23%–38% upside move toward TP1/TP2).
Risk Management: The structure invalidates if price breaks down below the critical support floor.
#cys #LongTermGain
📊 Trade Plan
Entry Zone: 1.2065 – 1.2287
Stop Loss (SL): 0.8472
Take Profit Targets:
TP1: 1.4954
TP2: 1.6807
TP3: 1.9585
🔍 Key Catalyst & Technical Drivers
Multi-Timeframe Alignment: The 1D trend remains cleanly bullish, while the 4H bias favors the upside (66% confidence rating). We’re trading with the broader macro trend, not fighting the current.
Momentum & Volatility:
RSI (15m): Sitting around 56.5, indicating plenty of headroom before reaching overbought conditions.
ATR (1H): Currently at 0.1029, confirming sufficient volatility to fuel a expansion toward higher targets (a potential 23%–38% upside move toward TP1/TP2).
Risk Management: The structure invalidates if price breaks down below the critical support floor.
#cys #LongTermGain
108
·
--
Рост
🚀 $BTC Long Trade Signal — Bullish Recovery Setup
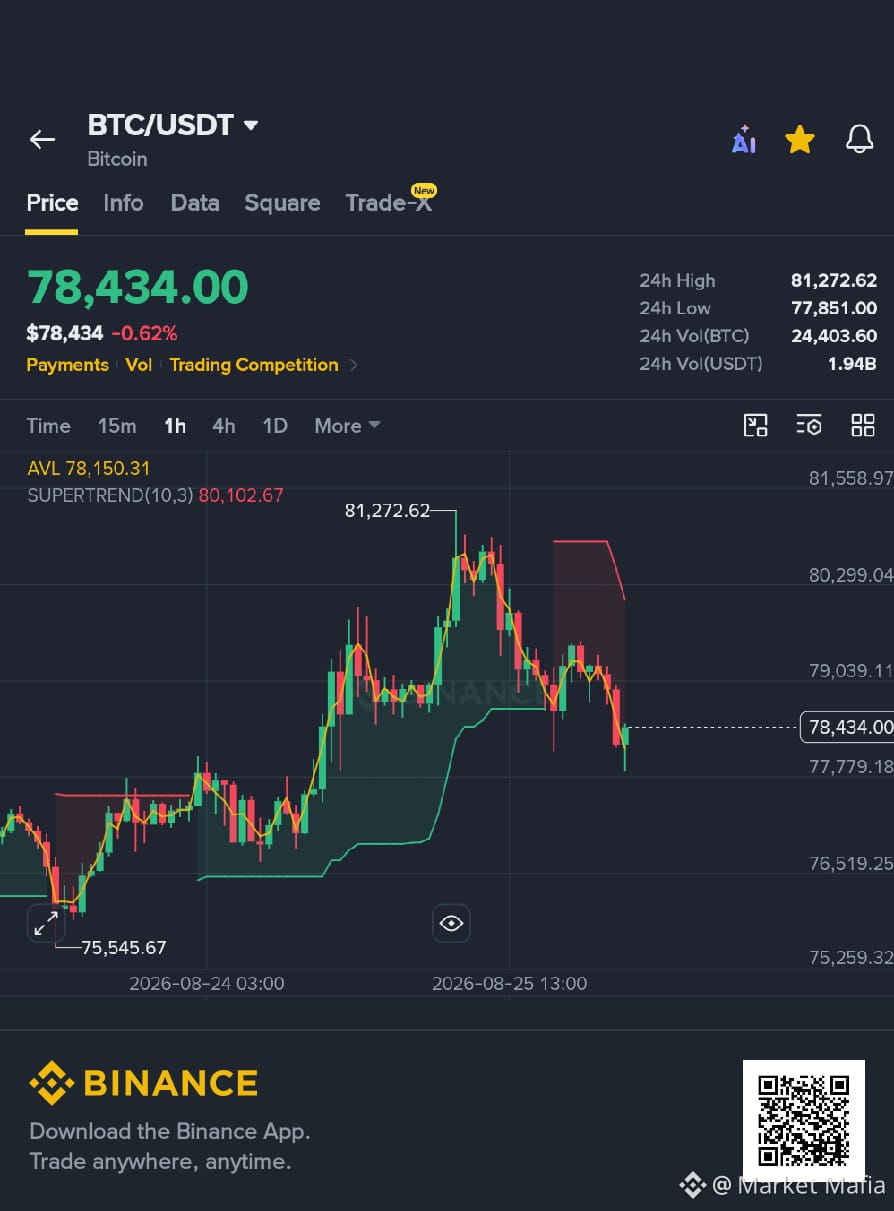
📊 Market Context: $BTC is trading around $78,434, down 0.62%. Price is above the AVL at $78,150.31, but still below the Supertrend at $80,102.67. This is a recovery setup, so breakout confirmation is important.
📍 Entry Zone: $78,100 – $78,600
🎯 Take Profit Targets:
TP1: $79,040
TP2: $80,300
TP3: $81,270
🛑 Stop Loss: $77,750
✅ Confirmation: Hold above $78,100 and reclaim $79,040 for stronger bullish continuation.
⚠️ Risk: If $BTC breaks below $77,750, the long setup is invalidated.
🔥 Trade smart with #BTC☀️
{spot}(BTCUSDT)
#LongTermGain 👇
🚀 $BTC Long Trade Signal — Bullish Recovery Setup
📊 Market Context: $BTC is trading around $78,434, down 0.62%. Price is above the AVL at $78,150.31, but still below the Supertrend at $80,102.67. This is a recovery setup, so breakout confirmation is important.
📍 Entry Zone: $78,100 – $78,600
🎯 Take Profit Targets:
TP1: $79,040
TP2: $80,300
TP3: $81,270
🛑 Stop Loss: $77,750
✅ Confirmation: Hold above $78,100 and reclaim $79,040 for stronger bullish continuation.
⚠️ Risk: If $BTC breaks below $77,750, the long setup is invalidated.
🔥 Trade smart with #BTC☀️
#LongTermGain 👇
📊 Market Context: $BTC is trading around $78,434, down 0.62%. Price is above the AVL at $78,150.31, but still below the Supertrend at $80,102.67. This is a recovery setup, so breakout confirmation is important.
📍 Entry Zone: $78,100 – $78,600
🎯 Take Profit Targets:
TP1: $79,040
TP2: $80,300
TP3: $81,270
🛑 Stop Loss: $77,750
✅ Confirmation: Hold above $78,100 and reclaim $79,040 for stronger bullish continuation.
⚠️ Risk: If $BTC breaks below $77,750, the long setup is invalidated.
🔥 Trade smart with #BTC☀️
#LongTermGain 👇
1
22
·
--
Рост
$PAYP Guys Long 🖤 🔥 🔥
entry 18.55
sl 17.22
tp 25.40
Long $PAYP 👇
#Payp ##LongTermGain #LongOpportunity #LONG✅ 👆
$PAYP Guys Long 🖤 🔥 🔥
entry 18.55
sl 17.22
tp 25.40
Long $PAYP 👇
#Payp ##LongTermGain #LongOpportunity #LONG✅ 👆
entry 18.55
sl 17.22
tp 25.40
Long $PAYP 👇
#Payp ##LongTermGain #LongOpportunity #LONG✅ 👆
20
·
--
Рост
🚀 $NIL Long Trade Signal — Bullish Reversal Setup
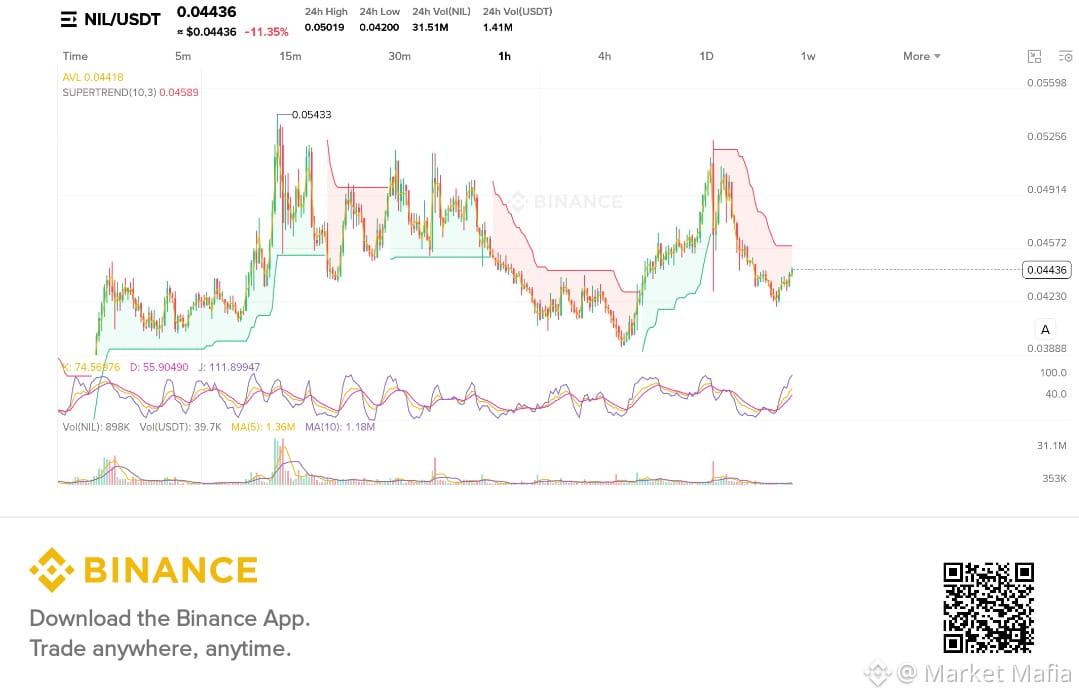
$NIL is trading at 0.04436, down 11.35%, but holding slightly above AVL 0.04418. K/D/J (74.57 / 55.90 / 111.90) shows strong bullish momentum, although price remains below Supertrend 0.04589.
📍 Entry Zone: 0.04380 – 0.04450
🎯 Take Profit Targets:
TP1: 0.04589
TP2: 0.04748
TP3: 0.05040
TP4: 0.05266
🛑 Stop Loss: 0.04160
📊 Key Support: 0.04418 → 0.04165
📈 Resistance: 0.04589 → 0.04748 → 0.05040
✅ Confirmation: Hold above 0.04418 and reclaim 0.04589 with strong volume.
⚠️ If $NIL breaks below 0.04160, the long setup is invalidated.
🔥 Buy #NIL and trade with proper risk management.
{future}(NILUSDT)
#LongTermGain 👇
🚀 $NIL Long Trade Signal — Bullish Reversal Setup
$NIL is trading at 0.04436, down 11.35%, but holding slightly above AVL 0.04418. K/D/J (74.57 / 55.90 / 111.90) shows strong bullish momentum, although price remains below Supertrend 0.04589.
📍 Entry Zone: 0.04380 – 0.04450
🎯 Take Profit Targets:
TP1: 0.04589
TP2: 0.04748
TP3: 0.05040
TP4: 0.05266
🛑 Stop Loss: 0.04160
📊 Key Support: 0.04418 → 0.04165
📈 Resistance: 0.04589 → 0.04748 → 0.05040
✅ Confirmation: Hold above 0.04418 and reclaim 0.04589 with strong volume.
⚠️ If $NIL breaks below 0.04160, the long setup is invalidated.
🔥 Buy #NIL and trade with proper risk management.
#LongTermGain 👇
$NIL is trading at 0.04436, down 11.35%, but holding slightly above AVL 0.04418. K/D/J (74.57 / 55.90 / 111.90) shows strong bullish momentum, although price remains below Supertrend 0.04589.
📍 Entry Zone: 0.04380 – 0.04450
🎯 Take Profit Targets:
TP1: 0.04589
TP2: 0.04748
TP3: 0.05040
TP4: 0.05266
🛑 Stop Loss: 0.04160
📊 Key Support: 0.04418 → 0.04165
📈 Resistance: 0.04589 → 0.04748 → 0.05040
✅ Confirmation: Hold above 0.04418 and reclaim 0.04589 with strong volume.
⚠️ If $NIL breaks below 0.04160, the long setup is invalidated.
🔥 Buy #NIL and trade with proper risk management.
#LongTermGain 👇
2
99

·
--
Рост
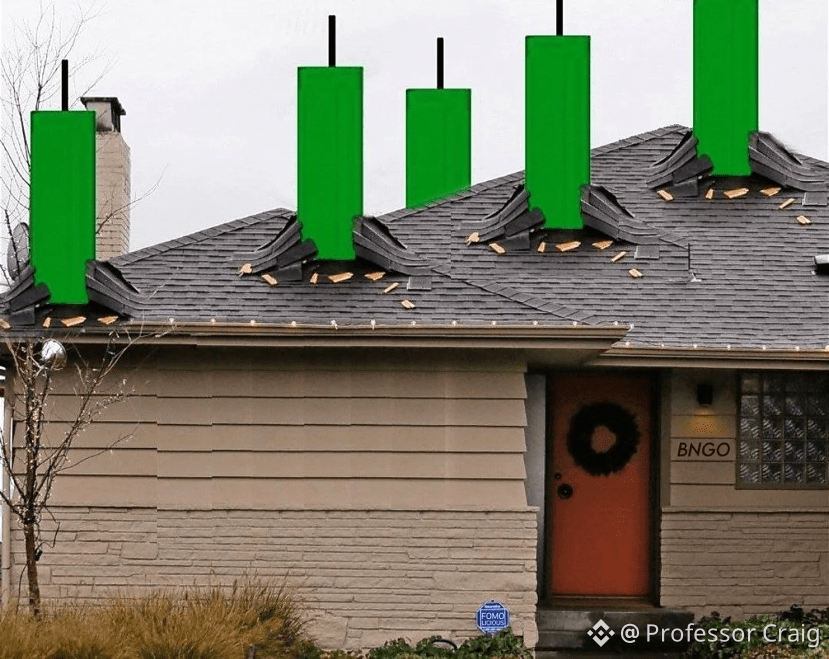
Guys these chinese tokens are flying out of nowhere and you guys still haven’t secured the profit yet?😆
1: $龙虾 +182% Sudden gain out of nowhere
2: $牛来 Decent Run, made Good Profit from it.
3: $我踏马来了 haven’t analyzed but looks legit.
{future}(我踏马来了USDT)
{future}(牛来USDT)
{future}(龙虾USDT)
#chinesetokens #Gainersoftoday #LongTermGain
Guys these chinese tokens are flying out of nowhere and you guys still haven’t secured the profit yet?😆
1: $龙虾 +182% Sudden gain out of nowhere
2: $牛来 Decent Run, made Good Profit from it.
3: $我踏马来了 haven’t analyzed but looks legit.
#chinesetokens #Gainersoftoday #LongTermGain
1: $龙虾 +182% Sudden gain out of nowhere
2: $牛来 Decent Run, made Good Profit from it.
3: $我踏马来了 haven’t analyzed but looks legit.
#chinesetokens #Gainersoftoday #LongTermGain
4
2
1k
·
--
Рост
🚀 $BTC Long Trade Signal — Bullish Recovery Setup
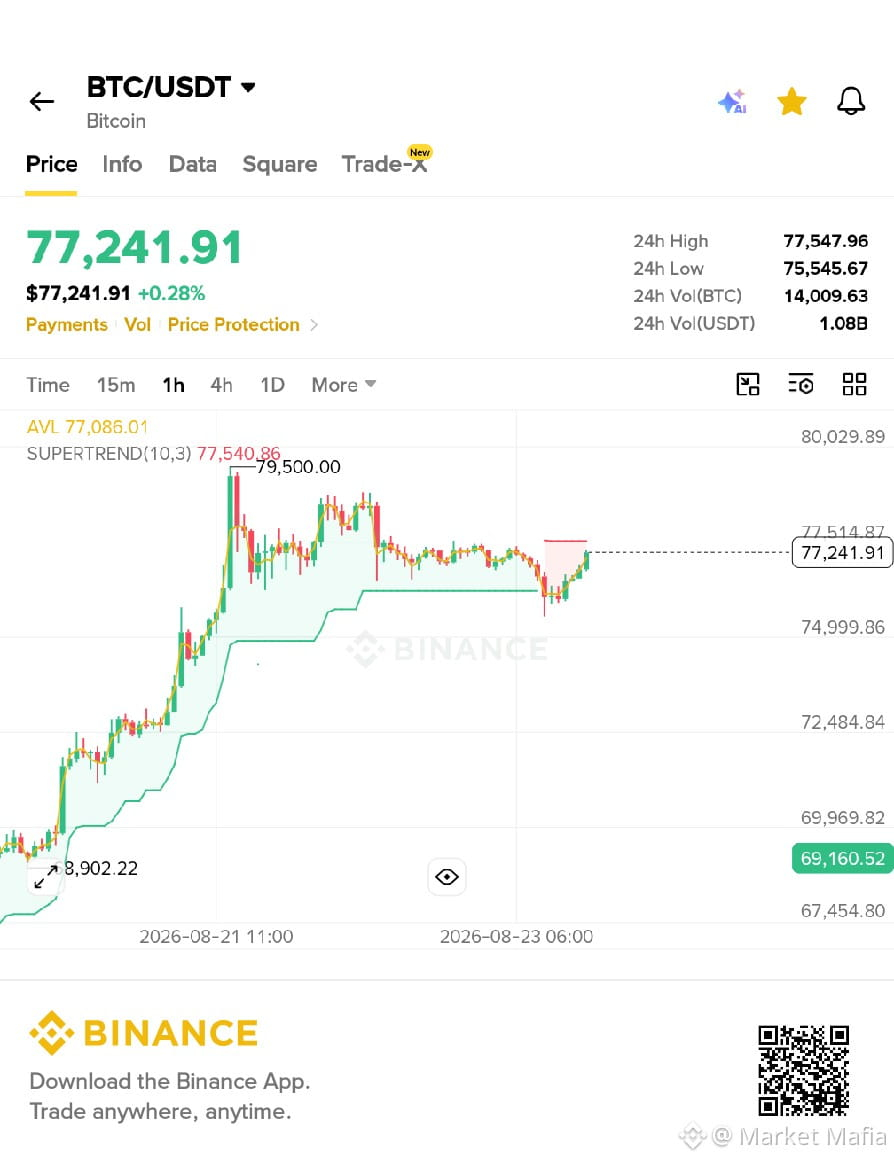
$BTC is trading at 77,241.91, slightly above AVL 77,086.01. Price is close to the Supertrend 77,540, so a breakout above this level would provide stronger confirmation for the long.
📍 Entry Zone: 77,000 – 77,300
🎯 Take Profit Targets:
TP1: 77,550
TP2: 78,500
TP3: 80,000
TP4: 82,000
🛑 Stop Loss: 76,500
📊 Key Support: 77,086 → 76,500
📈 Resistance: 77,540 → 77,548 → 80,000
✅ Confirmation: Hold above 77,000 and break 77,550 with strong volume.
⚠️ If $BTC falls below 76,500, the long setup is invalidated.
🔥 Buy #BTC and trade with proper risk management.
{future}(BTCUSDT)
#LongTermGain 👇
🚀 $BTC Long Trade Signal — Bullish Recovery Setup
$BTC is trading at 77,241.91, slightly above AVL 77,086.01. Price is close to the Supertrend 77,540, so a breakout above this level would provide stronger confirmation for the long.
📍 Entry Zone: 77,000 – 77,300
🎯 Take Profit Targets:
TP1: 77,550
TP2: 78,500
TP3: 80,000
TP4: 82,000
🛑 Stop Loss: 76,500
📊 Key Support: 77,086 → 76,500
📈 Resistance: 77,540 → 77,548 → 80,000
✅ Confirmation: Hold above 77,000 and break 77,550 with strong volume.
⚠️ If $BTC falls below 76,500, the long setup is invalidated.
🔥 Buy #BTC and trade with proper risk management.
#LongTermGain 👇
$BTC is trading at 77,241.91, slightly above AVL 77,086.01. Price is close to the Supertrend 77,540, so a breakout above this level would provide stronger confirmation for the long.
📍 Entry Zone: 77,000 – 77,300
🎯 Take Profit Targets:
TP1: 77,550
TP2: 78,500
TP3: 80,000
TP4: 82,000
🛑 Stop Loss: 76,500
📊 Key Support: 77,086 → 76,500
📈 Resistance: 77,540 → 77,548 → 80,000
✅ Confirmation: Hold above 77,000 and break 77,550 with strong volume.
⚠️ If $BTC falls below 76,500, the long setup is invalidated.
🔥 Buy #BTC and trade with proper risk management.
#LongTermGain 👇
1
2
165
·
--
Рост
🚀 $LINK Long Trade Signal — Bullish Breakout
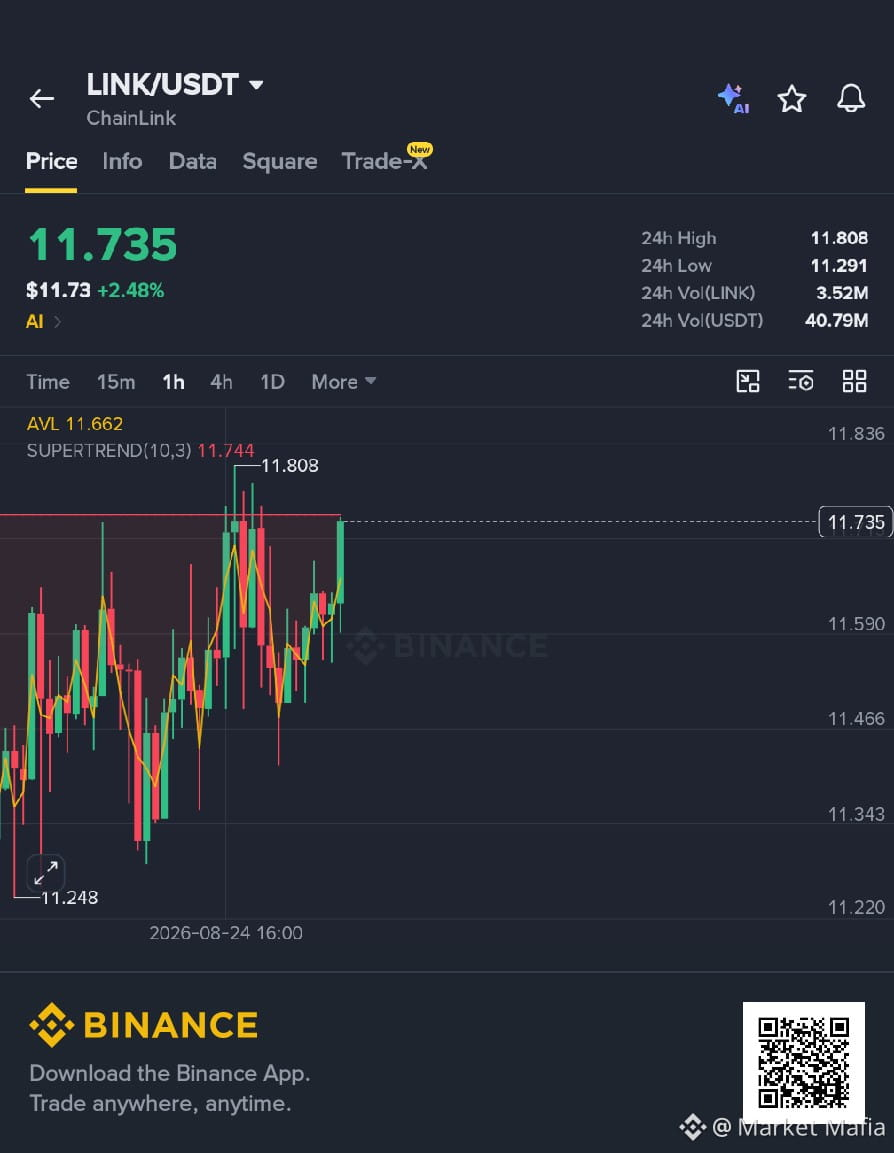
📊 Market Context: $LINK is trading around $11.735, up 2.48%. Price is above the AVL at $11.662 but slightly below the Supertrend at $11.744, so a breakout confirmation is important.
📍 Entry Zone: $11.65 – $11.75
🎯 Take Profit Targets:
TP1: $11.81
TP2: $12.00
TP3: $12.25
🛑 Stop Loss: $11.45
✅ Confirmation: Hold above $11.65 and reclaim $11.74 for stronger bullish continuation.
⚠️ Risk: If $LINK breaks below $11.45, the long setup is invalidated.
🔥 Trade smart with #LINK🔥🔥🔥
{future}(LINKUSDT)
#LongTermGain 👇
🚀 $LINK Long Trade Signal — Bullish Breakout
📊 Market Context: $LINK is trading around $11.735, up 2.48%. Price is above the AVL at $11.662 but slightly below the Supertrend at $11.744, so a breakout confirmation is important.
📍 Entry Zone: $11.65 – $11.75
🎯 Take Profit Targets:
TP1: $11.81
TP2: $12.00
TP3: $12.25
🛑 Stop Loss: $11.45
✅ Confirmation: Hold above $11.65 and reclaim $11.74 for stronger bullish continuation.
⚠️ Risk: If $LINK breaks below $11.45, the long setup is invalidated.
🔥 Trade smart with #LINK🔥🔥🔥
#LongTermGain 👇
📊 Market Context: $LINK is trading around $11.735, up 2.48%. Price is above the AVL at $11.662 but slightly below the Supertrend at $11.744, so a breakout confirmation is important.
📍 Entry Zone: $11.65 – $11.75
🎯 Take Profit Targets:
TP1: $11.81
TP2: $12.00
TP3: $12.25
🛑 Stop Loss: $11.45
✅ Confirmation: Hold above $11.65 and reclaim $11.74 for stronger bullish continuation.
⚠️ Risk: If $LINK breaks below $11.45, the long setup is invalidated.
🔥 Trade smart with #LINK🔥🔥🔥
#LongTermGain 👇
1
47

·
--
Рост
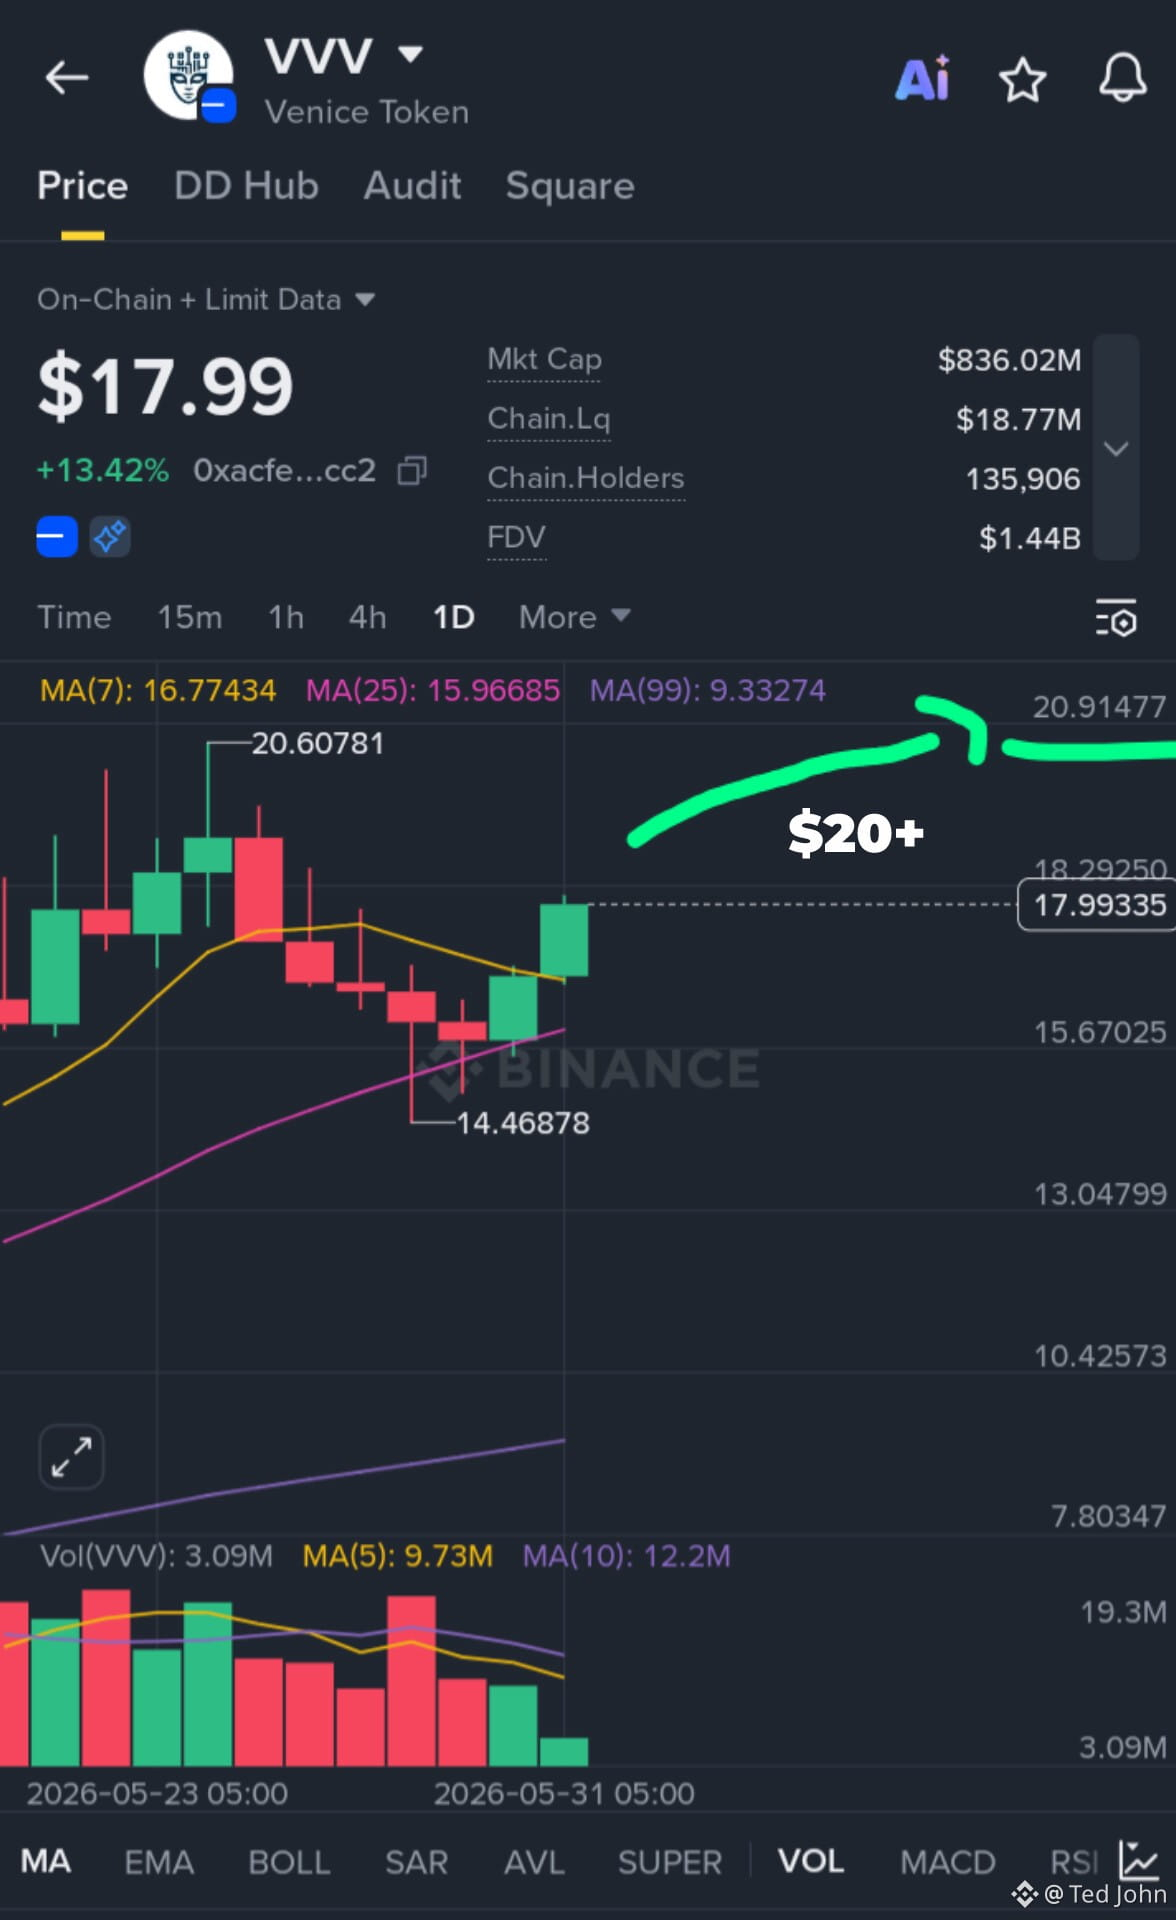
Guys, Just 1 day ago, $VVV was trading near $15, and today it has already climbed close to $18 — that kind of move shows how aggressively buyers are stepping back into the market.
If this momentum continues and bulls break the $20.60 resistance, VVV coin could enter a completely new price discovery zone, with many traders now watching the $25+ area as the next major target.
#VVV #VVV_Bullish #bullish #LongTermGain
{alpha}(84530xacfe6019ed1a7dc6f7b508c02d1b04ec88cc21bf)
Guys, Just 1 day ago, $VVV was trading near $15, and today it has already climbed close to $18 — that kind of move shows how aggressively buyers are stepping back into the market.
If this momentum continues and bulls break the $20.60 resistance, VVV coin could enter a completely new price discovery zone, with many traders now watching the $25+ area as the next major target.
#VVV #VVV_Bullish #bullish #LongTermGain
If this momentum continues and bulls break the $20.60 resistance, VVV coin could enter a completely new price discovery zone, with many traders now watching the $25+ area as the next major target.
#VVV #VVV_Bullish #bullish #LongTermGain
140
·
--
Рост
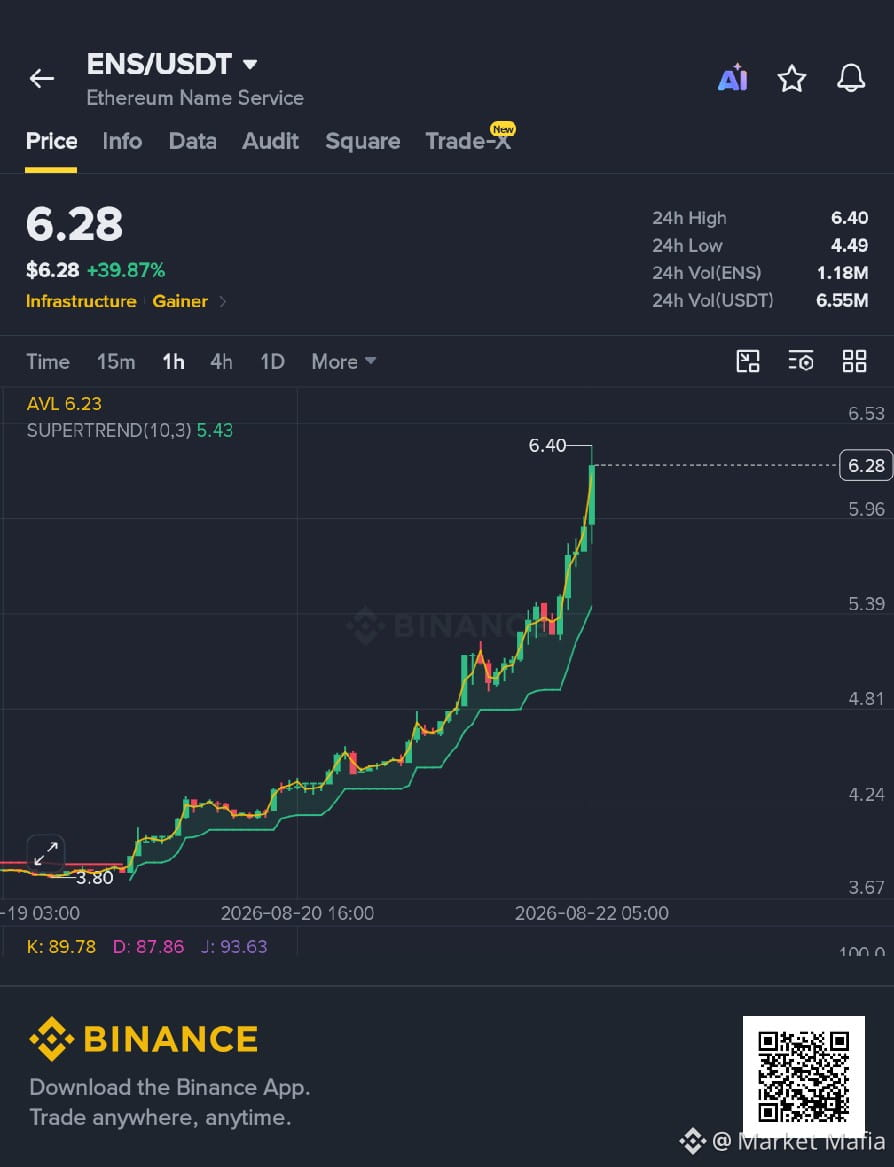
🚀 $ENS Long Trade Signal — Strong Bullish Breakout
$ENS is trading at 6.28, up 39.87%, with price above AVL 6.23 and well above Supertrend 5.43. Momentum is strongly bullish with K 89.78 / D 87.86 / J 93.63, though the move is already extended.
📍 Entry Zone: 6.20 – 6.30
🎯 Take Profit Targets:
TP1: 6.40
TP2: 6.53
TP3: 6.80
TP4: 7.20
🛑 Stop Loss: 5.95
📊 Key Support: 6.23 → 5.96
📈 Resistance: 6.40 → 6.53
✅ Confirmation: Hold above 6.23 and break 6.40–6.53 with strong volume.
⚠️ $ENS is already up nearly 40%, so avoid chasing a sharp spike. If 5.95 breaks, the long setup is invalidated.
🔥 Buy #ENS and trade with proper risk management.
{spot}(ENSUSDT)
#LongTermGain 👇
🚀 $ENS Long Trade Signal — Strong Bullish Breakout
$ENS is trading at 6.28, up 39.87%, with price above AVL 6.23 and well above Supertrend 5.43. Momentum is strongly bullish with K 89.78 / D 87.86 / J 93.63, though the move is already extended.
📍 Entry Zone: 6.20 – 6.30
🎯 Take Profit Targets:
TP1: 6.40
TP2: 6.53
TP3: 6.80
TP4: 7.20
🛑 Stop Loss: 5.95
📊 Key Support: 6.23 → 5.96
📈 Resistance: 6.40 → 6.53
✅ Confirmation: Hold above 6.23 and break 6.40–6.53 with strong volume.
⚠️ $ENS is already up nearly 40%, so avoid chasing a sharp spike. If 5.95 breaks, the long setup is invalidated.
🔥 Buy #ENS and trade with proper risk management.
#LongTermGain 👇
$ENS is trading at 6.28, up 39.87%, with price above AVL 6.23 and well above Supertrend 5.43. Momentum is strongly bullish with K 89.78 / D 87.86 / J 93.63, though the move is already extended.
📍 Entry Zone: 6.20 – 6.30
🎯 Take Profit Targets:
TP1: 6.40
TP2: 6.53
TP3: 6.80
TP4: 7.20
🛑 Stop Loss: 5.95
📊 Key Support: 6.23 → 5.96
📈 Resistance: 6.40 → 6.53
✅ Confirmation: Hold above 6.23 and break 6.40–6.53 with strong volume.
⚠️ $ENS is already up nearly 40%, so avoid chasing a sharp spike. If 5.95 breaks, the long setup is invalidated.
🔥 Buy #ENS and trade with proper risk management.
#LongTermGain 👇
2
133
Войдите, чтобы посмотреть больше материала
Присоединяйтесь к пользователям криптовалют по всему миру на Binance Square
⚡️ Получайте новейшую и полезную информацию о криптоактивах.
💬 Нам доверяет крупнейшая в мире криптобиржа.
👍 Получите достоверные аналитические данные от верифицированных создателей контента.
Эл. почта/номер телефона
В тренде
1
#BinanceReopensWithdrawalsForMoreAssets
Просмотров: 63,615
1,219 обсуждают
2
#BinanceHourlyDepositsExceedWithdrawals
Просмотров: 24,074
484 обсуждают
3
#AnthropicIPOPricedDownasInvestorsEye$1.5T
Просмотров: 226
20 обсуждают
4
#AppleReportsMixedResults
Просмотров: 34,838
798 обсуждают
5
#PalantirSlides3PercentOn$2BRevenue
Просмотров: 2,025
32 обсуждают
6
#FrenchAssemblyRejectsTwoCryptoExitTaxProposals
Просмотров: 1,995
85 обсуждают
7
#USMidtermElections
Просмотров: 781,622
4,229 обсуждают
8
#ThailandSECProposesDerivativesLicensesForDigitalAssetOperators
Просмотров: 134
9 обсуждают
9
#Nasdaq100EntersCorrection
Просмотров: 5,121
117 обсуждают
10
#USOctoberNFP-AreRateCutsStillPossible
Просмотров: 139,241
1,115 обсуждают