
#elliottwave
elliottwave
Просмотров: 705,744
901 обсуждают
Популярные
Новые
·
--
Статья
Elliott Wave Analysis: A Beginner’s Guide🌊 Elliott Wave Made Simple: Read the Structure, Understand the Crowd
Why do markets rally, pull back, and rally again? Elliott Wave Analysis interprets these swings through recurring price patterns and crowd psychology.
Ralph Nelson Elliott developed the idea in the 1930s, studying stock markets. Traders now apply it to crypto too. Check The Binance Academy "Introduction to Elliott Wave Theory"
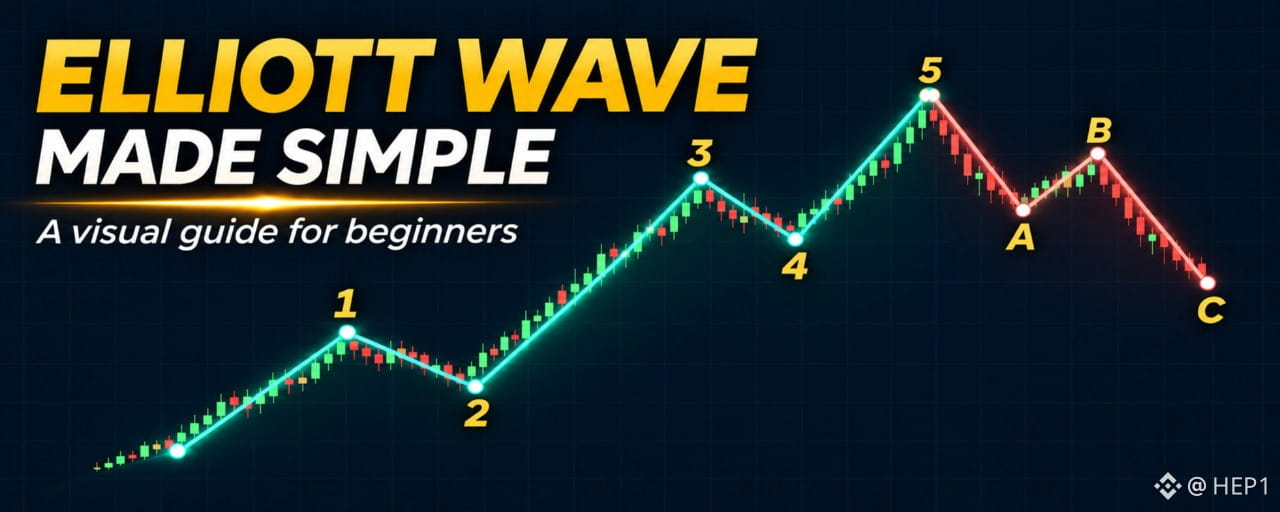
1️⃣ Learn the basic structure
Think of a bullish sequence as five waves advancing, followed by a correction.
🟢 1, 3, 5: move forward.
↩️ 2, 4: pull back.
🔴 A, B, C: illustrate a simple zigzag correction.
Larger waves contain smaller waves. In a standard impulse, the internal structure is 5–3–5–3–5, with “3” representing corrective structure. Corrections can also form flats, triangles, and combinations.
2️⃣ Understand the crowd 🧠
The labels describe price structure; the personalities help explain the story behind it.
These are tendencies, not a fixed script. Excitement alone cannot identify wave 5, and fear alone cannot identify wave C.
3️⃣ Three rules to remember 📋
A convincing story still needs a valid structure. Each red example below shows a broken rule.
Standard impulse ruleIn a bullish exampleWave 2 cannot fully retrace wave 1.It stays above wave 1’s starting low.Wave 3 cannot be shortest among 1, 3, and 5.Compare price distances, not duration.Wave 4 cannot overlap wave 1’s territory.It stays above wave 1’s high.
If a rule breaks, reconsider the count. Diagonals are a separate structure with different overlap rules. Consult StockCharts "Identifying Elliott Wave Patterns".
4️⃣ Where does Fibonacci fit? 📐
Fibonacci helps mark possible reaction zones.
If wave 1 rises from $100 to $120, a 61.8% retracement is:
$120 − ($20 × 0.618) = $107.64
That is a zone to investigate—not an automatic buy.
Retracements measure pullbacks; extensions project possible future distances. Common Fibonacci ratios include 38.2%, 61.8%, and 161.8%. The popular 50% level is not itself a Fibonacci ratio.
5️⃣ Example: a possible wave 2 ending 🔍
Look for several clues to agree.
✅ The count respects the rules.
✅ Price reacts near support and a Fibonacci zone.
✅ RSI or MACD shows improving momentum.
✅ A hammer or bullish engulfing candle is followed by price strength.
In this hypothetical example, a move below $100 invalidates the proposed bullish wave 2 count. Agreement supports a scenario; it cannot guarantee wave 3.
6️⃣ Example: a possible wave 5 warning ⚠️
A new price high can hide weakening momentum.
Higher price high + lower RSI high = bearish divergence.
A shooting star or bearish engulfing pattern near resistance may add evidence. Watch for bearish follow-through and a break of nearby support. Divergence can persist, and wave 5 can extend. Consult the Binance Academy "How to Read the Most Popular Candlestick Patterns"
📝 Your beginner checklist
Structure → Rules → Fibonacci zone → Momentum → Candle confirmation → Risk plan
Start on a higher timeframe, keep an alternative count, and mark what would invalidate your idea.
Use waves to organize scenarios. Let price test them.
Educational only. Wave counts are subjective, and no pattern guarantees the next move.
#ElliottWave #CryptoEducation #TechnicalAnalysis #TradingPsychology #ElliottWaveTheory
Elliott Wave Analysis: A Beginner’s Guide
🌊 Elliott Wave Made Simple: Read the Structure, Understand the Crowd
Why do markets rally, pull back, and rally again? Elliott Wave Analysis interprets these swings through recurring price patterns and crowd psychology.
Ralph Nelson Elliott developed the idea in the 1930s, studying stock markets. Traders now apply it to crypto too. Check The Binance Academy "Introduction to Elliott Wave Theory"
1️⃣ Learn the basic structure
Think of a bullish sequence as five waves advancing, followed by a correction.
🟢 1, 3, 5: move forward.
↩️ 2, 4: pull back.
🔴 A, B, C: illustrate a simple zigzag correction.
Larger waves contain smaller waves. In a standard impulse, the internal structure is 5–3–5–3–5, with “3” representing corrective structure. Corrections can also form flats, triangles, and combinations.
2️⃣ Understand the crowd 🧠
The labels describe price structure; the personalities help explain the story behind it.
These are tendencies, not a fixed script. Excitement alone cannot identify wave 5, and fear alone cannot identify wave C.
3️⃣ Three rules to remember 📋
A convincing story still needs a valid structure. Each red example below shows a broken rule.
Standard impulse ruleIn a bullish exampleWave 2 cannot fully retrace wave 1.It stays above wave 1’s starting low.Wave 3 cannot be shortest among 1, 3, and 5.Compare price distances, not duration.Wave 4 cannot overlap wave 1’s territory.It stays above wave 1’s high.
If a rule breaks, reconsider the count. Diagonals are a separate structure with different overlap rules. Consult StockCharts "Identifying Elliott Wave Patterns".
4️⃣ Where does Fibonacci fit? 📐
Fibonacci helps mark possible reaction zones.
If wave 1 rises from $100 to $120, a 61.8% retracement is:
$120 − ($20 × 0.618) = $107.64
That is a zone to investigate—not an automatic buy.
Retracements measure pullbacks; extensions project possible future distances. Common Fibonacci ratios include 38.2%, 61.8%, and 161.8%. The popular 50% level is not itself a Fibonacci ratio.
5️⃣ Example: a possible wave 2 ending 🔍
Look for several clues to agree.
✅ The count respects the rules.
✅ Price reacts near support and a Fibonacci zone.
✅ RSI or MACD shows improving momentum.
✅ A hammer or bullish engulfing candle is followed by price strength.
In this hypothetical example, a move below $100 invalidates the proposed bullish wave 2 count. Agreement supports a scenario; it cannot guarantee wave 3.
6️⃣ Example: a possible wave 5 warning ⚠️
A new price high can hide weakening momentum.
Higher price high + lower RSI high = bearish divergence.
A shooting star or bearish engulfing pattern near resistance may add evidence. Watch for bearish follow-through and a break of nearby support. Divergence can persist, and wave 5 can extend. Consult the Binance Academy "How to Read the Most Popular Candlestick Patterns"
📝 Your beginner checklist
Structure → Rules → Fibonacci zone → Momentum → Candle confirmation → Risk plan
Start on a higher timeframe, keep an alternative count, and mark what would invalidate your idea.
Use waves to organize scenarios. Let price test them.
Educational only. Wave counts are subjective, and no pattern guarantees the next move.
#ElliottWave #CryptoEducation #TechnicalAnalysis #TradingPsychology #ElliottWaveTheory
Why do markets rally, pull back, and rally again? Elliott Wave Analysis interprets these swings through recurring price patterns and crowd psychology.
Ralph Nelson Elliott developed the idea in the 1930s, studying stock markets. Traders now apply it to crypto too. Check The Binance Academy "Introduction to Elliott Wave Theory"
1️⃣ Learn the basic structure
Think of a bullish sequence as five waves advancing, followed by a correction.
🟢 1, 3, 5: move forward.
↩️ 2, 4: pull back.
🔴 A, B, C: illustrate a simple zigzag correction.
Larger waves contain smaller waves. In a standard impulse, the internal structure is 5–3–5–3–5, with “3” representing corrective structure. Corrections can also form flats, triangles, and combinations.
2️⃣ Understand the crowd 🧠
The labels describe price structure; the personalities help explain the story behind it.
These are tendencies, not a fixed script. Excitement alone cannot identify wave 5, and fear alone cannot identify wave C.
3️⃣ Three rules to remember 📋
A convincing story still needs a valid structure. Each red example below shows a broken rule.
Standard impulse ruleIn a bullish exampleWave 2 cannot fully retrace wave 1.It stays above wave 1’s starting low.Wave 3 cannot be shortest among 1, 3, and 5.Compare price distances, not duration.Wave 4 cannot overlap wave 1’s territory.It stays above wave 1’s high.
If a rule breaks, reconsider the count. Diagonals are a separate structure with different overlap rules. Consult StockCharts "Identifying Elliott Wave Patterns".
4️⃣ Where does Fibonacci fit? 📐
Fibonacci helps mark possible reaction zones.
If wave 1 rises from $100 to $120, a 61.8% retracement is:
$120 − ($20 × 0.618) = $107.64
That is a zone to investigate—not an automatic buy.
Retracements measure pullbacks; extensions project possible future distances. Common Fibonacci ratios include 38.2%, 61.8%, and 161.8%. The popular 50% level is not itself a Fibonacci ratio.
5️⃣ Example: a possible wave 2 ending 🔍
Look for several clues to agree.
✅ The count respects the rules.
✅ Price reacts near support and a Fibonacci zone.
✅ RSI or MACD shows improving momentum.
✅ A hammer or bullish engulfing candle is followed by price strength.
In this hypothetical example, a move below $100 invalidates the proposed bullish wave 2 count. Agreement supports a scenario; it cannot guarantee wave 3.
6️⃣ Example: a possible wave 5 warning ⚠️
A new price high can hide weakening momentum.
Higher price high + lower RSI high = bearish divergence.
A shooting star or bearish engulfing pattern near resistance may add evidence. Watch for bearish follow-through and a break of nearby support. Divergence can persist, and wave 5 can extend. Consult the Binance Academy "How to Read the Most Popular Candlestick Patterns"
📝 Your beginner checklist
Structure → Rules → Fibonacci zone → Momentum → Candle confirmation → Risk plan
Start on a higher timeframe, keep an alternative count, and mark what would invalidate your idea.
Use waves to organize scenarios. Let price test them.
Educational only. Wave counts are subjective, and no pattern guarantees the next move.
#ElliottWave #CryptoEducation #TechnicalAnalysis #TradingPsychology #ElliottWaveTheory
1
69

·
--
🚨 $BTC PREPARES TO LAUNCH WAVE FIVE AFTER FLAWLESS SUPPORT DEFENSE! 💥
Entry: 79,000 – 79,100 ⚡
Target: 80,000 - 82,500 🚀
Stop Loss: 77,500 ⚠️
The hourly structure on $BTC is flashing a textbook Wave 4 completion after buyers cleanly defended the 77.8K liquidity pocket. 📊 Order flow is shifting back to the upside as momentum builds for a push into higher expansion targets.
📌 Reclaiming the 79.5K to 80K region triggers the real wave velocity toward 82.5K. ⚡ As long as 77.5K holds structural integrity, the risk profile heavily favors early momentum buyers. 💬 Are you loading long position entries on this flip or waiting for 80K confirmation? 👇
⚠️ Not financial advice. Always manage your risk. 🛡️
🏷️ #BTC #LongSetup #ElliottWave #CryptoTrading
⚡ 🎯
🚨 $BTC PREPARES TO LAUNCH WAVE FIVE AFTER FLAWLESS SUPPORT DEFENSE! 💥
Entry: 79,000 – 79,100 ⚡
Target: 80,000 - 82,500 🚀
Stop Loss: 77,500 ⚠️
The hourly structure on $BTC is flashing a textbook Wave 4 completion after buyers cleanly defended the 77.8K liquidity pocket. 📊 Order flow is shifting back to the upside as momentum builds for a push into higher expansion targets.
📌 Reclaiming the 79.5K to 80K region triggers the real wave velocity toward 82.5K. ⚡ As long as 77.5K holds structural integrity, the risk profile heavily favors early momentum buyers. 💬 Are you loading long position entries on this flip or waiting for 80K confirmation? 👇
⚠️ Not financial advice. Always manage your risk. 🛡️
🏷️ #BTC #LongSetup #ElliottWave #CryptoTrading
⚡ 🎯
Entry: 79,000 – 79,100 ⚡
Target: 80,000 - 82,500 🚀
Stop Loss: 77,500 ⚠️
The hourly structure on $BTC is flashing a textbook Wave 4 completion after buyers cleanly defended the 77.8K liquidity pocket. 📊 Order flow is shifting back to the upside as momentum builds for a push into higher expansion targets.
📌 Reclaiming the 79.5K to 80K region triggers the real wave velocity toward 82.5K. ⚡ As long as 77.5K holds structural integrity, the risk profile heavily favors early momentum buyers. 💬 Are you loading long position entries on this flip or waiting for 80K confirmation? 👇
⚠️ Not financial advice. Always manage your risk. 🛡️
🏷️ #BTC #LongSetup #ElliottWave #CryptoTrading
⚡ 🎯
7

·
--
🚨 $XRP PREPARED FOR WAVE 3 SURGE TOWARD $2‑$3 💥
Entry: 1.25 ⚡
Target: 1.45 🚀
Stop Loss: 0.99 ⚠️
📊 XForceGlobal spots XRP perched just above the 61.8‑78.6% Fibonacci corridor, a classic Elliott Wave‑2 corrective pocket. The current dip is feeding liquidity, setting the stage for a potent Wave 3 impulse that could vault the token toward the $2‑$3 horizon. 📈 A decisive hold above the $1.10‑$1.22 buy zone would validate the bullish count, while a breach of $0.99 would nullify the setup. 🌊 Institutional order flow often respects these fib zones, making the next leg a high‑conviction play.
💬 Do you see the Wave 3 catalyst materializing before the next liquidity sweep? 👇
⚠️ Not financial advice. Always manage your risk. 🛡️
🏷️ #XRP #ElliottWave #LongSetup #Crypto
🔥 💎
🚨 $XRP PREPARED FOR WAVE 3 SURGE TOWARD $2‑$3 💥
Entry: 1.25 ⚡
Target: 1.45 🚀
Stop Loss: 0.99 ⚠️
📊 XForceGlobal spots XRP perched just above the 61.8‑78.6% Fibonacci corridor, a classic Elliott Wave‑2 corrective pocket. The current dip is feeding liquidity, setting the stage for a potent Wave 3 impulse that could vault the token toward the $2‑$3 horizon. 📈 A decisive hold above the $1.10‑$1.22 buy zone would validate the bullish count, while a breach of $0.99 would nullify the setup. 🌊 Institutional order flow often respects these fib zones, making the next leg a high‑conviction play.
💬 Do you see the Wave 3 catalyst materializing before the next liquidity sweep? 👇
⚠️ Not financial advice. Always manage your risk. 🛡️
🏷️ #XRP #ElliottWave #LongSetup #Crypto
🔥 💎
Entry: 1.25 ⚡
Target: 1.45 🚀
Stop Loss: 0.99 ⚠️
📊 XForceGlobal spots XRP perched just above the 61.8‑78.6% Fibonacci corridor, a classic Elliott Wave‑2 corrective pocket. The current dip is feeding liquidity, setting the stage for a potent Wave 3 impulse that could vault the token toward the $2‑$3 horizon. 📈 A decisive hold above the $1.10‑$1.22 buy zone would validate the bullish count, while a breach of $0.99 would nullify the setup. 🌊 Institutional order flow often respects these fib zones, making the next leg a high‑conviction play.
💬 Do you see the Wave 3 catalyst materializing before the next liquidity sweep? 👇
⚠️ Not financial advice. Always manage your risk. 🛡️
🏷️ #XRP #ElliottWave #LongSetup #Crypto
🔥 💎
17

🚀 $XRP ON THE CUSP OF A $2‑$3 WAVE 3 SURGE? 📈
XForceGlobal spots XRP perched just above a deep Fibonacci zone, the 61.8‑78.6% retracement that cradles $1.10‑$1.22. The analyst reads the recent 4.3% weekly dip as a classic Wave 2 correction, priming the market for a potent Wave 3 impulse. 📊 If buyers hold the buy‑zone, the next leg could sprint toward $1.40‑$1.45 and beyond.
But the chart still leaves room for a deeper slide to $1.15‑$1.20 before the rally ignites, and a break below $0.98‑$1.00 would wipe the bullish case. ⚡ Keep an eye on order flow; a decisive bounce off that support could flip the sentiment overnight. 🔍
💬 Who's positioning for the Wave 3 breakout if XRP clears $1.40? 👇
⚠️ Not financial advice. Always manage your risk. 🛡️
🏷️ #XRP #LongSetup #ElliottWave #Crypto
🚀 ⚡
🚀 $XRP ON THE CUSP OF A $2‑$3 WAVE 3 SURGE? 📈
XForceGlobal spots XRP perched just above a deep Fibonacci zone, the 61.8‑78.6% retracement that cradles $1.10‑$1.22. The analyst reads the recent 4.3% weekly dip as a classic Wave 2 correction, priming the market for a potent Wave 3 impulse. 📊 If buyers hold the buy‑zone, the next leg could sprint toward $1.40‑$1.45 and beyond.
But the chart still leaves room for a deeper slide to $1.15‑$1.20 before the rally ignites, and a break below $0.98‑$1.00 would wipe the bullish case. ⚡ Keep an eye on order flow; a decisive bounce off that support could flip the sentiment overnight. 🔍
💬 Who's positioning for the Wave 3 breakout if XRP clears $1.40? 👇
⚠️ Not financial advice. Always manage your risk. 🛡️
🏷️ #XRP #LongSetup #ElliottWave #Crypto
🚀 ⚡
XForceGlobal spots XRP perched just above a deep Fibonacci zone, the 61.8‑78.6% retracement that cradles $1.10‑$1.22. The analyst reads the recent 4.3% weekly dip as a classic Wave 2 correction, priming the market for a potent Wave 3 impulse. 📊 If buyers hold the buy‑zone, the next leg could sprint toward $1.40‑$1.45 and beyond.
But the chart still leaves room for a deeper slide to $1.15‑$1.20 before the rally ignites, and a break below $0.98‑$1.00 would wipe the bullish case. ⚡ Keep an eye on order flow; a decisive bounce off that support could flip the sentiment overnight. 🔍
💬 Who's positioning for the Wave 3 breakout if XRP clears $1.40? 👇
⚠️ Not financial advice. Always manage your risk. 🛡️
🏷️ #XRP #LongSetup #ElliottWave #Crypto
🚀 ⚡
17

🚨 $ETH AGGRESSIVE THIRD WAVE BREAKDOWN UNLOCKS TARGETS TOWARD 1,832 📉
Entry: 2,240 ⚡
Target: 1,832 🎯
Sellers have seized complete control as $ETH slices through local structure, tracking an aggressive Elliott Wave C extension after dropping 20% from the September peak. 📊 Momentum oscillators are buried deep in bear territory, with Bull/Bear Power collapsing to -187.7 and daily RSI sliding under 30.
The line in the sand sits at 2,292, keeping the intermediate trend firmly suppressed while price tests the critical 2,170 liquidity shelf. 💡 If buyers fail to absorb supply here, the door swings wide open for a sweep down into the 1,832 to 2,069 target pocket.
💬 Are you bidding this relief bounce or waiting for capitulation under 2,000? 👇
⚠️ Not financial advice. Always manage your risk. 🛡️
🏷️ #ETH #Ethereum #CryptoTrading #ElliottWave
🎯 🦈
🚨 $ETH AGGRESSIVE THIRD WAVE BREAKDOWN UNLOCKS TARGETS TOWARD 1,832 📉
Entry: 2,240 ⚡
Target: 1,832 🎯
Sellers have seized complete control as $ETH slices through local structure, tracking an aggressive Elliott Wave C extension after dropping 20% from the September peak. 📊 Momentum oscillators are buried deep in bear territory, with Bull/Bear Power collapsing to -187.7 and daily RSI sliding under 30.
The line in the sand sits at 2,292, keeping the intermediate trend firmly suppressed while price tests the critical 2,170 liquidity shelf. 💡 If buyers fail to absorb supply here, the door swings wide open for a sweep down into the 1,832 to 2,069 target pocket.
💬 Are you bidding this relief bounce or waiting for capitulation under 2,000? 👇
⚠️ Not financial advice. Always manage your risk. 🛡️
🏷️ #ETH #Ethereum #CryptoTrading #ElliottWave
🎯 🦈
Entry: 2,240 ⚡
Target: 1,832 🎯
Sellers have seized complete control as $ETH slices through local structure, tracking an aggressive Elliott Wave C extension after dropping 20% from the September peak. 📊 Momentum oscillators are buried deep in bear territory, with Bull/Bear Power collapsing to -187.7 and daily RSI sliding under 30.
The line in the sand sits at 2,292, keeping the intermediate trend firmly suppressed while price tests the critical 2,170 liquidity shelf. 💡 If buyers fail to absorb supply here, the door swings wide open for a sweep down into the 1,832 to 2,069 target pocket.
💬 Are you bidding this relief bounce or waiting for capitulation under 2,000? 👇
⚠️ Not financial advice. Always manage your risk. 🛡️
🏷️ #ETH #Ethereum #CryptoTrading #ElliottWave
🎯 🦈
8


𝐒𝐓𝐎𝐏..... 𝐒𝐓𝐎𝐏..... 𝐒𝐓𝐎𝐏 🚨
$BTC THE NEXT LEG UP COULD BE CLOSER THAN YOU THINK! 💹
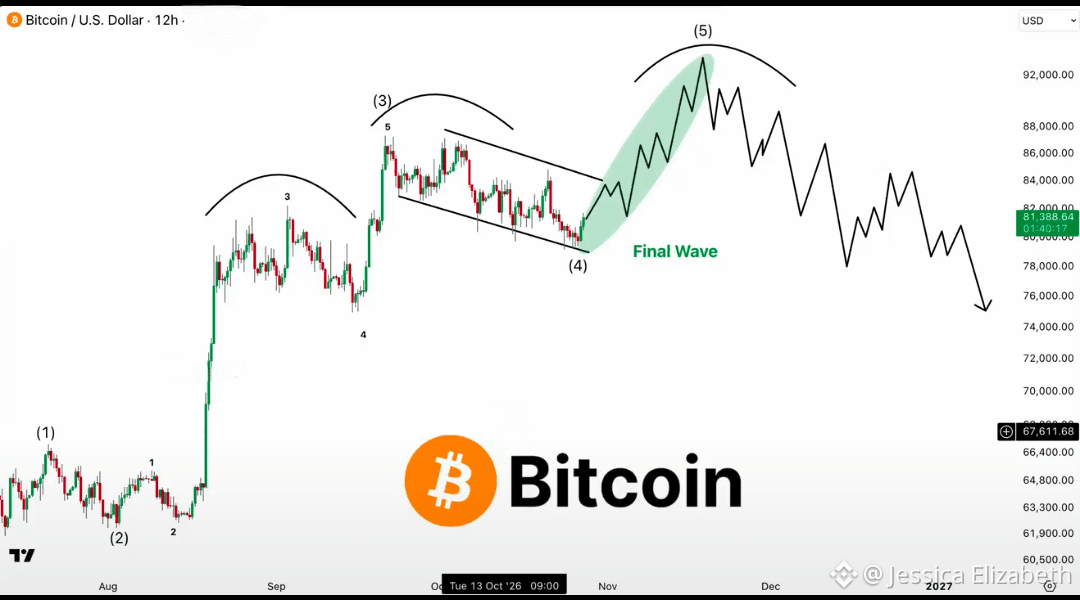
Bitcoin’s current consolidation could be forming Wave 4 before one final impulsive move higher.
If this Elliott Wave structure plays out, Wave 5 could be the next major move to watch. 👀
🔥 My upside roadmap:
🎯 $85K → $90K → $93K
But there’s one important condition: BTC must break out of the descending channel and show clear buying strength.
Until that breakout happens, this remains an alternative bullish scenario — not a confirmed move.
No breakout, no confirmation. Patience over FOMO. 🧠
I’ll keep watching the price action and update you when the structure changes.
FOLLOW + TURN ON NOTIFICATIONS! 🔔
#BTC #Bitcoin #CryptoMarket #CryptoTrading #ElliottWave #FOMCWatch #EarningsSeason
𝐒𝐓𝐎𝐏..... 𝐒𝐓𝐎𝐏..... 𝐒𝐓𝐎𝐏 🚨
$BTC THE NEXT LEG UP COULD BE CLOSER THAN YOU THINK! 💹
Bitcoin’s current consolidation could be forming Wave 4 before one final impulsive move higher.
If this Elliott Wave structure plays out, Wave 5 could be the next major move to watch. 👀
🔥 My upside roadmap:
🎯 $85K → $90K → $93K
But there’s one important condition: BTC must break out of the descending channel and show clear buying strength.
Until that breakout happens, this remains an alternative bullish scenario — not a confirmed move.
No breakout, no confirmation. Patience over FOMO. 🧠
I’ll keep watching the price action and update you when the structure changes.
FOLLOW + TURN ON NOTIFICATIONS! 🔔
#BTC #Bitcoin #CryptoMarket #CryptoTrading #ElliottWave #FOMCWatch #EarningsSeason
$BTC THE NEXT LEG UP COULD BE CLOSER THAN YOU THINK! 💹
Bitcoin’s current consolidation could be forming Wave 4 before one final impulsive move higher.
If this Elliott Wave structure plays out, Wave 5 could be the next major move to watch. 👀
🔥 My upside roadmap:
🎯 $85K → $90K → $93K
But there’s one important condition: BTC must break out of the descending channel and show clear buying strength.
Until that breakout happens, this remains an alternative bullish scenario — not a confirmed move.
No breakout, no confirmation. Patience over FOMO. 🧠
I’ll keep watching the price action and update you when the structure changes.
FOLLOW + TURN ON NOTIFICATIONS! 🔔
#BTC #Bitcoin #CryptoMarket #CryptoTrading #ElliottWave #FOMCWatch #EarningsSeason
3
2
2.3k

·
--
🚀 $XRP ELLIOTT WAVE BULL RUN MAY UNLOCK $3 TARGET! 📈
📊 XRP is perched around $1.33, flirting with the 50‑61.8% Fib zone (≈$1.25‑$1.30). If that band holds, the Wave 2 bottom stays alive and the bullish count stays in play. 🔍 A decisive break above $1.50, then the cluster high at $1.60‑$1.65, would flip the narrative from “correction” to “impulse” in seconds.
⚡ From there the five‑wave script points to a Wave 3 surge toward $2.60‑$2.70, a pullback around $2.15, and a final push to the $3‑plus horizon. The structure is disciplined, not hype‑driven. 💬 Will you stack bids as XRP eyes the $1.65 breakout? 👇
⚠️ Not financial advice. Always manage your risk. 🛡️
🏷️ #XRP #ElliottWave #BullishSetup #Crypto
🔥 💎
🚀 $XRP ELLIOTT WAVE BULL RUN MAY UNLOCK $3 TARGET! 📈
📊 XRP is perched around $1.33, flirting with the 50‑61.8% Fib zone (≈$1.25‑$1.30). If that band holds, the Wave 2 bottom stays alive and the bullish count stays in play. 🔍 A decisive break above $1.50, then the cluster high at $1.60‑$1.65, would flip the narrative from “correction” to “impulse” in seconds.
⚡ From there the five‑wave script points to a Wave 3 surge toward $2.60‑$2.70, a pullback around $2.15, and a final push to the $3‑plus horizon. The structure is disciplined, not hype‑driven. 💬 Will you stack bids as XRP eyes the $1.65 breakout? 👇
⚠️ Not financial advice. Always manage your risk. 🛡️
🏷️ #XRP #ElliottWave #BullishSetup #Crypto
🔥 💎
📊 XRP is perched around $1.33, flirting with the 50‑61.8% Fib zone (≈$1.25‑$1.30). If that band holds, the Wave 2 bottom stays alive and the bullish count stays in play. 🔍 A decisive break above $1.50, then the cluster high at $1.60‑$1.65, would flip the narrative from “correction” to “impulse” in seconds.
⚡ From there the five‑wave script points to a Wave 3 surge toward $2.60‑$2.70, a pullback around $2.15, and a final push to the $3‑plus horizon. The structure is disciplined, not hype‑driven. 💬 Will you stack bids as XRP eyes the $1.65 breakout? 👇
⚠️ Not financial advice. Always manage your risk. 🛡️
🏷️ #XRP #ElliottWave #BullishSetup #Crypto
🔥 💎
23

·
--
🚨 $XRP ELLIOTT WAVE BOTTOM TEST MAY UNLOCK $3 PLAY 🦈
Entry: 1.33 ⚡
Target: 1.60 🚀
Stop Loss: 1.25 ⚠️
XForceGlobal’s Elliott Wave count spots a potential Wave 2 bottom in the 1.25‑1.30 Fibonacci zone, keeping the bullish narrative alive. 📊 The price hovering near $1.33 respects that retracement, hinting that the corrective leg may be ending.
A clean break above the 1.60‑1.65 cluster would ignite Wave 3, targeting the 2.60‑2.70 corridor and eventually the $3 horizon. ⚡ Institutional liquidity pools often defend these pivot zones, so a decisive push could trigger a smart‑money surge. 🌊
💬 Do you see the next impulse forming now or waiting for a stronger breakout? 👇
⚠️ Not financial advice. Always manage your risk. 🛡️
🏷️ #XRP #LongSetup #ElliottWave #Crypto
🔥 💎
🚨 $XRP ELLIOTT WAVE BOTTOM TEST MAY UNLOCK $3 PLAY 🦈
Entry: 1.33 ⚡
Target: 1.60 🚀
Stop Loss: 1.25 ⚠️
XForceGlobal’s Elliott Wave count spots a potential Wave 2 bottom in the 1.25‑1.30 Fibonacci zone, keeping the bullish narrative alive. 📊 The price hovering near $1.33 respects that retracement, hinting that the corrective leg may be ending.
A clean break above the 1.60‑1.65 cluster would ignite Wave 3, targeting the 2.60‑2.70 corridor and eventually the $3 horizon. ⚡ Institutional liquidity pools often defend these pivot zones, so a decisive push could trigger a smart‑money surge. 🌊
💬 Do you see the next impulse forming now or waiting for a stronger breakout? 👇
⚠️ Not financial advice. Always manage your risk. 🛡️
🏷️ #XRP #LongSetup #ElliottWave #Crypto
🔥 💎
Entry: 1.33 ⚡
Target: 1.60 🚀
Stop Loss: 1.25 ⚠️
XForceGlobal’s Elliott Wave count spots a potential Wave 2 bottom in the 1.25‑1.30 Fibonacci zone, keeping the bullish narrative alive. 📊 The price hovering near $1.33 respects that retracement, hinting that the corrective leg may be ending.
A clean break above the 1.60‑1.65 cluster would ignite Wave 3, targeting the 2.60‑2.70 corridor and eventually the $3 horizon. ⚡ Institutional liquidity pools often defend these pivot zones, so a decisive push could trigger a smart‑money surge. 🌊
💬 Do you see the next impulse forming now or waiting for a stronger breakout? 👇
⚠️ Not financial advice. Always manage your risk. 🛡️
🏷️ #XRP #LongSetup #ElliottWave #Crypto
🔥 💎
9

·
--
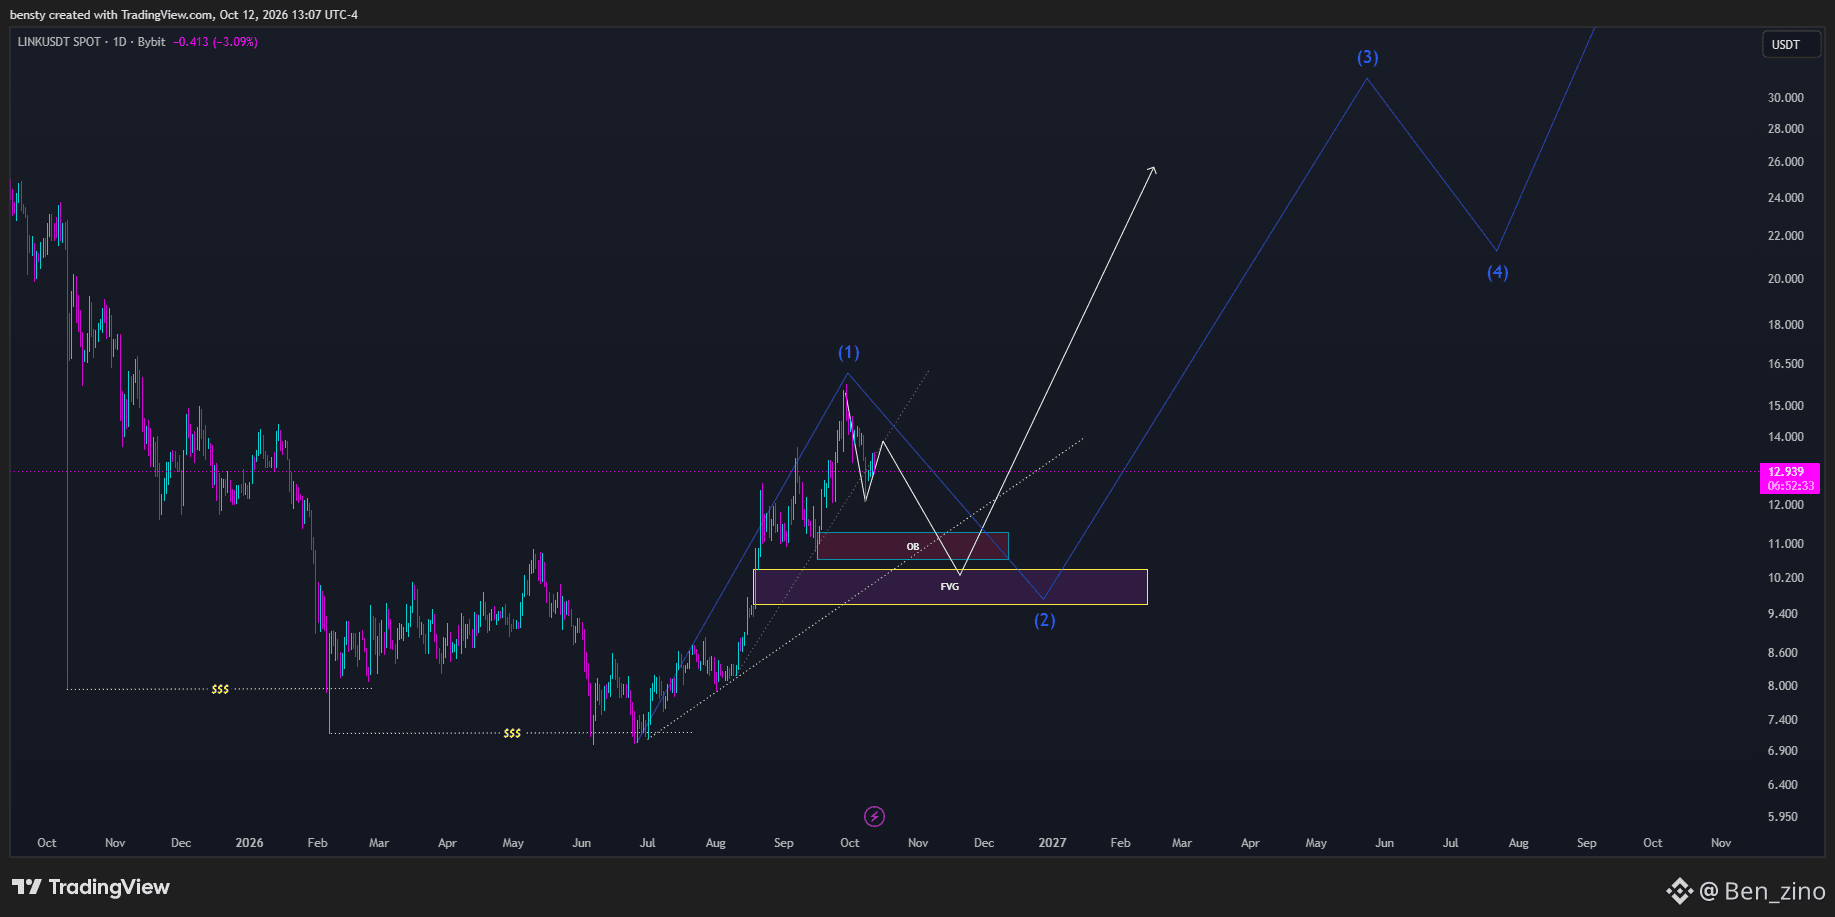
$LINK Wave (2) Retracements Are For Accumulation 📈
Wave (1) is in. Now watching the Wave (2) correction dump into the $9.50 – $11.00 OB/FVG liquidity zone.
Looking for a local bottom here before the impulsive Wave (3) expansion toward $30+.
Patience in the discount zone. What’s your buy level? 👇
#Chainlink #LINK #crypto #Elliottwave
$LINK Wave (2) Retracements Are For Accumulation 📈
Wave (1) is in. Now watching the Wave (2) correction dump into the $9.50 – $11.00 OB/FVG liquidity zone.
Looking for a local bottom here before the impulsive Wave (3) expansion toward $30+.
Patience in the discount zone. What’s your buy level? 👇
#Chainlink #LINK #crypto #Elliottwave
Wave (1) is in. Now watching the Wave (2) correction dump into the $9.50 – $11.00 OB/FVG liquidity zone.
Looking for a local bottom here before the impulsive Wave (3) expansion toward $30+.
Patience in the discount zone. What’s your buy level? 👇
#Chainlink #LINK #crypto #Elliottwave
356
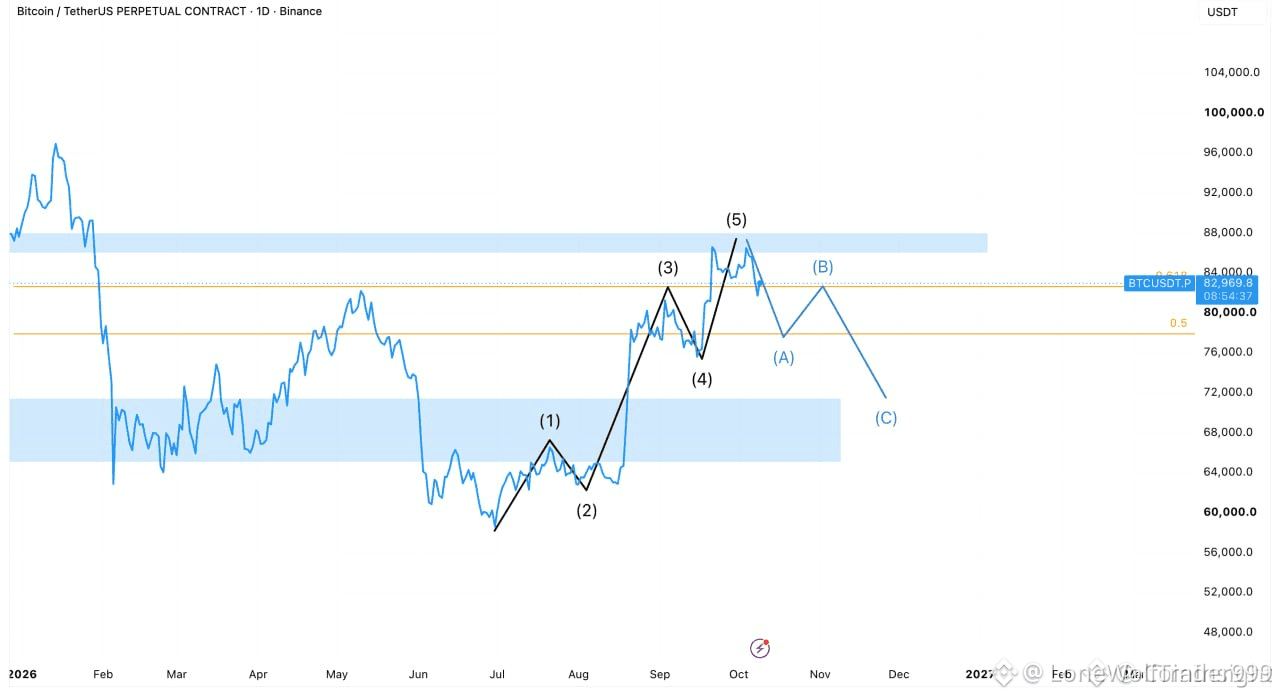
⚡ $BTC ELLIOTT WAVE STRUCTURE SETS UP EXPLOSIVE PUSH TOWARD THE 0.618 FIB! 💥
Target: 78,272 🚀
📌 $BTC is wrapping up its initial impulse and corrective structure, bouncing cleanly off a short-term double bottom. Buyers defended the local low with authority, setting the stage for the next explosive Elliott expansion phase.
📊 Technical momentum points directly to the 0.618 Fibonacci level at 78,272 as order flow shifts back into heavy accumulation. 💡 If wave three unfolds as projected, this impulse will carry the strongest velocity of the entire cycle.
💬 Are you riding this wave up to the golden ratio target or waiting for another dip to load your bids? 👇
⚠️ Not financial advice. Always manage your risk. 🛡️
🏷️ #BTC #ElliottWave #Fibonacci #Crypto
🔥 💎
⚡ $BTC ELLIOTT WAVE STRUCTURE SETS UP EXPLOSIVE PUSH TOWARD THE 0.618 FIB! 💥
Target: 78,272 🚀
📌 $BTC is wrapping up its initial impulse and corrective structure, bouncing cleanly off a short-term double bottom. Buyers defended the local low with authority, setting the stage for the next explosive Elliott expansion phase.
📊 Technical momentum points directly to the 0.618 Fibonacci level at 78,272 as order flow shifts back into heavy accumulation. 💡 If wave three unfolds as projected, this impulse will carry the strongest velocity of the entire cycle.
💬 Are you riding this wave up to the golden ratio target or waiting for another dip to load your bids? 👇
⚠️ Not financial advice. Always manage your risk. 🛡️
🏷️ #BTC #ElliottWave #Fibonacci #Crypto
🔥 💎
Target: 78,272 🚀
📌 $BTC is wrapping up its initial impulse and corrective structure, bouncing cleanly off a short-term double bottom. Buyers defended the local low with authority, setting the stage for the next explosive Elliott expansion phase.
📊 Technical momentum points directly to the 0.618 Fibonacci level at 78,272 as order flow shifts back into heavy accumulation. 💡 If wave three unfolds as projected, this impulse will carry the strongest velocity of the entire cycle.
💬 Are you riding this wave up to the golden ratio target or waiting for another dip to load your bids? 👇
⚠️ Not financial advice. Always manage your risk. 🛡️
🏷️ #BTC #ElliottWave #Fibonacci #Crypto
🔥 💎
29

·
--
Рост
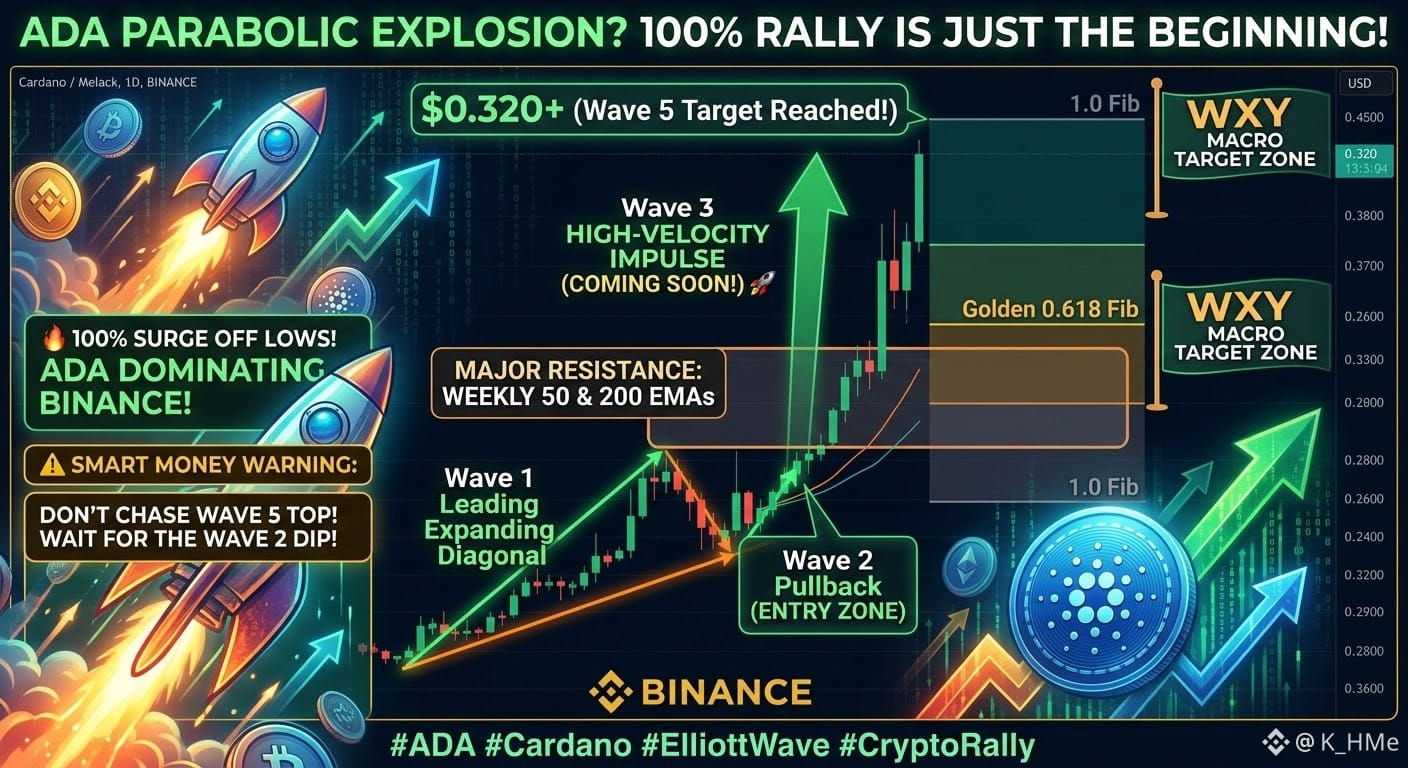
🚨 ADA ON THE VERGE OF A PARABOLIC EXPLOSION? 100% RALLY IS JUST THE BEGINNING! 🔥📈
$ADA is dominating Binance after a staggering 100% surge off the lows! Technicals point to a 5-wave Leading Expanding Diagonal, with Wave 5 zeroing in on the $0.32+ resistance zone—a key test at the Weekly 50 & 200 EMAs. ⚡
⚠️ Smart Money Warning: Don't chase the Wave 5 top! The highest-reward play lies in the upcoming Wave 2 pullback, setting the stage for a massive, high-velocity Wave 3 impulse. 🚀
On the macro level, a WXY structure is unfolding, targeting the golden 0.618–1.0 Fibonacci zone. 🟢
#Cardano #ADA #Binance #CryptoRally #ElliottWave
{spot}(ADAUSDT)
🚨 ADA ON THE VERGE OF A PARABOLIC EXPLOSION? 100% RALLY IS JUST THE BEGINNING! 🔥📈
$ADA is dominating Binance after a staggering 100% surge off the lows! Technicals point to a 5-wave Leading Expanding Diagonal, with Wave 5 zeroing in on the $0.32+ resistance zone—a key test at the Weekly 50 & 200 EMAs. ⚡
⚠️ Smart Money Warning: Don't chase the Wave 5 top! The highest-reward play lies in the upcoming Wave 2 pullback, setting the stage for a massive, high-velocity Wave 3 impulse. 🚀
On the macro level, a WXY structure is unfolding, targeting the golden 0.618–1.0 Fibonacci zone. 🟢
#Cardano #ADA #Binance #CryptoRally #ElliottWave
$ADA is dominating Binance after a staggering 100% surge off the lows! Technicals point to a 5-wave Leading Expanding Diagonal, with Wave 5 zeroing in on the $0.32+ resistance zone—a key test at the Weekly 50 & 200 EMAs. ⚡
⚠️ Smart Money Warning: Don't chase the Wave 5 top! The highest-reward play lies in the upcoming Wave 2 pullback, setting the stage for a massive, high-velocity Wave 3 impulse. 🚀
On the macro level, a WXY structure is unfolding, targeting the golden 0.618–1.0 Fibonacci zone. 🟢
#Cardano #ADA #Binance #CryptoRally #ElliottWave
84

·
--
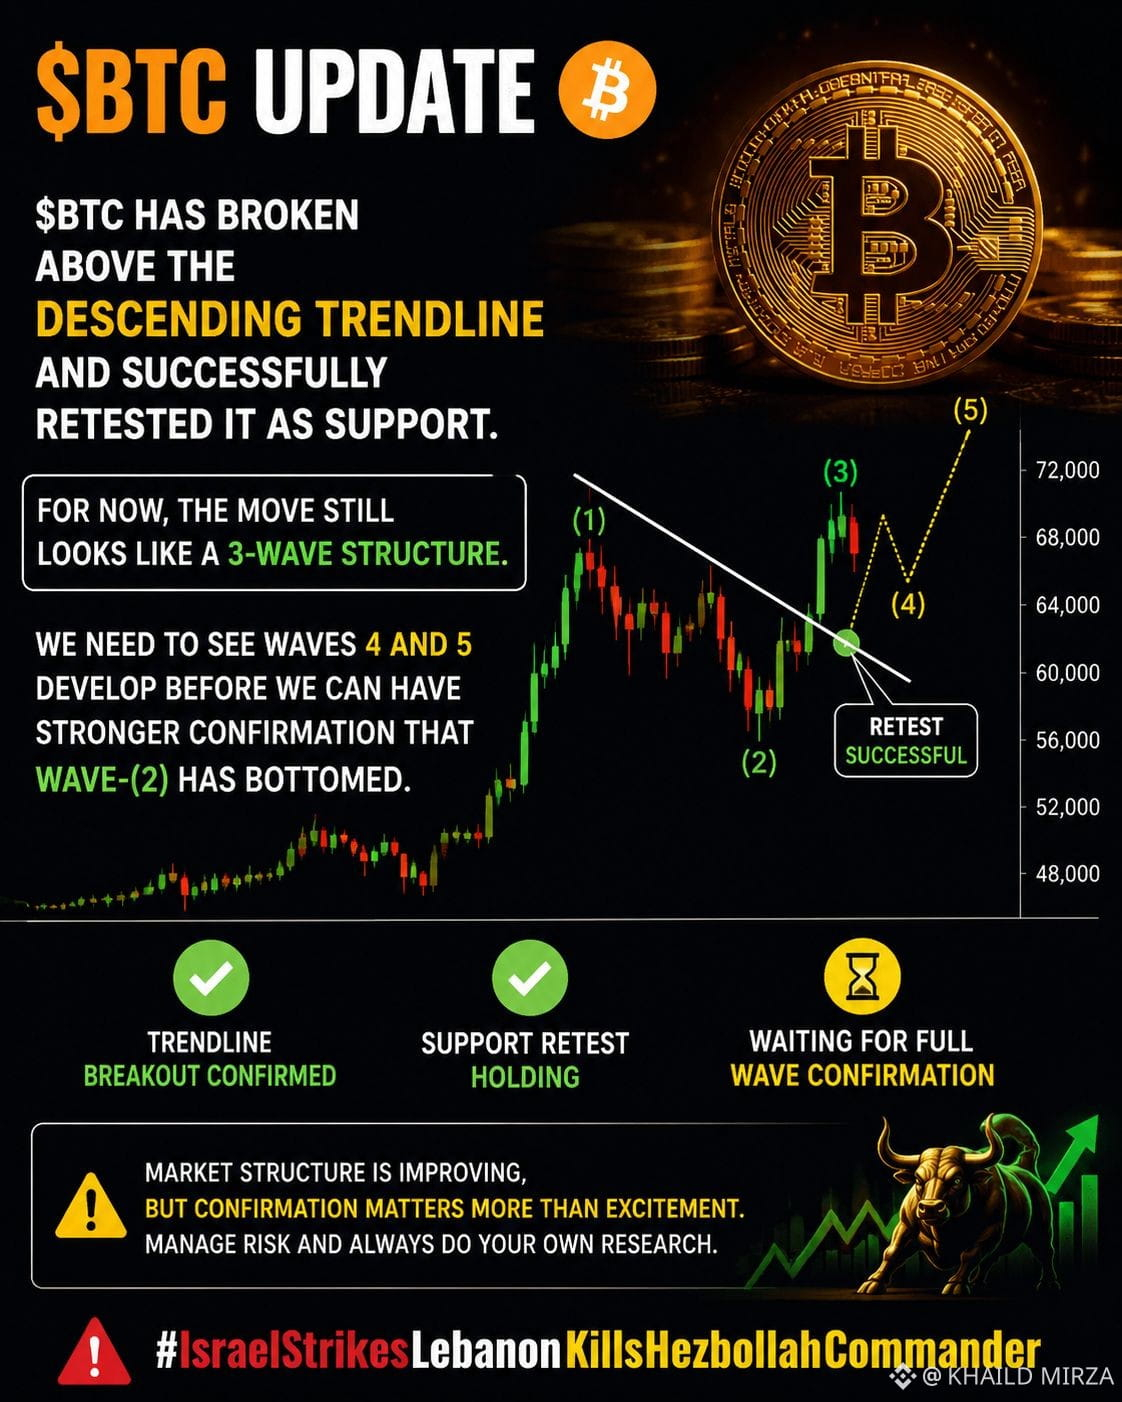
🚨 $BTC UPDATE 🚨
Bitcoin has successfully broken above the descending t and, more importantly, the retest has held as support. This is a positive sign for short-term momentum. 📈
However, the current move still appears to be developing as a 3-wave structure. We need to see Wave 4 and Wave 5 complete before getting stronger confirmation that Wave (2) has officially bottomed.
The key now is patience: ✅ breakout confirmed
✅ Support retest holding
⏳ Waiting for full wave confirmation
Market structure is improving, but confirmation matters more than excitement. Manage risk and always do your own research.
#BTC #Bitcoin #Crypto #Trading #ElliottWave
{spot}(BTCUSDT)
🚨 $BTC UPDATE 🚨
Bitcoin has successfully broken above the descending t and, more importantly, the retest has held as support. This is a positive sign for short-term momentum. 📈
However, the current move still appears to be developing as a 3-wave structure. We need to see Wave 4 and Wave 5 complete before getting stronger confirmation that Wave (2) has officially bottomed.
The key now is patience: ✅ breakout confirmed
✅ Support retest holding
⏳ Waiting for full wave confirmation
Market structure is improving, but confirmation matters more than excitement. Manage risk and always do your own research.
#BTC #Bitcoin #Crypto #Trading #ElliottWave
Bitcoin has successfully broken above the descending t and, more importantly, the retest has held as support. This is a positive sign for short-term momentum. 📈
However, the current move still appears to be developing as a 3-wave structure. We need to see Wave 4 and Wave 5 complete before getting stronger confirmation that Wave (2) has officially bottomed.
The key now is patience: ✅ breakout confirmed
✅ Support retest holding
⏳ Waiting for full wave confirmation
Market structure is improving, but confirmation matters more than excitement. Manage risk and always do your own research.
#BTC #Bitcoin #Crypto #Trading #ElliottWave
82

·
--
everyone thinks wave 4 pullback levels are set in stone from the start, but actually when wave 3 overextends, your entire invalidation zone shifts higher.
most traders keep their limit bids sitting at the old fib levels and end up completely front-run, or worse, they panic short thinking the trend broke. ngl getting chopped up because of stale pivot levels is the easiest way to bleed your stack.
we saw this exact setup play out on $BTC during the recent impulse. wave 3 pushed way past the standard 1.618 extension target, which automatically dragged the valid wave 4 support band several hundred dollars above where most people were waiting.
if you are still expecting a deep discount down to previous structural support on $ETH and the majors, you are likely trading yesterday's chart. extended third waves typically resolve into shallow, frustrating wave 4 consolidations that trap impatient capital on the sidelines.
where do you think this wave 4 bottom actually lands?
#CryptoTrading #ElliottWave #Bitcoin
everyone thinks wave 4 pullback levels are set in stone from the start, but actually when wave 3 overextends, your entire invalidation zone shifts higher.
most traders keep their limit bids sitting at the old fib levels and end up completely front-run, or worse, they panic short thinking the trend broke. ngl getting chopped up because of stale pivot levels is the easiest way to bleed your stack.
we saw this exact setup play out on $BTC during the recent impulse. wave 3 pushed way past the standard 1.618 extension target, which automatically dragged the valid wave 4 support band several hundred dollars above where most people were waiting.
if you are still expecting a deep discount down to previous structural support on $ETH and the majors, you are likely trading yesterday's chart. extended third waves typically resolve into shallow, frustrating wave 4 consolidations that trap impatient capital on the sidelines.
where do you think this wave 4 bottom actually lands?
#CryptoTrading #ElliottWave #Bitcoin
most traders keep their limit bids sitting at the old fib levels and end up completely front-run, or worse, they panic short thinking the trend broke. ngl getting chopped up because of stale pivot levels is the easiest way to bleed your stack.
we saw this exact setup play out on $BTC during the recent impulse. wave 3 pushed way past the standard 1.618 extension target, which automatically dragged the valid wave 4 support band several hundred dollars above where most people were waiting.
if you are still expecting a deep discount down to previous structural support on $ETH and the majors, you are likely trading yesterday's chart. extended third waves typically resolve into shallow, frustrating wave 4 consolidations that trap impatient capital on the sidelines.
where do you think this wave 4 bottom actually lands?
#CryptoTrading #ElliottWave #Bitcoin
34

A longer Wave 3 doesn't give you a safer Wave 4. It actually drops the danger zone lower and leaves more people holding bags they never planned for.
You've been staring at the same Fibonacci levels for days waiting to buy the dip. Then Wave 3 keeps running, the correction hits harder than your chart showed, and you're either stopped out early or sitting underwater while the real support is still lower.
When Wave 3 stretches past the typical 1.618 extension of Wave 1, the Wave 4 retracement almost never respects the original 38.2% level. Price usually hunts the 50% or 61.8% of the entire third wave, or it tags the previous fourth wave of lesser degree. I watched $BTC do this when the extra push in Wave 3 moved expected Wave 4 support from the 92k area down toward 84-86k. The same shift showed up on $ETH, where the deeper run forced a bigger pullback than most traders had marked. $SOL followed the identical pattern and flushed anyone still using the old zones.
If you don't redraw those levels after the extension, you're buying into a liquidity grab instead of a genuine Wave 4 bottom. That's how accounts get chopped during these corrections.
Where do you think the new Wave 4 support sits after this latest extension?
#ElliottWave #CryptoTrading #TechnicalAnalysis
A longer Wave 3 doesn't give you a safer Wave 4. It actually drops the danger zone lower and leaves more people holding bags they never planned for.
You've been staring at the same Fibonacci levels for days waiting to buy the dip. Then Wave 3 keeps running, the correction hits harder than your chart showed, and you're either stopped out early or sitting underwater while the real support is still lower.
When Wave 3 stretches past the typical 1.618 extension of Wave 1, the Wave 4 retracement almost never respects the original 38.2% level. Price usually hunts the 50% or 61.8% of the entire third wave, or it tags the previous fourth wave of lesser degree. I watched $BTC do this when the extra push in Wave 3 moved expected Wave 4 support from the 92k area down toward 84-86k. The same shift showed up on $ETH , where the deeper run forced a bigger pullback than most traders had marked. $SOL followed the identical pattern and flushed anyone still using the old zones.
If you don't redraw those levels after the extension, you're buying into a liquidity grab instead of a genuine Wave 4 bottom. That's how accounts get chopped during these corrections.
Where do you think the new Wave 4 support sits after this latest extension?
#ElliottWave #CryptoTrading #TechnicalAnalysis
You've been staring at the same Fibonacci levels for days waiting to buy the dip. Then Wave 3 keeps running, the correction hits harder than your chart showed, and you're either stopped out early or sitting underwater while the real support is still lower.
When Wave 3 stretches past the typical 1.618 extension of Wave 1, the Wave 4 retracement almost never respects the original 38.2% level. Price usually hunts the 50% or 61.8% of the entire third wave, or it tags the previous fourth wave of lesser degree. I watched $BTC do this when the extra push in Wave 3 moved expected Wave 4 support from the 92k area down toward 84-86k. The same shift showed up on $ETH , where the deeper run forced a bigger pullback than most traders had marked. $SOL followed the identical pattern and flushed anyone still using the old zones.
If you don't redraw those levels after the extension, you're buying into a liquidity grab instead of a genuine Wave 4 bottom. That's how accounts get chopped during these corrections.
Where do you think the new Wave 4 support sits after this latest extension?
#ElliottWave #CryptoTrading #TechnicalAnalysis
42
·
--
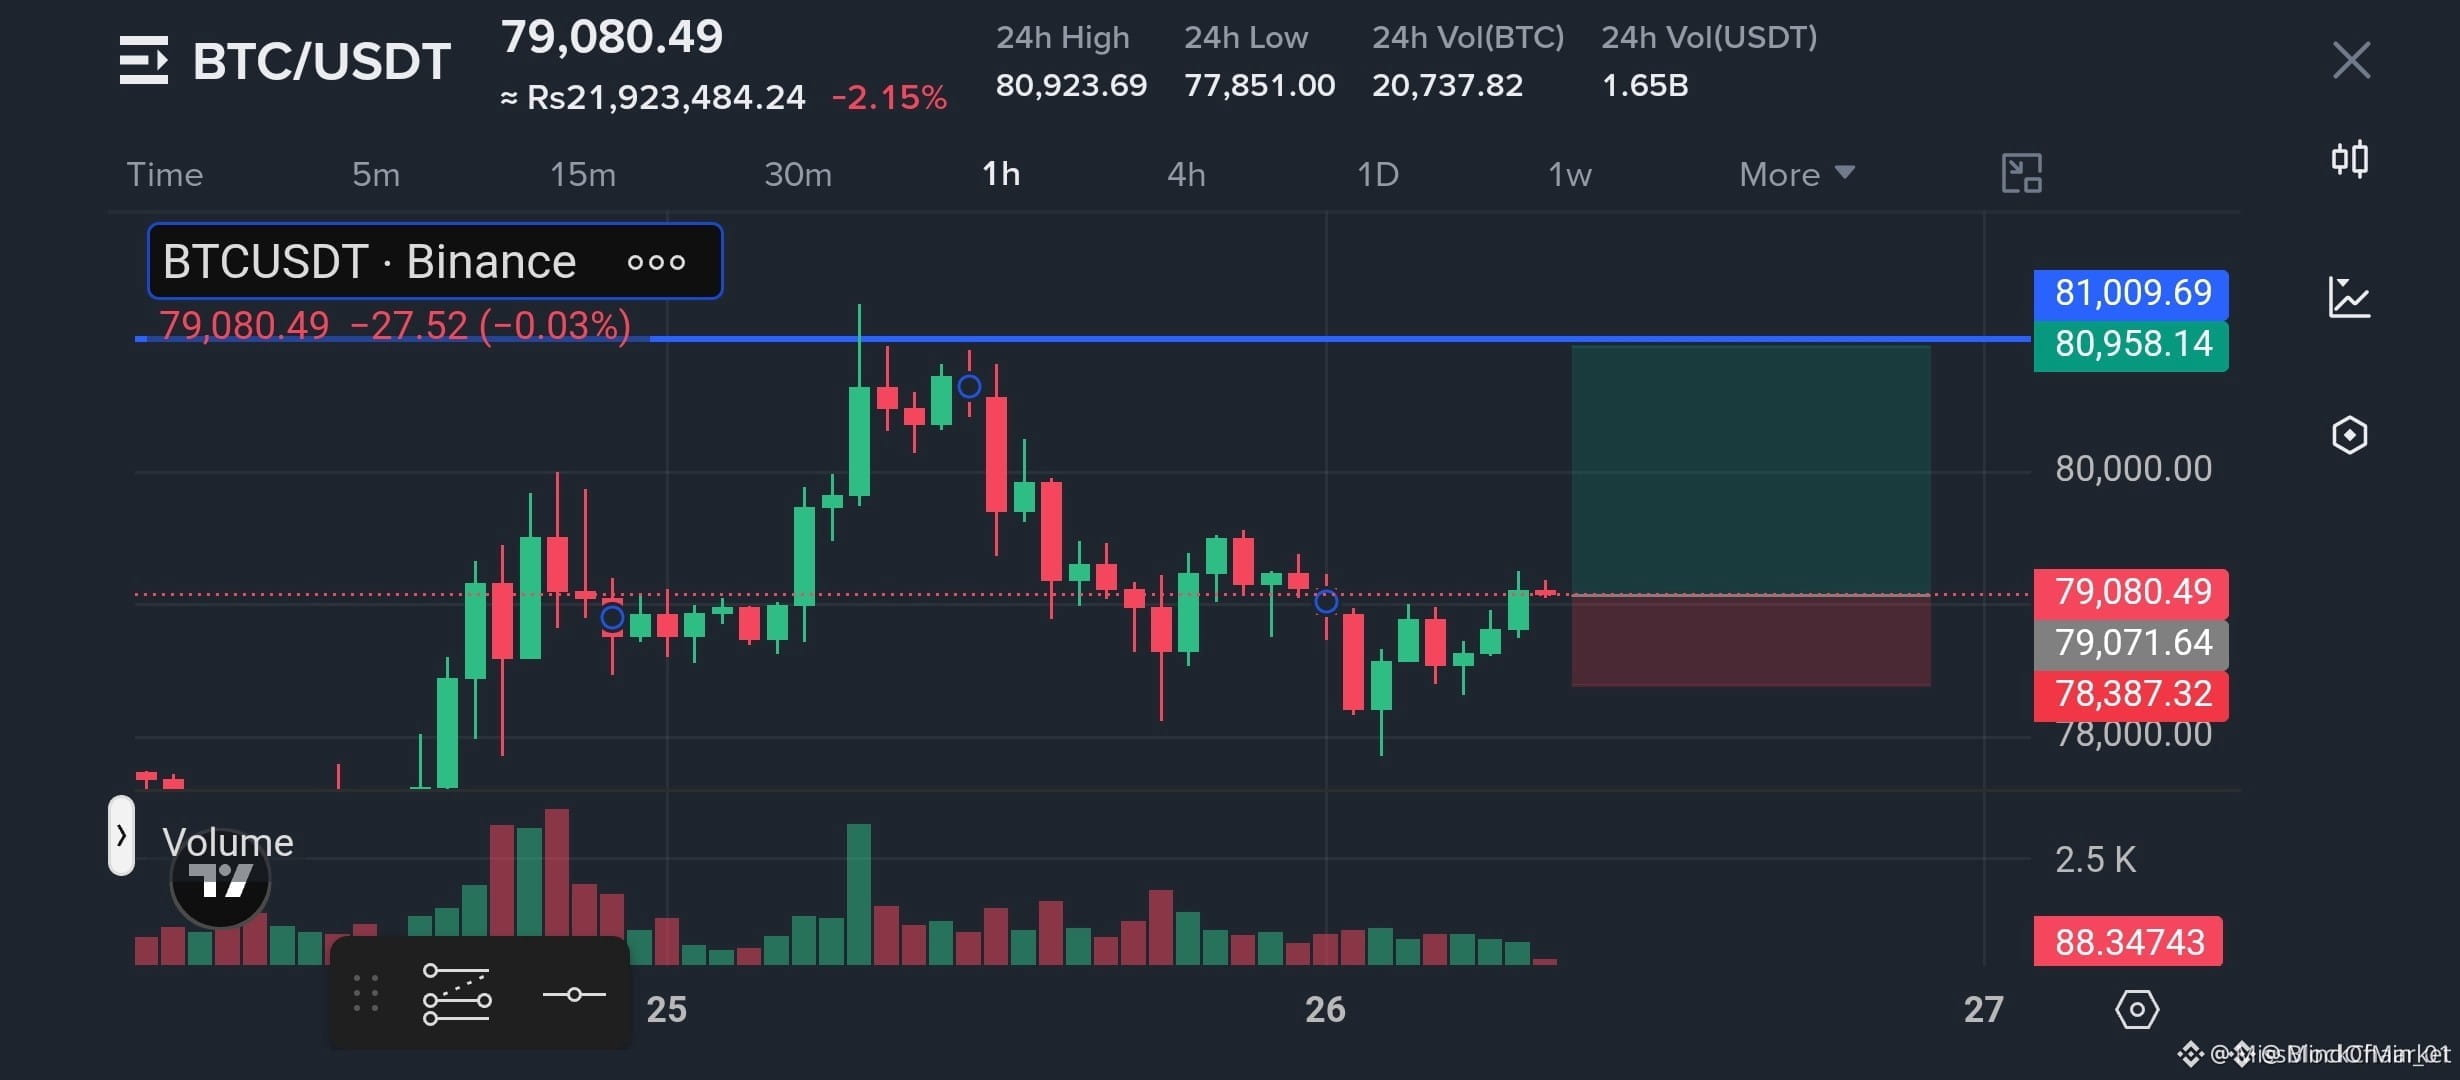
🚨 $BTC COMPLETES WAVE FOUR RE-ACCUMULATION BEFORE POTENTIAL WAVE FIVE EXPANSION ⚡
Entry: 79,000 - 79,100 ⚡
Target: 80,000 - 82,500 🚀
Stop Loss: 77,500 ⚠️
Price action on the 1H timeframe reveals smart money successfully defended the structural floor at 77.8K. 📌 Order flow is shifting back into buyer control as market structure aligns for a potential Wave (5) impulse run. 📊
Displacement above the 79.5K to 80K zone confirms structural momentum, clearing path toward liquidity up to 82.5K. 💡 A clean break below 77.5K invalidates this count, providing a defined risk boundary. 💬 Are you building positions on this retest or waiting for 80K confirmation? 👇
⚠️ Not financial advice. Always manage your risk. 🛡️
🏷️ #BTC #LongSetup #Crypto #ElliottWave
🎯 🦈
🚨 $BTC COMPLETES WAVE FOUR RE-ACCUMULATION BEFORE POTENTIAL WAVE FIVE EXPANSION ⚡
Entry: 79,000 - 79,100 ⚡
Target: 80,000 - 82,500 🚀
Stop Loss: 77,500 ⚠️
Price action on the 1H timeframe reveals smart money successfully defended the structural floor at 77.8K. 📌 Order flow is shifting back into buyer control as market structure aligns for a potential Wave (5) impulse run. 📊
Displacement above the 79.5K to 80K zone confirms structural momentum, clearing path toward liquidity up to 82.5K. 💡 A clean break below 77.5K invalidates this count, providing a defined risk boundary. 💬 Are you building positions on this retest or waiting for 80K confirmation? 👇
⚠️ Not financial advice. Always manage your risk. 🛡️
🏷️ #BTC #LongSetup #Crypto #ElliottWave
🎯 🦈
Entry: 79,000 - 79,100 ⚡
Target: 80,000 - 82,500 🚀
Stop Loss: 77,500 ⚠️
Price action on the 1H timeframe reveals smart money successfully defended the structural floor at 77.8K. 📌 Order flow is shifting back into buyer control as market structure aligns for a potential Wave (5) impulse run. 📊
Displacement above the 79.5K to 80K zone confirms structural momentum, clearing path toward liquidity up to 82.5K. 💡 A clean break below 77.5K invalidates this count, providing a defined risk boundary. 💬 Are you building positions on this retest or waiting for 80K confirmation? 👇
⚠️ Not financial advice. Always manage your risk. 🛡️
🏷️ #BTC #LongSetup #Crypto #ElliottWave
🎯 🦈
36

الثيران بيتخانقوا مع الدببة كل يوم…
بس مين اللي ماسك الخيوط؟
لما السعر يكسر قمة، الكل يقول "طالع".
ولما يكسر قاع، الكل يقول "نازل".
وفي الحالتين، ناس كتير بتدخل وتخرج في أسوأ مكان.
إليوت قال من حوالي 90 سنة إن السوق بيتحرك بنفسية الجمهور.
الموجات مش بتحكي السعر بس… بتحكي إحنا حاسين بإيه.
في رأيك مين ماسك الخيوط؟
1 الحيتان
2 الفيدرالي والأخبار
3 نفسية الجمهور
اكتب الرقم بس في الكومنت 👇
#ElliottWave #Bitcoin
⚠️ رأي تعليمي، مش نصيحة مالية.
الثيران بيتخانقوا مع الدببة كل يوم…
بس مين اللي ماسك الخيوط؟
لما السعر يكسر قمة، الكل يقول "طالع".
ولما يكسر قاع، الكل يقول "نازل".
وفي الحالتين، ناس كتير بتدخل وتخرج في أسوأ مكان.
إليوت قال من حوالي 90 سنة إن السوق بيتحرك بنفسية الجمهور.
الموجات مش بتحكي السعر بس… بتحكي إحنا حاسين بإيه.
في رأيك مين ماسك الخيوط؟
1 الحيتان
2 الفيدرالي والأخبار
3 نفسية الجمهور
اكتب الرقم بس في الكومنت 👇
#ElliottWave #Bitcoin
⚠️ رأي تعليمي، مش نصيحة مالية.
بس مين اللي ماسك الخيوط؟
لما السعر يكسر قمة، الكل يقول "طالع".
ولما يكسر قاع، الكل يقول "نازل".
وفي الحالتين، ناس كتير بتدخل وتخرج في أسوأ مكان.
إليوت قال من حوالي 90 سنة إن السوق بيتحرك بنفسية الجمهور.
الموجات مش بتحكي السعر بس… بتحكي إحنا حاسين بإيه.
في رأيك مين ماسك الخيوط؟
1 الحيتان
2 الفيدرالي والأخبار
3 نفسية الجمهور
اكتب الرقم بس في الكومنت 👇
#ElliottWave #Bitcoin
⚠️ رأي تعليمي، مش نصيحة مالية.

88

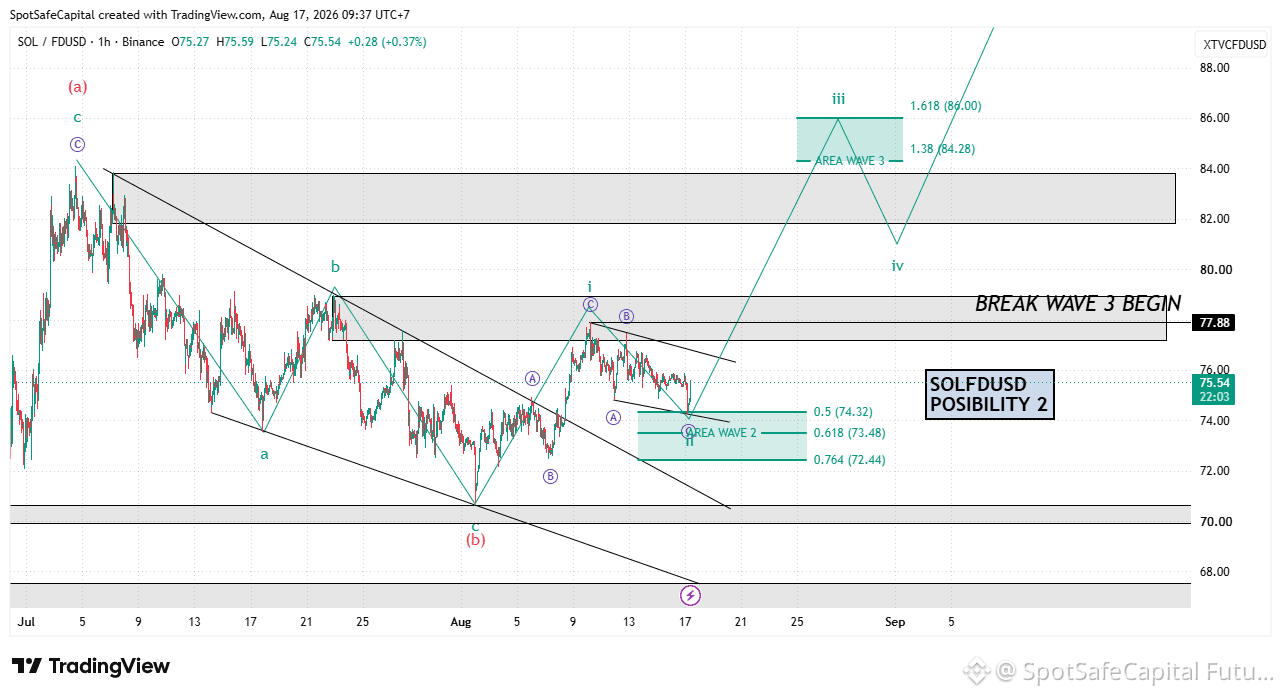
$SOL Elliott Wave Update — Possibility 2
{spot}(SOLUSDT)
I’m currently maintaining Possibility 2 for SOL.
The current structure suggests that Green Wave 2 is still developing after Green Wave 1 completed around the $78.5 area.
📌 Wave 2 Area
• 0.5 → $74.32
• 0.618 → $73.48
• 0.764 → $72.44
I’m watching this zone for a potential Wave 2 bottom.
If Wave 2 completes here, the next move I’m looking for is Green Wave 3, with an initial target area around $84.28–$86.00.
The key confirmation level is the $77.88–$79.00 resistance zone.
A clean break above this area would increase the probability that Wave 3 has begun.
⚠️ If SOL breaks below the major support around $70.7, this bullish count would need to be reconsidered.
For now, I’m staying with Possibility 2 and waiting for confirmation.
#sol #solana #Elliottwave #cryptotrading
$SOL Elliott Wave Update — Possibility 2
I’m currently maintaining Possibility 2 for SOL.
The current structure suggests that Green Wave 2 is still developing after Green Wave 1 completed around the $78.5 area.
📌 Wave 2 Area
• 0.5 → $74.32
• 0.618 → $73.48
• 0.764 → $72.44
I’m watching this zone for a potential Wave 2 bottom.
If Wave 2 completes here, the next move I’m looking for is Green Wave 3, with an initial target area around $84.28–$86.00.
The key confirmation level is the $77.88–$79.00 resistance zone.
A clean break above this area would increase the probability that Wave 3 has begun.
⚠️ If SOL breaks below the major support around $70.7, this bullish count would need to be reconsidered.
For now, I’m staying with Possibility 2 and waiting for confirmation.
#sol #solana #Elliottwave #cryptotrading
I’m currently maintaining Possibility 2 for SOL.
The current structure suggests that Green Wave 2 is still developing after Green Wave 1 completed around the $78.5 area.
📌 Wave 2 Area
• 0.5 → $74.32
• 0.618 → $73.48
• 0.764 → $72.44
I’m watching this zone for a potential Wave 2 bottom.
If Wave 2 completes here, the next move I’m looking for is Green Wave 3, with an initial target area around $84.28–$86.00.
The key confirmation level is the $77.88–$79.00 resistance zone.
A clean break above this area would increase the probability that Wave 3 has begun.
⚠️ If SOL breaks below the major support around $70.7, this bullish count would need to be reconsidered.
For now, I’m staying with Possibility 2 and waiting for confirmation.
#sol #solana #Elliottwave #cryptotrading
1
308

·
--
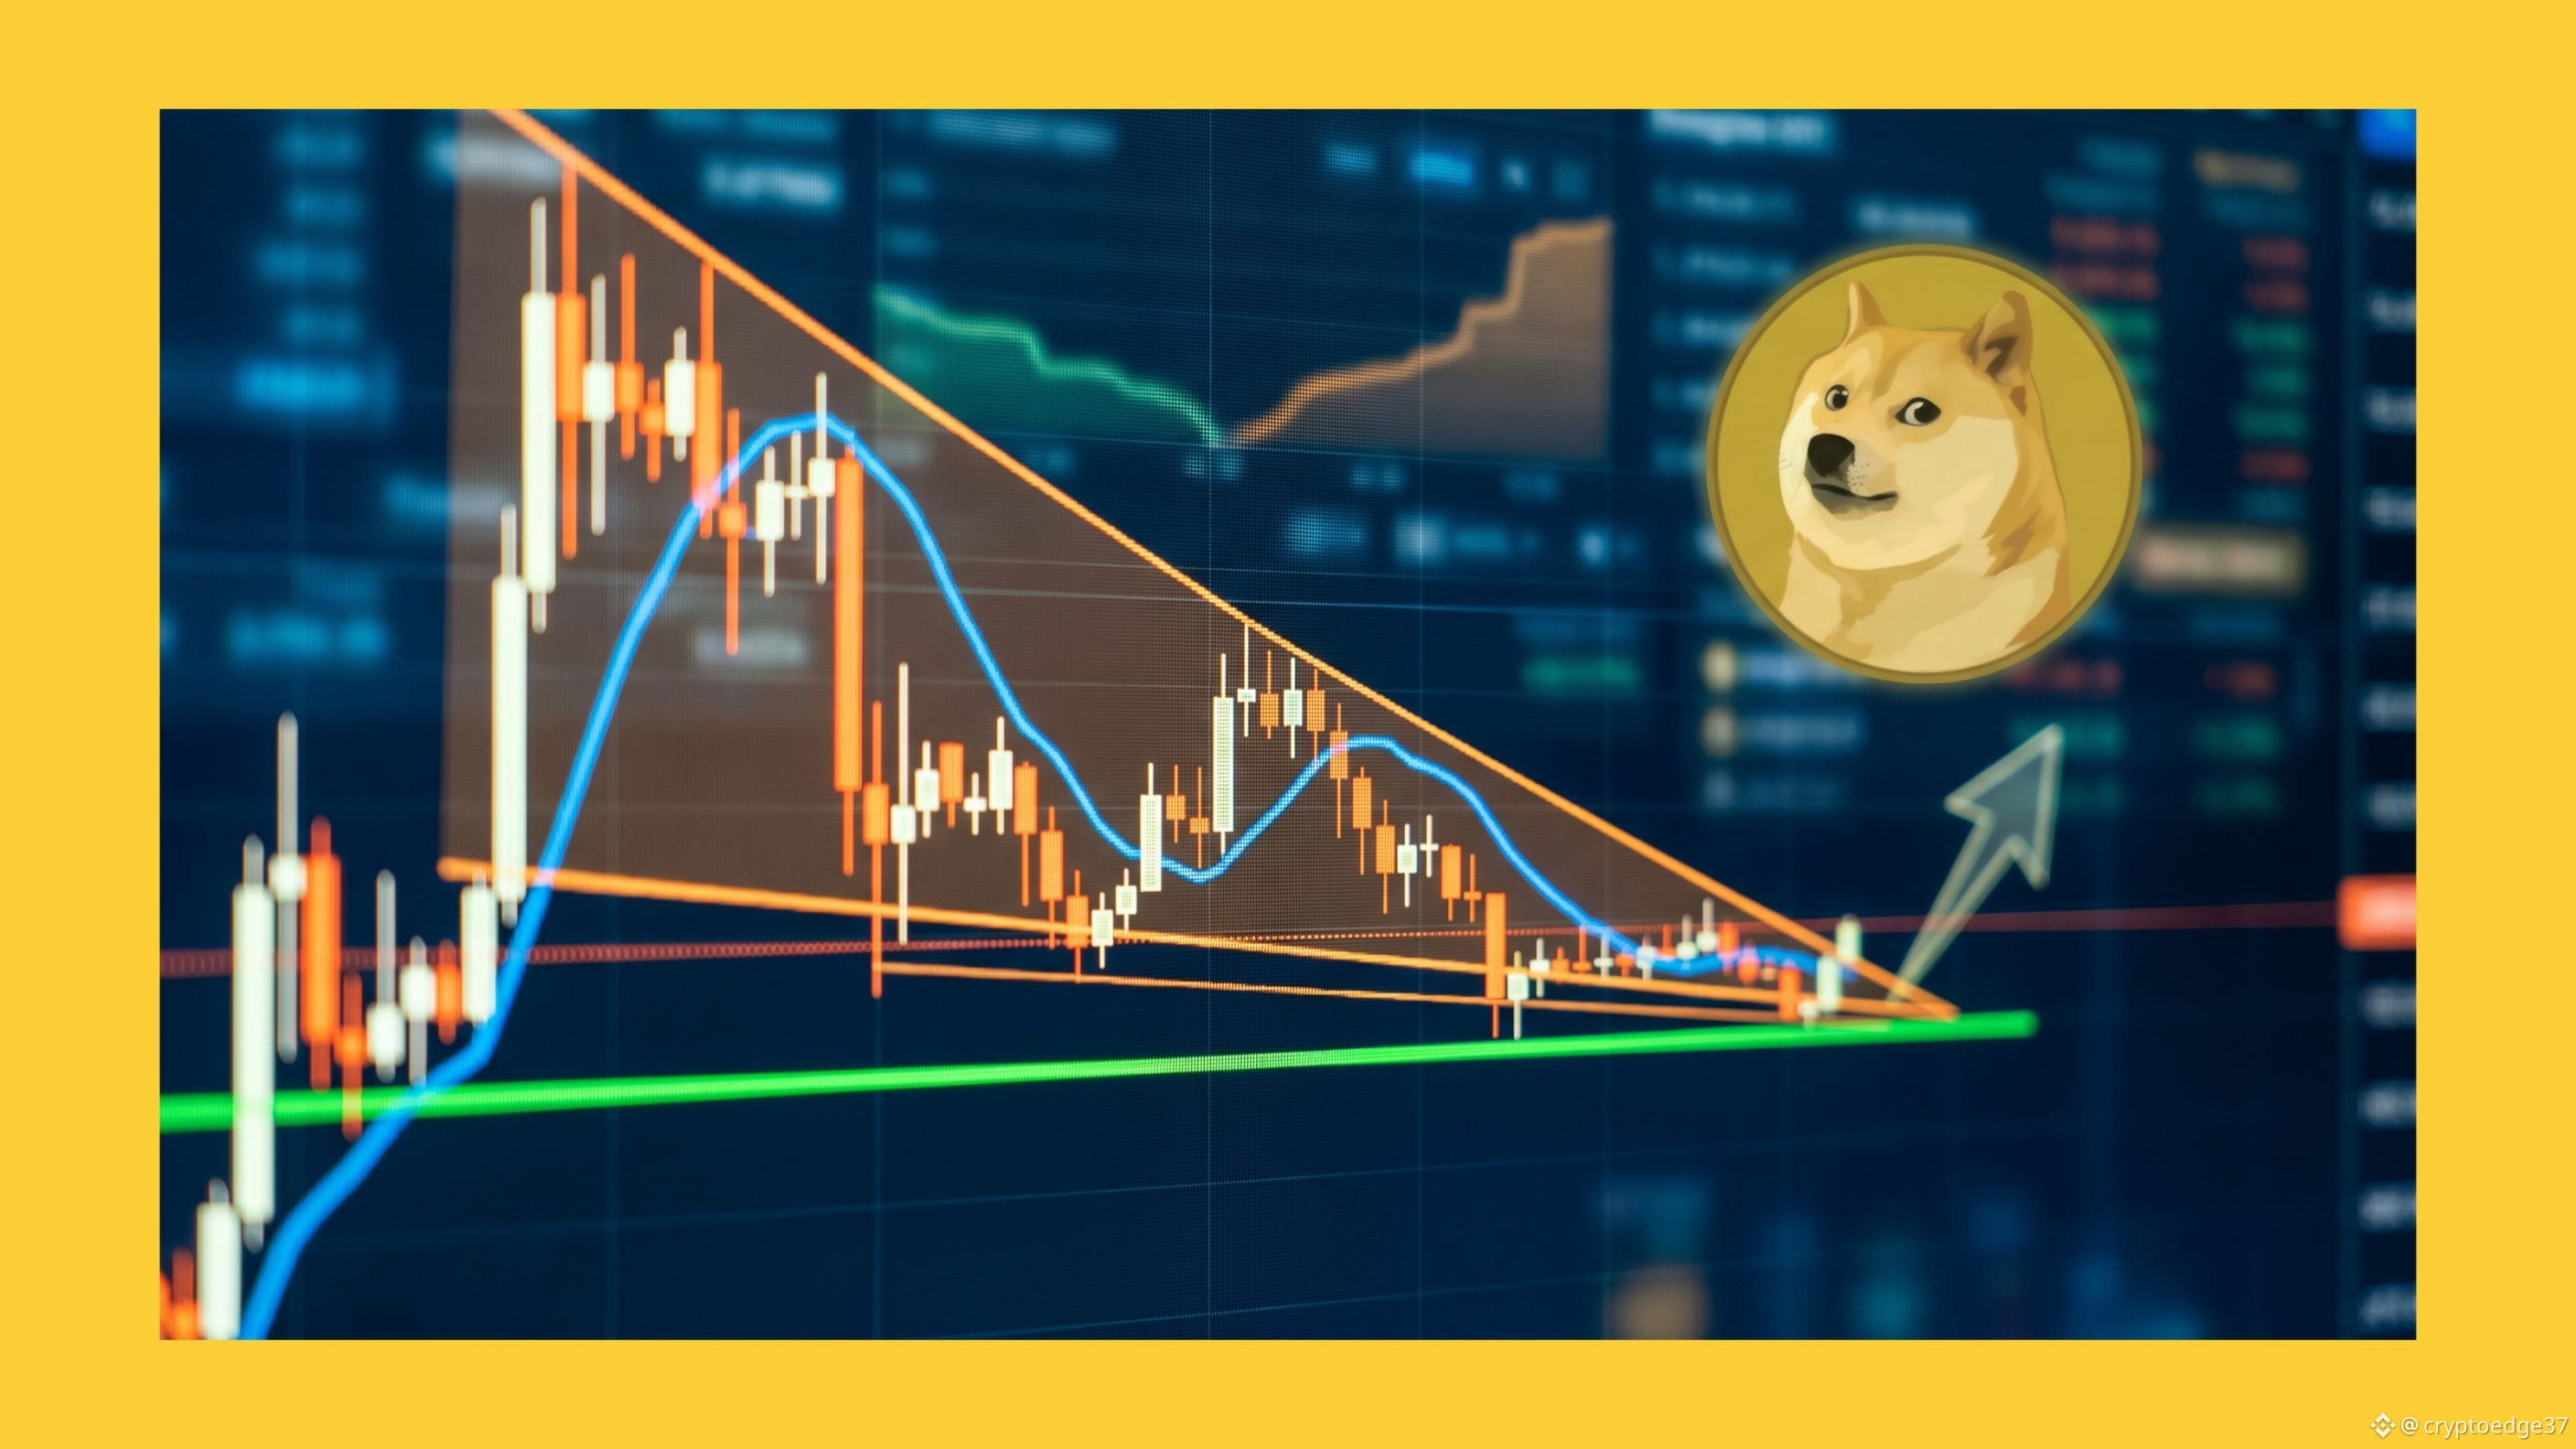
BREAKOUT ALERT: $DOGE WEEKLY FALLING WEDGE TESTS HTF SUPPORT — 4/5 BULLISH CONFLUENCE
$DOGE has completed a full Elliott Wave A-B-C Zigzag correction directly into the lower boundary of a weekly Contracting Falling Wedge, while holding a key Higher Timeframe support zone.
This is where compression meets exhaustion.
▫️ Weekly structure remains intact
▫️ Sell-side momentum fading after corrective completion
▫️ Wedge support continues to hold
▫️ Multi-timeframe confluence building
Technical setup:
Pattern: Contracting Falling Wedge + completed Zigzag
Confluence Rating: 4/5
Weekly bullish confidence: 54%
Key levels:
Support → lower wedge boundary + HTF demand zone
Resistance → upper wedge boundary + prior (B) wave high
Invalidation → sustained breakdown below wedge support
Historically, completed Zigzag corrections at HTF support often precede impulsive expansions. $DOGE is now entering that decision zone.
Correction complete. Compression active. Breakout conditions forming.
Signal: Bullish. 🟢
#DOGE #Dogecoin #TechnicalAnalysiss #cryptosignal #Elliottwave
BREAKOUT ALERT: $DOGE WEEKLY FALLING WEDGE TESTS HTF SUPPORT — 4/5 BULLISH CONFLUENCE
$DOGE has completed a full Elliott Wave A-B-C Zigzag correction directly into the lower boundary of a weekly Contracting Falling Wedge, while holding a key Higher Timeframe support zone.
This is where compression meets exhaustion.
▫️ Weekly structure remains intact
▫️ Sell-side momentum fading after corrective completion
▫️ Wedge support continues to hold
▫️ Multi-timeframe confluence building
Technical setup:
Pattern: Contracting Falling Wedge + completed Zigzag
Confluence Rating: 4/5
Weekly bullish confidence: 54%
Key levels:
Support → lower wedge boundary + HTF demand zone
Resistance → upper wedge boundary + prior (B) wave high
Invalidation → sustained breakdown below wedge support
Historically, completed Zigzag corrections at HTF support often precede impulsive expansions. $DOGE is now entering that decision zone.
Correction complete. Compression active. Breakout conditions forming.
Signal: Bullish. 🟢
#DOGE #Dogecoin #TechnicalAnalysiss #cryptosignal #Elliottwave
$DOGE has completed a full Elliott Wave A-B-C Zigzag correction directly into the lower boundary of a weekly Contracting Falling Wedge, while holding a key Higher Timeframe support zone.
This is where compression meets exhaustion.
▫️ Weekly structure remains intact
▫️ Sell-side momentum fading after corrective completion
▫️ Wedge support continues to hold
▫️ Multi-timeframe confluence building
Technical setup:
Pattern: Contracting Falling Wedge + completed Zigzag
Confluence Rating: 4/5
Weekly bullish confidence: 54%
Key levels:
Support → lower wedge boundary + HTF demand zone
Resistance → upper wedge boundary + prior (B) wave high
Invalidation → sustained breakdown below wedge support
Historically, completed Zigzag corrections at HTF support often precede impulsive expansions. $DOGE is now entering that decision zone.
Correction complete. Compression active. Breakout conditions forming.
Signal: Bullish. 🟢
#DOGE #Dogecoin #TechnicalAnalysiss #cryptosignal #Elliottwave
1
190

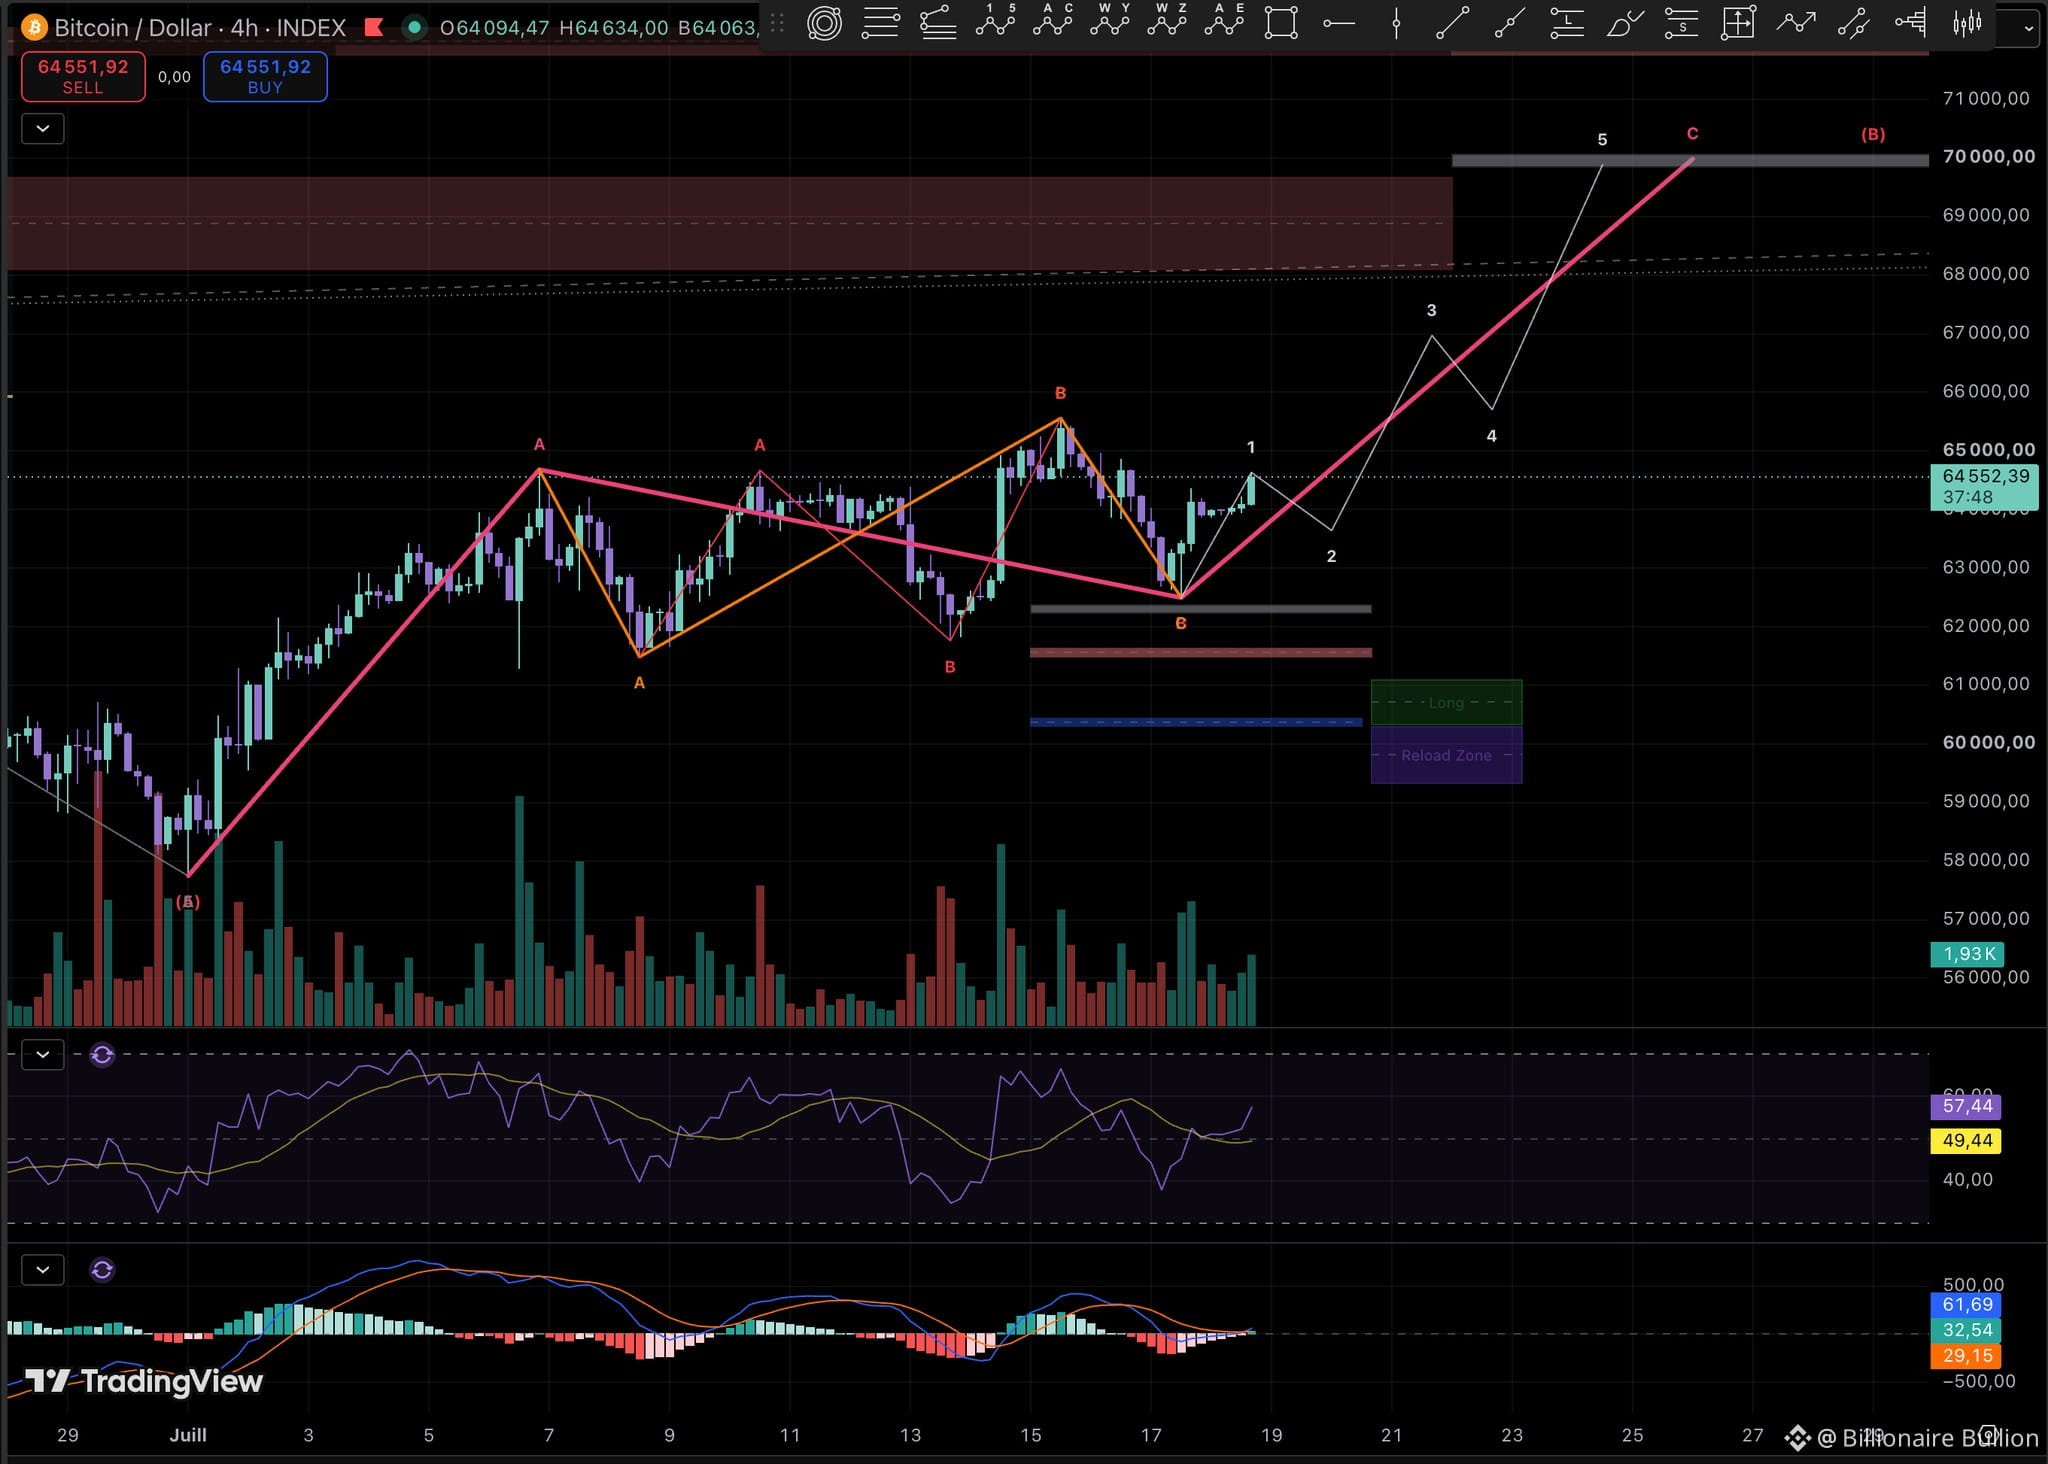
$BTC - LTF Elliott Wave count 📈
ABC Flat correction - B wave completed ✅
• Wave B touched the 100% Fib level (gray box target hit)
• Would have liked to see a deeper move to 161.8% Fib (blue box) but adapting to what the chart shows
• BTC showing strength since yesterday — not ready to drop further for now
• Potential impulsive move forming (start of wave C?)
• Watching the retracement (possible wave 2?) very closely 🧐
Is $BTC starting the next impulsive leg after this flat correction? What’s your LTF count? 👀
Nothing is certain. This is not investment advice.
The market always does what it wants, be careful.
#BTC #Elliottwave #TradingSignals
$BTC - LTF Elliott Wave count 📈
ABC Flat correction - B wave completed ✅
• Wave B touched the 100% Fib level (gray box target hit)
• Would have liked to see a deeper move to 161.8% Fib (blue box) but adapting to what the chart shows
• BTC showing strength since yesterday — not ready to drop further for now
• Potential impulsive move forming (start of wave C?)
• Watching the retracement (possible wave 2?) very closely 🧐
Is $BTC starting the next impulsive leg after this flat correction? What’s your LTF count? 👀
Nothing is certain. This is not investment advice.
The market always does what it wants, be careful.
#BTC #Elliottwave #TradingSignals
ABC Flat correction - B wave completed ✅
• Wave B touched the 100% Fib level (gray box target hit)
• Would have liked to see a deeper move to 161.8% Fib (blue box) but adapting to what the chart shows
• BTC showing strength since yesterday — not ready to drop further for now
• Potential impulsive move forming (start of wave C?)
• Watching the retracement (possible wave 2?) very closely 🧐
Is $BTC starting the next impulsive leg after this flat correction? What’s your LTF count? 👀
Nothing is certain. This is not investment advice.
The market always does what it wants, be careful.
#BTC #Elliottwave #TradingSignals
60

·
--
تحليل $BTC
{future}(BTCUSDT)
: قراءة فنية تشير إلى مزيد من التصحيح
---
🧩 قراءة موجات إليوت
يبدو أن موجة التصحيح الهابطة لم تكتمل بعد، مما يشير إلى احتمالية استمرار الضغوط البيعية في الإطار الزمني الأوسع.
الموجة B الصاعدة من القاع الأخير تحمل طابعاً تصحيحياً وليس انعكاسياً، وهو ما يعزز فرضية استمرار الهيكل الهابط.
---
📊 مؤشرات الزخم
ارتفاع طفيف إضافي في الأسعار قد يدفع مؤشر القوة النسبية (RSI) إلى مناطق التشبع الشرائي، مما يزيد من احتمالية حدوث ارتداد هابط جديد.
---
📅 التوافق مع الدورة الربعية
يتوافق الانخفاض المتوقع في Q4 مع التوقيت الدوري التاريخي لـ #Bitcoin، حيث تميل الأسواق إلى تسجيل تصحيحات في الفترة نفسها من الدورات السابقة.
---
📉 قراءة مؤشر PSI
تتحرك الحركة الهابطة الحالية في توافق واضح مع قراءة المخاطر المرتفعة لمؤشر PSI، مما يعزز النظرة الحذرة على المدى المتوسط.
---
🎯 الخلاصة
العامل الدلالة
هيكل إليوت تصحيح غير مكتمل
الموجة B طابع تصحيحي
RSI قريب من تشبع شرائي
الدورة الربعية Q4 مرشح للهبوط
PSI يشير لمخاطر مرتفعة
التحيز العام: حذر، مع ترجيح استمرار التصحيح الهابط قبل أي انعكاس صعودي حقيقي.
---
#BitcoinCycle #CryptoAnalysis #Elliottwave #BitcoinCycle
تحليل $BTC
: قراءة فنية تشير إلى مزيد من التصحيح
---
🧩 قراءة موجات إليوت
يبدو أن موجة التصحيح الهابطة لم تكتمل بعد، مما يشير إلى احتمالية استمرار الضغوط البيعية في الإطار الزمني الأوسع.
الموجة B الصاعدة من القاع الأخير تحمل طابعاً تصحيحياً وليس انعكاسياً، وهو ما يعزز فرضية استمرار الهيكل الهابط.
---
📊 مؤشرات الزخم
ارتفاع طفيف إضافي في الأسعار قد يدفع مؤشر القوة النسبية (RSI) إلى مناطق التشبع الشرائي، مما يزيد من احتمالية حدوث ارتداد هابط جديد.
---
📅 التوافق مع الدورة الربعية
يتوافق الانخفاض المتوقع في Q4 مع التوقيت الدوري التاريخي لـ #Bitcoin، حيث تميل الأسواق إلى تسجيل تصحيحات في الفترة نفسها من الدورات السابقة.
---
📉 قراءة مؤشر PSI
تتحرك الحركة الهابطة الحالية في توافق واضح مع قراءة المخاطر المرتفعة لمؤشر PSI، مما يعزز النظرة الحذرة على المدى المتوسط.
---
🎯 الخلاصة
العامل الدلالة
هيكل إليوت تصحيح غير مكتمل
الموجة B طابع تصحيحي
RSI قريب من تشبع شرائي
الدورة الربعية Q4 مرشح للهبوط
PSI يشير لمخاطر مرتفعة
التحيز العام: حذر، مع ترجيح استمرار التصحيح الهابط قبل أي انعكاس صعودي حقيقي.
---
#BitcoinCycle #CryptoAnalysis #Elliottwave #BitcoinCycle
: قراءة فنية تشير إلى مزيد من التصحيح
---
🧩 قراءة موجات إليوت
يبدو أن موجة التصحيح الهابطة لم تكتمل بعد، مما يشير إلى احتمالية استمرار الضغوط البيعية في الإطار الزمني الأوسع.
الموجة B الصاعدة من القاع الأخير تحمل طابعاً تصحيحياً وليس انعكاسياً، وهو ما يعزز فرضية استمرار الهيكل الهابط.
---
📊 مؤشرات الزخم
ارتفاع طفيف إضافي في الأسعار قد يدفع مؤشر القوة النسبية (RSI) إلى مناطق التشبع الشرائي، مما يزيد من احتمالية حدوث ارتداد هابط جديد.
---
📅 التوافق مع الدورة الربعية
يتوافق الانخفاض المتوقع في Q4 مع التوقيت الدوري التاريخي لـ #Bitcoin، حيث تميل الأسواق إلى تسجيل تصحيحات في الفترة نفسها من الدورات السابقة.
---
📉 قراءة مؤشر PSI
تتحرك الحركة الهابطة الحالية في توافق واضح مع قراءة المخاطر المرتفعة لمؤشر PSI، مما يعزز النظرة الحذرة على المدى المتوسط.
---
🎯 الخلاصة
العامل الدلالة
هيكل إليوت تصحيح غير مكتمل
الموجة B طابع تصحيحي
RSI قريب من تشبع شرائي
الدورة الربعية Q4 مرشح للهبوط
PSI يشير لمخاطر مرتفعة
التحيز العام: حذر، مع ترجيح استمرار التصحيح الهابط قبل أي انعكاس صعودي حقيقي.
---
#BitcoinCycle #CryptoAnalysis #Elliottwave #BitcoinCycle

102
Войдите, чтобы посмотреть больше материала
Присоединяйтесь к пользователям криптовалют по всему миру на Binance Square
⚡️ Получайте новейшую и полезную информацию о криптоактивах.
💬 Нам доверяет крупнейшая в мире криптобиржа.
👍 Получите достоверные аналитические данные от верифицированных создателей контента.
Эл. почта/номер телефона
В тренде
1
#CanUSStocksReboundAfterNonfarmPayrolls?
Просмотров: 0
6 обсуждают
2
#BinanceReopensWithdrawalsForMoreAssets
Просмотров: 1.1M
6,027 обсуждают
3
#$2TWipedOutHedgeFundsFaceLiquidation
Просмотров: 2,788
39 обсуждают
4
#AnthropicIPOValuationDoubts
Просмотров: 22,724
487 обсуждают
5
#USMidtermsCouldShakeUpUS-IranTies
Просмотров: 829
30 обсуждают
6
#Nasdaq100FuturesRise1.4%
Просмотров: 245
19 обсуждают
7
#RussiaInvestigativeCommitteeProposesAddingCryptoToAMLSystem
Просмотров: 279
8 обсуждают
8
#SouthKoreaDelaysCryptoTaxationUntil2029
Просмотров: 4,194
102 обсуждают
9
#HongKongPlansTaxIncentivesCoveringDigitalAssets
Просмотров: 3,632
70 обсуждают
10
#ECBTargetsDigitalEuroIssuanceIn2029
Просмотров: 3,626
82 обсуждают