
#colecolen
colecolen
Просмотров: 2.5M
3,566 обсуждают
Популярные
Новые

MEXICO SHUTS DOWN SECRET BITCOIN MINING FARM IN PUEBLA
Mexican authorities have shut down a secret cryptocurrency mining farm in Tlaola, Puebla. The Sept. 6 operation involved Mexico’s Federal Prosecutor’s Office, Navy and state security forces.
Authorities seized around 300 GPUs, a transformer, nearly 80 medium-voltage electrical terminals and 8 satellite internet antennas. It was the fourth crypto mining farm discovered in the area since early 2025.
Investigators are examining two main suspicions: the facility may have taken electricity from a nearby hydroelectric dam to cut operating costs, while cryptocurrency generated through mining could potentially be linked to efforts to conceal illicit funds from drug cartels.
However, there is currently no evidence proving that the Puebla farm was actually used for money laundering. Authorities are still investigating and coordinating with neighboring states to determine whether similar networks remain active.
According to the Cambridge Bitcoin Electricity Consumption Index, producing one Bitcoin currently costs around 45,000 USD, while BTC trades near 78,000 USD. Nearly free electricity could therefore significantly increase mining margins.
Chainalysis expert Caio Motta said criminal organizations in Latin America often place mining equipment in areas they control or where unauthorized electricity is easily accessible. However, this alone does not prove that the Puebla facility was linked to a cartel.
Three other crypto mining farms have also been discovered near hydroelectric dams in northern Puebla. Authorities are expanding the investigation.
Could the Puebla investigation uncover a larger illegal crypto mining network in Mexico?
Please do your own research carefully before making any transactions (DYOR). $BTC $BCH $BNB #Colecolen
{future}(BNBUSDT)
{future}(BCHUSDT)
{future}(BTCUSDT)
MEXICO SHUTS DOWN SECRET BITCOIN MINING FARM IN PUEBLA
Mexican authorities have shut down a secret cryptocurrency mining farm in Tlaola, Puebla. The Sept. 6 operation involved Mexico’s Federal Prosecutor’s Office, Navy and state security forces.
Authorities seized around 300 GPUs, a transformer, nearly 80 medium-voltage electrical terminals and 8 satellite internet antennas. It was the fourth crypto mining farm discovered in the area since early 2025.
Investigators are examining two main suspicions: the facility may have taken electricity from a nearby hydroelectric dam to cut operating costs, while cryptocurrency generated through mining could potentially be linked to efforts to conceal illicit funds from drug cartels.
However, there is currently no evidence proving that the Puebla farm was actually used for money laundering. Authorities are still investigating and coordinating with neighboring states to determine whether similar networks remain active.
According to the Cambridge Bitcoin Electricity Consumption Index, producing one Bitcoin currently costs around 45,000 USD, while BTC trades near 78,000 USD. Nearly free electricity could therefore significantly increase mining margins.
Chainalysis expert Caio Motta said criminal organizations in Latin America often place mining equipment in areas they control or where unauthorized electricity is easily accessible. However, this alone does not prove that the Puebla facility was linked to a cartel.
Three other crypto mining farms have also been discovered near hydroelectric dams in northern Puebla. Authorities are expanding the investigation.
Could the Puebla investigation uncover a larger illegal crypto mining network in Mexico?
Please do your own research carefully before making any transactions (DYOR). $BTC $BCH $BNB #Colecolen
Mexican authorities have shut down a secret cryptocurrency mining farm in Tlaola, Puebla. The Sept. 6 operation involved Mexico’s Federal Prosecutor’s Office, Navy and state security forces.
Authorities seized around 300 GPUs, a transformer, nearly 80 medium-voltage electrical terminals and 8 satellite internet antennas. It was the fourth crypto mining farm discovered in the area since early 2025.
Investigators are examining two main suspicions: the facility may have taken electricity from a nearby hydroelectric dam to cut operating costs, while cryptocurrency generated through mining could potentially be linked to efforts to conceal illicit funds from drug cartels.
However, there is currently no evidence proving that the Puebla farm was actually used for money laundering. Authorities are still investigating and coordinating with neighboring states to determine whether similar networks remain active.
According to the Cambridge Bitcoin Electricity Consumption Index, producing one Bitcoin currently costs around 45,000 USD, while BTC trades near 78,000 USD. Nearly free electricity could therefore significantly increase mining margins.
Chainalysis expert Caio Motta said criminal organizations in Latin America often place mining equipment in areas they control or where unauthorized electricity is easily accessible. However, this alone does not prove that the Puebla facility was linked to a cartel.
Three other crypto mining farms have also been discovered near hydroelectric dams in northern Puebla. Authorities are expanding the investigation.
Could the Puebla investigation uncover a larger illegal crypto mining network in Mexico?
Please do your own research carefully before making any transactions (DYOR). $BTC $BCH $BNB #Colecolen

72
TRUMP MAKES CONCESSIONS AS CLARITY ACT NEARS THE 60-VOTE HURDLE
The U.S. Senate has released the latest version of the CLARITY Act ahead of the Sept. 15 cloture vote. The text incorporates 126 changes from Democrats, up from 114 in the Sept. 10 version.
President Donald Trump reportedly agreed to 80% of proposals developed by Republican Senator Thom Tillis and Democratic Senator Ruben Gallego. The concession is important for attracting Democratic votes.
The new text would require the President, Vice President, members of Congress, federal officials and employees, along with their spouses, to divest or place assets in an independent trust if they hold significant financial interests in digital-asset issuers. The rule does not similarly cover children.
The CLARITY Act defines regulatory boundaries between the SEC and CFTC while also addressing DeFi. Some DeFi protocols that are not genuinely decentralized could face CFTC registration and BSA requirements for spot transactions involving digital assets classified as commodities.
Another major sticking point is stablecoin rewards. The bill would prohibit platforms from paying interest to stablecoin holders while still allowing rewards tied to stablecoin use for payments or trading.
Banks worry stablecoins could compete with deposits. The updated bill allows the Treasury Secretary to temporarily suspend rewards if community-bank outflows surge, for 18 months after the law takes effect.
The bill needs at least 60 votes on Sept. 15 to clear cloture. Republicans hold 53 seats, meaning at least seven additional Democratic or independent votes are required.
Even after Senate passage, the bill must clear the House. Polymarket’s probability of passage in 2026 rose from about 22% to 32%, but the remaining legislative window is tight.
Will the CLARITY Act secure 60 votes on Sept. 15?
Please do your own research carefully before making any transactions (DYOR). $TRUMP $BCH $BNB #Colecolen
{future}(BNBUSDT)
{future}(BCHUSDT)
{future}(TRUMPUSDT)
TRUMP MAKES CONCESSIONS AS CLARITY ACT NEARS THE 60-VOTE HURDLE
The U.S. Senate has released the latest version of the CLARITY Act ahead of the Sept. 15 cloture vote. The text incorporates 126 changes from Democrats, up from 114 in the Sept. 10 version.
President Donald Trump reportedly agreed to 80% of proposals developed by Republican Senator Thom Tillis and Democratic Senator Ruben Gallego. The concession is important for attracting Democratic votes.
The new text would require the President, Vice President, members of Congress, federal officials and employees, along with their spouses, to divest or place assets in an independent trust if they hold significant financial interests in digital-asset issuers. The rule does not similarly cover children.
The CLARITY Act defines regulatory boundaries between the SEC and CFTC while also addressing DeFi. Some DeFi protocols that are not genuinely decentralized could face CFTC registration and BSA requirements for spot transactions involving digital assets classified as commodities.
Another major sticking point is stablecoin rewards. The bill would prohibit platforms from paying interest to stablecoin holders while still allowing rewards tied to stablecoin use for payments or trading.
Banks worry stablecoins could compete with deposits. The updated bill allows the Treasury Secretary to temporarily suspend rewards if community-bank outflows surge, for 18 months after the law takes effect.
The bill needs at least 60 votes on Sept. 15 to clear cloture. Republicans hold 53 seats, meaning at least seven additional Democratic or independent votes are required.
Even after Senate passage, the bill must clear the House. Polymarket’s probability of passage in 2026 rose from about 22% to 32%, but the remaining legislative window is tight.
Will the CLARITY Act secure 60 votes on Sept. 15?
Please do your own research carefully before making any transactions (DYOR). $TRUMP $BCH $BNB #Colecolen
The U.S. Senate has released the latest version of the CLARITY Act ahead of the Sept. 15 cloture vote. The text incorporates 126 changes from Democrats, up from 114 in the Sept. 10 version.
President Donald Trump reportedly agreed to 80% of proposals developed by Republican Senator Thom Tillis and Democratic Senator Ruben Gallego. The concession is important for attracting Democratic votes.
The new text would require the President, Vice President, members of Congress, federal officials and employees, along with their spouses, to divest or place assets in an independent trust if they hold significant financial interests in digital-asset issuers. The rule does not similarly cover children.
The CLARITY Act defines regulatory boundaries between the SEC and CFTC while also addressing DeFi. Some DeFi protocols that are not genuinely decentralized could face CFTC registration and BSA requirements for spot transactions involving digital assets classified as commodities.
Another major sticking point is stablecoin rewards. The bill would prohibit platforms from paying interest to stablecoin holders while still allowing rewards tied to stablecoin use for payments or trading.
Banks worry stablecoins could compete with deposits. The updated bill allows the Treasury Secretary to temporarily suspend rewards if community-bank outflows surge, for 18 months after the law takes effect.
The bill needs at least 60 votes on Sept. 15 to clear cloture. Republicans hold 53 seats, meaning at least seven additional Democratic or independent votes are required.
Even after Senate passage, the bill must clear the House. Polymarket’s probability of passage in 2026 rose from about 22% to 32%, but the remaining legislative window is tight.
Will the CLARITY Act secure 60 votes on Sept. 15?
Please do your own research carefully before making any transactions (DYOR). $TRUMP $BCH $BNB #Colecolen

89
·
--
Рост
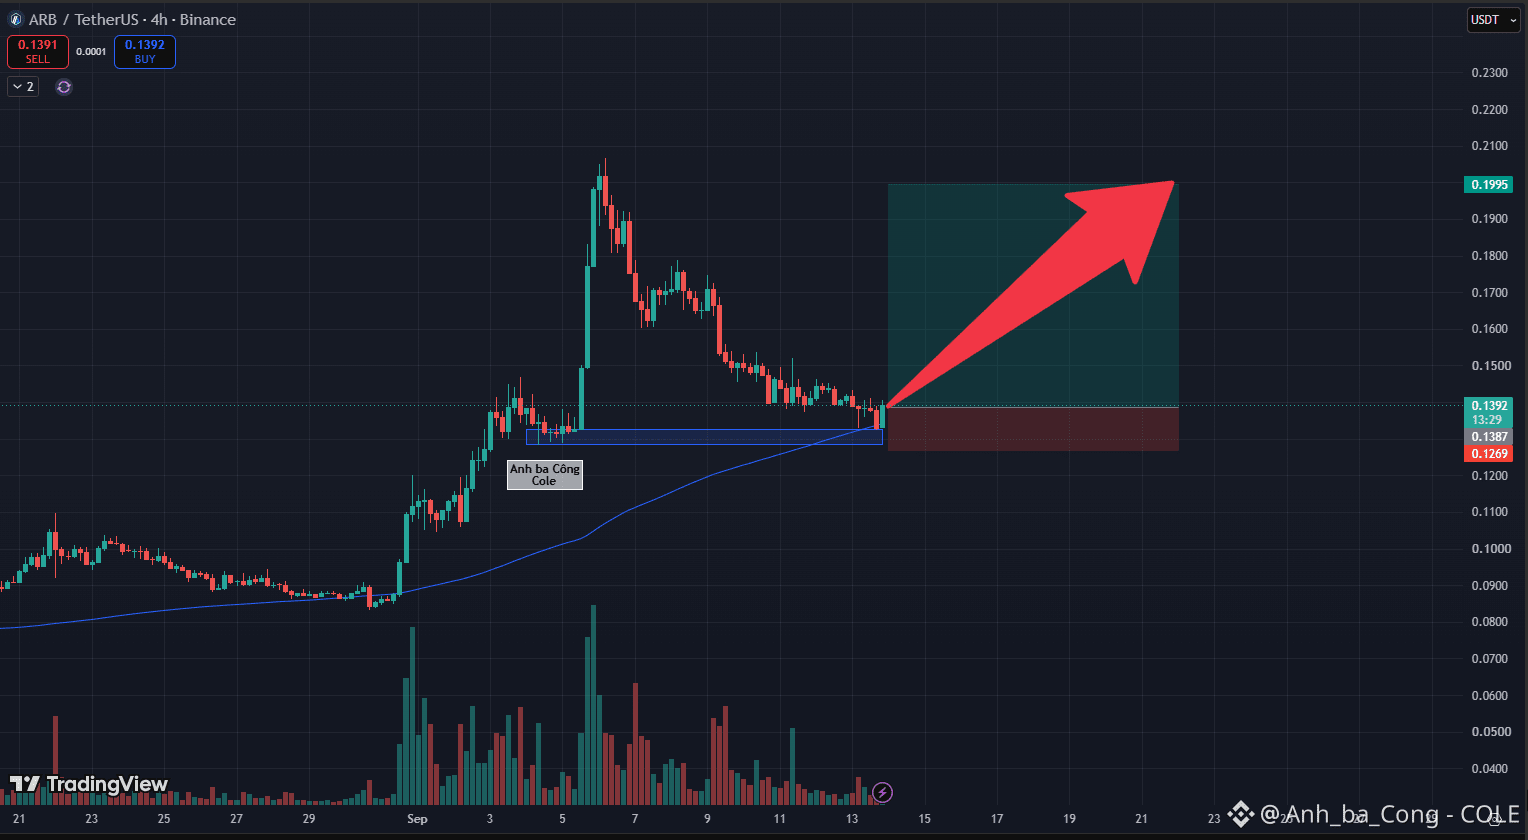
ARB: Defends Confluence Support at Dynamic MA100 – High-RR Breakout Long Targeting $0.200 Resistance Retest
Arbitrum (ARB) is presenting an optimal trend-continuation entry on the 4-hour timeframe as an extensive corrective pullback successfully retests foundational structural support. Following an aggressive vertical markup wave off historical lows that stalled beneath the critical $0.200 psychological round-number threshold, this orderly cool-off has effectively flushed out late momentum chasers to reset the broader macro trend.
Based on the visual data from the 4-hour chart , price action has landed squarely upon a major technical confluence zone around the $0.138–$0.139 pocket. This demand shelf represents the intersection of a former horizontal resistance zone flipped into support and the upward-sloping dynamic MA100 trendline. The active 4-hour candle near $0.1392 is printing clear lower-wick absorption alongside sharply contracting sell volume. This behavior verifies that sell-side distribution has thoroughly exhausted, while responsive institutional buyers actively step in to defend the baseline and safeguard the prevailing intermediate uptrend.
This technical framework presents an asymmetric trend-following Long execution opportunity featuring tight risk parameters. The optimal trading strategy is to initiate Long positions within the $0.1387–$0.1392 zone, placing a tight protective stop-loss parameter directly beneath the confluence cushion at $0.1269. The primary strategic take-profit objective targets the structural swing high across the $0.1995–$0.2000 resistance ceiling, securing an exceptional risk-to-reward ratio.
Disclaimer: This is not financial advice, DYOR. $ARB $BR $REZ #Colecolen
{future}(REZUSDT)
{future}(BRUSDT)
{future}(ARBUSDT)
ARB: Defends Confluence Support at Dynamic MA100 – High-RR Breakout Long Targeting $0.200 Resistance Retest
Arbitrum (ARB) is presenting an optimal trend-continuation entry on the 4-hour timeframe as an extensive corrective pullback successfully retests foundational structural support. Following an aggressive vertical markup wave off historical lows that stalled beneath the critical $0.200 psychological round-number threshold, this orderly cool-off has effectively flushed out late momentum chasers to reset the broader macro trend.
Based on the visual data from the 4-hour chart , price action has landed squarely upon a major technical confluence zone around the $0.138–$0.139 pocket. This demand shelf represents the intersection of a former horizontal resistance zone flipped into support and the upward-sloping dynamic MA100 trendline. The active 4-hour candle near $0.1392 is printing clear lower-wick absorption alongside sharply contracting sell volume. This behavior verifies that sell-side distribution has thoroughly exhausted, while responsive institutional buyers actively step in to defend the baseline and safeguard the prevailing intermediate uptrend.
This technical framework presents an asymmetric trend-following Long execution opportunity featuring tight risk parameters. The optimal trading strategy is to initiate Long positions within the $0.1387–$0.1392 zone, placing a tight protective stop-loss parameter directly beneath the confluence cushion at $0.1269. The primary strategic take-profit objective targets the structural swing high across the $0.1995–$0.2000 resistance ceiling, securing an exceptional risk-to-reward ratio.
Disclaimer: This is not financial advice, DYOR. $ARB $BR $REZ #Colecolen
Arbitrum (ARB) is presenting an optimal trend-continuation entry on the 4-hour timeframe as an extensive corrective pullback successfully retests foundational structural support. Following an aggressive vertical markup wave off historical lows that stalled beneath the critical $0.200 psychological round-number threshold, this orderly cool-off has effectively flushed out late momentum chasers to reset the broader macro trend.
Based on the visual data from the 4-hour chart , price action has landed squarely upon a major technical confluence zone around the $0.138–$0.139 pocket. This demand shelf represents the intersection of a former horizontal resistance zone flipped into support and the upward-sloping dynamic MA100 trendline. The active 4-hour candle near $0.1392 is printing clear lower-wick absorption alongside sharply contracting sell volume. This behavior verifies that sell-side distribution has thoroughly exhausted, while responsive institutional buyers actively step in to defend the baseline and safeguard the prevailing intermediate uptrend.
This technical framework presents an asymmetric trend-following Long execution opportunity featuring tight risk parameters. The optimal trading strategy is to initiate Long positions within the $0.1387–$0.1392 zone, placing a tight protective stop-loss parameter directly beneath the confluence cushion at $0.1269. The primary strategic take-profit objective targets the structural swing high across the $0.1995–$0.2000 resistance ceiling, securing an exceptional risk-to-reward ratio.
Disclaimer: This is not financial advice, DYOR. $ARB $BR $REZ #Colecolen
206 Atlas:
Lower wicks don't prove institutional defense. If that MA100 breaks, the thesis is dead and the stop gets hit.
1
287
·
--
Падение
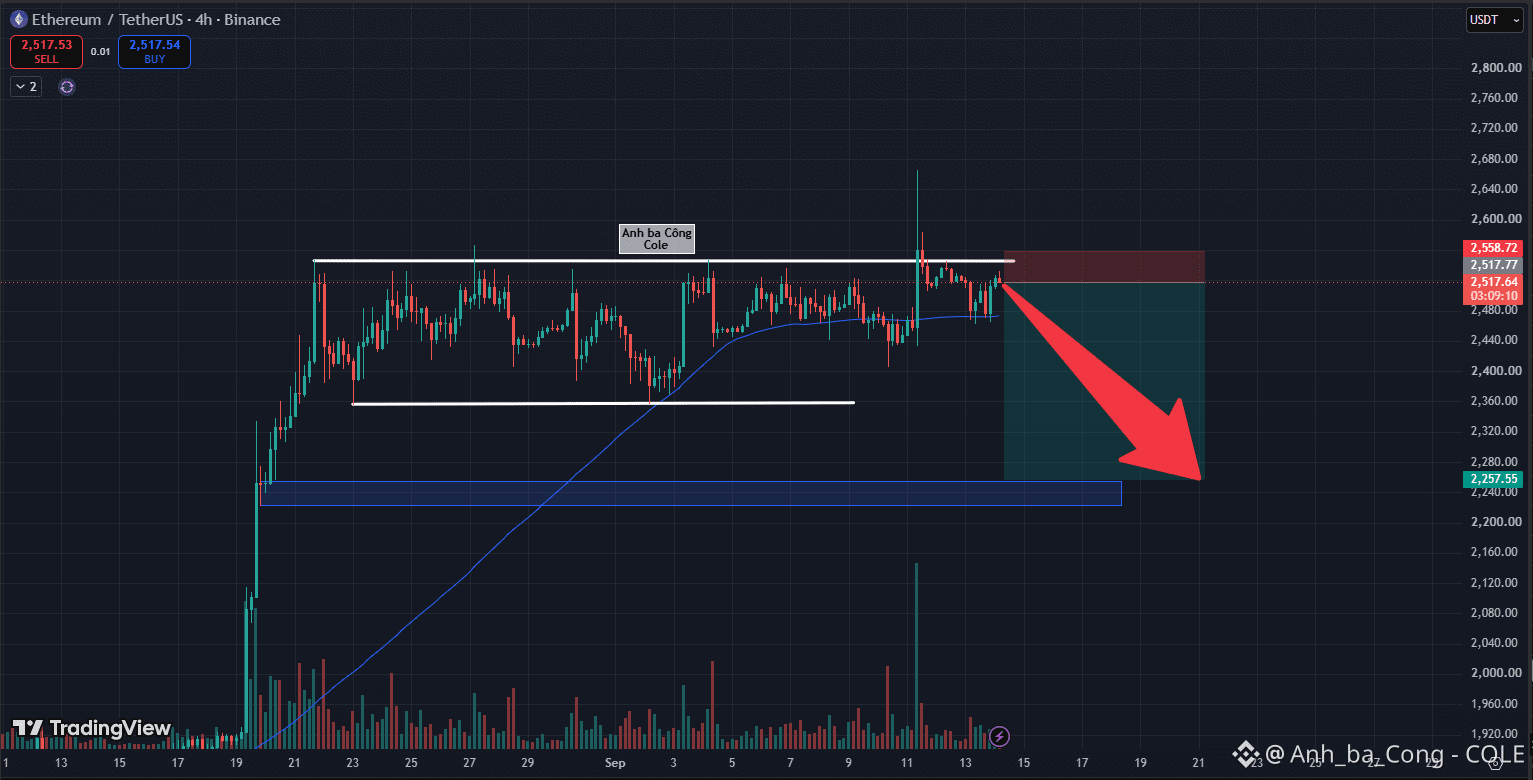
ETH: Liquidity Sweep Rejection at $2,550–$2,600 – Strategic Short Targeting Downside Liquidity Flush Ahead of Macro Data
Ethereum (ETH) is flashing clear exhaustion signatures on the 4-hour timeframe following an aggressive yet failed breakout attempt through the $2,550–$2,600 overhead resistance band. The recent vertical spike was swiftly rejected, carving out an extended upper liquidity-sweep wick and forcing price action directly back into its familiar horizontal consolidation box.
Based on the visual data from the 4-hour chart , price candles near $2,517 are tentatively hovering just above the rising dynamic MA100 trendline. While broader sentiment remains constructive, market participants are exercising extreme caution ahead of major macroeconomic releases from the United States scheduled throughout September. From an order-flow perspective, having already purged upper breakout liquidity, technical odds strongly favor a corresponding downward sweep beneath the range floor. Such a liquidity sweep would thoroughly clean out late Long positions and engineer healthy accumulation before launching a genuine macro expansion leg toward $3,000.
This technical framework supports a tactical Short execution setup offering well-defined risk parameters. The optimal trading strategy is to initiate Short positions around the $2,517–$2,525 handle, establishing a tight protective stop-loss parameter directly above the recent consolidation high at $2,558.72. The primary strategic take-profit objective targets the structural demand pool anchored near $2,257.
Disclaimer: This is not financial advice, DYOR. $ETH $FIL $AIN #Colecolen
{future}(AINUSDT)
{future}(FILUSDT)
{future}(ETHUSDT)
ETH: Liquidity Sweep Rejection at $2,550–$2,600 – Strategic Short Targeting Downside Liquidity Flush Ahead of Macro Data
Ethereum (ETH) is flashing clear exhaustion signatures on the 4-hour timeframe following an aggressive yet failed breakout attempt through the $2,550–$2,600 overhead resistance band. The recent vertical spike was swiftly rejected, carving out an extended upper liquidity-sweep wick and forcing price action directly back into its familiar horizontal consolidation box.
Based on the visual data from the 4-hour chart , price candles near $2,517 are tentatively hovering just above the rising dynamic MA100 trendline. While broader sentiment remains constructive, market participants are exercising extreme caution ahead of major macroeconomic releases from the United States scheduled throughout September. From an order-flow perspective, having already purged upper breakout liquidity, technical odds strongly favor a corresponding downward sweep beneath the range floor. Such a liquidity sweep would thoroughly clean out late Long positions and engineer healthy accumulation before launching a genuine macro expansion leg toward $3,000.
This technical framework supports a tactical Short execution setup offering well-defined risk parameters. The optimal trading strategy is to initiate Short positions around the $2,517–$2,525 handle, establishing a tight protective stop-loss parameter directly above the recent consolidation high at $2,558.72. The primary strategic take-profit objective targets the structural demand pool anchored near $2,257.
Disclaimer: This is not financial advice, DYOR. $ETH $FIL $AIN #Colecolen
Ethereum (ETH) is flashing clear exhaustion signatures on the 4-hour timeframe following an aggressive yet failed breakout attempt through the $2,550–$2,600 overhead resistance band. The recent vertical spike was swiftly rejected, carving out an extended upper liquidity-sweep wick and forcing price action directly back into its familiar horizontal consolidation box.
Based on the visual data from the 4-hour chart , price candles near $2,517 are tentatively hovering just above the rising dynamic MA100 trendline. While broader sentiment remains constructive, market participants are exercising extreme caution ahead of major macroeconomic releases from the United States scheduled throughout September. From an order-flow perspective, having already purged upper breakout liquidity, technical odds strongly favor a corresponding downward sweep beneath the range floor. Such a liquidity sweep would thoroughly clean out late Long positions and engineer healthy accumulation before launching a genuine macro expansion leg toward $3,000.
This technical framework supports a tactical Short execution setup offering well-defined risk parameters. The optimal trading strategy is to initiate Short positions around the $2,517–$2,525 handle, establishing a tight protective stop-loss parameter directly above the recent consolidation high at $2,558.72. The primary strategic take-profit objective targets the structural demand pool anchored near $2,257.
Disclaimer: This is not financial advice, DYOR. $ETH $FIL $AIN #Colecolen
168
UNISWAP SURPASSES 70B USD IN MONTHLY VOLUME, AHEAD OF THE NEXT 3 DEXS COMBINED
Uniswap says its trading volume exceeded 70B USD over the past month, putting the protocol at the top of the decentralized exchange (DEX) market. According to Foresight News, Uniswap’s volume was also higher than the combined volume of the next three largest DEXs.
The figure matters because it reflects more than trading activity; it also shows how strongly market activity is concentrated around major protocols. When one DEX generates more volume than its next three competitors combined, the scale gap becomes a notable market signal.
Uniswap uses an AMM model, allowing token swaps through liquidity pools rather than a traditional order book. High volume generally reflects strong swap demand and significant use of on-chain infrastructure.
The key point is that volume does not directly equal revenue or profit. Trading activity can change rapidly with price volatility, market demand and activity across different blockchains. Therefore, the 70B USD milestone is best viewed as a measure of usage and current market position.
The gap also raises questions about competition within the DEX market. If Uniswap maintains volume above the combined level of its next three competitors, its liquidity advantage and market depth could further strengthen its position.
However, DEX rankings can still change as liquidity and trading activity move between chains, ecosystems and protocols. One month of high volume is not enough to establish long-term dominance, but more than 70B USD remains a notable market signal.
Does Uniswap’s current volume gap reflect a sustainable advantage, or mainly a short-term trading cycle?
Please do your own research carefully before making any transactions (DYOR). $UNI $FIL $KOMA #Colecolen
{future}(KOMAUSDT)
{future}(FILUSDT)
{future}(UNIUSDT)
UNISWAP SURPASSES 70B USD IN MONTHLY VOLUME, AHEAD OF THE NEXT 3 DEXS COMBINED
Uniswap says its trading volume exceeded 70B USD over the past month, putting the protocol at the top of the decentralized exchange (DEX) market. According to Foresight News, Uniswap’s volume was also higher than the combined volume of the next three largest DEXs.
The figure matters because it reflects more than trading activity; it also shows how strongly market activity is concentrated around major protocols. When one DEX generates more volume than its next three competitors combined, the scale gap becomes a notable market signal.
Uniswap uses an AMM model, allowing token swaps through liquidity pools rather than a traditional order book. High volume generally reflects strong swap demand and significant use of on-chain infrastructure.
The key point is that volume does not directly equal revenue or profit. Trading activity can change rapidly with price volatility, market demand and activity across different blockchains. Therefore, the 70B USD milestone is best viewed as a measure of usage and current market position.
The gap also raises questions about competition within the DEX market. If Uniswap maintains volume above the combined level of its next three competitors, its liquidity advantage and market depth could further strengthen its position.
However, DEX rankings can still change as liquidity and trading activity move between chains, ecosystems and protocols. One month of high volume is not enough to establish long-term dominance, but more than 70B USD remains a notable market signal.
Does Uniswap’s current volume gap reflect a sustainable advantage, or mainly a short-term trading cycle?
Please do your own research carefully before making any transactions (DYOR). $UNI $FIL $KOMA #Colecolen
Uniswap says its trading volume exceeded 70B USD over the past month, putting the protocol at the top of the decentralized exchange (DEX) market. According to Foresight News, Uniswap’s volume was also higher than the combined volume of the next three largest DEXs.
The figure matters because it reflects more than trading activity; it also shows how strongly market activity is concentrated around major protocols. When one DEX generates more volume than its next three competitors combined, the scale gap becomes a notable market signal.
Uniswap uses an AMM model, allowing token swaps through liquidity pools rather than a traditional order book. High volume generally reflects strong swap demand and significant use of on-chain infrastructure.
The key point is that volume does not directly equal revenue or profit. Trading activity can change rapidly with price volatility, market demand and activity across different blockchains. Therefore, the 70B USD milestone is best viewed as a measure of usage and current market position.
The gap also raises questions about competition within the DEX market. If Uniswap maintains volume above the combined level of its next three competitors, its liquidity advantage and market depth could further strengthen its position.
However, DEX rankings can still change as liquidity and trading activity move between chains, ecosystems and protocols. One month of high volume is not enough to establish long-term dominance, but more than 70B USD remains a notable market signal.
Does Uniswap’s current volume gap reflect a sustainable advantage, or mainly a short-term trading cycle?
Please do your own research carefully before making any transactions (DYOR). $UNI $FIL $KOMA #Colecolen

1
353
·
--
Рост
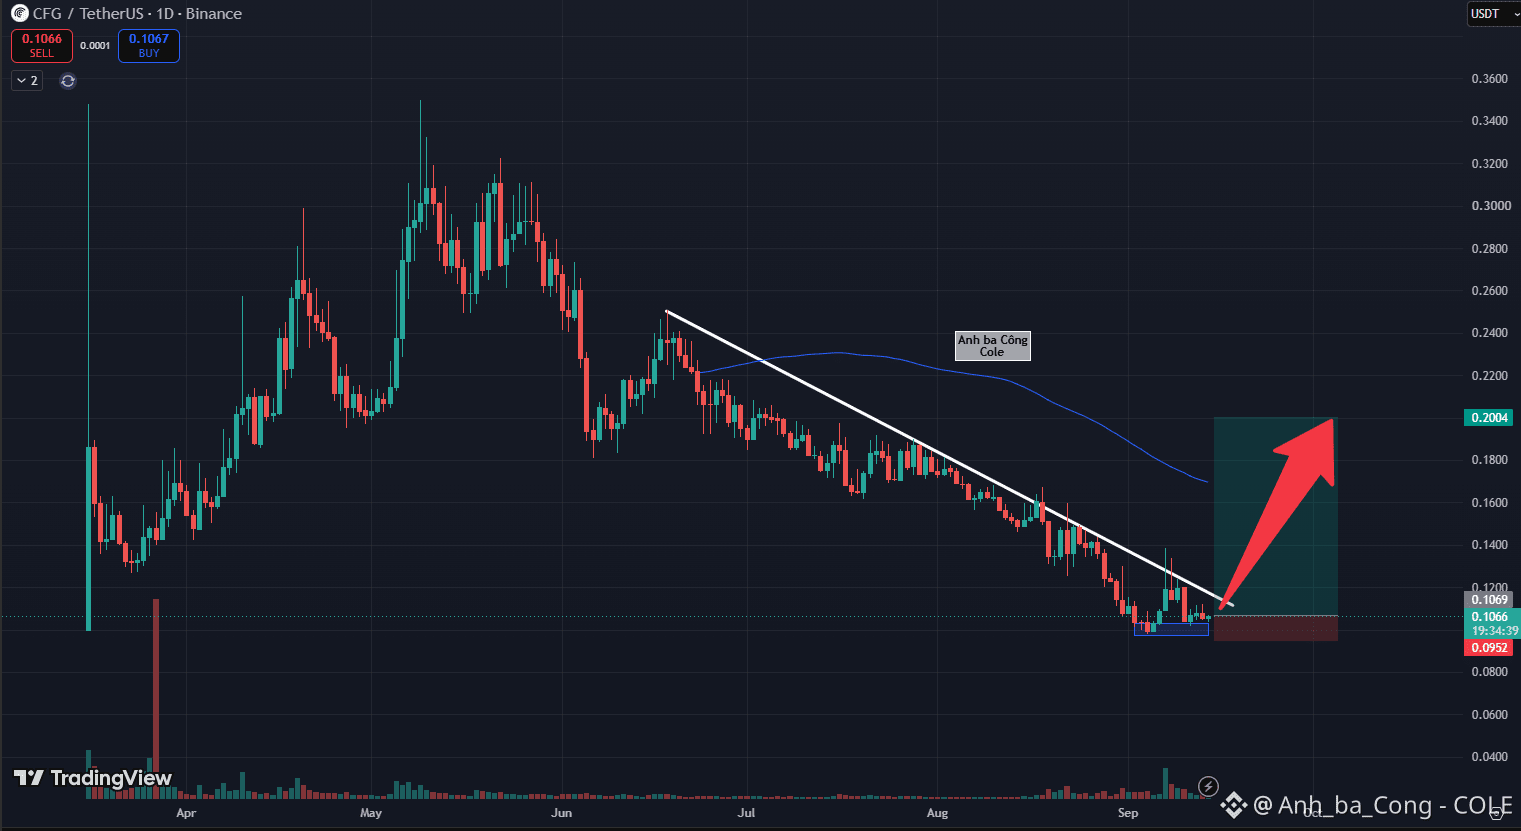
CFG: Defends $0.100 Round-Number Support Floor at Downtrend Exhaustion – Asymmetric Reversal Long with Ultra-Tight Stop Loss
Centrifuge (CFG) is approaching definitive downside exhaustion on the daily timeframe as price action establishes firm structural support above the critical $0.100 psychological round-number threshold. Following an extended decline constrained beneath a macro descending trendline, recent candle behavior indicates base formation, signaling that an aggressive trend-reversal pivot is imminent.
Based on the visual data from the daily chart , the $0.095–$0.100 demand pocket has printed repeated lower-wick absorption candles, confirming that sell-side distribution momentum has completely dried up. The inability of sellers to print fresh structural lows confirms that responsive buyers are systematically absorbing remaining floating supply. Furthermore, broader market tailwinds provide an ideal backdrop for CFG to break above its descending resistance line. Once this compression resolves upward, price action possesses a high statistical probability of rallying toward the overhead dynamic MA100 to reclaim higher liquidity shelves.
This technical framework presents an asymmetric macro reversal Long execution opportunity featuring minimal downside exposure. The optimal trading strategy is to build Long positions within the $0.106–$0.107 zone, placing a tight protective stop-loss parameter directly beneath the accumulation floor at $0.0952. The primary strategic take-profit objective targets the psychological resistance ceiling near $0.2004, offering superior risk-to-reward metrics.
Disclaimer: This is not financial advice, DYOR. $CFG #Colecolen $CVC $FIL
{future}(FILUSDT)
{future}(CVCUSDT)
{future}(CFGUSDT)
CFG: Defends $0.100 Round-Number Support Floor at Downtrend Exhaustion – Asymmetric Reversal Long with Ultra-Tight Stop Loss
Centrifuge (CFG) is approaching definitive downside exhaustion on the daily timeframe as price action establishes firm structural support above the critical $0.100 psychological round-number threshold. Following an extended decline constrained beneath a macro descending trendline, recent candle behavior indicates base formation, signaling that an aggressive trend-reversal pivot is imminent.
Based on the visual data from the daily chart , the $0.095–$0.100 demand pocket has printed repeated lower-wick absorption candles, confirming that sell-side distribution momentum has completely dried up. The inability of sellers to print fresh structural lows confirms that responsive buyers are systematically absorbing remaining floating supply. Furthermore, broader market tailwinds provide an ideal backdrop for CFG to break above its descending resistance line. Once this compression resolves upward, price action possesses a high statistical probability of rallying toward the overhead dynamic MA100 to reclaim higher liquidity shelves.
This technical framework presents an asymmetric macro reversal Long execution opportunity featuring minimal downside exposure. The optimal trading strategy is to build Long positions within the $0.106–$0.107 zone, placing a tight protective stop-loss parameter directly beneath the accumulation floor at $0.0952. The primary strategic take-profit objective targets the psychological resistance ceiling near $0.2004, offering superior risk-to-reward metrics.
Disclaimer: This is not financial advice, DYOR. $CFG #Colecolen $CVC $FIL
Centrifuge (CFG) is approaching definitive downside exhaustion on the daily timeframe as price action establishes firm structural support above the critical $0.100 psychological round-number threshold. Following an extended decline constrained beneath a macro descending trendline, recent candle behavior indicates base formation, signaling that an aggressive trend-reversal pivot is imminent.
Based on the visual data from the daily chart , the $0.095–$0.100 demand pocket has printed repeated lower-wick absorption candles, confirming that sell-side distribution momentum has completely dried up. The inability of sellers to print fresh structural lows confirms that responsive buyers are systematically absorbing remaining floating supply. Furthermore, broader market tailwinds provide an ideal backdrop for CFG to break above its descending resistance line. Once this compression resolves upward, price action possesses a high statistical probability of rallying toward the overhead dynamic MA100 to reclaim higher liquidity shelves.
This technical framework presents an asymmetric macro reversal Long execution opportunity featuring minimal downside exposure. The optimal trading strategy is to build Long positions within the $0.106–$0.107 zone, placing a tight protective stop-loss parameter directly beneath the accumulation floor at $0.0952. The primary strategic take-profit objective targets the psychological resistance ceiling near $0.2004, offering superior risk-to-reward metrics.
Disclaimer: This is not financial advice, DYOR. $CFG #Colecolen $CVC $FIL
331
RLUSD TARGETS THE CORPORATE TREASURY MARKET
Jack McDonald, Ripple’s Senior Vice President for stablecoins, said corporate treasuries are a major growth opportunity for RLUSD.
The strategy is linked to Ripple’s 1 billion USD acquisition of GTreasury last year. Ripple Treasury now serves around 1,200 corporate treasury and CFO clients, representing roughly 13 trillion USD in annual transaction volume.
RLUSD is also accelerating. Circulating supply rose more than 50% over the past month, with around 1 billion USD on XRP Ledger and 1.4 billion USD on Ethereum.
Daily transaction volume more than doubled, rising from about 200 million USD last month to roughly 750 million USD. Payments and capital markets are currently the two main use cases.
Ripple has also partnered with Franklin Templeton and DBS on tokenized money-market funds and lending-related activities.
The key point is Ripple’s corporate customer network through GTreasury. Deeper RLUSD integration into treasury operations could expand the stablecoin from crypto markets into broader financial infrastructure.
However, 13 trillion USD represents the annual transaction volume of GTreasury clients, not capital already flowing through RLUSD. Long-term demand still needs to be proven through actual usage.
Could corporate treasury activity become RLUSD’s biggest growth driver?
Please do your own research carefully before making any transactions (DYOR). $XRP $RLUSD $ETH #Colecolen
{future}(ETHUSDT)
{spot}(RLUSDUSDT)
{future}(XRPUSDT)
RLUSD TARGETS THE CORPORATE TREASURY MARKET
Jack McDonald, Ripple’s Senior Vice President for stablecoins, said corporate treasuries are a major growth opportunity for RLUSD.
The strategy is linked to Ripple’s 1 billion USD acquisition of GTreasury last year. Ripple Treasury now serves around 1,200 corporate treasury and CFO clients, representing roughly 13 trillion USD in annual transaction volume.
RLUSD is also accelerating. Circulating supply rose more than 50% over the past month, with around 1 billion USD on XRP Ledger and 1.4 billion USD on Ethereum.
Daily transaction volume more than doubled, rising from about 200 million USD last month to roughly 750 million USD. Payments and capital markets are currently the two main use cases.
Ripple has also partnered with Franklin Templeton and DBS on tokenized money-market funds and lending-related activities.
The key point is Ripple’s corporate customer network through GTreasury. Deeper RLUSD integration into treasury operations could expand the stablecoin from crypto markets into broader financial infrastructure.
However, 13 trillion USD represents the annual transaction volume of GTreasury clients, not capital already flowing through RLUSD. Long-term demand still needs to be proven through actual usage.
Could corporate treasury activity become RLUSD’s biggest growth driver?
Please do your own research carefully before making any transactions (DYOR). $XRP $RLUSD $ETH #Colecolen
Jack McDonald, Ripple’s Senior Vice President for stablecoins, said corporate treasuries are a major growth opportunity for RLUSD.
The strategy is linked to Ripple’s 1 billion USD acquisition of GTreasury last year. Ripple Treasury now serves around 1,200 corporate treasury and CFO clients, representing roughly 13 trillion USD in annual transaction volume.
RLUSD is also accelerating. Circulating supply rose more than 50% over the past month, with around 1 billion USD on XRP Ledger and 1.4 billion USD on Ethereum.
Daily transaction volume more than doubled, rising from about 200 million USD last month to roughly 750 million USD. Payments and capital markets are currently the two main use cases.
Ripple has also partnered with Franklin Templeton and DBS on tokenized money-market funds and lending-related activities.
The key point is Ripple’s corporate customer network through GTreasury. Deeper RLUSD integration into treasury operations could expand the stablecoin from crypto markets into broader financial infrastructure.
However, 13 trillion USD represents the annual transaction volume of GTreasury clients, not capital already flowing through RLUSD. Long-term demand still needs to be proven through actual usage.
Could corporate treasury activity become RLUSD’s biggest growth driver?
Please do your own research carefully before making any transactions (DYOR). $XRP $RLUSD $ETH #Colecolen

139
CPI RISES ON ENERGY, YET FED HIKE ODDS HAVE REACHED 88.9%
After the August CPI report, CME data put the probability of a Fed rate hike at next week’s meeting at 88.9%.
Gasoline prices rose 27.4% year over year and contributed more than one-third of August’s CPI increase. Core CPI, meanwhile, rose just 2.4% YoY.
The issue is that the Fed cannot directly push oil or gasoline prices lower by raising rates. If the CPI increase is mainly energy-driven, tighter monetary policy may reduce demand but does not address the source of the price shock.
There is also limited evidence so far that higher energy costs are spreading across the rest of the economy.
If the Fed raises rates next week, the move could be more precautionary than a response to underlying inflation.
If the CPI data alone are considered, the Fed still has a case for watching conditions and keeping rates unchanged rather than rushing to hike.
An 88.9% probability is a market expectation of the coming decision, not proof that CPI has forced the Fed to hike. The report shows energy remains the major source of pressure, while core CPI is still at 2.4%.
If the Fed hikes, financial conditions could tighten further despite relatively moderate core inflation. If it holds, policymakers gain more time to see whether the energy shock spreads through the economy or remains temporary.
Is the Fed reacting to actual inflation, or overreacting to the risk of future inflation?
Please do your own research carefully before making any transactions (DYOR). $BTC $SOL $ETH #Colecolen
{future}(ETHUSDT)
{future}(SOLUSDT)
{future}(BTCUSDT)
CPI RISES ON ENERGY, YET FED HIKE ODDS HAVE REACHED 88.9%
After the August CPI report, CME data put the probability of a Fed rate hike at next week’s meeting at 88.9%.
Gasoline prices rose 27.4% year over year and contributed more than one-third of August’s CPI increase. Core CPI, meanwhile, rose just 2.4% YoY.
The issue is that the Fed cannot directly push oil or gasoline prices lower by raising rates. If the CPI increase is mainly energy-driven, tighter monetary policy may reduce demand but does not address the source of the price shock.
There is also limited evidence so far that higher energy costs are spreading across the rest of the economy.
If the Fed raises rates next week, the move could be more precautionary than a response to underlying inflation.
If the CPI data alone are considered, the Fed still has a case for watching conditions and keeping rates unchanged rather than rushing to hike.
An 88.9% probability is a market expectation of the coming decision, not proof that CPI has forced the Fed to hike. The report shows energy remains the major source of pressure, while core CPI is still at 2.4%.
If the Fed hikes, financial conditions could tighten further despite relatively moderate core inflation. If it holds, policymakers gain more time to see whether the energy shock spreads through the economy or remains temporary.
Is the Fed reacting to actual inflation, or overreacting to the risk of future inflation?
Please do your own research carefully before making any transactions (DYOR). $BTC $SOL $ETH #Colecolen
After the August CPI report, CME data put the probability of a Fed rate hike at next week’s meeting at 88.9%.
Gasoline prices rose 27.4% year over year and contributed more than one-third of August’s CPI increase. Core CPI, meanwhile, rose just 2.4% YoY.
The issue is that the Fed cannot directly push oil or gasoline prices lower by raising rates. If the CPI increase is mainly energy-driven, tighter monetary policy may reduce demand but does not address the source of the price shock.
There is also limited evidence so far that higher energy costs are spreading across the rest of the economy.
If the Fed raises rates next week, the move could be more precautionary than a response to underlying inflation.
If the CPI data alone are considered, the Fed still has a case for watching conditions and keeping rates unchanged rather than rushing to hike.
An 88.9% probability is a market expectation of the coming decision, not proof that CPI has forced the Fed to hike. The report shows energy remains the major source of pressure, while core CPI is still at 2.4%.
If the Fed hikes, financial conditions could tighten further despite relatively moderate core inflation. If it holds, policymakers gain more time to see whether the energy shock spreads through the economy or remains temporary.
Is the Fed reacting to actual inflation, or overreacting to the risk of future inflation?
Please do your own research carefully before making any transactions (DYOR). $BTC $SOL $ETH #Colecolen

107
BITCOIN’S OI SHARE RISES TO 42.1% AS ALTS DELEVERAGE
Bitcoin is trading around 77,000 USD, up 0.7% from the start of the UTC day but still down 0.9% over 24 hours and roughly 6% below last week’s 82,284 USD peak.
According to Coinalyze, total crypto futures open interest fell from 62.4B USD to 59.5B USD, while 24-hour trading volume reached 94.2B USD. Liquidations rose to 256.3M USD from 142.3M USD midweek.
Bitcoin OI remained nearly flat at 25B USD, rising just 0.12% over 24 hours, yet its share climbed to 42.1% of the market. On Sept. 6, that share was around 37%, when altcoin perpetual OI first exceeded Bitcoin since December 2024.
This means Bitcoin is not regaining share through a major OI expansion. Instead, leverage is leaving altcoins faster, automatically increasing BTC’s share.
Zcash shows the clearest adjustment. ZEC OI dropped 20.1% to 1.4B USD as its price fell 9% to 1,112.10 USD, with 17.2M USD liquidated. Funding turned negative at -0.0016%, while OI had previously reached a record 2.4B USD as ZEC gained 134% in 30 days.
Hyperliquid and XRP also saw OI decline about 5% over 24 hours, to 2.5B USD and 1.2B USD respectively.
Bitcoin accounted for 60.3M USD in liquidations, while Ether saw 46.5M USD. The aggregate long/short ratio stood at 1.114, with longs at 52.67% and shorts at 47.29%, indicating a relatively balanced market.
Meanwhile, S&P 500 futures rose 0.48%, Nasdaq futures gained 0.56%, gold added 0.74% and silver climbed 0.92%. CoinMarketCap’s Altcoin Season Index stood at 38/100, back in neutral territory after reaching 51/100 on Tuesday.
The next major catalyst is August U.S. CPI, due at 8:30 a.m. ET, the last major release before the Sept. 15–16 FOMC meeting. Core CPI is expected to rise 0.2% month over month, while headline CPI is forecast at 0.4%.
(DYOR). $BTC $BCH $BNB #Colecolen
{future}(BNBUSDT)
{future}(BCHUSDT)
{future}(BTCUSDT)
BITCOIN’S OI SHARE RISES TO 42.1% AS ALTS DELEVERAGE
Bitcoin is trading around 77,000 USD, up 0.7% from the start of the UTC day but still down 0.9% over 24 hours and roughly 6% below last week’s 82,284 USD peak.
According to Coinalyze, total crypto futures open interest fell from 62.4B USD to 59.5B USD, while 24-hour trading volume reached 94.2B USD. Liquidations rose to 256.3M USD from 142.3M USD midweek.
Bitcoin OI remained nearly flat at 25B USD, rising just 0.12% over 24 hours, yet its share climbed to 42.1% of the market. On Sept. 6, that share was around 37%, when altcoin perpetual OI first exceeded Bitcoin since December 2024.
This means Bitcoin is not regaining share through a major OI expansion. Instead, leverage is leaving altcoins faster, automatically increasing BTC’s share.
Zcash shows the clearest adjustment. ZEC OI dropped 20.1% to 1.4B USD as its price fell 9% to 1,112.10 USD, with 17.2M USD liquidated. Funding turned negative at -0.0016%, while OI had previously reached a record 2.4B USD as ZEC gained 134% in 30 days.
Hyperliquid and XRP also saw OI decline about 5% over 24 hours, to 2.5B USD and 1.2B USD respectively.
Bitcoin accounted for 60.3M USD in liquidations, while Ether saw 46.5M USD. The aggregate long/short ratio stood at 1.114, with longs at 52.67% and shorts at 47.29%, indicating a relatively balanced market.
Meanwhile, S&P 500 futures rose 0.48%, Nasdaq futures gained 0.56%, gold added 0.74% and silver climbed 0.92%. CoinMarketCap’s Altcoin Season Index stood at 38/100, back in neutral territory after reaching 51/100 on Tuesday.
The next major catalyst is August U.S. CPI, due at 8:30 a.m. ET, the last major release before the Sept. 15–16 FOMC meeting. Core CPI is expected to rise 0.2% month over month, while headline CPI is forecast at 0.4%.
(DYOR). $BTC $BCH $BNB #Colecolen
Bitcoin is trading around 77,000 USD, up 0.7% from the start of the UTC day but still down 0.9% over 24 hours and roughly 6% below last week’s 82,284 USD peak.
According to Coinalyze, total crypto futures open interest fell from 62.4B USD to 59.5B USD, while 24-hour trading volume reached 94.2B USD. Liquidations rose to 256.3M USD from 142.3M USD midweek.
Bitcoin OI remained nearly flat at 25B USD, rising just 0.12% over 24 hours, yet its share climbed to 42.1% of the market. On Sept. 6, that share was around 37%, when altcoin perpetual OI first exceeded Bitcoin since December 2024.
This means Bitcoin is not regaining share through a major OI expansion. Instead, leverage is leaving altcoins faster, automatically increasing BTC’s share.
Zcash shows the clearest adjustment. ZEC OI dropped 20.1% to 1.4B USD as its price fell 9% to 1,112.10 USD, with 17.2M USD liquidated. Funding turned negative at -0.0016%, while OI had previously reached a record 2.4B USD as ZEC gained 134% in 30 days.
Hyperliquid and XRP also saw OI decline about 5% over 24 hours, to 2.5B USD and 1.2B USD respectively.
Bitcoin accounted for 60.3M USD in liquidations, while Ether saw 46.5M USD. The aggregate long/short ratio stood at 1.114, with longs at 52.67% and shorts at 47.29%, indicating a relatively balanced market.
Meanwhile, S&P 500 futures rose 0.48%, Nasdaq futures gained 0.56%, gold added 0.74% and silver climbed 0.92%. CoinMarketCap’s Altcoin Season Index stood at 38/100, back in neutral territory after reaching 51/100 on Tuesday.
The next major catalyst is August U.S. CPI, due at 8:30 a.m. ET, the last major release before the Sept. 15–16 FOMC meeting. Core CPI is expected to rise 0.2% month over month, while headline CPI is forecast at 0.4%.
(DYOR). $BTC $BCH $BNB #Colecolen

206 Atlas:
Listing dates doesn't create a catalyst. The Fed is likely on hold, so price action will be driven by liquidity, not these specific headlines.Altcoin deleveraging driving BTC OI share, not capital inflow. This structural weakness in alts suggests limited upside for the broader market until leverage stabilizes.
1
108
·
--
Рост
BLOCK WANTS TO BRING BITCOIN AND STABLECOINS INTO THE FEDERAL BANKING FRAMEWORK
Jack Dorsey’s Block has applied to the U.S. Office of the Comptroller of the Currency (OCC) to establish Builders Bank & Trust, aiming to bring Bitcoin and stablecoin custody under the federal banking framework.
If approved by the OCC, the new bank could hold Bitcoin and stablecoins for clients while providing trust and asset-management services. The model would operate under federal oversight rather than relying primarily on separate state licenses.
Importantly, Builders Bank & Trust would not be a traditional retail bank. It would not offer checking or savings accounts, accept USD deposits, or provide loans.
This shows Block is focusing on digital-asset infrastructure, particularly custody and asset management, rather than consumer lending. Bitcoin and stablecoins would sit at the center of the new bank’s services.
If approved, Builders Bank & Trust could create another bridge between digital assets and the federally regulated financial system. However, filing an application does not mean the bank has been authorized to operate.
The OCC still needs to review and decide on the application, so the actual scope of services will depend on the approval process.
The move is notable because Block is not trying to turn crypto into a mainstream retail banking service. Instead, it is testing a specialized model for trust, custody and digital-asset management.
If approved, Builders Bank & Trust would offer a notable test of how digital assets can fit inside the U.S. federal banking framework.
Could a crypto custody-focused bank become a new strategic direction for Block and the U.S. crypto market?
Please do your own research carefully before making any transactions (DYOR). $BTC $LAB $BEAT #Colecolen
{future}(BEATUSDT)
{future}(LABUSDT)
{future}(BTCUSDT)
BLOCK WANTS TO BRING BITCOIN AND STABLECOINS INTO THE FEDERAL BANKING FRAMEWORK
Jack Dorsey’s Block has applied to the U.S. Office of the Comptroller of the Currency (OCC) to establish Builders Bank & Trust, aiming to bring Bitcoin and stablecoin custody under the federal banking framework.
If approved by the OCC, the new bank could hold Bitcoin and stablecoins for clients while providing trust and asset-management services. The model would operate under federal oversight rather than relying primarily on separate state licenses.
Importantly, Builders Bank & Trust would not be a traditional retail bank. It would not offer checking or savings accounts, accept USD deposits, or provide loans.
This shows Block is focusing on digital-asset infrastructure, particularly custody and asset management, rather than consumer lending. Bitcoin and stablecoins would sit at the center of the new bank’s services.
If approved, Builders Bank & Trust could create another bridge between digital assets and the federally regulated financial system. However, filing an application does not mean the bank has been authorized to operate.
The OCC still needs to review and decide on the application, so the actual scope of services will depend on the approval process.
The move is notable because Block is not trying to turn crypto into a mainstream retail banking service. Instead, it is testing a specialized model for trust, custody and digital-asset management.
If approved, Builders Bank & Trust would offer a notable test of how digital assets can fit inside the U.S. federal banking framework.
Could a crypto custody-focused bank become a new strategic direction for Block and the U.S. crypto market?
Please do your own research carefully before making any transactions (DYOR). $BTC $LAB $BEAT #Colecolen
Jack Dorsey’s Block has applied to the U.S. Office of the Comptroller of the Currency (OCC) to establish Builders Bank & Trust, aiming to bring Bitcoin and stablecoin custody under the federal banking framework.
If approved by the OCC, the new bank could hold Bitcoin and stablecoins for clients while providing trust and asset-management services. The model would operate under federal oversight rather than relying primarily on separate state licenses.
Importantly, Builders Bank & Trust would not be a traditional retail bank. It would not offer checking or savings accounts, accept USD deposits, or provide loans.
This shows Block is focusing on digital-asset infrastructure, particularly custody and asset management, rather than consumer lending. Bitcoin and stablecoins would sit at the center of the new bank’s services.
If approved, Builders Bank & Trust could create another bridge between digital assets and the federally regulated financial system. However, filing an application does not mean the bank has been authorized to operate.
The OCC still needs to review and decide on the application, so the actual scope of services will depend on the approval process.
The move is notable because Block is not trying to turn crypto into a mainstream retail banking service. Instead, it is testing a specialized model for trust, custody and digital-asset management.
If approved, Builders Bank & Trust would offer a notable test of how digital assets can fit inside the U.S. federal banking framework.
Could a crypto custody-focused bank become a new strategic direction for Block and the U.S. crypto market?
Please do your own research carefully before making any transactions (DYOR). $BTC $LAB $BEAT #Colecolen

2
87
·
--
Рост
ASTER: Tight Compression at Apex of Ascending Triangle – Strategic Dip Long Near Dynamic MA100 with Over 3:1 RR Targeting $0.80
ASTER is approaching a critical volatility squeeze near the apex of a macro ascending triangle on the daily timeframe. While the foundational structure of higher lows remains firmly intact, the psychological round-number resistance at $0.80 continues to prove itself as a formidable barrier, evidenced by repeated upper-wick rejections and aggressive distribution over recent weeks.
Based on the visual data from the daily chart , impulsively chasing Long positions at the current mid-range level near $0.686 carries unfavorable drawdown risks. The active downward retracement offers an optimal accumulation setup as price action drifts toward a high-confluence technical shelf. This critical demand floor is defined by the upward-sloping dynamic MA100 line converging with the macro ascending support trendline near the $0.655 pocket. This zone represents institutional defense territory, where smart money consistently steps in to exhaust localized sell-side pressure and spark an aggressive mean-reversion bounce.
The optimal trading strategy is to wait for price action to test this $0.655 confluence base to execute a swing Long, anchoring a tight protective stop-loss parameter directly beneath the ascending support shelf at $0.619. The primary strategic take-profit objective targets the horizontal resistance ceiling across the $0.791–$0.800 zone, securing an exceptional risk-to-reward ratio exceeding 3:1.
Disclaimer: This is not financial advice, DYOR. $ASTER #aster #Colecolen
{future}(ASTERUSDT)
ASTER: Tight Compression at Apex of Ascending Triangle – Strategic Dip Long Near Dynamic MA100 with Over 3:1 RR Targeting $0.80
ASTER is approaching a critical volatility squeeze near the apex of a macro ascending triangle on the daily timeframe. While the foundational structure of higher lows remains firmly intact, the psychological round-number resistance at $0.80 continues to prove itself as a formidable barrier, evidenced by repeated upper-wick rejections and aggressive distribution over recent weeks.
Based on the visual data from the daily chart , impulsively chasing Long positions at the current mid-range level near $0.686 carries unfavorable drawdown risks. The active downward retracement offers an optimal accumulation setup as price action drifts toward a high-confluence technical shelf. This critical demand floor is defined by the upward-sloping dynamic MA100 line converging with the macro ascending support trendline near the $0.655 pocket. This zone represents institutional defense territory, where smart money consistently steps in to exhaust localized sell-side pressure and spark an aggressive mean-reversion bounce.
The optimal trading strategy is to wait for price action to test this $0.655 confluence base to execute a swing Long, anchoring a tight protective stop-loss parameter directly beneath the ascending support shelf at $0.619. The primary strategic take-profit objective targets the horizontal resistance ceiling across the $0.791–$0.800 zone, securing an exceptional risk-to-reward ratio exceeding 3:1.
Disclaimer: This is not financial advice, DYOR. $ASTER #aster #Colecolen
ASTER is approaching a critical volatility squeeze near the apex of a macro ascending triangle on the daily timeframe. While the foundational structure of higher lows remains firmly intact, the psychological round-number resistance at $0.80 continues to prove itself as a formidable barrier, evidenced by repeated upper-wick rejections and aggressive distribution over recent weeks.
Based on the visual data from the daily chart , impulsively chasing Long positions at the current mid-range level near $0.686 carries unfavorable drawdown risks. The active downward retracement offers an optimal accumulation setup as price action drifts toward a high-confluence technical shelf. This critical demand floor is defined by the upward-sloping dynamic MA100 line converging with the macro ascending support trendline near the $0.655 pocket. This zone represents institutional defense territory, where smart money consistently steps in to exhaust localized sell-side pressure and spark an aggressive mean-reversion bounce.
The optimal trading strategy is to wait for price action to test this $0.655 confluence base to execute a swing Long, anchoring a tight protective stop-loss parameter directly beneath the ascending support shelf at $0.619. The primary strategic take-profit objective targets the horizontal resistance ceiling across the $0.791–$0.800 zone, securing an exceptional risk-to-reward ratio exceeding 3:1.
Disclaimer: This is not financial advice, DYOR. $ASTER #aster #Colecolen

259
PUMP.FUN OPENS CUSTOM PAIRS, BRINGING MEMECOINS CLOSER TO TOKENIZED STOCKS
On Sept. 10, pump.fun launched Custom Pairs, allowing new memecoins to pair with tokenized stocks, indices, crypto and precious metals instead of SOL or USDC.
Through its partnership with Sunrise, pump.fun added 20 assets, including BA, BABA, COST, DELL, DJT, HIMS, IBM, JNJ, LMT, LULU, MGM, PFE, QUBT, RBLX, RDDT, RIVN, SHOP, SNAP and UPS. Combined with xStocks, the system now offers 93 quote assets.
Fees on the Bonding Curve and PumpSwap remain unchanged from regular tokens. Notably, 50% of revenue generated by Custom Pairs will automatically enter a smart contract for PUMP buybacks and burns.
Creators can choose a Creator Fee ranging from 0.05% to 1% per trade, or Cashback to return the fee to buyers. These rewards are paid in the quote asset itself. If a memecoin is paired with tokenized NVDA, for example, rewards can be paid in NVDA rather than SOL or USDC.
The feature has drawn criticism because of its timing. Custom Pairs arrives as Stonk gains attention with a similar model linking memecoins to multiple asset types, leading parts of the community to accuse pump.fun of following Stonk’s trend.
Stonk gained attention through ZCAT, a memecoin linked to ZEC. ZCAT once reached a market cap of about 183M USD before falling toward 91M USD. Each trade carries a 3% fee, with most of it used to acquire ZEC and distribute rewards to eligible ZCAT holders.
pump.fun has scale on Solana, while Custom Pairs makes the quote asset part of the fee and reward mechanism.
Expanding to 93 assets could give memecoins new narratives and economic models, but also adds complexity. Liquidity and real demand remain the key factors.
Is Custom Pairs a logical expansion for pump.fun, or simply a move following Stonk’s model?
Please do your own research carefully before making any transactions (DYOR). $PUMP $ZEC $SOL #Colecolen
{future}(SOLUSDT)
{future}(ZECUSDT)
{future}(PUMPUSDT)
PUMP.FUN OPENS CUSTOM PAIRS, BRINGING MEMECOINS CLOSER TO TOKENIZED STOCKS
On Sept. 10, pump.fun launched Custom Pairs, allowing new memecoins to pair with tokenized stocks, indices, crypto and precious metals instead of SOL or USDC.
Through its partnership with Sunrise, pump.fun added 20 assets, including BA, BABA, COST, DELL, DJT, HIMS, IBM, JNJ, LMT, LULU, MGM, PFE, QUBT, RBLX, RDDT, RIVN, SHOP, SNAP and UPS. Combined with xStocks, the system now offers 93 quote assets.
Fees on the Bonding Curve and PumpSwap remain unchanged from regular tokens. Notably, 50% of revenue generated by Custom Pairs will automatically enter a smart contract for PUMP buybacks and burns.
Creators can choose a Creator Fee ranging from 0.05% to 1% per trade, or Cashback to return the fee to buyers. These rewards are paid in the quote asset itself. If a memecoin is paired with tokenized NVDA, for example, rewards can be paid in NVDA rather than SOL or USDC.
The feature has drawn criticism because of its timing. Custom Pairs arrives as Stonk gains attention with a similar model linking memecoins to multiple asset types, leading parts of the community to accuse pump.fun of following Stonk’s trend.
Stonk gained attention through ZCAT, a memecoin linked to ZEC. ZCAT once reached a market cap of about 183M USD before falling toward 91M USD. Each trade carries a 3% fee, with most of it used to acquire ZEC and distribute rewards to eligible ZCAT holders.
pump.fun has scale on Solana, while Custom Pairs makes the quote asset part of the fee and reward mechanism.
Expanding to 93 assets could give memecoins new narratives and economic models, but also adds complexity. Liquidity and real demand remain the key factors.
Is Custom Pairs a logical expansion for pump.fun, or simply a move following Stonk’s model?
Please do your own research carefully before making any transactions (DYOR). $PUMP $ZEC $SOL #Colecolen
On Sept. 10, pump.fun launched Custom Pairs, allowing new memecoins to pair with tokenized stocks, indices, crypto and precious metals instead of SOL or USDC.
Through its partnership with Sunrise, pump.fun added 20 assets, including BA, BABA, COST, DELL, DJT, HIMS, IBM, JNJ, LMT, LULU, MGM, PFE, QUBT, RBLX, RDDT, RIVN, SHOP, SNAP and UPS. Combined with xStocks, the system now offers 93 quote assets.
Fees on the Bonding Curve and PumpSwap remain unchanged from regular tokens. Notably, 50% of revenue generated by Custom Pairs will automatically enter a smart contract for PUMP buybacks and burns.
Creators can choose a Creator Fee ranging from 0.05% to 1% per trade, or Cashback to return the fee to buyers. These rewards are paid in the quote asset itself. If a memecoin is paired with tokenized NVDA, for example, rewards can be paid in NVDA rather than SOL or USDC.
The feature has drawn criticism because of its timing. Custom Pairs arrives as Stonk gains attention with a similar model linking memecoins to multiple asset types, leading parts of the community to accuse pump.fun of following Stonk’s trend.
Stonk gained attention through ZCAT, a memecoin linked to ZEC. ZCAT once reached a market cap of about 183M USD before falling toward 91M USD. Each trade carries a 3% fee, with most of it used to acquire ZEC and distribute rewards to eligible ZCAT holders.
pump.fun has scale on Solana, while Custom Pairs makes the quote asset part of the fee and reward mechanism.
Expanding to 93 assets could give memecoins new narratives and economic models, but also adds complexity. Liquidity and real demand remain the key factors.
Is Custom Pairs a logical expansion for pump.fun, or simply a move following Stonk’s model?
Please do your own research carefully before making any transactions (DYOR). $PUMP $ZEC $SOL #Colecolen

360
CANARY CAPITAL BRINGS THE FIRST STAKED TRON ETF TO THE U.S.
Canary Capital has launched the Canary Staked TRX ETF under ticker TRXS on Cboe BZX Exchange on Sept. 9, marking the first staked TRON ETF to trade in the U.S. The fund charges a 1.10% annual management fee; BitGo provides custody for all TRX.
Its key difference is built-in staking. Under normal conditions, at least 90% of the fund’s TRX will be staked to validate the TRON network and generate rewards.
The rewards are not distributed directly to shareholders. After related costs are deducted, earned TRX is reflected in the fund’s NAV, adding staking yield alongside TRX price performance.
CoinDesk Indices provides the benchmark used to calculate daily NAV. The unstaked portion is retained for redemptions, operating expenses and liquidity needs.
TRXS arrives as U.S. crypto ETFs expand beyond Bitcoin and Ethereum. Last week, spot Bitcoin ETFs recorded about 987M USD in net inflows and Ethereum ETFs received 218.4M USD; Solana, XRP and HYPE ETFs posted 6.18M USD, 18.96M USD and 12.27M USD respectively.
TRXS gives TRX exposure through a traditional financial structure while adding staking yield. However, the 1.10% annual fee, TRX volatility and staking costs still directly affect actual performance.
TRX currently has a market cap of about 32.1B USD, ranking eighth in crypto, and trades near 0.33 USD, up around 0.3% over 24 hours after the launch news. The initial price reaction has therefore been modest.
TRXS is more than another way to access TRX. Embedding staking into an ETF structure shows that yield from PoS blockchains is gradually being packaged into traditional financial products in the U.S.
Could staking ETFs become the next major expansion path for crypto ETFs in the U.S.?
Please do your own research carefully before making any transactions (DYOR). $TRX $METIS $SAGA #Colecolen
{future}(SAGAUSDT)
{future}(METISUSDT)
{future}(TRXUSDT)
CANARY CAPITAL BRINGS THE FIRST STAKED TRON ETF TO THE U.S.
Canary Capital has launched the Canary Staked TRX ETF under ticker TRXS on Cboe BZX Exchange on Sept. 9, marking the first staked TRON ETF to trade in the U.S. The fund charges a 1.10% annual management fee; BitGo provides custody for all TRX.
Its key difference is built-in staking. Under normal conditions, at least 90% of the fund’s TRX will be staked to validate the TRON network and generate rewards.
The rewards are not distributed directly to shareholders. After related costs are deducted, earned TRX is reflected in the fund’s NAV, adding staking yield alongside TRX price performance.
CoinDesk Indices provides the benchmark used to calculate daily NAV. The unstaked portion is retained for redemptions, operating expenses and liquidity needs.
TRXS arrives as U.S. crypto ETFs expand beyond Bitcoin and Ethereum. Last week, spot Bitcoin ETFs recorded about 987M USD in net inflows and Ethereum ETFs received 218.4M USD; Solana, XRP and HYPE ETFs posted 6.18M USD, 18.96M USD and 12.27M USD respectively.
TRXS gives TRX exposure through a traditional financial structure while adding staking yield. However, the 1.10% annual fee, TRX volatility and staking costs still directly affect actual performance.
TRX currently has a market cap of about 32.1B USD, ranking eighth in crypto, and trades near 0.33 USD, up around 0.3% over 24 hours after the launch news. The initial price reaction has therefore been modest.
TRXS is more than another way to access TRX. Embedding staking into an ETF structure shows that yield from PoS blockchains is gradually being packaged into traditional financial products in the U.S.
Could staking ETFs become the next major expansion path for crypto ETFs in the U.S.?
Please do your own research carefully before making any transactions (DYOR). $TRX $METIS $SAGA #Colecolen
Canary Capital has launched the Canary Staked TRX ETF under ticker TRXS on Cboe BZX Exchange on Sept. 9, marking the first staked TRON ETF to trade in the U.S. The fund charges a 1.10% annual management fee; BitGo provides custody for all TRX.
Its key difference is built-in staking. Under normal conditions, at least 90% of the fund’s TRX will be staked to validate the TRON network and generate rewards.
The rewards are not distributed directly to shareholders. After related costs are deducted, earned TRX is reflected in the fund’s NAV, adding staking yield alongside TRX price performance.
CoinDesk Indices provides the benchmark used to calculate daily NAV. The unstaked portion is retained for redemptions, operating expenses and liquidity needs.
TRXS arrives as U.S. crypto ETFs expand beyond Bitcoin and Ethereum. Last week, spot Bitcoin ETFs recorded about 987M USD in net inflows and Ethereum ETFs received 218.4M USD; Solana, XRP and HYPE ETFs posted 6.18M USD, 18.96M USD and 12.27M USD respectively.
TRXS gives TRX exposure through a traditional financial structure while adding staking yield. However, the 1.10% annual fee, TRX volatility and staking costs still directly affect actual performance.
TRX currently has a market cap of about 32.1B USD, ranking eighth in crypto, and trades near 0.33 USD, up around 0.3% over 24 hours after the launch news. The initial price reaction has therefore been modest.
TRXS is more than another way to access TRX. Embedding staking into an ETF structure shows that yield from PoS blockchains is gradually being packaged into traditional financial products in the U.S.
Could staking ETFs become the next major expansion path for crypto ETFs in the U.S.?
Please do your own research carefully before making any transactions (DYOR). $TRX $METIS $SAGA #Colecolen

115
·
--
Рост
ETHFI: Completes Textbook Inverse Head and Shoulders – Strategic Breakout Long Above Neckline Targeting $1.00 Milestone
(ETHFI) is confirming a decisive macro trend-reversal breakout on the daily timeframe, highlighted by the successful completion of a textbook Inverse Head and Shoulders pattern. Slicing cleanly through the horizontal neckline resistance officially terminates months of aggressive bottom discovery, initiating a powerful secondary expansion phase.
Based on the visual data from the daily chart , the active daily candle is expanding vigorously toward the $0.676 handle on a massive surge in buy volume. This aggressive volume influx verifies that institutional liquidity has stepped in to thoroughly overpower overhead supply, driving price action well above the upward-curving dynamic MA100 line. Residual sell-side distribution across the Right Shoulder formation has been systematically absorbed. With the structural neckline shelf near $0.65–$0.66 successfully flipping into a solid demand base, technical odds heavily favor an impulsive extension leg fulfilling the measured move target of the macro reversal structure.
This technical environment delivers a prime textbook Long execution opportunity featuring exceptionally tight risk parameters. The optimal trading strategy is to initiate Long positions around the current $0.669–$0.676 zone, anchoring a protective stop-loss parameter directly beneath the neckline cushion at $0.6405. The primary strategic take-profit objective targets the psychological round-number expansion ceiling at $1.0076.
Disclaimer: This is not financial advice, DYOR. $ETHFI $SAGA $ASTER #Colecolen
{future}(ASTERUSDT)
{future}(SAGAUSDT)
{future}(ETHFIUSDT)
ETHFI: Completes Textbook Inverse Head and Shoulders – Strategic Breakout Long Above Neckline Targeting $1.00 Milestone
(ETHFI) is confirming a decisive macro trend-reversal breakout on the daily timeframe, highlighted by the successful completion of a textbook Inverse Head and Shoulders pattern. Slicing cleanly through the horizontal neckline resistance officially terminates months of aggressive bottom discovery, initiating a powerful secondary expansion phase.
Based on the visual data from the daily chart , the active daily candle is expanding vigorously toward the $0.676 handle on a massive surge in buy volume. This aggressive volume influx verifies that institutional liquidity has stepped in to thoroughly overpower overhead supply, driving price action well above the upward-curving dynamic MA100 line. Residual sell-side distribution across the Right Shoulder formation has been systematically absorbed. With the structural neckline shelf near $0.65–$0.66 successfully flipping into a solid demand base, technical odds heavily favor an impulsive extension leg fulfilling the measured move target of the macro reversal structure.
This technical environment delivers a prime textbook Long execution opportunity featuring exceptionally tight risk parameters. The optimal trading strategy is to initiate Long positions around the current $0.669–$0.676 zone, anchoring a protective stop-loss parameter directly beneath the neckline cushion at $0.6405. The primary strategic take-profit objective targets the psychological round-number expansion ceiling at $1.0076.
Disclaimer: This is not financial advice, DYOR. $ETHFI $SAGA $ASTER #Colecolen
(ETHFI) is confirming a decisive macro trend-reversal breakout on the daily timeframe, highlighted by the successful completion of a textbook Inverse Head and Shoulders pattern. Slicing cleanly through the horizontal neckline resistance officially terminates months of aggressive bottom discovery, initiating a powerful secondary expansion phase.
Based on the visual data from the daily chart , the active daily candle is expanding vigorously toward the $0.676 handle on a massive surge in buy volume. This aggressive volume influx verifies that institutional liquidity has stepped in to thoroughly overpower overhead supply, driving price action well above the upward-curving dynamic MA100 line. Residual sell-side distribution across the Right Shoulder formation has been systematically absorbed. With the structural neckline shelf near $0.65–$0.66 successfully flipping into a solid demand base, technical odds heavily favor an impulsive extension leg fulfilling the measured move target of the macro reversal structure.
This technical environment delivers a prime textbook Long execution opportunity featuring exceptionally tight risk parameters. The optimal trading strategy is to initiate Long positions around the current $0.669–$0.676 zone, anchoring a protective stop-loss parameter directly beneath the neckline cushion at $0.6405. The primary strategic take-profit objective targets the psychological round-number expansion ceiling at $1.0076.
Disclaimer: This is not financial advice, DYOR. $ETHFI $SAGA $ASTER #Colecolen

addijutt:
Sl hit
1
531
·
--
Рост
CAKE: Secondary Long Entry Triggered by Weekly Close Above Dynamic MA100 – High-RR Wave Targeting $4.68 Upper Range Floor
PancakeSwap (CAKE) is offering an exceptional secondary trend-continuation entry on the weekly timeframe (1W) for traders who missed the initial accumulation phase at historical lows. While standard range-trading methodology dictates buying the channel floor around the $1.10–$1.20 demand pocket, current price action provides a high-conviction confirmation entry based on momentum expansion.
Based on the visual data from the weekly chart , CAKE’s multi-year macro structure continues to trade cleanly within an expansive horizontal consolidation channel. The active weekly candle near the $2.14 handle is striving to secure a decisive close above the dynamic MA100 trendline. A confirmed close above this benchmark indicator proves that buyers have systematically absorbed localized profit-taking supply following the 100% markup off the floor. With the dynamic MA100 converting into a structural support base, buy-side momentum is well-positioned to drive a full mean-reversion rotation from the range floor to the upper range ceiling.
The optimal trading strategy is to wait for the weekly candle to confirm its close above the MA100 to trigger Long positions around the $2.13–$2.14 zone, anchoring a tight protective stop-loss parameter directly beneath converted support at $1.921. The primary strategic take-profit objective targets the upper boundary of the macro consolidation box across the $4.68–$5.00 resistance shelf, securing an asymmetric risk-to-reward ratio.
Disclaimer: This is not financial advice, DYOR. $CAKE $FF $TAC #Colecolen
{future}(TACUSDT)
{future}(FFUSDT)
{future}(CAKEUSDT)
CAKE: Secondary Long Entry Triggered by Weekly Close Above Dynamic MA100 – High-RR Wave Targeting $4.68 Upper Range Floor
PancakeSwap (CAKE) is offering an exceptional secondary trend-continuation entry on the weekly timeframe (1W) for traders who missed the initial accumulation phase at historical lows. While standard range-trading methodology dictates buying the channel floor around the $1.10–$1.20 demand pocket, current price action provides a high-conviction confirmation entry based on momentum expansion.
Based on the visual data from the weekly chart , CAKE’s multi-year macro structure continues to trade cleanly within an expansive horizontal consolidation channel. The active weekly candle near the $2.14 handle is striving to secure a decisive close above the dynamic MA100 trendline. A confirmed close above this benchmark indicator proves that buyers have systematically absorbed localized profit-taking supply following the 100% markup off the floor. With the dynamic MA100 converting into a structural support base, buy-side momentum is well-positioned to drive a full mean-reversion rotation from the range floor to the upper range ceiling.
The optimal trading strategy is to wait for the weekly candle to confirm its close above the MA100 to trigger Long positions around the $2.13–$2.14 zone, anchoring a tight protective stop-loss parameter directly beneath converted support at $1.921. The primary strategic take-profit objective targets the upper boundary of the macro consolidation box across the $4.68–$5.00 resistance shelf, securing an asymmetric risk-to-reward ratio.
Disclaimer: This is not financial advice, DYOR. $CAKE $FF $TAC #Colecolen
PancakeSwap (CAKE) is offering an exceptional secondary trend-continuation entry on the weekly timeframe (1W) for traders who missed the initial accumulation phase at historical lows. While standard range-trading methodology dictates buying the channel floor around the $1.10–$1.20 demand pocket, current price action provides a high-conviction confirmation entry based on momentum expansion.
Based on the visual data from the weekly chart , CAKE’s multi-year macro structure continues to trade cleanly within an expansive horizontal consolidation channel. The active weekly candle near the $2.14 handle is striving to secure a decisive close above the dynamic MA100 trendline. A confirmed close above this benchmark indicator proves that buyers have systematically absorbed localized profit-taking supply following the 100% markup off the floor. With the dynamic MA100 converting into a structural support base, buy-side momentum is well-positioned to drive a full mean-reversion rotation from the range floor to the upper range ceiling.
The optimal trading strategy is to wait for the weekly candle to confirm its close above the MA100 to trigger Long positions around the $2.13–$2.14 zone, anchoring a tight protective stop-loss parameter directly beneath converted support at $1.921. The primary strategic take-profit objective targets the upper boundary of the macro consolidation box across the $4.68–$5.00 resistance shelf, securing an asymmetric risk-to-reward ratio.
Disclaimer: This is not financial advice, DYOR. $CAKE $FF $TAC #Colecolen

669
·
--
Падение
The SAHARA daily chart on image_15f212.png confirms price action failing to overcome the critical $0.010 psychological barrier, facing severe rejection at the declining dynamic MA100 line. A sharp bearish candle near $0.00942 confirms buyer exhaustion and validates a textbook bull trap against dominant overhead supply. The optimal approach is to execute a macro Short near $0.00933–$0.00942 with a protective stop-loss parameter above $0.01160, targeting the $0.00108 support floor. $SAHARA $VTHO $NET #Colecolen
{future}(NETUSDT)
{future}(VTHOUSDT)
{future}(SAHARAUSDT)
The SAHARA daily chart on image_15f212.png confirms price action failing to overcome the critical $0.010 psychological barrier, facing severe rejection at the declining dynamic MA100 line. A sharp bearish candle near $0.00942 confirms buyer exhaustion and validates a textbook bull trap against dominant overhead supply. The optimal approach is to execute a macro Short near $0.00933–$0.00942 with a protective stop-loss parameter above $0.01160, targeting the $0.00108 support floor. $SAHARA $VTHO $NET #Colecolen
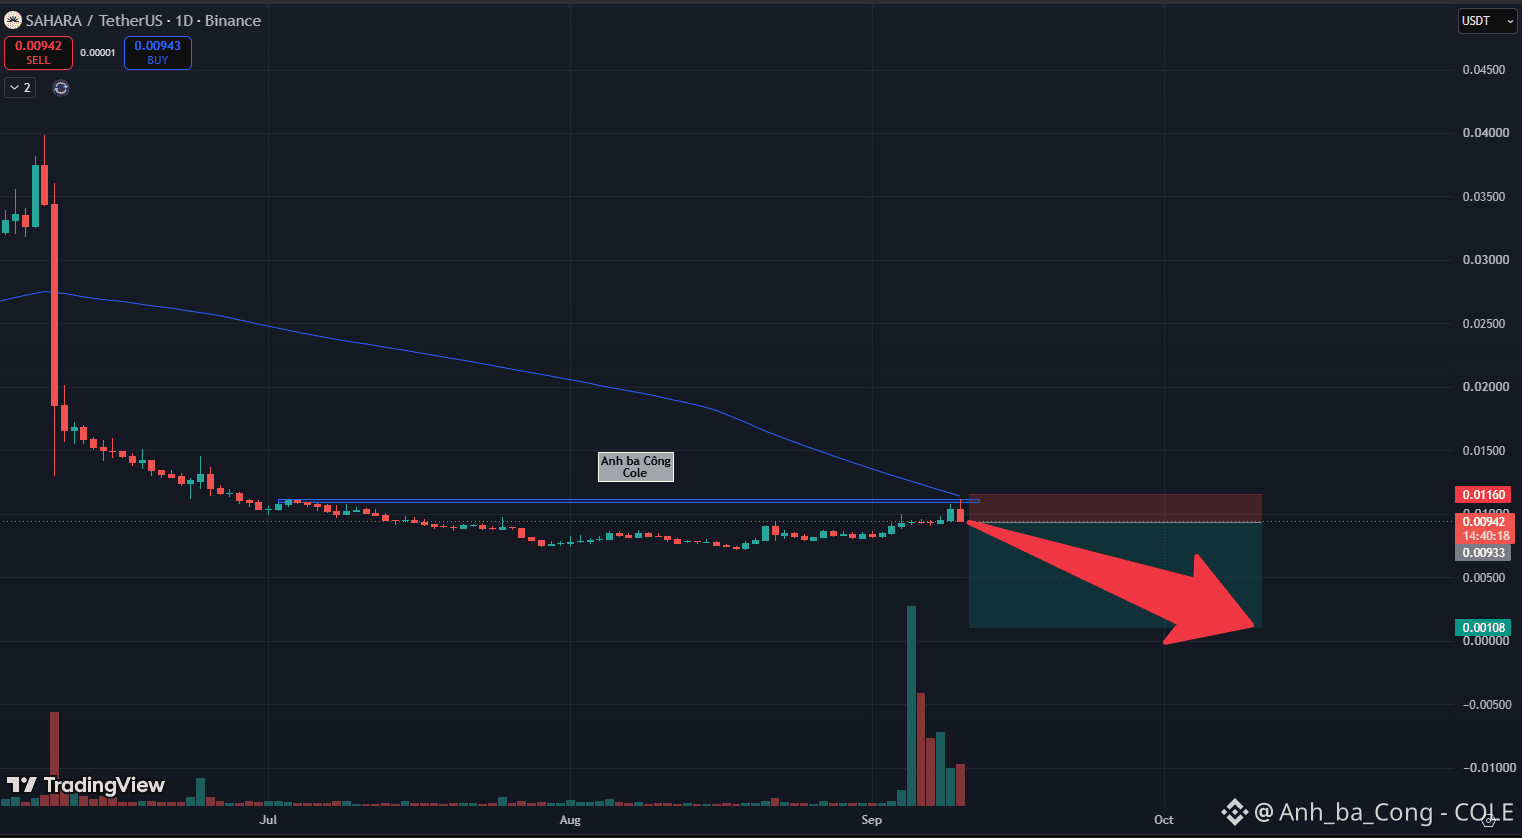
401
ALTCOIN PERPETUAL OPEN INTEREST SURPASSES BITCOIN FOR THE FIRST TIME SINCE DECEMBER 2024
According to Coinalyze, on September 6, altcoin perpetual open interest (OI) surpassed Bitcoin for the first time since December 2024.
Bitcoin perpetual OI stood at around 23.9 billion USD, representing 37% of tracked positions. Adding another 1.2 billion USD in dated futures, total BTC OI reached nearly 25 billion USD on September 7.
Zcash was the biggest individual contributor. ZEC open interest hit a record 2.4 billion USD as its price gained 134% over 30 days. On September 4, ZEC briefly reached 1,023 USD after a near-20% jump, forcing around 34 million USD in short positions to close.
However, 2.4 billion USD represents only about 6% of total altcoin OI. SOL and XRP also contributed to the higher aggregate OI, showing that the crossover reflects broader participation rather than a single-token move.
OI includes both longs and shorts, so a higher figure does not reveal which side dominates. The crossover could reverse if Bitcoin OI rises again or altcoin leverage is liquidated.
In spot markets, the market cap of altcoins outside the top 10 has surpassed 200 billion USD, up more than 10% since early September. Total crypto market cap is around 2.70 trillion USD, while Bitcoin dominance fell from 60.41% to 59.2%.
Three key events are approaching: U.S. CPI on September 11, the CLARITY Act cloture vote on September 15, and the Fed decision on September 16. Markets price a 60% chance of a 25-basis-point hike.
Altcoin OI is now at its strongest relative position against Bitcoin since December 2024, but the data reflects a shift in positioning rather than a confirmed sustainable price trend.
Will leverage moving into altcoins fuel another rally, or become a risk when volatility intensifies?
Please do your own research carefully before making any transactions (DYOR). $ZEC $IOST $VTHO #Colecolen
{future}(VTHOUSDT)
{future}(IOSTUSDT)
{future}(ZECUSDT)
ALTCOIN PERPETUAL OPEN INTEREST SURPASSES BITCOIN FOR THE FIRST TIME SINCE DECEMBER 2024
According to Coinalyze, on September 6, altcoin perpetual open interest (OI) surpassed Bitcoin for the first time since December 2024.
Bitcoin perpetual OI stood at around 23.9 billion USD, representing 37% of tracked positions. Adding another 1.2 billion USD in dated futures, total BTC OI reached nearly 25 billion USD on September 7.
Zcash was the biggest individual contributor. ZEC open interest hit a record 2.4 billion USD as its price gained 134% over 30 days. On September 4, ZEC briefly reached 1,023 USD after a near-20% jump, forcing around 34 million USD in short positions to close.
However, 2.4 billion USD represents only about 6% of total altcoin OI. SOL and XRP also contributed to the higher aggregate OI, showing that the crossover reflects broader participation rather than a single-token move.
OI includes both longs and shorts, so a higher figure does not reveal which side dominates. The crossover could reverse if Bitcoin OI rises again or altcoin leverage is liquidated.
In spot markets, the market cap of altcoins outside the top 10 has surpassed 200 billion USD, up more than 10% since early September. Total crypto market cap is around 2.70 trillion USD, while Bitcoin dominance fell from 60.41% to 59.2%.
Three key events are approaching: U.S. CPI on September 11, the CLARITY Act cloture vote on September 15, and the Fed decision on September 16. Markets price a 60% chance of a 25-basis-point hike.
Altcoin OI is now at its strongest relative position against Bitcoin since December 2024, but the data reflects a shift in positioning rather than a confirmed sustainable price trend.
Will leverage moving into altcoins fuel another rally, or become a risk when volatility intensifies?
Please do your own research carefully before making any transactions (DYOR). $ZEC $IOST $VTHO #Colecolen
According to Coinalyze, on September 6, altcoin perpetual open interest (OI) surpassed Bitcoin for the first time since December 2024.
Bitcoin perpetual OI stood at around 23.9 billion USD, representing 37% of tracked positions. Adding another 1.2 billion USD in dated futures, total BTC OI reached nearly 25 billion USD on September 7.
Zcash was the biggest individual contributor. ZEC open interest hit a record 2.4 billion USD as its price gained 134% over 30 days. On September 4, ZEC briefly reached 1,023 USD after a near-20% jump, forcing around 34 million USD in short positions to close.
However, 2.4 billion USD represents only about 6% of total altcoin OI. SOL and XRP also contributed to the higher aggregate OI, showing that the crossover reflects broader participation rather than a single-token move.
OI includes both longs and shorts, so a higher figure does not reveal which side dominates. The crossover could reverse if Bitcoin OI rises again or altcoin leverage is liquidated.
In spot markets, the market cap of altcoins outside the top 10 has surpassed 200 billion USD, up more than 10% since early September. Total crypto market cap is around 2.70 trillion USD, while Bitcoin dominance fell from 60.41% to 59.2%.
Three key events are approaching: U.S. CPI on September 11, the CLARITY Act cloture vote on September 15, and the Fed decision on September 16. Markets price a 60% chance of a 25-basis-point hike.
Altcoin OI is now at its strongest relative position against Bitcoin since December 2024, but the data reflects a shift in positioning rather than a confirmed sustainable price trend.
Will leverage moving into altcoins fuel another rally, or become a risk when volatility intensifies?
Please do your own research carefully before making any transactions (DYOR). $ZEC $IOST $VTHO #Colecolen

4
1k
XRP MOVES ABOVE BOTH MAs, BUT THE GOLDEN CROSS IS STILL UNCONFIRMED
August’s rebound pushed XRP above its 50-day and 200-day SMAs, but has not confirmed a reversal. XRP climbed from 1.00 USD on August 18 to an intraday high of 1.6996 USD on August 22, before pulling back toward 1.42 USD.
Importantly, trading above both MAs does not mean a golden cross. The 50-day SMA remains below the 200-day SMA; a golden cross only appears when the shorter average crosses above the longer one. Since MAs are based on past closing prices, the signal is inherently lagging and confirms an established trend.
XRP’s 2025 history shows the same pattern. The golden cross appeared after XRP had already risen from 2.20 to 3.60 USD, meaning the crossover itself did not cause the rally.
The 1.35 USD level is now key support; a break below could expose 1.28 USD. Above, 1.44–1.46 USD is being watched; a close above 1.46 USD could open the path toward 1.50–1.52 USD.
Three upcoming events could affect price: U.S. CPI on September 11, the CLARITY Act cloture vote on September 15, and the Fed rate decision on September 16. Markets are pricing a 60% chance of a 25-basis-point Fed hike.
Capital flows are also notable. CME’s share of XRP futures open interest rose from around 10% in mid-August to 17%, while exposure there previously reached 36% as positions on other venues fell by 533 million tokens. XRP ETFs continued to attract inflows, with nearly 2 million USD on Tuesday; the five products have attracted 1.69 billion USD in total, including 173 million USD over 30 days.
The data points to improving XRP structure, but not yet a confirmed reversal. If a golden cross appears, it will more likely confirm an existing trend than initiate one.
Can XRP hold above 1.35 USD long enough for the 50-day SMA to overtake the 200-day SMA?
Please do your own research carefully before making any transactions (DYOR). $XRP $KAT $MINA #Colecolen
{future}(MINAUSDT)
{future}(KATUSDT)
{future}(XRPUSDT)
XRP MOVES ABOVE BOTH MAs, BUT THE GOLDEN CROSS IS STILL UNCONFIRMED
August’s rebound pushed XRP above its 50-day and 200-day SMAs, but has not confirmed a reversal. XRP climbed from 1.00 USD on August 18 to an intraday high of 1.6996 USD on August 22, before pulling back toward 1.42 USD.
Importantly, trading above both MAs does not mean a golden cross. The 50-day SMA remains below the 200-day SMA; a golden cross only appears when the shorter average crosses above the longer one. Since MAs are based on past closing prices, the signal is inherently lagging and confirms an established trend.
XRP’s 2025 history shows the same pattern. The golden cross appeared after XRP had already risen from 2.20 to 3.60 USD, meaning the crossover itself did not cause the rally.
The 1.35 USD level is now key support; a break below could expose 1.28 USD. Above, 1.44–1.46 USD is being watched; a close above 1.46 USD could open the path toward 1.50–1.52 USD.
Three upcoming events could affect price: U.S. CPI on September 11, the CLARITY Act cloture vote on September 15, and the Fed rate decision on September 16. Markets are pricing a 60% chance of a 25-basis-point Fed hike.
Capital flows are also notable. CME’s share of XRP futures open interest rose from around 10% in mid-August to 17%, while exposure there previously reached 36% as positions on other venues fell by 533 million tokens. XRP ETFs continued to attract inflows, with nearly 2 million USD on Tuesday; the five products have attracted 1.69 billion USD in total, including 173 million USD over 30 days.
The data points to improving XRP structure, but not yet a confirmed reversal. If a golden cross appears, it will more likely confirm an existing trend than initiate one.
Can XRP hold above 1.35 USD long enough for the 50-day SMA to overtake the 200-day SMA?
Please do your own research carefully before making any transactions (DYOR). $XRP $KAT $MINA #Colecolen
August’s rebound pushed XRP above its 50-day and 200-day SMAs, but has not confirmed a reversal. XRP climbed from 1.00 USD on August 18 to an intraday high of 1.6996 USD on August 22, before pulling back toward 1.42 USD.
Importantly, trading above both MAs does not mean a golden cross. The 50-day SMA remains below the 200-day SMA; a golden cross only appears when the shorter average crosses above the longer one. Since MAs are based on past closing prices, the signal is inherently lagging and confirms an established trend.
XRP’s 2025 history shows the same pattern. The golden cross appeared after XRP had already risen from 2.20 to 3.60 USD, meaning the crossover itself did not cause the rally.
The 1.35 USD level is now key support; a break below could expose 1.28 USD. Above, 1.44–1.46 USD is being watched; a close above 1.46 USD could open the path toward 1.50–1.52 USD.
Three upcoming events could affect price: U.S. CPI on September 11, the CLARITY Act cloture vote on September 15, and the Fed rate decision on September 16. Markets are pricing a 60% chance of a 25-basis-point Fed hike.
Capital flows are also notable. CME’s share of XRP futures open interest rose from around 10% in mid-August to 17%, while exposure there previously reached 36% as positions on other venues fell by 533 million tokens. XRP ETFs continued to attract inflows, with nearly 2 million USD on Tuesday; the five products have attracted 1.69 billion USD in total, including 173 million USD over 30 days.
The data points to improving XRP structure, but not yet a confirmed reversal. If a golden cross appears, it will more likely confirm an existing trend than initiate one.
Can XRP hold above 1.35 USD long enough for the 50-day SMA to overtake the 200-day SMA?
Please do your own research carefully before making any transactions (DYOR). $XRP $KAT $MINA #Colecolen

николаич:
обычный деревянный крест уже давно ему поставили
1
4
1.1k
·
--
Рост
CHIP: Tests Lower Channel Boundary – Strategic Trend-Aligned Long Execution with Over 3:1 RR Targeting $0.060
CHIP is presenting an exceptional swing-long setup on the 4-hour timeframe as price action directly tags the lower support boundary of a short-term descending corrective channel. Following an aggressive vertical markup phase that established consecutive fresh highs, this shallow, range-bound cool-off primarily functions to flush out weak-handed short-term chasers.
Based on the visual data from the 4-hour chart , CHIP’s dominant macro uptrend remains fully intact, reinforced by a rising trendline of higher lows and trading comfortably above the ascending dynamic MA100 support curve. The active 4-hour candle near $0.0507 is displaying an immediate lower-wick bounce upon testing the channel floor. Contracting sell volume indicates that distribution momentum has thoroughly exhausted, lacking the conviction required to threaten the primary macro uptrend. Successfully defending this channel boundary confirms that responsive buyers have re-entered the market, preparing to launch a mean-reversion rotation toward the upper channel boundary.
The optimal trading strategy is to initiate a trend-continuation Long position around the $0.0507 handle, placing a tight protective stop-loss parameter directly beneath the local wick low at $0.0478. The primary strategic take-profit objective targets the upper channel boundary near the $0.0600 resistance ceiling, securing an asymmetric risk-to-reward ratio exceeding 3:1.
Disclaimer: This is not financial advice, DYOR. $CHIP $IOST $KAT #Colecolen
{future}(KATUSDT)
{future}(IOSTUSDT)
{future}(CHIPUSDT)
CHIP: Tests Lower Channel Boundary – Strategic Trend-Aligned Long Execution with Over 3:1 RR Targeting $0.060
CHIP is presenting an exceptional swing-long setup on the 4-hour timeframe as price action directly tags the lower support boundary of a short-term descending corrective channel. Following an aggressive vertical markup phase that established consecutive fresh highs, this shallow, range-bound cool-off primarily functions to flush out weak-handed short-term chasers.
Based on the visual data from the 4-hour chart , CHIP’s dominant macro uptrend remains fully intact, reinforced by a rising trendline of higher lows and trading comfortably above the ascending dynamic MA100 support curve. The active 4-hour candle near $0.0507 is displaying an immediate lower-wick bounce upon testing the channel floor. Contracting sell volume indicates that distribution momentum has thoroughly exhausted, lacking the conviction required to threaten the primary macro uptrend. Successfully defending this channel boundary confirms that responsive buyers have re-entered the market, preparing to launch a mean-reversion rotation toward the upper channel boundary.
The optimal trading strategy is to initiate a trend-continuation Long position around the $0.0507 handle, placing a tight protective stop-loss parameter directly beneath the local wick low at $0.0478. The primary strategic take-profit objective targets the upper channel boundary near the $0.0600 resistance ceiling, securing an asymmetric risk-to-reward ratio exceeding 3:1.
Disclaimer: This is not financial advice, DYOR. $CHIP $IOST $KAT #Colecolen
CHIP is presenting an exceptional swing-long setup on the 4-hour timeframe as price action directly tags the lower support boundary of a short-term descending corrective channel. Following an aggressive vertical markup phase that established consecutive fresh highs, this shallow, range-bound cool-off primarily functions to flush out weak-handed short-term chasers.
Based on the visual data from the 4-hour chart , CHIP’s dominant macro uptrend remains fully intact, reinforced by a rising trendline of higher lows and trading comfortably above the ascending dynamic MA100 support curve. The active 4-hour candle near $0.0507 is displaying an immediate lower-wick bounce upon testing the channel floor. Contracting sell volume indicates that distribution momentum has thoroughly exhausted, lacking the conviction required to threaten the primary macro uptrend. Successfully defending this channel boundary confirms that responsive buyers have re-entered the market, preparing to launch a mean-reversion rotation toward the upper channel boundary.
The optimal trading strategy is to initiate a trend-continuation Long position around the $0.0507 handle, placing a tight protective stop-loss parameter directly beneath the local wick low at $0.0478. The primary strategic take-profit objective targets the upper channel boundary near the $0.0600 resistance ceiling, securing an asymmetric risk-to-reward ratio exceeding 3:1.
Disclaimer: This is not financial advice, DYOR. $CHIP $IOST $KAT #Colecolen
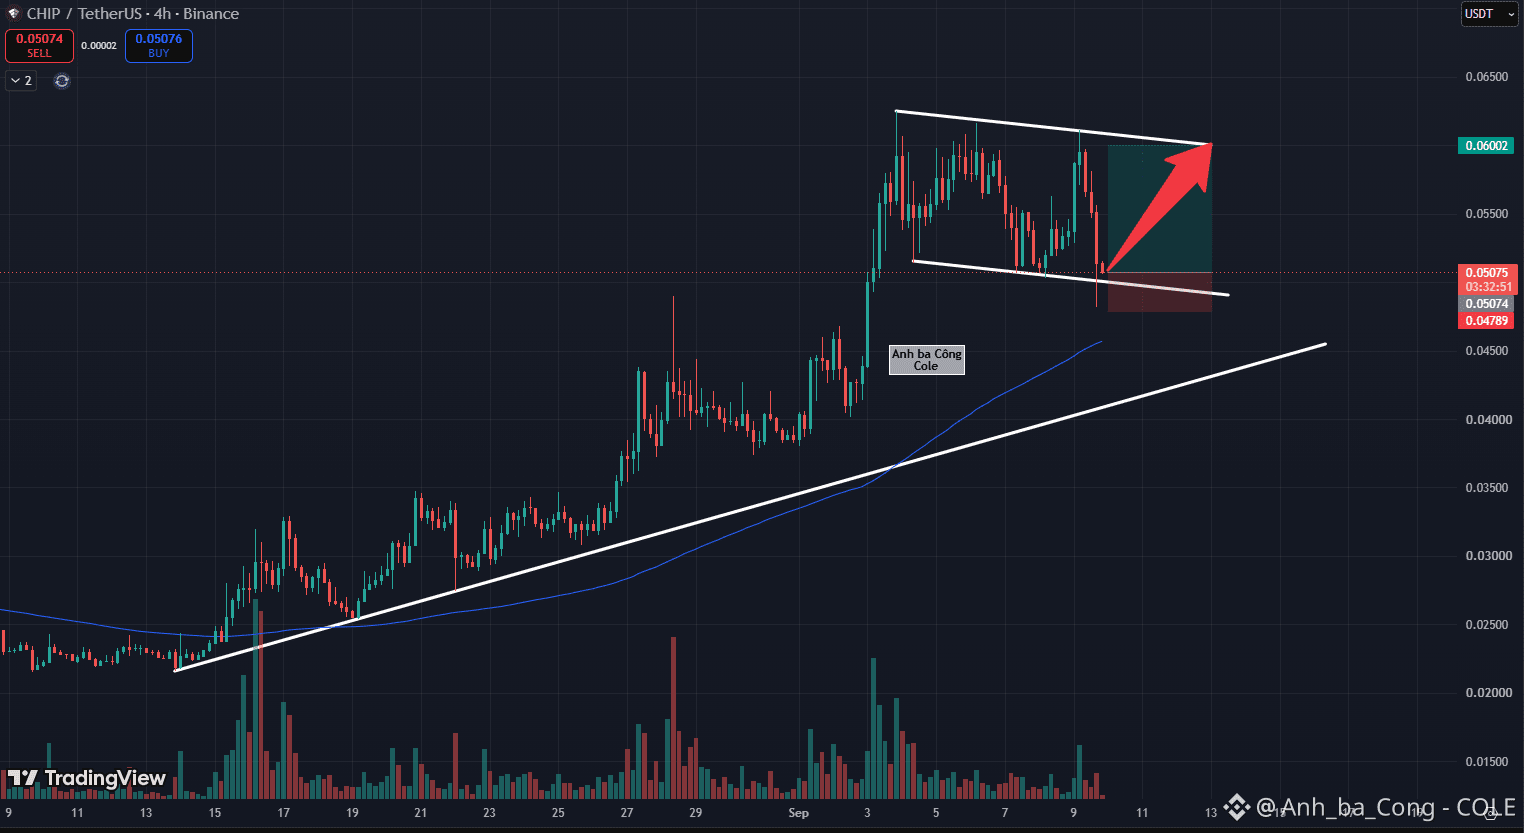
addijutt:
Sl hit
2
2
806
Войдите, чтобы посмотреть больше материала
Присоединяйтесь к пользователям криптовалют по всему миру на Binance Square
⚡️ Получайте новейшую и полезную информацию о криптоактивах.
💬 Нам доверяет крупнейшая в мире криптобиржа.
👍 Получите достоверные аналитические данные от верифицированных создателей контента.
Эл. почта/номер телефона
В тренде
1
#BitcoinHoldsAbove$77000
Просмотров: 1,723
78 обсуждают
2
#FedHikeOddsRiseTo89%
Просмотров: 6,303
266 обсуждают
3
#BitcoinCrosses$78000
Просмотров: 4,324
152 обсуждают
4
#RLUSDSupplyHitsRecord$2.442B
Просмотров: 33
4 обсуждают
5
#AvalancheIntegratesIntoUAEPassDigitalVault
Просмотров: 20,532
495 обсуждают
6
#UKSeeksViewsOnTokenizingGold
Просмотров: 13,947
337 обсуждают
7
#AnthropicCEOCallsForAISlowdown
Просмотров: 175,734
2,816 обсуждают
8
#RevolutDataLeakReportedlyPostedAttackersThreatenDailyReleases
Просмотров: 3,152
73 обсуждают
9
#BrazilCentralBankRaisesVASPCapitalRequirements
Просмотров: 21,923
561 обсуждают
10
#BitcoinThirdSingleBlockReorgInFourWeeks
Просмотров: 60,079
1,314 обсуждают