

#bullrunahead
bullrunahead
Просмотров: 19.4M
16,951 обсуждают
Популярные
Новые

·
--
Рост
{future}(BTCUSDT)
📊 Bitcoin ($BTC ) Price Momentum & Technical Analysis
Price Momentum & Higher Lows Structure:
Over recent weeks #BTC has established a solid support zone while maintaining a continuous Higher Lows pattern on the charts.
This technical structure confirms that buyers are repeatedly stepping in at higher levels, reinforcing the underlying #BullRunAhead trend.📢
Key Demand Zone ($83,000 – $86,000):
Strong buyer volume is evident within the $83,000 – $86,000 price range.📊
This area acts as a crucial demand zone, effectively re-establishing ongoing bullish sentiment across the market.🔧
#Binance #BTC突破7万大关 $BTC
📊 Bitcoin ($BTC ) Price Momentum & Technical Analysis
Price Momentum & Higher Lows Structure:
Over recent weeks #BTC has established a solid support zone while maintaining a continuous Higher Lows pattern on the charts.
This technical structure confirms that buyers are repeatedly stepping in at higher levels, reinforcing the underlying #BullRunAhead trend.📢
Key Demand Zone ($83,000 – $86,000):
Strong buyer volume is evident within the $83,000 – $86,000 price range.📊
This area acts as a crucial demand zone, effectively re-establishing ongoing bullish sentiment across the market.🔧
#Binance #BTC突破7万大关 $BTC
Price Momentum & Higher Lows Structure:
Over recent weeks #BTC has established a solid support zone while maintaining a continuous Higher Lows pattern on the charts.
This technical structure confirms that buyers are repeatedly stepping in at higher levels, reinforcing the underlying #BullRunAhead trend.📢
Key Demand Zone ($83,000 – $86,000):
Strong buyer volume is evident within the $83,000 – $86,000 price range.📊
This area acts as a crucial demand zone, effectively re-establishing ongoing bullish sentiment across the market.🔧
#Binance #BTC突破7万大关 $BTC
103

·
--
What if I tell you $BTC will revisit $65k from now till January 2027?
What happens afterwards? Full-blown #BullRunAhead
I used #AI with my #smartmoney institutional in-depth market knowledge to run a #quantum cross-matrix research on the Top sectors that will take a huge leap along with the incoming bull run, and it came up with 7 sectors and 35 coins in total (top 5 in each sector).
In no particular order, here are 3 out of the 35.
1. $ARB
{spot}(ARBUSDT)
2. $PYTH
{spot}(PYTHUSDT)
React or comment to see the full list or how did the cross matrix analysis. 😊
What if I tell you $BTC will revisit $65k from now till January 2027?
What happens afterwards? Full-blown #BullRunAhead
I used #AI with my #smartmoney institutional in-depth market knowledge to run a #quantum cross-matrix research on the Top sectors that will take a huge leap along with the incoming bull run, and it came up with 7 sectors and 35 coins in total (top 5 in each sector).
In no particular order, here are 3 out of the 35.
1. $ARB
2. $PYTH
React or comment to see the full list or how did the cross matrix analysis. 😊
What happens afterwards? Full-blown #BullRunAhead
I used #AI with my #smartmoney institutional in-depth market knowledge to run a #quantum cross-matrix research on the Top sectors that will take a huge leap along with the incoming bull run, and it came up with 7 sectors and 35 coins in total (top 5 in each sector).
In no particular order, here are 3 out of the 35.
1. $ARB
2. $PYTH
React or comment to see the full list or how did the cross matrix analysis. 😊
1
293

·
--
Рост
$ZEC IS UNSTOPPABLE !!!**
The momentum on ZEC/USDT is pure fire
right now! Pushing through $1,627 with
massive buyer volume and unstoppable
bullish energy!!
🔥 Target Roadmap to $2,000
Target 1: $1,680
Target 2: $1,750
Target 3: $1.850
Uitimate Target: $2,000
{future}(ZECUSDT)
#BullRunAhead
$ZEC IS UNSTOPPABLE !!!**
The momentum on ZEC/USDT is pure fire
right now! Pushing through $1,627 with
massive buyer volume and unstoppable
bullish energy!!
🔥 Target Roadmap to $2,000
Target 1: $1,680
Target 2: $1,750
Target 3: $1.850
Uitimate Target: $2,000
#BullRunAhead
The momentum on ZEC/USDT is pure fire
right now! Pushing through $1,627 with
massive buyer volume and unstoppable
bullish energy!!
🔥 Target Roadmap to $2,000
Target 1: $1,680
Target 2: $1,750
Target 3: $1.850
Uitimate Target: $2,000
#BullRunAhead
1
316
·
--
Рост
$ZEC to $2,000? Let’s Break Down the Next Big Move! 🚀!!!!*
The momentum on ZEC is looking absolutely electric! After a massive rally taking us from the $1,041.70 local bottom, Zcash is currently holding strong around $1,535.84.
Here is the exact bullish roadmap for ZEC to smash through $2,000! 🔥!!!!"
💥 The Path to $2,000
Breakout Zone ($1,595 - $1,600):
ZEC is testing its recent peak of $1,595.35. A strong 4H candle close above $1,600 with high volume will confirm a massive breakout!
{future}(ZECUSDT)
#BullRunAhead
$ZEC to $2,000? Let’s Break Down the Next Big Move! 🚀!!!!*
The momentum on ZEC is looking absolutely electric! After a massive rally taking us from the $1,041.70 local bottom, Zcash is currently holding strong around $1,535.84.
Here is the exact bullish roadmap for ZEC to smash through $2,000! 🔥!!!!"
💥 The Path to $2,000
Breakout Zone ($1,595 - $1,600):
ZEC is testing its recent peak of $1,595.35. A strong 4H candle close above $1,600 with high volume will confirm a massive breakout!
#BullRunAhead
The momentum on ZEC is looking absolutely electric! After a massive rally taking us from the $1,041.70 local bottom, Zcash is currently holding strong around $1,535.84.
Here is the exact bullish roadmap for ZEC to smash through $2,000! 🔥!!!!"
💥 The Path to $2,000
Breakout Zone ($1,595 - $1,600):
ZEC is testing its recent peak of $1,595.35. A strong 4H candle close above $1,600 with high volume will confirm a massive breakout!
#BullRunAhead
1
1.1k
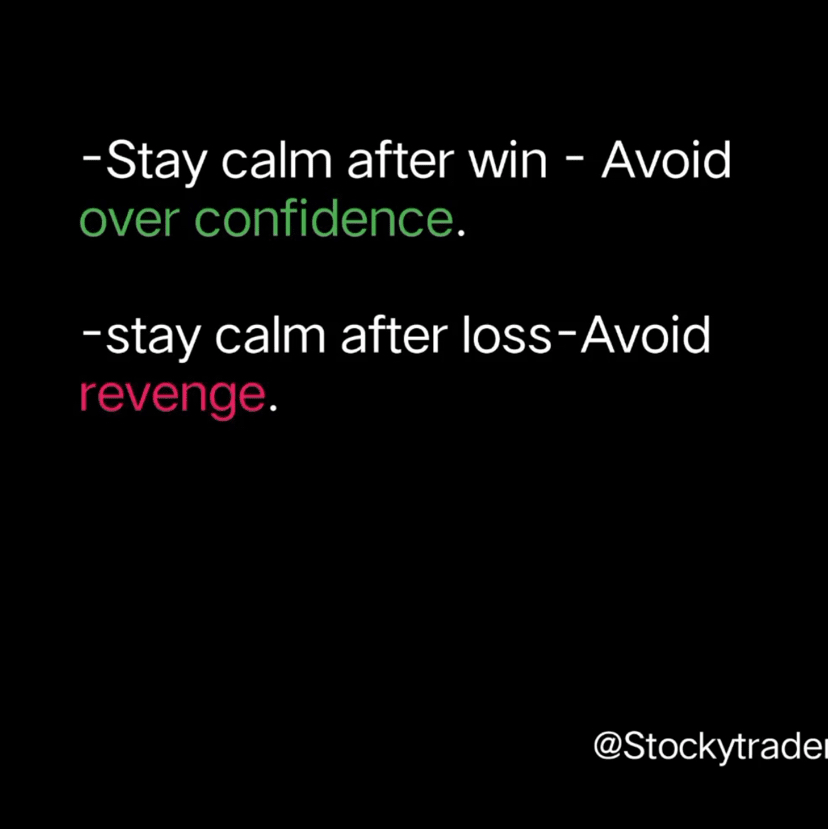
·
--
Рост
$BTC $XRP $ETH Went flying today ‼️
will they keep the fly mode??
Is the 🐂 Run about to start⁉️
So many questions that Nobody can really Answer and why?
On the one hand - the Statistics about the Rally , and the Rumors about the Rally is Slowly becoming true‼️✈️
On the second hand - many people keep saying that They have more space to get down, More Liquidity to grab between 58000$-47000$, But is it even Possible to get down this Quickly Before the 🐂 Run start ⁉️
Are you Guys 🐂 Or 🐻⁉️‼️
Comment down 👇
#BullRunAhead #BearishAlert
{future}(BTCUSDT)
{future}(ETHUSDT)
{future}(XRPUSDT)
$BTC $XRP $ETH Went flying today ‼️
will they keep the fly mode??
Is the 🐂 Run about to start⁉️
So many questions that Nobody can really Answer and why?
On the one hand - the Statistics about the Rally , and the Rumors about the Rally is Slowly becoming true‼️✈️
On the second hand - many people keep saying that They have more space to get down, More Liquidity to grab between 58000$-47000$, But is it even Possible to get down this Quickly Before the 🐂 Run start ⁉️
Are you Guys 🐂 Or 🐻⁉️‼️
Comment down 👇
#BullRunAhead #BearishAlert
will they keep the fly mode??
Is the 🐂 Run about to start⁉️
So many questions that Nobody can really Answer and why?
On the one hand - the Statistics about the Rally , and the Rumors about the Rally is Slowly becoming true‼️✈️
On the second hand - many people keep saying that They have more space to get down, More Liquidity to grab between 58000$-47000$, But is it even Possible to get down this Quickly Before the 🐂 Run start ⁉️
Are you Guys 🐂 Or 🐻⁉️‼️
Comment down 👇
#BullRunAhead #BearishAlert
1
328

🚨🚨🚨JUST IN: Fidelity Global Macro Director says Bitcoin could be starting a fresh bull run as BTC blasts past $85,000 🔥
Jurrien Timmer, Director of Global Macro at Fidelity Investments, stated that Bitcoin has held the approximately $60,000 support zone for nearly a year. Matching the typical duration of a Bitcoin winter. He views this as evidence that a new four-year cycle bull market is underway.
🔑Key supporting points from his analysis:
📌 The BTC/gold Z-score has shifted from -100% to positive territory, a signal that has historically confirmed market bottoms.
📌The market is operating in a new secular regime of higher capital costs, which Timmer expects governments to address through financial repression (favoring scarce assets such as Bitcoin and gold).
This commentary comes as Bitcoin has rallied strongly, recently trading above $85,000 (an eight-month high) after reclaiming levels near $80,000–$81,000. The move has been accompanied by positive spot Bitcoin ETF flows and significant short liquidations in the derivatives market.
$LTC $CFG $FET
"The market rewards the sharp & patient; be both."
#BullRunAhead #BTC
🚨🚨🚨JUST IN: Fidelity Global Macro Director says Bitcoin could be starting a fresh bull run as BTC blasts past $85,000 🔥
Jurrien Timmer, Director of Global Macro at Fidelity Investments, stated that Bitcoin has held the approximately $60,000 support zone for nearly a year. Matching the typical duration of a Bitcoin winter. He views this as evidence that a new four-year cycle bull market is underway.
🔑Key supporting points from his analysis:
📌 The BTC/gold Z-score has shifted from -100% to positive territory, a signal that has historically confirmed market bottoms.
📌The market is operating in a new secular regime of higher capital costs, which Timmer expects governments to address through financial repression (favoring scarce assets such as Bitcoin and gold).
This commentary comes as Bitcoin has rallied strongly, recently trading above $85,000 (an eight-month high) after reclaiming levels near $80,000–$81,000. The move has been accompanied by positive spot Bitcoin ETF flows and significant short liquidations in the derivatives market.
$LTC $CFG $FET
"The market rewards the sharp & patient; be both."
#BullRunAhead #BTC
Jurrien Timmer, Director of Global Macro at Fidelity Investments, stated that Bitcoin has held the approximately $60,000 support zone for nearly a year. Matching the typical duration of a Bitcoin winter. He views this as evidence that a new four-year cycle bull market is underway.
🔑Key supporting points from his analysis:
📌 The BTC/gold Z-score has shifted from -100% to positive territory, a signal that has historically confirmed market bottoms.
📌The market is operating in a new secular regime of higher capital costs, which Timmer expects governments to address through financial repression (favoring scarce assets such as Bitcoin and gold).
This commentary comes as Bitcoin has rallied strongly, recently trading above $85,000 (an eight-month high) after reclaiming levels near $80,000–$81,000. The move has been accompanied by positive spot Bitcoin ETF flows and significant short liquidations in the derivatives market.
$LTC $CFG $FET
"The market rewards the sharp & patient; be both."
#BullRunAhead #BTC
97

Are You Too Late To Enter In Bull Run🤔⁉️
So the answer is big Nooo!!!
Real bull run is about to start. Many big bulls are still waiting for confirmation.
Once BTC breaks 82700$ level or ETH breaks 2700$ level then you will see how agressively the market moves.
So if you are still planning to enter dont think just take trades after researching.
Remember do not put your hard earned money on shitty coins which just pumped and dumped. Put your money on good projects like $IOTX , $SUI , $POL etc
Disclaimer: DYOR , I have just shared my views and opinions . Invest on cryptos with calculative risk is recommended.
#BullRunAhead #bullrun2026 #btcbreaks82k
Are You Too Late To Enter In Bull Run🤔⁉️
So the answer is big Nooo!!!
Real bull run is about to start. Many big bulls are still waiting for confirmation.
Once BTC breaks 82700$ level or ETH breaks 2700$ level then you will see how agressively the market moves.
So if you are still planning to enter dont think just take trades after researching.
Remember do not put your hard earned money on shitty coins which just pumped and dumped. Put your money on good projects like $IOTX , $SUI , $POL etc
Disclaimer: DYOR , I have just shared my views and opinions . Invest on cryptos with calculative risk is recommended.
#BullRunAhead #bullrun2026 #btcbreaks82k
So the answer is big Nooo!!!
Real bull run is about to start. Many big bulls are still waiting for confirmation.
Once BTC breaks 82700$ level or ETH breaks 2700$ level then you will see how agressively the market moves.
So if you are still planning to enter dont think just take trades after researching.
Remember do not put your hard earned money on shitty coins which just pumped and dumped. Put your money on good projects like $IOTX , $SUI , $POL etc
Disclaimer: DYOR , I have just shared my views and opinions . Invest on cryptos with calculative risk is recommended.
#BullRunAhead #bullrun2026 #btcbreaks82k
193
·
--
Рост
{future}(BTCUSDT)
{future}(HYPEUSDT)
{future}(ZECUSDT)
Realmente E.UU decreta el bullrun a pesar del fallo de la ley clarity
La Innovation Exemption de la SEC es uno de los pasos regulatorios más concretos y favorables hacia la integración real entre finanzas tradicionales y blockchain en Estados Unidos. No va a disparar los precios de todas las criptos de la noche a la mañana, pero sí impulsa el mundo cripto al legitimar la tokenización de activos reales y abrir una ventana de 5 años para experimentar y escalar.Es una señal clara de que, aunque la legislación completa se atrase, el regulador está dispuesto a avanzar. Para el mercado, eso se traduce en más confianza, más utilidad y, potencialmente, más capital a largo plazo.¿Qué opinas? ¿Crees que esta exención marcará un antes y un después o es solo un parche temporal?
Actualmente vemos un mercado positivo para todo el sector cripto será este el comienzo del bull run ?
$BTC $HYPE $ZEC #BullRunAhead
Realmente E.UU decreta el bullrun a pesar del fallo de la ley clarity
La Innovation Exemption de la SEC es uno de los pasos regulatorios más concretos y favorables hacia la integración real entre finanzas tradicionales y blockchain en Estados Unidos. No va a disparar los precios de todas las criptos de la noche a la mañana, pero sí impulsa el mundo cripto al legitimar la tokenización de activos reales y abrir una ventana de 5 años para experimentar y escalar.Es una señal clara de que, aunque la legislación completa se atrase, el regulador está dispuesto a avanzar. Para el mercado, eso se traduce en más confianza, más utilidad y, potencialmente, más capital a largo plazo.¿Qué opinas? ¿Crees que esta exención marcará un antes y un después o es solo un parche temporal?
Actualmente vemos un mercado positivo para todo el sector cripto será este el comienzo del bull run ?
$BTC $HYPE $ZEC #BullRunAhead
La Innovation Exemption de la SEC es uno de los pasos regulatorios más concretos y favorables hacia la integración real entre finanzas tradicionales y blockchain en Estados Unidos. No va a disparar los precios de todas las criptos de la noche a la mañana, pero sí impulsa el mundo cripto al legitimar la tokenización de activos reales y abrir una ventana de 5 años para experimentar y escalar.Es una señal clara de que, aunque la legislación completa se atrase, el regulador está dispuesto a avanzar. Para el mercado, eso se traduce en más confianza, más utilidad y, potencialmente, más capital a largo plazo.¿Qué opinas? ¿Crees que esta exención marcará un antes y un después o es solo un parche temporal?
Actualmente vemos un mercado positivo para todo el sector cripto será este el comienzo del bull run ?
$BTC $HYPE $ZEC #BullRunAhead
188
·
--
Рост
$ZEC ALL TARGETS SASHAYING TO $2,000! 🚀
Zcash is showing explosive momentum,!!* pushing to a new high of $1,588.42 and current price around $1,554.82 (+4.59%)! The bulls are in full control and marching straight toward the major psychological goal of $2,000! 🔥!!*
🎯 Target Breakdown
Target 1: $1,588.42 (24h High - Smashed!)
Target 2: $1,750.00 (Next Resistance Zone)
Final Target: $2,000.00
{future}(ZECUSDT)
#BullRunAhead
$ZEC ALL TARGETS SASHAYING TO $2,000! 🚀
Zcash is showing explosive momentum,!!* pushing to a new high of $1,588.42 and current price around $1,554.82 (+4.59%)! The bulls are in full control and marching straight toward the major psychological goal of $2,000! 🔥!!*
🎯 Target Breakdown
Target 1: $1,588.42 (24h High - Smashed!)
Target 2: $1,750.00 (Next Resistance Zone)
Final Target: $2,000.00
#BullRunAhead
Zcash is showing explosive momentum,!!* pushing to a new high of $1,588.42 and current price around $1,554.82 (+4.59%)! The bulls are in full control and marching straight toward the major psychological goal of $2,000! 🔥!!*
🎯 Target Breakdown
Target 1: $1,588.42 (24h High - Smashed!)
Target 2: $1,750.00 (Next Resistance Zone)
Final Target: $2,000.00
#BullRunAhead
328

·
--
Рост
#BitcoinCrosses$78000
🚀 #BitcoinCrosses$78000 🚀The momentum is unstoppable! Bitcoin ($BTC) has officially shattered expectations and crossed the $78,000 milestone, charting new territory and driving the entire crypto market into a frenzy.Key takeaways from this historic breakout:Institutional Demand: Heavy capital inflows continue to validate BTC as the ultimate store of value.Market Sentiment: Extreme bullish momentum is liquidating shorts and triggering massive trading volume.What's Next? Eyes are now firmly set on the psychological $80,000 resistance level.Are you riding the wave or waiting for a pullback? Drop your price predictions below! 👇#BTC #CryptoNews #Bitcoin #BullRunAhead
{spot}(BTCUSDT)
#AnthropicCEOCallsForAISlowdown #BrazilCentralBankRaisesVASPCapitalRequirements #BitcoinThirdSingleBlockReorgInFourWeeks $NVDAB $AAPLB $NVDA.US
#BitcoinCrosses$78000
🚀 #BitcoinCrosses$78000 🚀The momentum is unstoppable! Bitcoin ($BTC) has officially shattered expectations and crossed the $78,000 milestone, charting new territory and driving the entire crypto market into a frenzy.Key takeaways from this historic breakout:Institutional Demand: Heavy capital inflows continue to validate BTC as the ultimate store of value.Market Sentiment: Extreme bullish momentum is liquidating shorts and triggering massive trading volume.What's Next? Eyes are now firmly set on the psychological $80,000 resistance level.Are you riding the wave or waiting for a pullback? Drop your price predictions below! 👇#BTC #CryptoNews #Bitcoin #BullRunAhead
#AnthropicCEOCallsForAISlowdown #BrazilCentralBankRaisesVASPCapitalRequirements #BitcoinThirdSingleBlockReorgInFourWeeks $NVDAB $AAPLB $NVDA.US
🚀 #BitcoinCrosses$78000 🚀The momentum is unstoppable! Bitcoin ($BTC) has officially shattered expectations and crossed the $78,000 milestone, charting new territory and driving the entire crypto market into a frenzy.Key takeaways from this historic breakout:Institutional Demand: Heavy capital inflows continue to validate BTC as the ultimate store of value.Market Sentiment: Extreme bullish momentum is liquidating shorts and triggering massive trading volume.What's Next? Eyes are now firmly set on the psychological $80,000 resistance level.Are you riding the wave or waiting for a pullback? Drop your price predictions below! 👇#BTC #CryptoNews #Bitcoin #BullRunAhead
#AnthropicCEOCallsForAISlowdown #BrazilCentralBankRaisesVASPCapitalRequirements #BitcoinThirdSingleBlockReorgInFourWeeks $NVDAB $AAPLB $NVDA.US
1
65

·
--
🚨 THE BULLRUN IS NEAR! 🚨
Are you feeling the energy shifting in the markets, or are you still sitting on the sidelines? 📈🚀
Whether you are deep into crypto, stocks, or alternative assets, market cycles always test our patience before things start moving fast. Homer has spoken, and the laser eyes are officially on!
Here is a quick market check for everyone today:
Stay Prepared: Volatility usually comes right before major shifts. Make sure your strategy is locked in.
Manage Risk: Don’t let FOMO cloud your judgment—always trade or invest based on research, not just hype.
Keep Learning: Markets reward those who adapt and stay informed, no matter which direction the charts go.
How are you positioning your portfolio right now? Are we looking at a massive breakout, or is it too soon to tell? Drop your thoughts below! 👇💬
#BullRunAhead
🚨 THE BULLRUN IS NEAR! 🚨
Are you feeling the energy shifting in the markets, or are you still sitting on the sidelines? 📈🚀
Whether you are deep into crypto, stocks, or alternative assets, market cycles always test our patience before things start moving fast. Homer has spoken, and the laser eyes are officially on!
Here is a quick market check for everyone today:
Stay Prepared: Volatility usually comes right before major shifts. Make sure your strategy is locked in.
Manage Risk: Don’t let FOMO cloud your judgment—always trade or invest based on research, not just hype.
Keep Learning: Markets reward those who adapt and stay informed, no matter which direction the charts go.
How are you positioning your portfolio right now? Are we looking at a massive breakout, or is it too soon to tell? Drop your thoughts below! 👇💬
#BullRunAhead
Are you feeling the energy shifting in the markets, or are you still sitting on the sidelines? 📈🚀
Whether you are deep into crypto, stocks, or alternative assets, market cycles always test our patience before things start moving fast. Homer has spoken, and the laser eyes are officially on!
Here is a quick market check for everyone today:
Stay Prepared: Volatility usually comes right before major shifts. Make sure your strategy is locked in.
Manage Risk: Don’t let FOMO cloud your judgment—always trade or invest based on research, not just hype.
Keep Learning: Markets reward those who adapt and stay informed, no matter which direction the charts go.
How are you positioning your portfolio right now? Are we looking at a massive breakout, or is it too soon to tell? Drop your thoughts below! 👇💬
#BullRunAhead
75


·
--
Статья
The Next Bull Run May Have Already Started — Here's WhyThe Next Bull Run May Have Already Started — Here's Why
For most of the past year, I have noticed something unusual about how people talk about the market.
Whenever prices pull back, the conversation immediately shifts toward fear. Whenever prices rally, the discussion becomes focused on whether the move is "real" or not. Very few people seem willing to consider the possibility that a bull market doesn't announce itself when it begins.
Looking back at every major cycle, the biggest opportunities rarely appeared when everyone agreed that a bull run had started. By that point, much of the move had already happened.
That is why I have started paying less attention to market sentiment and more attention to market structure.
And from that perspective, there are several reasons why I think the next bull run may have already started.
One of the biggest misconceptions in crypto is that bull markets begin with explosive price action. In reality, they often begin with boredom.
The early stages of a cycle are usually characterized by disbelief. Prices slowly recover. Liquidity quietly returns. Strong projects begin attracting capital before the broader market notices.
What makes this phase difficult is that it rarely feels exciting.
Most participants are still mentally anchored to previous highs and previous crashes. They spend months waiting for confirmation while markets gradually build a foundation underneath them.
I have seen this pattern repeat across multiple cycles.
The market doesn't move because everyone becomes bullish.
Everyone becomes bullish because the market has already moved.
What stands out today is the growing divergence between headlines and actual market activity.
Despite ongoing macro uncertainty, geopolitical tensions, and persistent concerns about regulation, capital continues finding its way into digital assets.
Institutional participation looks fundamentally different compared to previous cycles.
A few years ago, institutional involvement was largely speculative. Today, many large investors view crypto as a permanent asset class rather than a temporary trade.
That distinction matters.
Speculative capital can disappear overnight.
Structural capital tends to remain even during periods of volatility.
This creates a more stable foundation for future growth.
Another signal I continue watching is infrastructure development.
Historically, major bull markets tend to arrive after years of invisible construction.
Most users never notice this process because infrastructure is rarely exciting.
People focus on tokens.
Developers focus on systems.
Yet markets often reward the systems that quietly improve before anyone pays attention.
Over the last few years, the industry has invested heavily in scaling solutions, interoperability frameworks, decentralized physical infrastructure, tokenized real-world assets, AI-related networks, and more efficient trading environments.
These developments are not immediately reflected in price.
Instead, they gradually expand what the ecosystem can support.
The internet itself followed a similar path.
The infrastructure came first.
Mass adoption arrived later.
I also find on-chain behavior increasingly interesting.
During bear markets, activity tends to concentrate around speculation.
During healthier environments, activity begins diversifying.
We start seeing growth in stablecoin usage, network transactions, application engagement, and long-term holder accumulation.
These metrics rarely generate attention on social media because they move slowly.
But slow-moving indicators often reveal more than fast-moving narratives.
Price can be manipulated for days.
User behavior is much harder to fake for months.
Another factor that deserves attention is the changing nature of liquidity.
Previous cycles were heavily retail-driven.
Today's environment appears increasingly influenced by multiple layers of capital.
Retail participation remains important, but institutional funds, treasury strategies, ETF flows, venture allocations, and cross-market capital rotations now play a much larger role than before.
This creates a market that behaves differently.
Moves may appear slower initially.
Momentum may develop more gradually.
But once liquidity begins expanding across multiple channels simultaneously, trends often become more sustainable.
That does not mean risks have disappeared.
Far from it.
One uncomfortable truth about every market cycle is that timing remains impossible to predict with precision.
Even if a new bull run has started, the path forward will almost certainly include sharp corrections.
Many investors assume bull markets move in straight lines.
They do not.
Some of the largest drawdowns in history occurred during larger uptrends.
The challenge is distinguishing between temporary volatility and structural weakness.
That distinction becomes clearer when observing where capital continues flowing after corrections.
If money consistently returns to quality assets and productive ecosystems, it suggests confidence remains intact beneath the surface.
What I find particularly interesting right now is the psychological backdrop.
The strongest phases of previous cycles often emerged when confidence was still fragile.
Most participants wanted certainty before acting.
But markets rarely reward certainty.
They reward anticipation.
By the time certainty arrives, valuations have usually adjusted accordingly.
This creates an uncomfortable paradox.
The conditions that feel safest are often the conditions that offer the least opportunity.
Meanwhile, the periods filled with doubt frequently contain the seeds of future growth.
None of this guarantees that prices will immediately move higher.
Markets remain influenced by macroeconomic conditions, interest rates, global liquidity, and unexpected external events.
Any one of these factors can temporarily alter direction.
But when I step back and examine the broader picture, I see an industry that looks significantly stronger than it did during previous cycle transitions.
Infrastructure is more mature.
Capital is more diverse.
Participation is broader.
The conversation is becoming less about whether crypto survives and more about how it evolves.
That shift feels important.
Maybe this isn't the beginning of the next bull run.
Maybe the market still needs more time.
But I cannot ignore the possibility that many people are waiting for a starting signal that has already appeared.
History suggests bull markets are rarely obvious at birth.
They become obvious only in hindsight.
And if that pattern repeats again, the most important part of the move may not be somewhere in the future.
It may already be unfolding quietly while the majority of participants continue waiting for proof.
#BinanceSquare #Write2Earn #BullRunAhead
The Next Bull Run May Have Already Started — Here's Why
The Next Bull Run May Have Already Started — Here's Why
For most of the past year, I have noticed something unusual about how people talk about the market.
Whenever prices pull back, the conversation immediately shifts toward fear. Whenever prices rally, the discussion becomes focused on whether the move is "real" or not. Very few people seem willing to consider the possibility that a bull market doesn't announce itself when it begins.
Looking back at every major cycle, the biggest opportunities rarely appeared when everyone agreed that a bull run had started. By that point, much of the move had already happened.
That is why I have started paying less attention to market sentiment and more attention to market structure.
And from that perspective, there are several reasons why I think the next bull run may have already started.
One of the biggest misconceptions in crypto is that bull markets begin with explosive price action. In reality, they often begin with boredom.
The early stages of a cycle are usually characterized by disbelief. Prices slowly recover. Liquidity quietly returns. Strong projects begin attracting capital before the broader market notices.
What makes this phase difficult is that it rarely feels exciting.
Most participants are still mentally anchored to previous highs and previous crashes. They spend months waiting for confirmation while markets gradually build a foundation underneath them.
I have seen this pattern repeat across multiple cycles.
The market doesn't move because everyone becomes bullish.
Everyone becomes bullish because the market has already moved.
What stands out today is the growing divergence between headlines and actual market activity.
Despite ongoing macro uncertainty, geopolitical tensions, and persistent concerns about regulation, capital continues finding its way into digital assets.
Institutional participation looks fundamentally different compared to previous cycles.
A few years ago, institutional involvement was largely speculative. Today, many large investors view crypto as a permanent asset class rather than a temporary trade.
That distinction matters.
Speculative capital can disappear overnight.
Structural capital tends to remain even during periods of volatility.
This creates a more stable foundation for future growth.
Another signal I continue watching is infrastructure development.
Historically, major bull markets tend to arrive after years of invisible construction.
Most users never notice this process because infrastructure is rarely exciting.
People focus on tokens.
Developers focus on systems.
Yet markets often reward the systems that quietly improve before anyone pays attention.
Over the last few years, the industry has invested heavily in scaling solutions, interoperability frameworks, decentralized physical infrastructure, tokenized real-world assets, AI-related networks, and more efficient trading environments.
These developments are not immediately reflected in price.
Instead, they gradually expand what the ecosystem can support.
The internet itself followed a similar path.
The infrastructure came first.
Mass adoption arrived later.
I also find on-chain behavior increasingly interesting.
During bear markets, activity tends to concentrate around speculation.
During healthier environments, activity begins diversifying.
We start seeing growth in stablecoin usage, network transactions, application engagement, and long-term holder accumulation.
These metrics rarely generate attention on social media because they move slowly.
But slow-moving indicators often reveal more than fast-moving narratives.
Price can be manipulated for days.
User behavior is much harder to fake for months.
Another factor that deserves attention is the changing nature of liquidity.
Previous cycles were heavily retail-driven.
Today's environment appears increasingly influenced by multiple layers of capital.
Retail participation remains important, but institutional funds, treasury strategies, ETF flows, venture allocations, and cross-market capital rotations now play a much larger role than before.
This creates a market that behaves differently.
Moves may appear slower initially.
Momentum may develop more gradually.
But once liquidity begins expanding across multiple channels simultaneously, trends often become more sustainable.
That does not mean risks have disappeared.
Far from it.
One uncomfortable truth about every market cycle is that timing remains impossible to predict with precision.
Even if a new bull run has started, the path forward will almost certainly include sharp corrections.
Many investors assume bull markets move in straight lines.
They do not.
Some of the largest drawdowns in history occurred during larger uptrends.
The challenge is distinguishing between temporary volatility and structural weakness.
That distinction becomes clearer when observing where capital continues flowing after corrections.
If money consistently returns to quality assets and productive ecosystems, it suggests confidence remains intact beneath the surface.
What I find particularly interesting right now is the psychological backdrop.
The strongest phases of previous cycles often emerged when confidence was still fragile.
Most participants wanted certainty before acting.
But markets rarely reward certainty.
They reward anticipation.
By the time certainty arrives, valuations have usually adjusted accordingly.
This creates an uncomfortable paradox.
The conditions that feel safest are often the conditions that offer the least opportunity.
Meanwhile, the periods filled with doubt frequently contain the seeds of future growth.
None of this guarantees that prices will immediately move higher.
Markets remain influenced by macroeconomic conditions, interest rates, global liquidity, and unexpected external events.
Any one of these factors can temporarily alter direction.
But when I step back and examine the broader picture, I see an industry that looks significantly stronger than it did during previous cycle transitions.
Infrastructure is more mature.
Capital is more diverse.
Participation is broader.
The conversation is becoming less about whether crypto survives and more about how it evolves.
That shift feels important.
Maybe this isn't the beginning of the next bull run.
Maybe the market still needs more time.
But I cannot ignore the possibility that many people are waiting for a starting signal that has already appeared.
History suggests bull markets are rarely obvious at birth.
They become obvious only in hindsight.
And if that pattern repeats again, the most important part of the move may not be somewhere in the future.
It may already be unfolding quietly while the majority of participants continue waiting for proof.
#BinanceSquare #Write2Earn #BullRunAhead
For most of the past year, I have noticed something unusual about how people talk about the market.
Whenever prices pull back, the conversation immediately shifts toward fear. Whenever prices rally, the discussion becomes focused on whether the move is "real" or not. Very few people seem willing to consider the possibility that a bull market doesn't announce itself when it begins.
Looking back at every major cycle, the biggest opportunities rarely appeared when everyone agreed that a bull run had started. By that point, much of the move had already happened.
That is why I have started paying less attention to market sentiment and more attention to market structure.
And from that perspective, there are several reasons why I think the next bull run may have already started.
One of the biggest misconceptions in crypto is that bull markets begin with explosive price action. In reality, they often begin with boredom.
The early stages of a cycle are usually characterized by disbelief. Prices slowly recover. Liquidity quietly returns. Strong projects begin attracting capital before the broader market notices.
What makes this phase difficult is that it rarely feels exciting.
Most participants are still mentally anchored to previous highs and previous crashes. They spend months waiting for confirmation while markets gradually build a foundation underneath them.
I have seen this pattern repeat across multiple cycles.
The market doesn't move because everyone becomes bullish.
Everyone becomes bullish because the market has already moved.
What stands out today is the growing divergence between headlines and actual market activity.
Despite ongoing macro uncertainty, geopolitical tensions, and persistent concerns about regulation, capital continues finding its way into digital assets.
Institutional participation looks fundamentally different compared to previous cycles.
A few years ago, institutional involvement was largely speculative. Today, many large investors view crypto as a permanent asset class rather than a temporary trade.
That distinction matters.
Speculative capital can disappear overnight.
Structural capital tends to remain even during periods of volatility.
This creates a more stable foundation for future growth.
Another signal I continue watching is infrastructure development.
Historically, major bull markets tend to arrive after years of invisible construction.
Most users never notice this process because infrastructure is rarely exciting.
People focus on tokens.
Developers focus on systems.
Yet markets often reward the systems that quietly improve before anyone pays attention.
Over the last few years, the industry has invested heavily in scaling solutions, interoperability frameworks, decentralized physical infrastructure, tokenized real-world assets, AI-related networks, and more efficient trading environments.
These developments are not immediately reflected in price.
Instead, they gradually expand what the ecosystem can support.
The internet itself followed a similar path.
The infrastructure came first.
Mass adoption arrived later.
I also find on-chain behavior increasingly interesting.
During bear markets, activity tends to concentrate around speculation.
During healthier environments, activity begins diversifying.
We start seeing growth in stablecoin usage, network transactions, application engagement, and long-term holder accumulation.
These metrics rarely generate attention on social media because they move slowly.
But slow-moving indicators often reveal more than fast-moving narratives.
Price can be manipulated for days.
User behavior is much harder to fake for months.
Another factor that deserves attention is the changing nature of liquidity.
Previous cycles were heavily retail-driven.
Today's environment appears increasingly influenced by multiple layers of capital.
Retail participation remains important, but institutional funds, treasury strategies, ETF flows, venture allocations, and cross-market capital rotations now play a much larger role than before.
This creates a market that behaves differently.
Moves may appear slower initially.
Momentum may develop more gradually.
But once liquidity begins expanding across multiple channels simultaneously, trends often become more sustainable.
That does not mean risks have disappeared.
Far from it.
One uncomfortable truth about every market cycle is that timing remains impossible to predict with precision.
Even if a new bull run has started, the path forward will almost certainly include sharp corrections.
Many investors assume bull markets move in straight lines.
They do not.
Some of the largest drawdowns in history occurred during larger uptrends.
The challenge is distinguishing between temporary volatility and structural weakness.
That distinction becomes clearer when observing where capital continues flowing after corrections.
If money consistently returns to quality assets and productive ecosystems, it suggests confidence remains intact beneath the surface.
What I find particularly interesting right now is the psychological backdrop.
The strongest phases of previous cycles often emerged when confidence was still fragile.
Most participants wanted certainty before acting.
But markets rarely reward certainty.
They reward anticipation.
By the time certainty arrives, valuations have usually adjusted accordingly.
This creates an uncomfortable paradox.
The conditions that feel safest are often the conditions that offer the least opportunity.
Meanwhile, the periods filled with doubt frequently contain the seeds of future growth.
None of this guarantees that prices will immediately move higher.
Markets remain influenced by macroeconomic conditions, interest rates, global liquidity, and unexpected external events.
Any one of these factors can temporarily alter direction.
But when I step back and examine the broader picture, I see an industry that looks significantly stronger than it did during previous cycle transitions.
Infrastructure is more mature.
Capital is more diverse.
Participation is broader.
The conversation is becoming less about whether crypto survives and more about how it evolves.
That shift feels important.
Maybe this isn't the beginning of the next bull run.
Maybe the market still needs more time.
But I cannot ignore the possibility that many people are waiting for a starting signal that has already appeared.
History suggests bull markets are rarely obvious at birth.
They become obvious only in hindsight.
And if that pattern repeats again, the most important part of the move may not be somewhere in the future.
It may already be unfolding quietly while the majority of participants continue waiting for proof.
#BinanceSquare #Write2Earn #BullRunAhead
71

·
--
Let me tell you this:
No matter how deep the dip, crypto is far from over.
There’s no need to panic like a child. We’ve survived far worse market conditions before, and we came out stronger.
Nothing falls forever. Bitcoin will still reach above $150K, and many coins will deliver massive gains and do thousands of X’s.
The key is knowing who you’re following. Bad advice can pressure you into selling your bags at the worst time.
Remember: every dip affects everyone, and every pump does too.
$BNB season will come.
$ETH season will come.
$SOL season will come.
Ignore the noise from those mocking others about “seasons.” Most of them have little to show for all their talk.
If they truly have results, let them prove it. I’m staying right here calm and ready for the market to recover and make its next massive move.
Whether you like it or not, many will build serious wealth in this cycle… while others will lose massively. Stay focused.
#BullRunAhead
#Market_Update
Let me tell you this:
No matter how deep the dip, crypto is far from over.
There’s no need to panic like a child. We’ve survived far worse market conditions before, and we came out stronger.
Nothing falls forever. Bitcoin will still reach above $150K, and many coins will deliver massive gains and do thousands of X’s.
The key is knowing who you’re following. Bad advice can pressure you into selling your bags at the worst time.
Remember: every dip affects everyone, and every pump does too.
$BNB season will come.
$ETH season will come.
$SOL season will come.
Ignore the noise from those mocking others about “seasons.” Most of them have little to show for all their talk.
If they truly have results, let them prove it. I’m staying right here calm and ready for the market to recover and make its next massive move.
Whether you like it or not, many will build serious wealth in this cycle… while others will lose massively. Stay focused.
#BullRunAhead
#Market_Update
No matter how deep the dip, crypto is far from over.
There’s no need to panic like a child. We’ve survived far worse market conditions before, and we came out stronger.
Nothing falls forever. Bitcoin will still reach above $150K, and many coins will deliver massive gains and do thousands of X’s.
The key is knowing who you’re following. Bad advice can pressure you into selling your bags at the worst time.
Remember: every dip affects everyone, and every pump does too.
$BNB season will come.
$ETH season will come.
$SOL season will come.
Ignore the noise from those mocking others about “seasons.” Most of them have little to show for all their talk.
If they truly have results, let them prove it. I’m staying right here calm and ready for the market to recover and make its next massive move.
Whether you like it or not, many will build serious wealth in this cycle… while others will lose massively. Stay focused.
#BullRunAhead
#Market_Update
633

🚨 Bitcoin Analysis: Bulls Still in Control? 🚨
#Bitcoin continues to show strength above key support levels, keeping the broader bullish trend intact.
📊 Technical Outlook
• BTC remains above major moving averages, signaling strong momentum.
• Buyers are defending important support zones, preventing deeper pullbacks.
• A breakout above recent resistance could trigger the next leg higher.
🐂 Bullish Scenario
If Bitcoin holds current support and volume increases, the market could target higher resistance levels. Continued institutional interest and ETF demand remain positive catalysts for long-term growth.
🐻 Bearish Scenario
Failure to hold support may lead to a short-term correction as traders take profits. Volatility remains expected, especially around major economic data releases and central bank announcements.
💡 Market Sentiment
Overall sentiment remains cautiously bullish. Long-term holders continue accumulating while short-term traders watch for breakout confirmation.
🔑 Key Takeaway
Trend remains bullish unless major support levels break. Risk management is essential, and traders should avoid overleveraging in volatile conditions.
⚠️ This is not financial advice. Always do your own research before investing.
#BİNANCESQUARE #trading #CryptoMarket #BullRunAhead
🚨 Bitcoin Analysis: Bulls Still in Control? 🚨
#Bitcoin continues to show strength above key support levels, keeping the broader bullish trend intact.
📊 Technical Outlook
• BTC remains above major moving averages, signaling strong momentum.
• Buyers are defending important support zones, preventing deeper pullbacks.
• A breakout above recent resistance could trigger the next leg higher.
🐂 Bullish Scenario
If Bitcoin holds current support and volume increases, the market could target higher resistance levels. Continued institutional interest and ETF demand remain positive catalysts for long-term growth.
🐻 Bearish Scenario
Failure to hold support may lead to a short-term correction as traders take profits. Volatility remains expected, especially around major economic data releases and central bank announcements.
💡 Market Sentiment
Overall sentiment remains cautiously bullish. Long-term holders continue accumulating while short-term traders watch for breakout confirmation.
🔑 Key Takeaway
Trend remains bullish unless major support levels break. Risk management is essential, and traders should avoid overleveraging in volatile conditions.
⚠️ This is not financial advice. Always do your own research before investing.
#BİNANCESQUARE #trading #CryptoMarket #BullRunAhead
#Bitcoin continues to show strength above key support levels, keeping the broader bullish trend intact.
📊 Technical Outlook
• BTC remains above major moving averages, signaling strong momentum.
• Buyers are defending important support zones, preventing deeper pullbacks.
• A breakout above recent resistance could trigger the next leg higher.
🐂 Bullish Scenario
If Bitcoin holds current support and volume increases, the market could target higher resistance levels. Continued institutional interest and ETF demand remain positive catalysts for long-term growth.
🐻 Bearish Scenario
Failure to hold support may lead to a short-term correction as traders take profits. Volatility remains expected, especially around major economic data releases and central bank announcements.
💡 Market Sentiment
Overall sentiment remains cautiously bullish. Long-term holders continue accumulating while short-term traders watch for breakout confirmation.
🔑 Key Takeaway
Trend remains bullish unless major support levels break. Risk management is essential, and traders should avoid overleveraging in volatile conditions.
⚠️ This is not financial advice. Always do your own research before investing.
#BİNANCESQUARE #trading #CryptoMarket #BullRunAhead
107

🚨🔥 THE CRYPTO CASINO IS HEATING UP AGAIN 🔥🚨
💀 Shorts are getting DESTROYED while altcoins are waking up one by one.
Bulls are slowly taking control and the market sentiment is shifting FAST ⚡
📈 Current Heat Map:
🟠 $BTC – Holding strong despite volatility. Every dip is getting bought aggressively.
🟣 $ETH – Smart money accumulation continues before the next expansion move.
⚠️ Liquidations are rising. FOMO is back. Retail still underexposed.
📊 What traders should watch NOW: ✅ Breakout confirmations
✅ Whale wallet activity
✅ Funding rates overheating
✅ Volume expansion on majors
✅ Meme sector rotations
👀 This market feels one news catalyst away from going PARABOLIC.
The biggest mistake right now?
❌ Waiting for “perfect entry” while narratives run without you.
💬 My focus list this week:
$BTC | $ETH | $SOL || AI gems | Meme runners 🚀
🔥 Are you positioned… or watching from the sidelines?
#Bitcoin #Crypto #Binance #BinanceSquare #Altcoin s #BullRunAhead llRun #memecoin s #Ethereum #Solana #trading
🚨🔥 THE CRYPTO CASINO IS HEATING UP AGAIN 🔥🚨
💀 Shorts are getting DESTROYED while altcoins are waking up one by one.
Bulls are slowly taking control and the market sentiment is shifting FAST ⚡
📈 Current Heat Map:
🟠 $BTC – Holding strong despite volatility. Every dip is getting bought aggressively.
🟣 $ETH – Smart money accumulation continues before the next expansion move.
⚠️ Liquidations are rising. FOMO is back. Retail still underexposed.
📊 What traders should watch NOW: ✅ Breakout confirmations
✅ Whale wallet activity
✅ Funding rates overheating
✅ Volume expansion on majors
✅ Meme sector rotations
👀 This market feels one news catalyst away from going PARABOLIC.
The biggest mistake right now?
❌ Waiting for “perfect entry” while narratives run without you.
💬 My focus list this week:
$BTC | $ETH | $SOL || AI gems | Meme runners 🚀
🔥 Are you positioned… or watching from the sidelines?
#Bitcoin #Crypto #Binance #BinanceSquare #Altcoin s #BullRunAhead llRun #memecoin s #Ethereum #Solana #trading
💀 Shorts are getting DESTROYED while altcoins are waking up one by one.
Bulls are slowly taking control and the market sentiment is shifting FAST ⚡
📈 Current Heat Map:
🟠 $BTC – Holding strong despite volatility. Every dip is getting bought aggressively.
🟣 $ETH – Smart money accumulation continues before the next expansion move.
⚠️ Liquidations are rising. FOMO is back. Retail still underexposed.
📊 What traders should watch NOW: ✅ Breakout confirmations
✅ Whale wallet activity
✅ Funding rates overheating
✅ Volume expansion on majors
✅ Meme sector rotations
👀 This market feels one news catalyst away from going PARABOLIC.
The biggest mistake right now?
❌ Waiting for “perfect entry” while narratives run without you.
💬 My focus list this week:
$BTC | $ETH | $SOL || AI gems | Meme runners 🚀
🔥 Are you positioned… or watching from the sidelines?
#Bitcoin #Crypto #Binance #BinanceSquare #Altcoin s #BullRunAhead llRun #memecoin s #Ethereum #Solana #trading
1
298

🚀 #BTC continues to show remarkable resilience.
After defending a major support zone multiple times, Bitcoin appears to be building a strong foundation for its next move. The current market structure is starting to resemble previous accumulation phases that eventually led to significant bullish momentum.
If history rhymes, a breakout above key resistance levels could open the door for a much larger rally in the months ahead. While no outcome is guaranteed, long-term sentiment remains increasingly optimistic.
📈 Adoption is growing worldwide. Crypto is no longer limited to institutions, hedge funds, or Wall Street giants. Today, people from all walks of life—from major cities to rural communities—have access to digital assets and blockchain technology.
The market has tested investors' patience many times, but strong conviction often comes from understanding the bigger picture rather than focusing on short-term volatility.
My outlook remains bullish on: 🔸 $BTC 🔸 $ETH 🔸 $SOL
What are your targets for this cycle? 👇
#Bitcoin #Crypto #BinanceSquare #BullMarket #Ethereum #Solana #Investing
#bitcoin #MarketSentimentToday #BullRunAhead #TradingSignals
🚀 #BTC continues to show remarkable resilience.
After defending a major support zone multiple times, Bitcoin appears to be building a strong foundation for its next move. The current market structure is starting to resemble previous accumulation phases that eventually led to significant bullish momentum.
If history rhymes, a breakout above key resistance levels could open the door for a much larger rally in the months ahead. While no outcome is guaranteed, long-term sentiment remains increasingly optimistic.
📈 Adoption is growing worldwide. Crypto is no longer limited to institutions, hedge funds, or Wall Street giants. Today, people from all walks of life—from major cities to rural communities—have access to digital assets and blockchain technology.
The market has tested investors' patience many times, but strong conviction often comes from understanding the bigger picture rather than focusing on short-term volatility.
My outlook remains bullish on: 🔸 $BTC 🔸 $ETH 🔸 $SOL
What are your targets for this cycle? 👇
#Bitcoin #Crypto #BinanceSquare #BullMarket #Ethereum #Solana #Investing
#bitcoin #MarketSentimentToday #BullRunAhead #TradingSignals
After defending a major support zone multiple times, Bitcoin appears to be building a strong foundation for its next move. The current market structure is starting to resemble previous accumulation phases that eventually led to significant bullish momentum.
If history rhymes, a breakout above key resistance levels could open the door for a much larger rally in the months ahead. While no outcome is guaranteed, long-term sentiment remains increasingly optimistic.
📈 Adoption is growing worldwide. Crypto is no longer limited to institutions, hedge funds, or Wall Street giants. Today, people from all walks of life—from major cities to rural communities—have access to digital assets and blockchain technology.
The market has tested investors' patience many times, but strong conviction often comes from understanding the bigger picture rather than focusing on short-term volatility.
My outlook remains bullish on: 🔸 $BTC 🔸 $ETH 🔸 $SOL
What are your targets for this cycle? 👇
#Bitcoin #Crypto #BinanceSquare #BullMarket #Ethereum #Solana #Investing
#bitcoin #MarketSentimentToday #BullRunAhead #TradingSignals
2
1
225

·
--
🚀 CRYPTO BULL RUN IS HERE 🐂📈
The market is waking up.
$BTC is pushing resistance.
$ETH is gaining momentum.
$ALT are starting to explode.
💎 Smart money accumulates in silence.
🔥 Retail enters after the breakout.
📊 This cycle could create life-changing opportunities.
Remember:
• Don’t chase green candles
• Take profits wisely
• Manage risk
• Stay patient during volatility
⚡ Fortunes are built during bull markets.
#bitcoin #Ethereum #BullRunAhead #CryptoTrading #Altseason
🚀 CRYPTO BULL RUN IS HERE 🐂📈
The market is waking up.
$BTC is pushing resistance.
$ETH is gaining momentum.
$ALT are starting to explode.
💎 Smart money accumulates in silence.
🔥 Retail enters after the breakout.
📊 This cycle could create life-changing opportunities.
Remember:
• Don’t chase green candles
• Take profits wisely
• Manage risk
• Stay patient during volatility
⚡ Fortunes are built during bull markets.
#bitcoin #Ethereum #BullRunAhead #CryptoTrading #Altseason
The market is waking up.
$BTC is pushing resistance.
$ETH is gaining momentum.
$ALT are starting to explode.
💎 Smart money accumulates in silence.
🔥 Retail enters after the breakout.
📊 This cycle could create life-changing opportunities.
Remember:
• Don’t chase green candles
• Take profits wisely
• Manage risk
• Stay patient during volatility
⚡ Fortunes are built during bull markets.
#bitcoin #Ethereum #BullRunAhead #CryptoTrading #Altseason
97

·
--
Despite the current downturn, the cryptocurrency market remains resilient. There is no cause for unnecessary concern. The market has navigated more challenging conditions in the past and emerged stronger each time.
Market cycles are inevitable. Bitcoin is positioned to exceed $150,000 in the future, and many assets are likely to generate substantial returns. The key differentiator is the quality of guidance you follow. Poor advice often leads to selling at inopportune moments.
Every market correction impacts all participants, just as every rally does.
Altcoin cycles for $BNB , $ETH , and $SOL will materialize in due course. It is best to disregard commentary from those who dismiss these phases without demonstrable results. If they have a proven track record, the data will speak for itself.
I remain focused and prepared for the market’s recovery and its next significant upward move.
This cycle will create substantial wealth for some, while others will face losses. Stay disciplined and keep your long-term strategy in view.
#BullRunAhead #Market_Update
#USJoblessClaimsHit225K
#IranStrikesKuwaitAirport
#SpaceXInitiatesIPORoadshowWith555MShares
Despite the current downturn, the cryptocurrency market remains resilient. There is no cause for unnecessary concern. The market has navigated more challenging conditions in the past and emerged stronger each time.
Market cycles are inevitable. Bitcoin is positioned to exceed $150,000 in the future, and many assets are likely to generate substantial returns. The key differentiator is the quality of guidance you follow. Poor advice often leads to selling at inopportune moments.
Every market correction impacts all participants, just as every rally does.
Altcoin cycles for $BNB , $ETH , and $SOL will materialize in due course. It is best to disregard commentary from those who dismiss these phases without demonstrable results. If they have a proven track record, the data will speak for itself.
I remain focused and prepared for the market’s recovery and its next significant upward move.
This cycle will create substantial wealth for some, while others will face losses. Stay disciplined and keep your long-term strategy in view.
#BullRunAhead #Market_Update
#USJoblessClaimsHit225K
#IranStrikesKuwaitAirport
#SpaceXInitiatesIPORoadshowWith555MShares
Market cycles are inevitable. Bitcoin is positioned to exceed $150,000 in the future, and many assets are likely to generate substantial returns. The key differentiator is the quality of guidance you follow. Poor advice often leads to selling at inopportune moments.
Every market correction impacts all participants, just as every rally does.
Altcoin cycles for $BNB , $ETH , and $SOL will materialize in due course. It is best to disregard commentary from those who dismiss these phases without demonstrable results. If they have a proven track record, the data will speak for itself.
I remain focused and prepared for the market’s recovery and its next significant upward move.
This cycle will create substantial wealth for some, while others will face losses. Stay disciplined and keep your long-term strategy in view.
#BullRunAhead #Market_Update
#USJoblessClaimsHit225K
#IranStrikesKuwaitAirport
#SpaceXInitiatesIPORoadshowWith555MShares
1
95

·
--
🚨 BITCOIN COMPRESSING BELOW $80K: IS THE BIG BREAKOUT READY? 🚀🔥Bitcoin ($BTC) is consolidating tightly at $79,658, just below its major psychological resistance. The 4-hour market structure looks extremely bullish as the price firmly holds above the critical Supertrend support at $78,190. With a massive $803.64 Million in 24-hour volume pumping into the market, buyers are actively gearing up to retest the recent peak of $82,300. Are you loading up your bags on this consolidation or waiting for a flash fakeout? Drop your targets below..!
#Bitcoin #BullRunAhead #TradingNews #BinanceSquare
{future}(BTCUSDT)
🚨 BITCOIN COMPRESSING BELOW $80K: IS THE BIG BREAKOUT READY? 🚀🔥Bitcoin ($BTC) is consolidating tightly at $79,658, just below its major psychological resistance. The 4-hour market structure looks extremely bullish as the price firmly holds above the critical Supertrend support at $78,190. With a massive $803.64 Million in 24-hour volume pumping into the market, buyers are actively gearing up to retest the recent peak of $82,300. Are you loading up your bags on this consolidation or waiting for a flash fakeout? Drop your targets below..!
#Bitcoin #BullRunAhead #TradingNews #BinanceSquare
#Bitcoin #BullRunAhead #TradingNews #BinanceSquare
111

·
--
Рост
🔥 ADA TO $5? THE NEXT BIG CRYPTO STORY? 🔥
While most traders are focused on short-term moves, smart money is watching the bigger picture. 👀
Cardano (ADA) continues to build, grow, and attract long-term believers. If the crypto market enters another major bull cycle, ADA could be one of the strongest performers.
🚀 ADA at $0.16
🚀 $1 is just the beginning
🚀 $3 breaks previous expectations
🚀 $5 becomes the target everyone once laughed at
The biggest gains are made before the crowd believes.
💎 Accumulation creates wealth.
📈 Patience creates legends.
My view: ADA remains one of the most undervalued large-cap crypto assets heading into the next bull market.
Who's holding ADA until $5? 👇🔥
$ADA #ADAUSDT #BullRunAhead #cryptotrading #CryptoCommunity 🚀💎
🔥 ADA TO $5? THE NEXT BIG CRYPTO STORY? 🔥
While most traders are focused on short-term moves, smart money is watching the bigger picture. 👀
Cardano (ADA) continues to build, grow, and attract long-term believers. If the crypto market enters another major bull cycle, ADA could be one of the strongest performers.
🚀 ADA at $0.16
🚀 $1 is just the beginning
🚀 $3 breaks previous expectations
🚀 $5 becomes the target everyone once laughed at
The biggest gains are made before the crowd believes.
💎 Accumulation creates wealth.
📈 Patience creates legends.
My view: ADA remains one of the most undervalued large-cap crypto assets heading into the next bull market.
Who's holding ADA until $5? 👇🔥
$ADA #ADAUSDT #BullRunAhead #cryptotrading #CryptoCommunity 🚀💎
While most traders are focused on short-term moves, smart money is watching the bigger picture. 👀
Cardano (ADA) continues to build, grow, and attract long-term believers. If the crypto market enters another major bull cycle, ADA could be one of the strongest performers.
🚀 ADA at $0.16
🚀 $1 is just the beginning
🚀 $3 breaks previous expectations
🚀 $5 becomes the target everyone once laughed at
The biggest gains are made before the crowd believes.
💎 Accumulation creates wealth.
📈 Patience creates legends.
My view: ADA remains one of the most undervalued large-cap crypto assets heading into the next bull market.
Who's holding ADA until $5? 👇🔥
$ADA #ADAUSDT #BullRunAhead #cryptotrading #CryptoCommunity 🚀💎
2
1
76
Войдите, чтобы посмотреть больше материала
Присоединяйтесь к пользователям криптовалют по всему миру на Binance Square
⚡️ Получайте новейшую и полезную информацию о криптоактивах.
💬 Нам доверяет крупнейшая в мире криптобиржа.
👍 Получите достоверные аналитические данные от верифицированных создателей контента.
Эл. почта/номер телефона
В тренде
1
#BinancekzWin
Просмотров: 1,074
27 обсуждают
2
#CPIWatch
Просмотров: 88.3M
506,387 обсуждают
3
#9月CPI来袭原油美债走势如何
Просмотров: 24,542
105 обсуждают
4
#BTCDominanceBackAt60%
Просмотров: 47,554
797 обсуждают
5
#UKHighCourtRulesChineseLawGovernsBitcoinClaims
Просмотров: 55,282
731 обсуждают
6
#FSBWarns$300BStablecoinMarketCouldFaceRuns
Просмотров: 7,045
69 обсуждают
7
#RBNZPausesDigitalCashDevelopment
Просмотров: 36,064
756 обсуждают
8
#EvernorthNasdaqDebutClosesDown1.05%
Просмотров: 121,444
1,242 обсуждают
9
#StrategyBuys250Bitcoin
Просмотров: 80,786
1,016 обсуждают
10
#SKHynixSharesDrop7.1%
Просмотров: 62,065
781 обсуждают