

#bitcoinspotetfspost$203mweeklyoutflow
bitcoinspotetfspost$203mweeklyoutflow
Популярные
Новые

Частичная правда
Статья
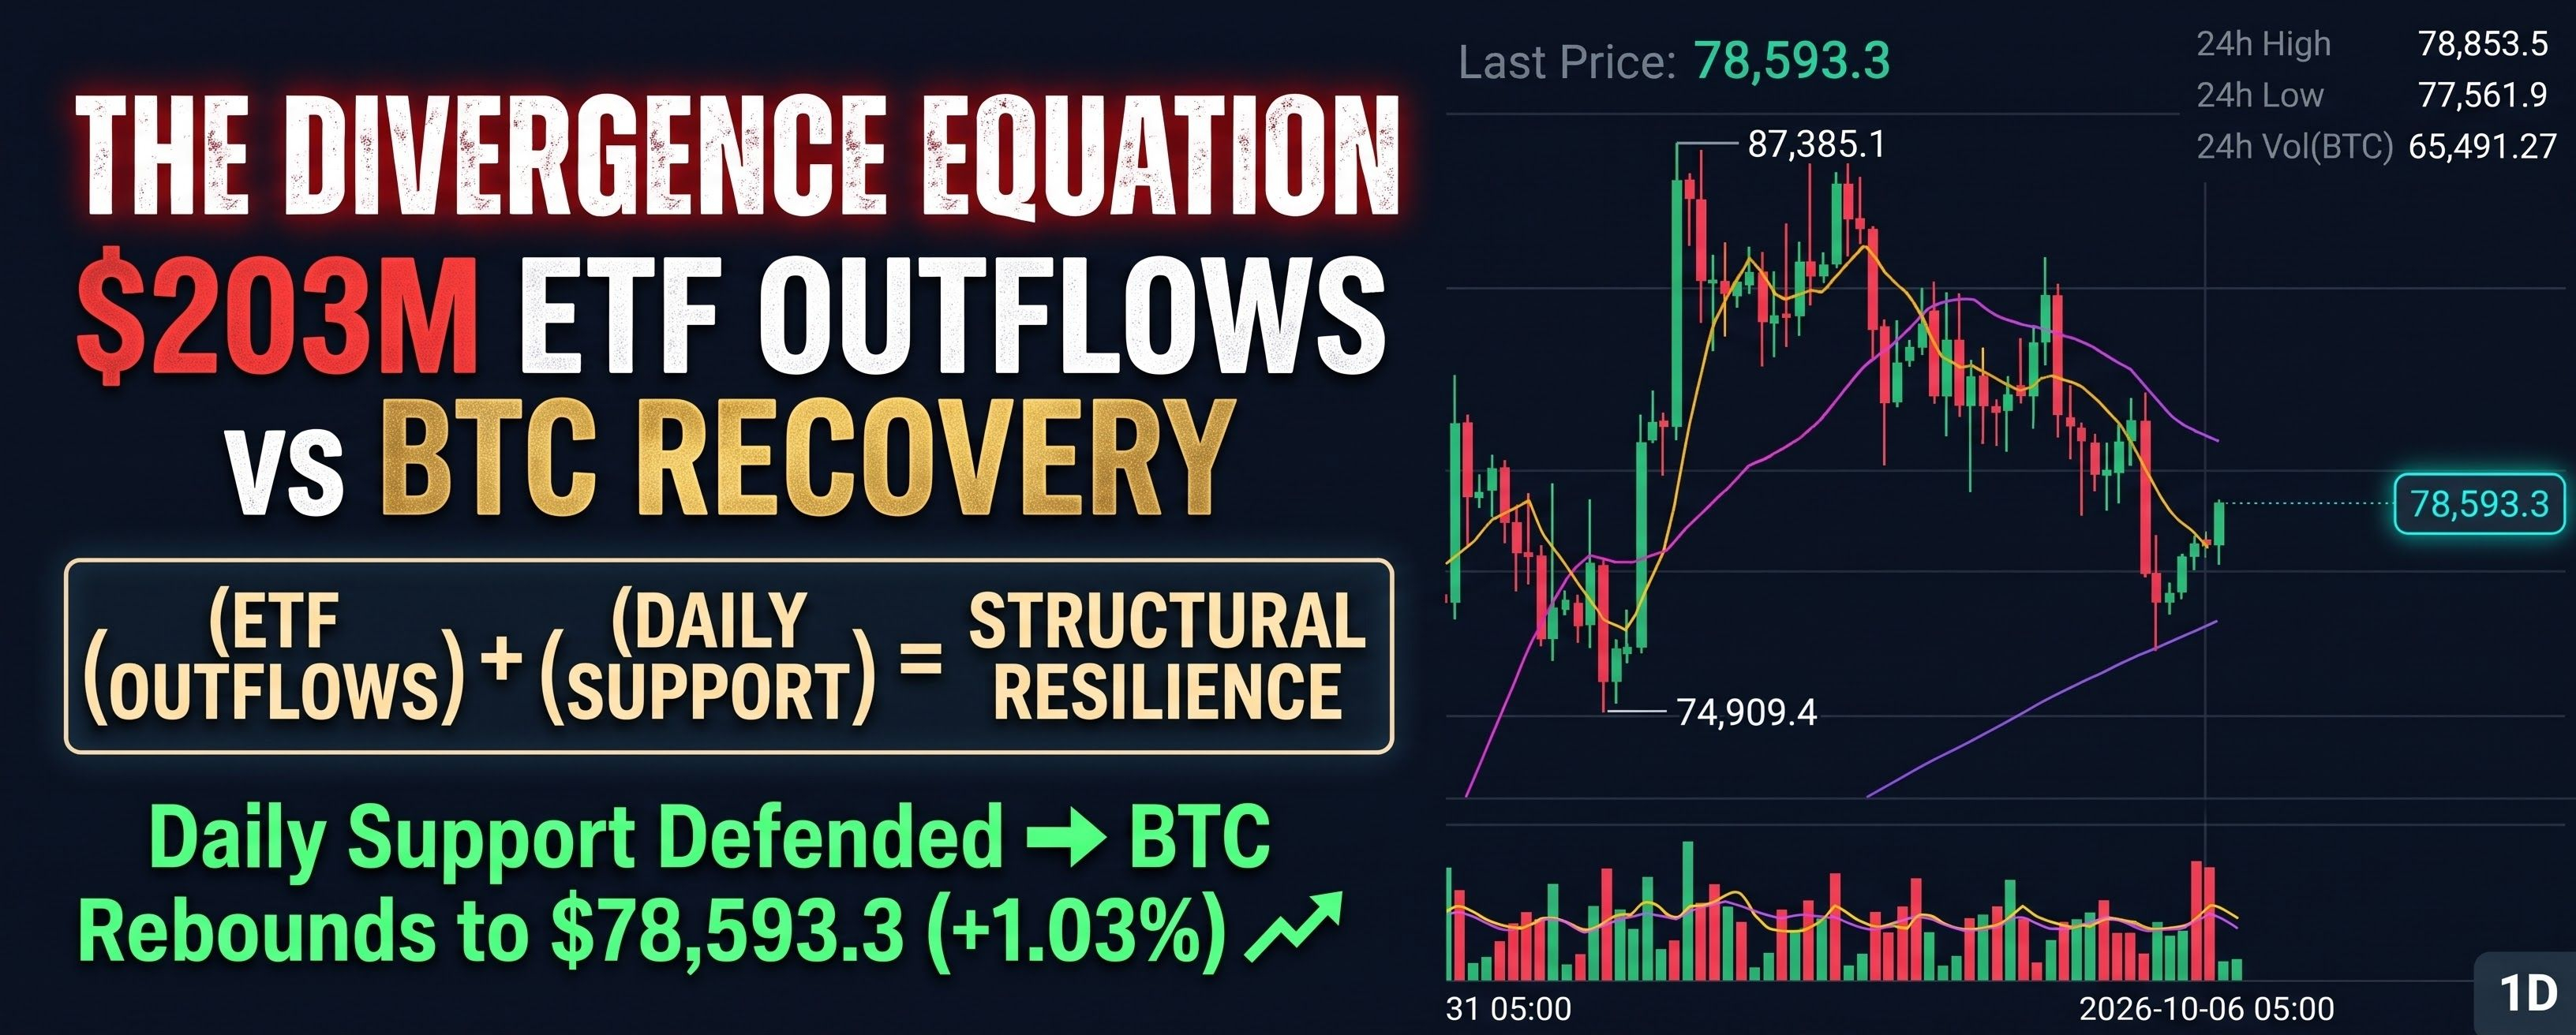
🚨 THE DIVERGENCE EQUATION: ETF Red Alert Meets Price Recovery 🚨#bitcoinspotetfspost$203mweeklyoutflow
Spot BTC exchange-traded funds just posted massive outflows—yet the market tells a completely different story. Let’s break down the data vs. price split using pure math 🧮👇
(Institutional ETF Outflows) + (Organic Spot Buyers) = Groundwork for Rebound 📈
The Asset Input:
(The Catalyst) = Traditional finance is still de-risking. In the final week of October, US Spot Bitcoin ETFs registered a massive $203 million weekly net outflow.
The Key Deliverable:
(The Price Action) ➔ However, BTC is refusing to go down. As we look at the chart, the asset took a deep dive, seeking liquidity at the $76,270 local bottom. After washing out the weak hands, Bitcoin staged a beautiful 1.03% recovery to $78,523. Traditional selling pressure was completely absorbed.
The Breakdown:
The chart tells you everything: a big correction down to testing MA(99) near $76,682, followed by a strong bullish absorption. Institutional ETF flows are a trailing indicator; spot demand is the real market driver.
Will this test of $76K be the final spring before the massive year-end push, or has the ETF selling only just begun? ❓👇💬
$BTC $IDOL $LYN
{future}(LYNUSDT)
{future}(IDOLUSDT)
{future}(BTCUSDT)
#BTC #SpotETFs #MarketRecovery #Binance
🚨 THE DIVERGENCE EQUATION: ETF Red Alert Meets Price Recovery 🚨
#bitcoinspotetfspost$203mweeklyoutflow
Spot BTC exchange-traded funds just posted massive outflows—yet the market tells a completely different story. Let’s break down the data vs. price split using pure math 🧮👇
(Institutional ETF Outflows) + (Organic Spot Buyers) = Groundwork for Rebound 📈
The Asset Input:
(The Catalyst) = Traditional finance is still de-risking. In the final week of October, US Spot Bitcoin ETFs registered a massive $203 million weekly net outflow.
The Key Deliverable:
(The Price Action) ➔ However, BTC is refusing to go down. As we look at the chart, the asset took a deep dive, seeking liquidity at the $76,270 local bottom. After washing out the weak hands, Bitcoin staged a beautiful 1.03% recovery to $78,523. Traditional selling pressure was completely absorbed.
The Breakdown:
The chart tells you everything: a big correction down to testing MA(99) near $76,682, followed by a strong bullish absorption. Institutional ETF flows are a trailing indicator; spot demand is the real market driver.
Will this test of $76K be the final spring before the massive year-end push, or has the ETF selling only just begun? ❓👇💬
$BTC $IDOL $LYN
#BTC #SpotETFs #MarketRecovery #Binance
Spot BTC exchange-traded funds just posted massive outflows—yet the market tells a completely different story. Let’s break down the data vs. price split using pure math 🧮👇
(Institutional ETF Outflows) + (Organic Spot Buyers) = Groundwork for Rebound 📈
The Asset Input:
(The Catalyst) = Traditional finance is still de-risking. In the final week of October, US Spot Bitcoin ETFs registered a massive $203 million weekly net outflow.
The Key Deliverable:
(The Price Action) ➔ However, BTC is refusing to go down. As we look at the chart, the asset took a deep dive, seeking liquidity at the $76,270 local bottom. After washing out the weak hands, Bitcoin staged a beautiful 1.03% recovery to $78,523. Traditional selling pressure was completely absorbed.
The Breakdown:
The chart tells you everything: a big correction down to testing MA(99) near $76,682, followed by a strong bullish absorption. Institutional ETF flows are a trailing indicator; spot demand is the real market driver.
Will this test of $76K be the final spring before the massive year-end push, or has the ETF selling only just begun? ❓👇💬
$BTC $IDOL $LYN
#BTC #SpotETFs #MarketRecovery #Binance
1
950

🌱 LONG-TERM THINKING BEATS SHORT-TERM FEAR!
A $203 million weekly Bitcoin spot ETF outflow may sound concerning, but one week's data cannot determine Bitcoin's future.
Market movements create lessons for investors who value patience, research, and financial discipline.
Choose ethical cash management, avoid interest-based strategies, and invest only in assets you understand.
Real progress starts with responsible decisions!
$BTC $ETH $BNB #BitcoinSpotETFsPost$203MWeeklyOutflow
🌱 LONG-TERM THINKING BEATS SHORT-TERM FEAR!
A $203 million weekly Bitcoin spot ETF outflow may sound concerning, but one week's data cannot determine Bitcoin's future.
Market movements create lessons for investors who value patience, research, and financial discipline.
Choose ethical cash management, avoid interest-based strategies, and invest only in assets you understand.
Real progress starts with responsible decisions!
$BTC $ETH $BNB #BitcoinSpotETFsPost$203MWeeklyOutflow
A $203 million weekly Bitcoin spot ETF outflow may sound concerning, but one week's data cannot determine Bitcoin's future.
Market movements create lessons for investors who value patience, research, and financial discipline.
Choose ethical cash management, avoid interest-based strategies, and invest only in assets you understand.
Real progress starts with responsible decisions!
$BTC $ETH $BNB #BitcoinSpotETFsPost$203MWeeklyOutflow
4
🚀 ETF OUTFLOWS CAN ALSO BRING VALUABLE MARKET LESSONS!
Bitcoin's reported $203 million weekly spot ETF outflow gives investors another reason to study institutional behavior.
Changing capital flows can increase market discussion, encourage deeper analysis, and help investors improve their decisions.
Don't chase losses or use leverage to recover quickly.
Focus on transparent transactions and responsible spot ownership.
$BTC $LINK $ADA #BitcoinSpotETFsPost$203MWeeklyOutflow
🚀 ETF OUTFLOWS CAN ALSO BRING VALUABLE MARKET LESSONS!
Bitcoin's reported $203 million weekly spot ETF outflow gives investors another reason to study institutional behavior.
Changing capital flows can increase market discussion, encourage deeper analysis, and help investors improve their decisions.
Don't chase losses or use leverage to recover quickly.
Focus on transparent transactions and responsible spot ownership.
$BTC $LINK $ADA #BitcoinSpotETFsPost$203MWeeklyOutflow
Bitcoin's reported $203 million weekly spot ETF outflow gives investors another reason to study institutional behavior.
Changing capital flows can increase market discussion, encourage deeper analysis, and help investors improve their decisions.
Don't chase losses or use leverage to recover quickly.
Focus on transparent transactions and responsible spot ownership.
$BTC $LINK $ADA #BitcoinSpotETFsPost$203MWeeklyOutflow
4
🛡️ SMART INVESTORS DON'T FOLLOW EVERY MARKET MOVE!
Bitcoin spot ETF outflows of $203 million highlight changing investor positioning.
The positive side? Such developments remind investors to focus on fundamentals instead of emotional reactions.
Healthy investing means understanding volatility, protecting your cash, and choosing carefully researched spot assets.
Patience is a powerful investment strategy!
$BTC $ETH $XRP #BitcoinSpotETFsPost$203MWeeklyOutflow
🛡️ SMART INVESTORS DON'T FOLLOW EVERY MARKET MOVE!
Bitcoin spot ETF outflows of $203 million highlight changing investor positioning.
The positive side? Such developments remind investors to focus on fundamentals instead of emotional reactions.
Healthy investing means understanding volatility, protecting your cash, and choosing carefully researched spot assets.
Patience is a powerful investment strategy!
$BTC $ETH $XRP #BitcoinSpotETFsPost$203MWeeklyOutflow
Bitcoin spot ETF outflows of $203 million highlight changing investor positioning.
The positive side? Such developments remind investors to focus on fundamentals instead of emotional reactions.
Healthy investing means understanding volatility, protecting your cash, and choosing carefully researched spot assets.
Patience is a powerful investment strategy!
$BTC $ETH $XRP #BitcoinSpotETFsPost$203MWeeklyOutflow
1
💎 BITCOIN ETF OUTFLOWS: PANIC OR PERSPECTIVE?
A reported $203 million weekly outflow from Bitcoin spot ETFs shows that institutional flows can change.
Smart investors look beyond one weekly figure and examine broader market conditions.
This can encourage better research, stronger risk management, and more disciplined spot investing.
Build your strategy around real ownership, not borrowed money or interest-based products.
$BTC $BNB $SOL #BitcoinSpotETFsPost$203MWeeklyOutflow
💎 BITCOIN ETF OUTFLOWS: PANIC OR PERSPECTIVE?
A reported $203 million weekly outflow from Bitcoin spot ETFs shows that institutional flows can change.
Smart investors look beyond one weekly figure and examine broader market conditions.
This can encourage better research, stronger risk management, and more disciplined spot investing.
Build your strategy around real ownership, not borrowed money or interest-based products.
$BTC $BNB $SOL #BitcoinSpotETFsPost$203MWeeklyOutflow
A reported $203 million weekly outflow from Bitcoin spot ETFs shows that institutional flows can change.
Smart investors look beyond one weekly figure and examine broader market conditions.
This can encourage better research, stronger risk management, and more disciplined spot investing.
Build your strategy around real ownership, not borrowed money or interest-based products.
$BTC $BNB $SOL #BitcoinSpotETFsPost$203MWeeklyOutflow
📊 $203M WEEKLY ETF OUTFLOW: BITCOIN IS STILL IN FOCUS!
Bitcoin spot ETFs recorded a reported $203 million weekly outflow, bringing institutional investor sentiment into the spotlight.
But ETF outflows don't automatically mean Bitcoin is losing its long-term value.
Market corrections can create opportunities for patient investors to study prices, evaluate risk, and make informed spot decisions.
Knowledge over panic. Research over speculation!
$BTC $ETH $BNB #BitcoinSpotETFsPost$203MWeeklyOutflow
📊 $203M WEEKLY ETF OUTFLOW: BITCOIN IS STILL IN FOCUS!
Bitcoin spot ETFs recorded a reported $203 million weekly outflow, bringing institutional investor sentiment into the spotlight.
But ETF outflows don't automatically mean Bitcoin is losing its long-term value.
Market corrections can create opportunities for patient investors to study prices, evaluate risk, and make informed spot decisions.
Knowledge over panic. Research over speculation!
$BTC $ETH $BNB #BitcoinSpotETFsPost$203MWeeklyOutflow
Bitcoin spot ETFs recorded a reported $203 million weekly outflow, bringing institutional investor sentiment into the spotlight.
But ETF outflows don't automatically mean Bitcoin is losing its long-term value.
Market corrections can create opportunities for patient investors to study prices, evaluate risk, and make informed spot decisions.
Knowledge over panic. Research over speculation!
$BTC $ETH $BNB #BitcoinSpotETFsPost$203MWeeklyOutflow

Статья
Spot Bitcoin ETF $203M Weekly Outflow#BitcoinSpotETFsPost$203MWeeklyOutflowSpot Bitcoin ETF $203M Weekly Outflow — A “False Retreat” Distorted by Single-Day Reversal
📅November 2, 2026 | Data as of: October 30, 2026 close
I. Core Conclusion 🔑
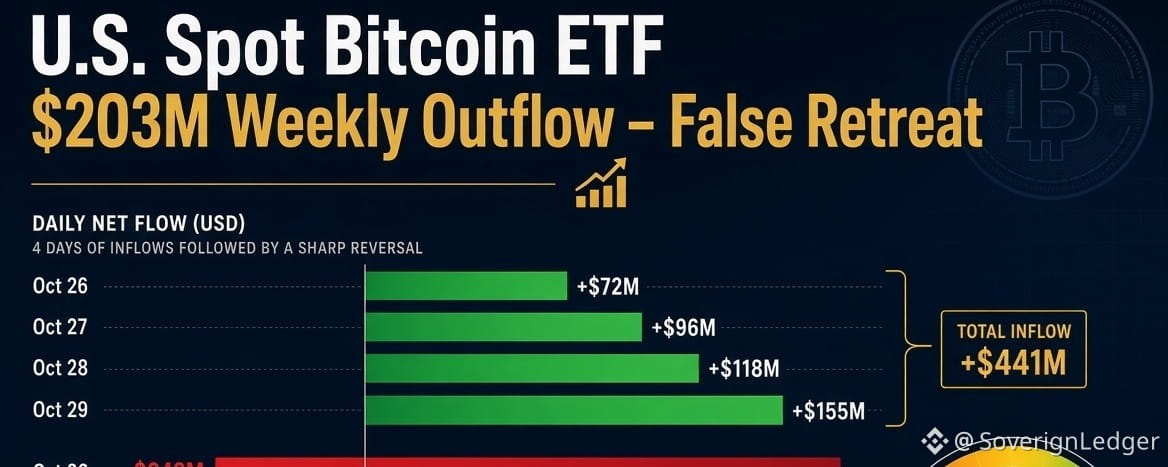
U.S. spot Bitcoin ETFs recorded ~$203 million net outflows for the week ending October 30. This headline is highly misleading.
- Oct 26–29: Four consecutive inflow days totaling +$441 million
- Oct 30: Single-day –$643 million outflow erased the entire week’s gains
The outflow was extremely concentrated in just three products (IBIT, FBTC, ARKB ≈ 88% of the day’s redemptions). BlackRock’s IBIT still finished the full week with +$177 million net inflows.
This pattern points to month-end institutional rebalancing or a large single redemption event — not broad investor retreat.
Sentiment stayed in “Fear” (Fear & Greed Index 34–37). BTC consolidated weakly in the $77k–$78k range. Short-term negative feedback existed, but no confirmed institutional exit trend.
II. Weekly Flow Breakdown 📊
| Date | Net Flow ($M) | Notes |
| Oct 26 | +110.3 | Modest start |
| Oct 27 | +176.0 | Strongest inflow day |
| Oct 28 | +137.3 |Third consecutive inflow |
| Oct 29 | +17.2 | Momentum fading |
| Oct 30 | –643.2 | Reversal day |
| Week | –202.4 | First 4 days +440.8 |
Last-day outflow was 1.46× the prior four days’ cumulative inflows.
III. Fund-Level Concentration 🎯
October 30 Outflow Share
- IBIT (BlackRock): –$233.7M (36.3%)
- FBTC (Fidelity): –$201.0M (31.3%)
- ARKB (ARK 21Shares): –$129.5M (20.1%)
- Top 3 combined: –$564.2M (87.7%)
Weekly divergence
- IBIT: still +$177M for the full week
- FBTC: –$166M for the week
- ARKB: almost entirely the Friday outflow
This structural split is the key signal — not systemic bearishness.
IV. Market Effects 📉
- BTC dipped briefly to ~$76.3k on Oct 30 then rebounded; currently $77.8k–$78.4k
- Key levels: $76k support / $80k resistance
- Fear & Greed: 34 (Nov 1) → 37 (Nov 2) — cautious, not panic
ETF redemptions ≠ direct spot selling (in-kind mechanics + AP hedging). Month-end effect amplified the concentration.
V. Broader October Context 🗓️
- Full-month net outflow: ~$515 million
- 30-day rolling flow turned negative ($–292M) for first time since late July
- Macro pressure: hotter CPI/PPI, sticky yields ~5%, BTC trading below average ETF cost basis (~$82.3k)
VI. Outlook — Episode or Trend? 🔍
Monitor next week:
- Return to weekly net inflows → confirms technical episode
- IBIT stays positive → structural rebalancing
- Spread to mid/small funds + IBIT sustained outflows → trend risk rises
Baseline view: Month-end concentrated rebalancing remains more probable than systematic institutional retreat.
VII. Risk Notes ⚠️
- Tracker methodologies (Farside, SosoValue, etc.) can differ
- Flows are coincident/lagging dema
nd signals, not pure price predictors
- High concentration means a few large players can swing weekly headlines
One-line summary
The $203M weekly outflow is “headline correct, narrative wrong”: four days of inflows were wiped out by a single concentrated $643M month-end redemption day, while IBIT stayed net positive.
$BTC
#BinanceProcesses$4.65BWithdrawals #WithdrawalsBack: 15 networks live #BinanceToResumePhaseOneOfWithdrawals #BTCPayServerUrgesOperatorsToShutDownInstances
Spot Bitcoin ETF $203M Weekly Outflow
#BitcoinSpotETFsPost$203MWeeklyOutflowSpot Bitcoin ETF $203M Weekly Outflow — A “False Retreat” Distorted by Single-Day Reversal
📅November 2, 2026 | Data as of: October 30, 2026 close
I. Core Conclusion 🔑
U.S. spot Bitcoin ETFs recorded ~$203 million net outflows for the week ending October 30. This headline is highly misleading.
- Oct 26–29: Four consecutive inflow days totaling +$441 million
- Oct 30: Single-day –$643 million outflow erased the entire week’s gains
The outflow was extremely concentrated in just three products (IBIT, FBTC, ARKB ≈ 88% of the day’s redemptions). BlackRock’s IBIT still finished the full week with +$177 million net inflows.
This pattern points to month-end institutional rebalancing or a large single redemption event — not broad investor retreat.
Sentiment stayed in “Fear” (Fear & Greed Index 34–37). BTC consolidated weakly in the $77k–$78k range. Short-term negative feedback existed, but no confirmed institutional exit trend.
II. Weekly Flow Breakdown 📊
| Date | Net Flow ($M) | Notes |
| Oct 26 | +110.3 | Modest start |
| Oct 27 | +176.0 | Strongest inflow day |
| Oct 28 | +137.3 |Third consecutive inflow |
| Oct 29 | +17.2 | Momentum fading |
| Oct 30 | –643.2 | Reversal day |
| Week | –202.4 | First 4 days +440.8 |
Last-day outflow was 1.46× the prior four days’ cumulative inflows.
III. Fund-Level Concentration 🎯
October 30 Outflow Share
- IBIT (BlackRock): –$233.7M (36.3%)
- FBTC (Fidelity): –$201.0M (31.3%)
- ARKB (ARK 21Shares): –$129.5M (20.1%)
- Top 3 combined: –$564.2M (87.7%)
Weekly divergence
- IBIT: still +$177M for the full week
- FBTC: –$166M for the week
- ARKB: almost entirely the Friday outflow
This structural split is the key signal — not systemic bearishness.
IV. Market Effects 📉
- BTC dipped briefly to ~$76.3k on Oct 30 then rebounded; currently $77.8k–$78.4k
- Key levels: $76k support / $80k resistance
- Fear & Greed: 34 (Nov 1) → 37 (Nov 2) — cautious, not panic
ETF redemptions ≠ direct spot selling (in-kind mechanics + AP hedging). Month-end effect amplified the concentration.
V. Broader October Context 🗓️
- Full-month net outflow: ~$515 million
- 30-day rolling flow turned negative ($–292M) for first time since late July
- Macro pressure: hotter CPI/PPI, sticky yields ~5%, BTC trading below average ETF cost basis (~$82.3k)
VI. Outlook — Episode or Trend? 🔍
Monitor next week:
- Return to weekly net inflows → confirms technical episode
- IBIT stays positive → structural rebalancing
- Spread to mid/small funds + IBIT sustained outflows → trend risk rises
Baseline view: Month-end concentrated rebalancing remains more probable than systematic institutional retreat.
VII. Risk Notes ⚠️
- Tracker methodologies (Farside, SosoValue, etc.) can differ
- Flows are coincident/lagging dema
nd signals, not pure price predictors
- High concentration means a few large players can swing weekly headlines
One-line summary
The $203M weekly outflow is “headline correct, narrative wrong”: four days of inflows were wiped out by a single concentrated $643M month-end redemption day, while IBIT stayed net positive.
$BTC
#BinanceProcesses$4.65BWithdrawals #WithdrawalsBack: 15 networks live #BinanceToResumePhaseOneOfWithdrawals #BTCPayServerUrgesOperatorsToShutDownInstances
📅November 2, 2026 | Data as of: October 30, 2026 close
I. Core Conclusion 🔑
U.S. spot Bitcoin ETFs recorded ~$203 million net outflows for the week ending October 30. This headline is highly misleading.
- Oct 26–29: Four consecutive inflow days totaling +$441 million
- Oct 30: Single-day –$643 million outflow erased the entire week’s gains
The outflow was extremely concentrated in just three products (IBIT, FBTC, ARKB ≈ 88% of the day’s redemptions). BlackRock’s IBIT still finished the full week with +$177 million net inflows.
This pattern points to month-end institutional rebalancing or a large single redemption event — not broad investor retreat.
Sentiment stayed in “Fear” (Fear & Greed Index 34–37). BTC consolidated weakly in the $77k–$78k range. Short-term negative feedback existed, but no confirmed institutional exit trend.
II. Weekly Flow Breakdown 📊
| Date | Net Flow ($M) | Notes |
| Oct 26 | +110.3 | Modest start |
| Oct 27 | +176.0 | Strongest inflow day |
| Oct 28 | +137.3 |Third consecutive inflow |
| Oct 29 | +17.2 | Momentum fading |
| Oct 30 | –643.2 | Reversal day |
| Week | –202.4 | First 4 days +440.8 |
Last-day outflow was 1.46× the prior four days’ cumulative inflows.
III. Fund-Level Concentration 🎯
October 30 Outflow Share
- IBIT (BlackRock): –$233.7M (36.3%)
- FBTC (Fidelity): –$201.0M (31.3%)
- ARKB (ARK 21Shares): –$129.5M (20.1%)
- Top 3 combined: –$564.2M (87.7%)
Weekly divergence
- IBIT: still +$177M for the full week
- FBTC: –$166M for the week
- ARKB: almost entirely the Friday outflow
This structural split is the key signal — not systemic bearishness.
IV. Market Effects 📉
- BTC dipped briefly to ~$76.3k on Oct 30 then rebounded; currently $77.8k–$78.4k
- Key levels: $76k support / $80k resistance
- Fear & Greed: 34 (Nov 1) → 37 (Nov 2) — cautious, not panic
ETF redemptions ≠ direct spot selling (in-kind mechanics + AP hedging). Month-end effect amplified the concentration.
V. Broader October Context 🗓️
- Full-month net outflow: ~$515 million
- 30-day rolling flow turned negative ($–292M) for first time since late July
- Macro pressure: hotter CPI/PPI, sticky yields ~5%, BTC trading below average ETF cost basis (~$82.3k)
VI. Outlook — Episode or Trend? 🔍
Monitor next week:
- Return to weekly net inflows → confirms technical episode
- IBIT stays positive → structural rebalancing
- Spread to mid/small funds + IBIT sustained outflows → trend risk rises
Baseline view: Month-end concentrated rebalancing remains more probable than systematic institutional retreat.
VII. Risk Notes ⚠️
- Tracker methodologies (Farside, SosoValue, etc.) can differ
- Flows are coincident/lagging dema
nd signals, not pure price predictors
- High concentration means a few large players can swing weekly headlines
One-line summary
The $203M weekly outflow is “headline correct, narrative wrong”: four days of inflows were wiped out by a single concentrated $643M month-end redemption day, while IBIT stayed net positive.
$BTC
#BinanceProcesses$4.65BWithdrawals #WithdrawalsBack: 15 networks live #BinanceToResumePhaseOneOfWithdrawals #BTCPayServerUrgesOperatorsToShutDownInstances
BTC+0,64%
BLKUS+0,56%
1
139

#BitcoinSpotETFsPost$203MWeeklyOutflow La salida neta semanal de 203 millones de dólares de los fondos cotizados en bolsa (ETFs) de Bitcoin al contado en los Estados Unidos marca un periodo de consolidación técnica y ajuste de riesgo por parte de las grandes mesas de dinero institucionales en Wall Street. Este flujo negativo, concentrado principalmente en los vehículos de inversión tradicionales, no responde a un fallo en los fundamentos de la tecnología blockchain, sino a una toma de ganancias táctica e inducida por la incertidumbre macroeconómica global y la proximidad de las reuniones de política monetaria de la Reserva Federal. Los gestores de fondos de pensiones y capitales privados tienden a reducir temporalmente su exposición a activos de alta volatilidad para equilibrar sus carteras y asegurar liquidez en instrumentos de deuda soberana de corto plazo, estabilizando sus balances antes de planificar nuevas asignaciones trimestrales de capital de riesgo.$BNB $ETH $BTC
{future}(BTCUSDT)
{future}(ETHUSDT)
{future}(BNBUSDT)
#BitcoinSpotETFsPost$203MWeeklyOutflow La salida neta semanal de 203 millones de dólares de los fondos cotizados en bolsa (ETFs) de Bitcoin al contado en los Estados Unidos marca un periodo de consolidación técnica y ajuste de riesgo por parte de las grandes mesas de dinero institucionales en Wall Street. Este flujo negativo, concentrado principalmente en los vehículos de inversión tradicionales, no responde a un fallo en los fundamentos de la tecnología blockchain, sino a una toma de ganancias táctica e inducida por la incertidumbre macroeconómica global y la proximidad de las reuniones de política monetaria de la Reserva Federal. Los gestores de fondos de pensiones y capitales privados tienden a reducir temporalmente su exposición a activos de alta volatilidad para equilibrar sus carteras y asegurar liquidez en instrumentos de deuda soberana de corto plazo, estabilizando sus balances antes de planificar nuevas asignaciones trimestrales de capital de riesgo.$BNB $ETH $BTC
57

·
--
Падение
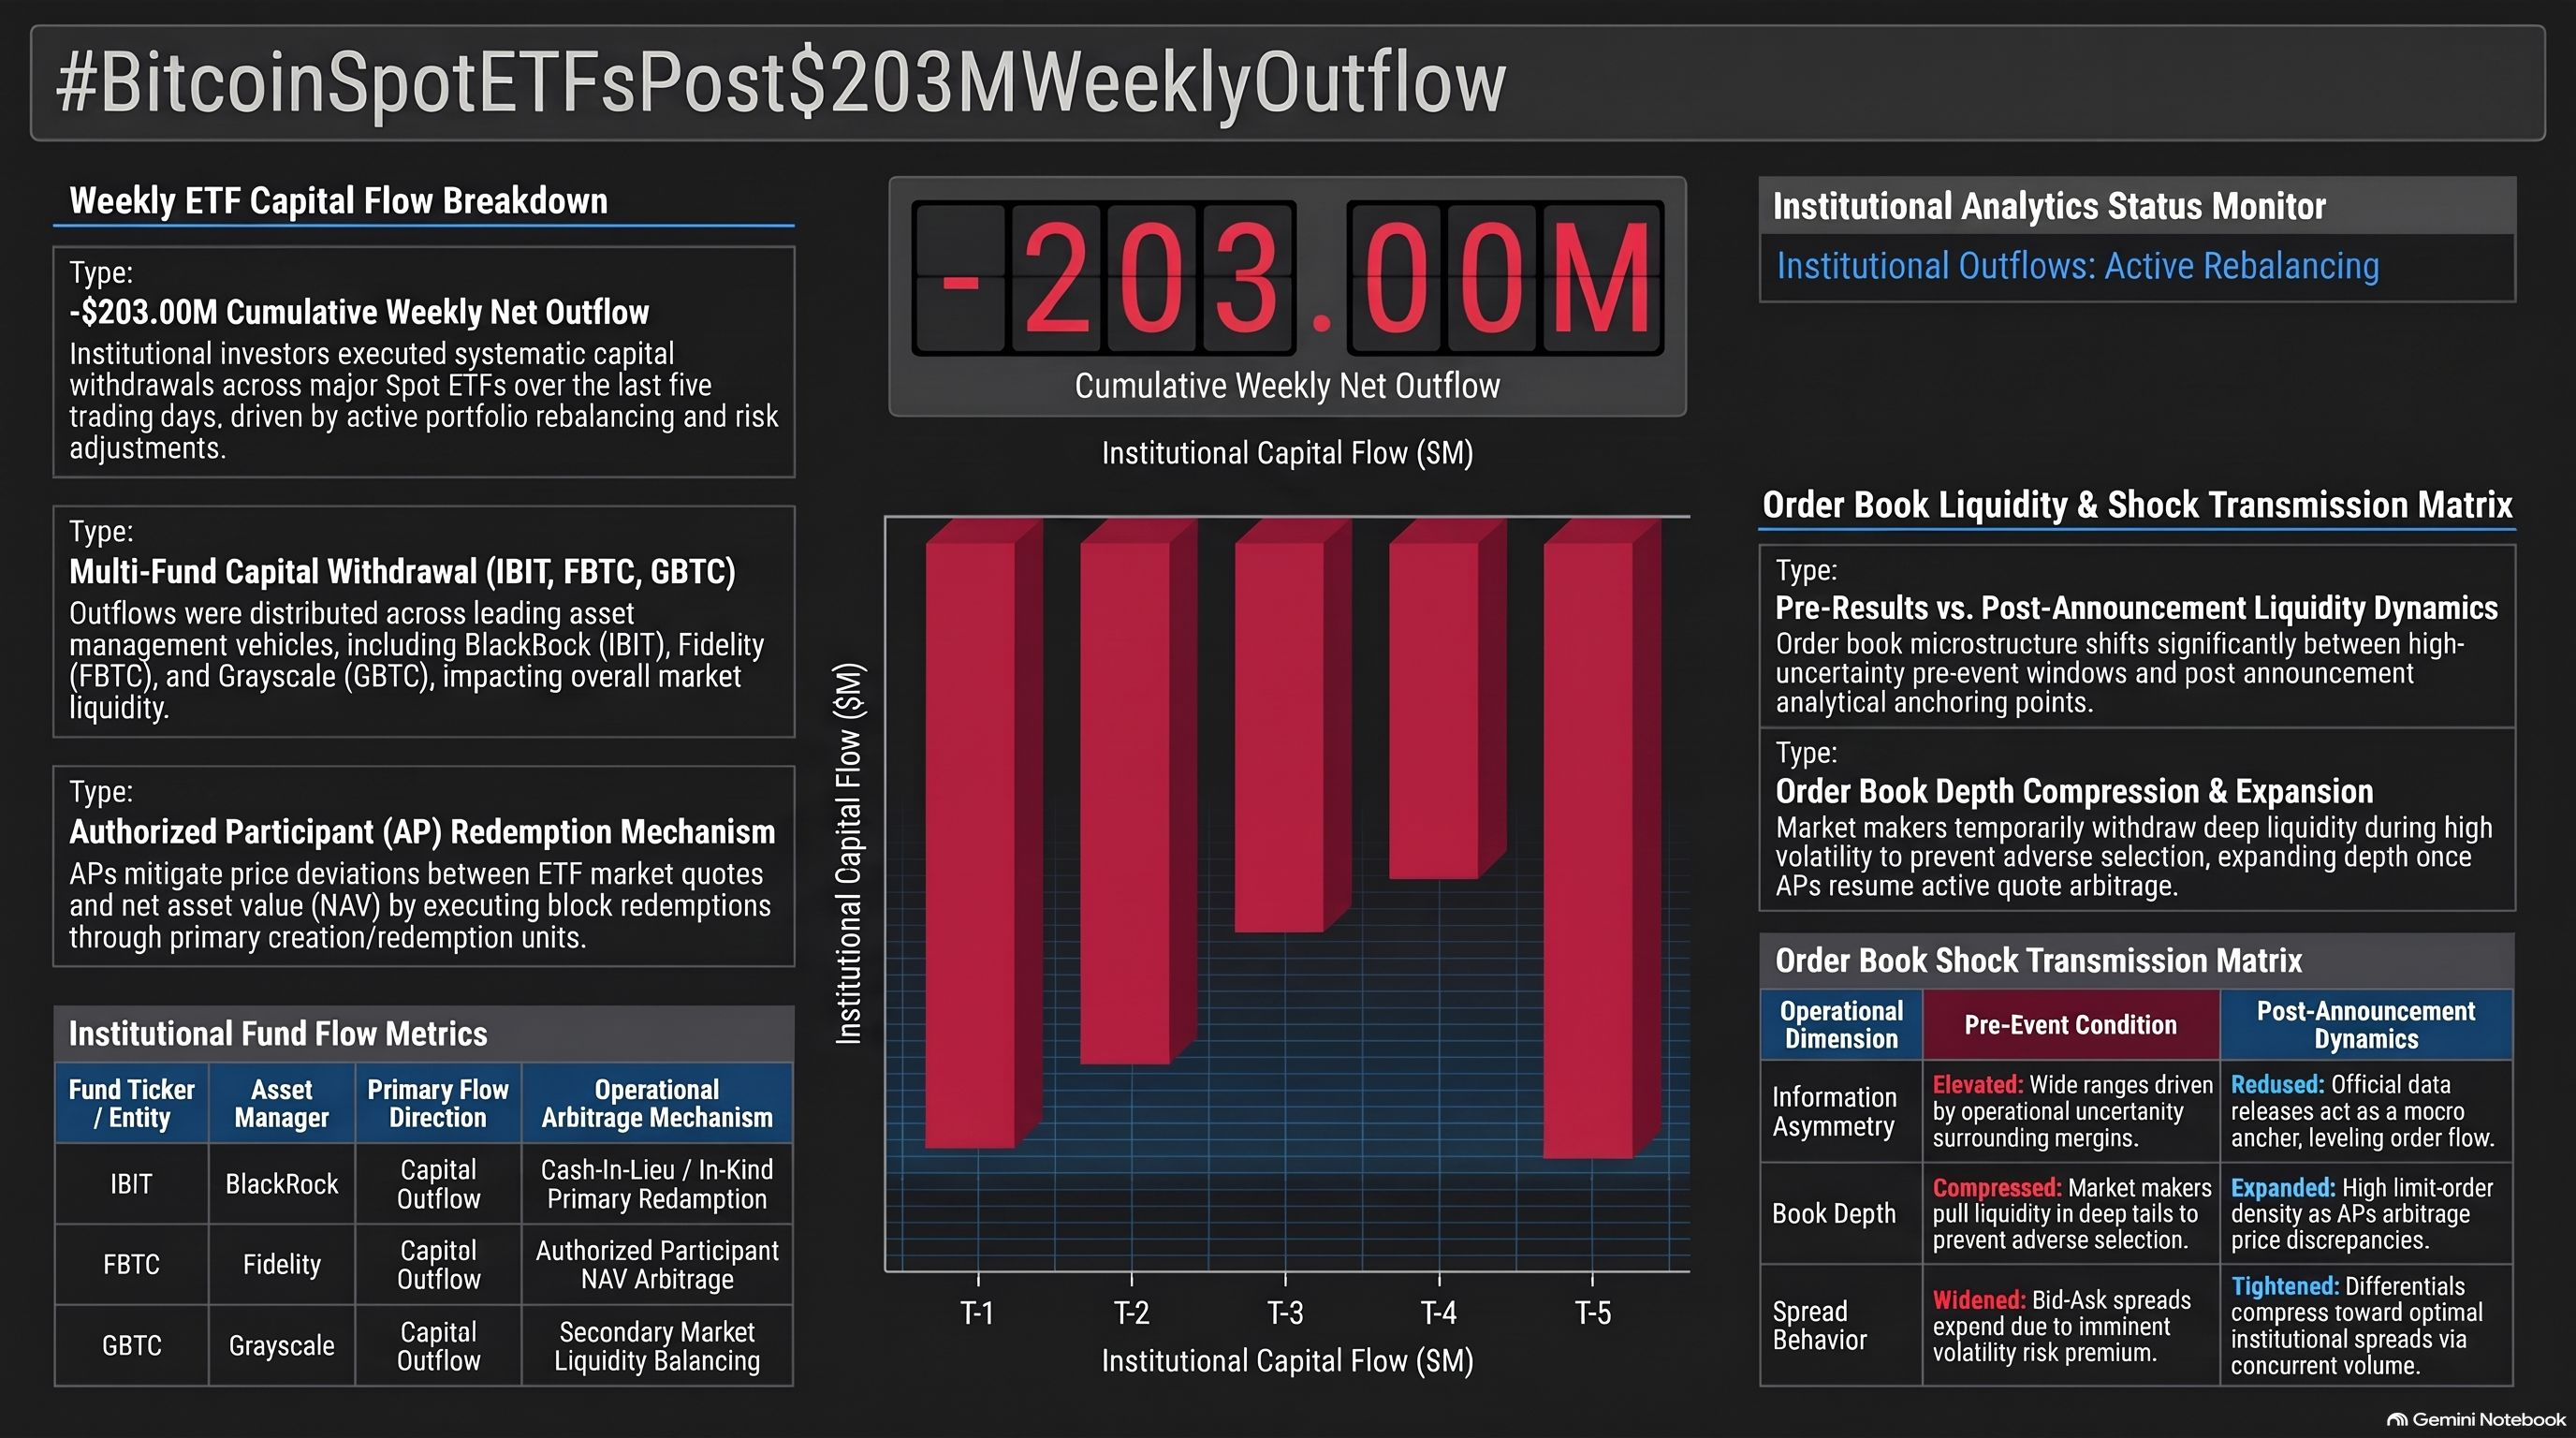
$BTC 📉 Loss of support leads to a sharp sell-off:
Once the 4-hour candle closes below 76,000 USDT—amidst consistent net outflows from ETFs and a significant drop in the Fear & Greed Index—it confirms that the bears have taken full control. There is a high risk of leveraged liquidations in the 73,000 USDT – 71,000 USDT range; avoid "catching the falling knife" (buying the dip too early).
Trade Setup: Short - BTC 📉
Entry: $78,605
SL: $79,198
TP1: $76,052
TP2: $73,532
TP3: $70,305
✅ Click here to trade: 👇
#BitcoinSpotETFsPost$203MWeeklyOutflow
{future}(BTCUSDT)
$BTC 📉 Loss of support leads to a sharp sell-off:
Once the 4-hour candle closes below 76,000 USDT—amidst consistent net outflows from ETFs and a significant drop in the Fear & Greed Index—it confirms that the bears have taken full control. There is a high risk of leveraged liquidations in the 73,000 USDT – 71,000 USDT range; avoid "catching the falling knife" (buying the dip too early).
Trade Setup: Short - BTC 📉
Entry: $78,605
SL: $79,198
TP1: $76,052
TP2: $73,532
TP3: $70,305
✅ Click here to trade: 👇
#BitcoinSpotETFsPost$203MWeeklyOutflow
Once the 4-hour candle closes below 76,000 USDT—amidst consistent net outflows from ETFs and a significant drop in the Fear & Greed Index—it confirms that the bears have taken full control. There is a high risk of leveraged liquidations in the 73,000 USDT – 71,000 USDT range; avoid "catching the falling knife" (buying the dip too early).
Trade Setup: Short - BTC 📉
Entry: $78,605
SL: $79,198
TP1: $76,052
TP2: $73,532
TP3: $70,305
✅ Click here to trade: 👇
#BitcoinSpotETFsPost$203MWeeklyOutflow
16
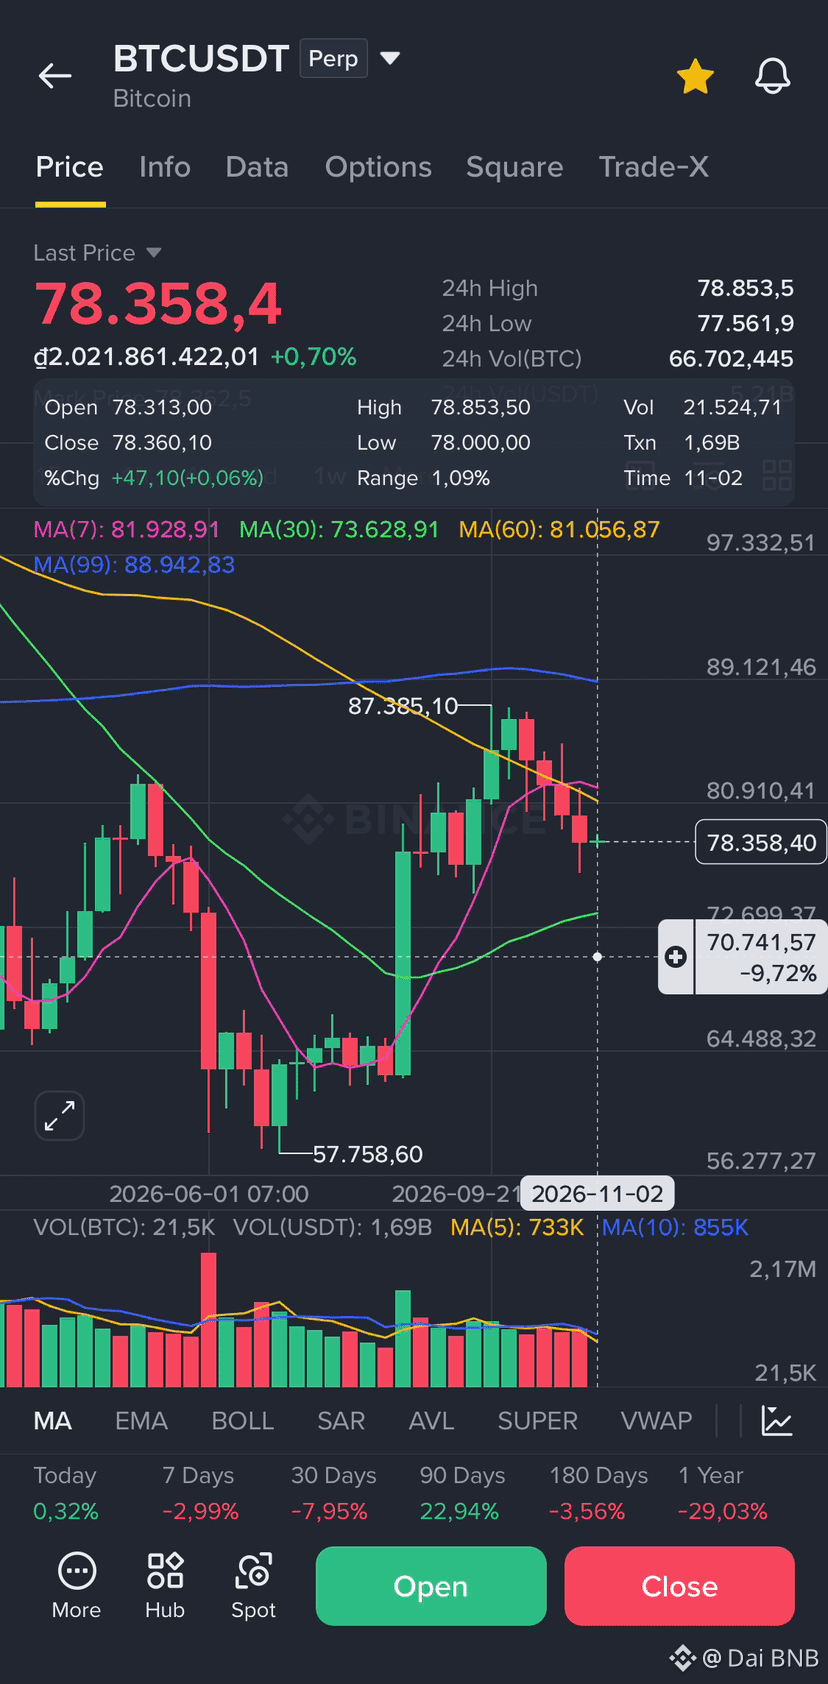
#BitcoinSpotETFsPost$203MWeeklyOutflow A nivel de microestructura de mercado, la contracción en el volumen circulante dentro de los fideicomisos obliga a los creadores de mercado autorizados (APs) a canjear participaciones de los ETFs por los activos subyacentes reales, devolviendo bloques significativos de Bitcoin al mercado spot o a los custodios institucionales. Esta dinámica introduce una fuerte fricción temporal en la formación de precios a corto plazo, ya que la oferta secundaria debe ser absorbida por compradores minoristas o mesas Over-The-Counter (OTC) asociadas para evitar una caída libre en las cotizaciones globales. Sin embargo, la resiliencia demostrada por la profundidad del libro de órdenes durante este retiro multimillonario confirma la madurez de los rieles financieros construidos durante el último año, permitiendo que Wall Street liquide cientos de millones de dólares semanales en perfecta sintonía con las necesidades de sus portafolios institucionales.$BNB $IBIT.ETF $FBTC.ETF
{etf_us}(FBTC.ETF)
{etf_us}(IBIT.ETF)
{future}(BNBUSDT)
#BitcoinSpotETFsPost$203MWeeklyOutflow A nivel de microestructura de mercado, la contracción en el volumen circulante dentro de los fideicomisos obliga a los creadores de mercado autorizados (APs) a canjear participaciones de los ETFs por los activos subyacentes reales, devolviendo bloques significativos de Bitcoin al mercado spot o a los custodios institucionales. Esta dinámica introduce una fuerte fricción temporal en la formación de precios a corto plazo, ya que la oferta secundaria debe ser absorbida por compradores minoristas o mesas Over-The-Counter (OTC) asociadas para evitar una caída libre en las cotizaciones globales. Sin embargo, la resiliencia demostrada por la profundidad del libro de órdenes durante este retiro multimillonario confirma la madurez de los rieles financieros construidos durante el último año, permitiendo que Wall Street liquide cientos de millones de dólares semanales en perfecta sintonía con las necesidades de sus portafolios institucionales.$BNB $IBIT.ETF $FBTC.ETF
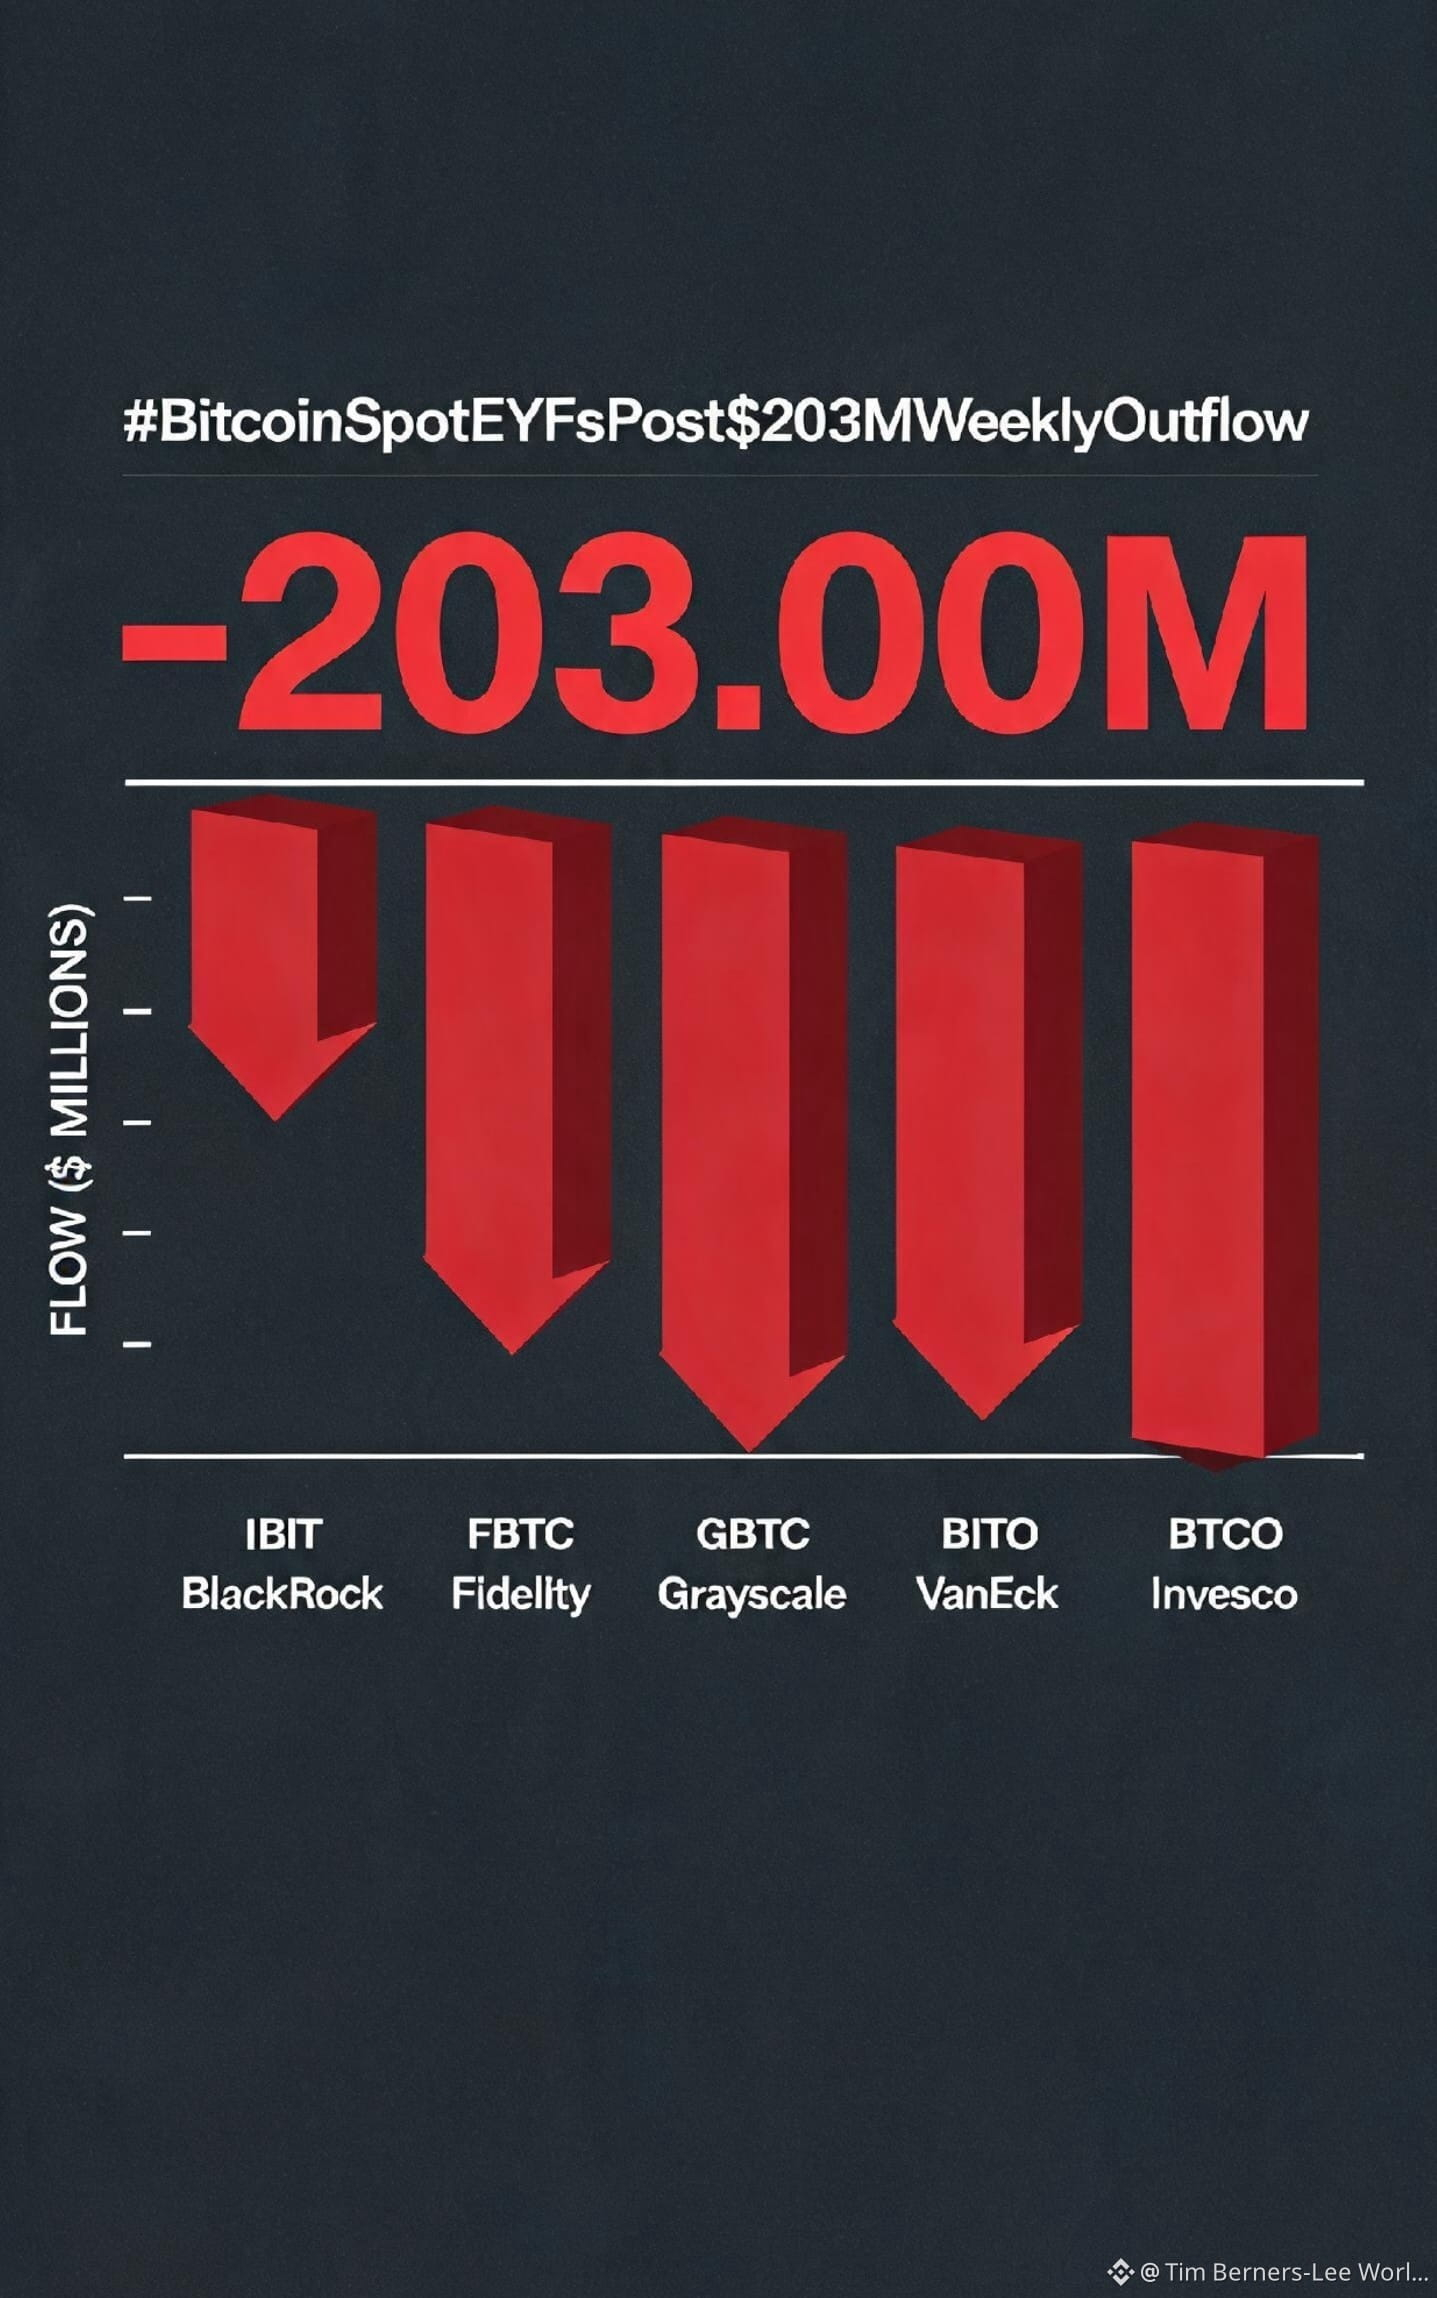
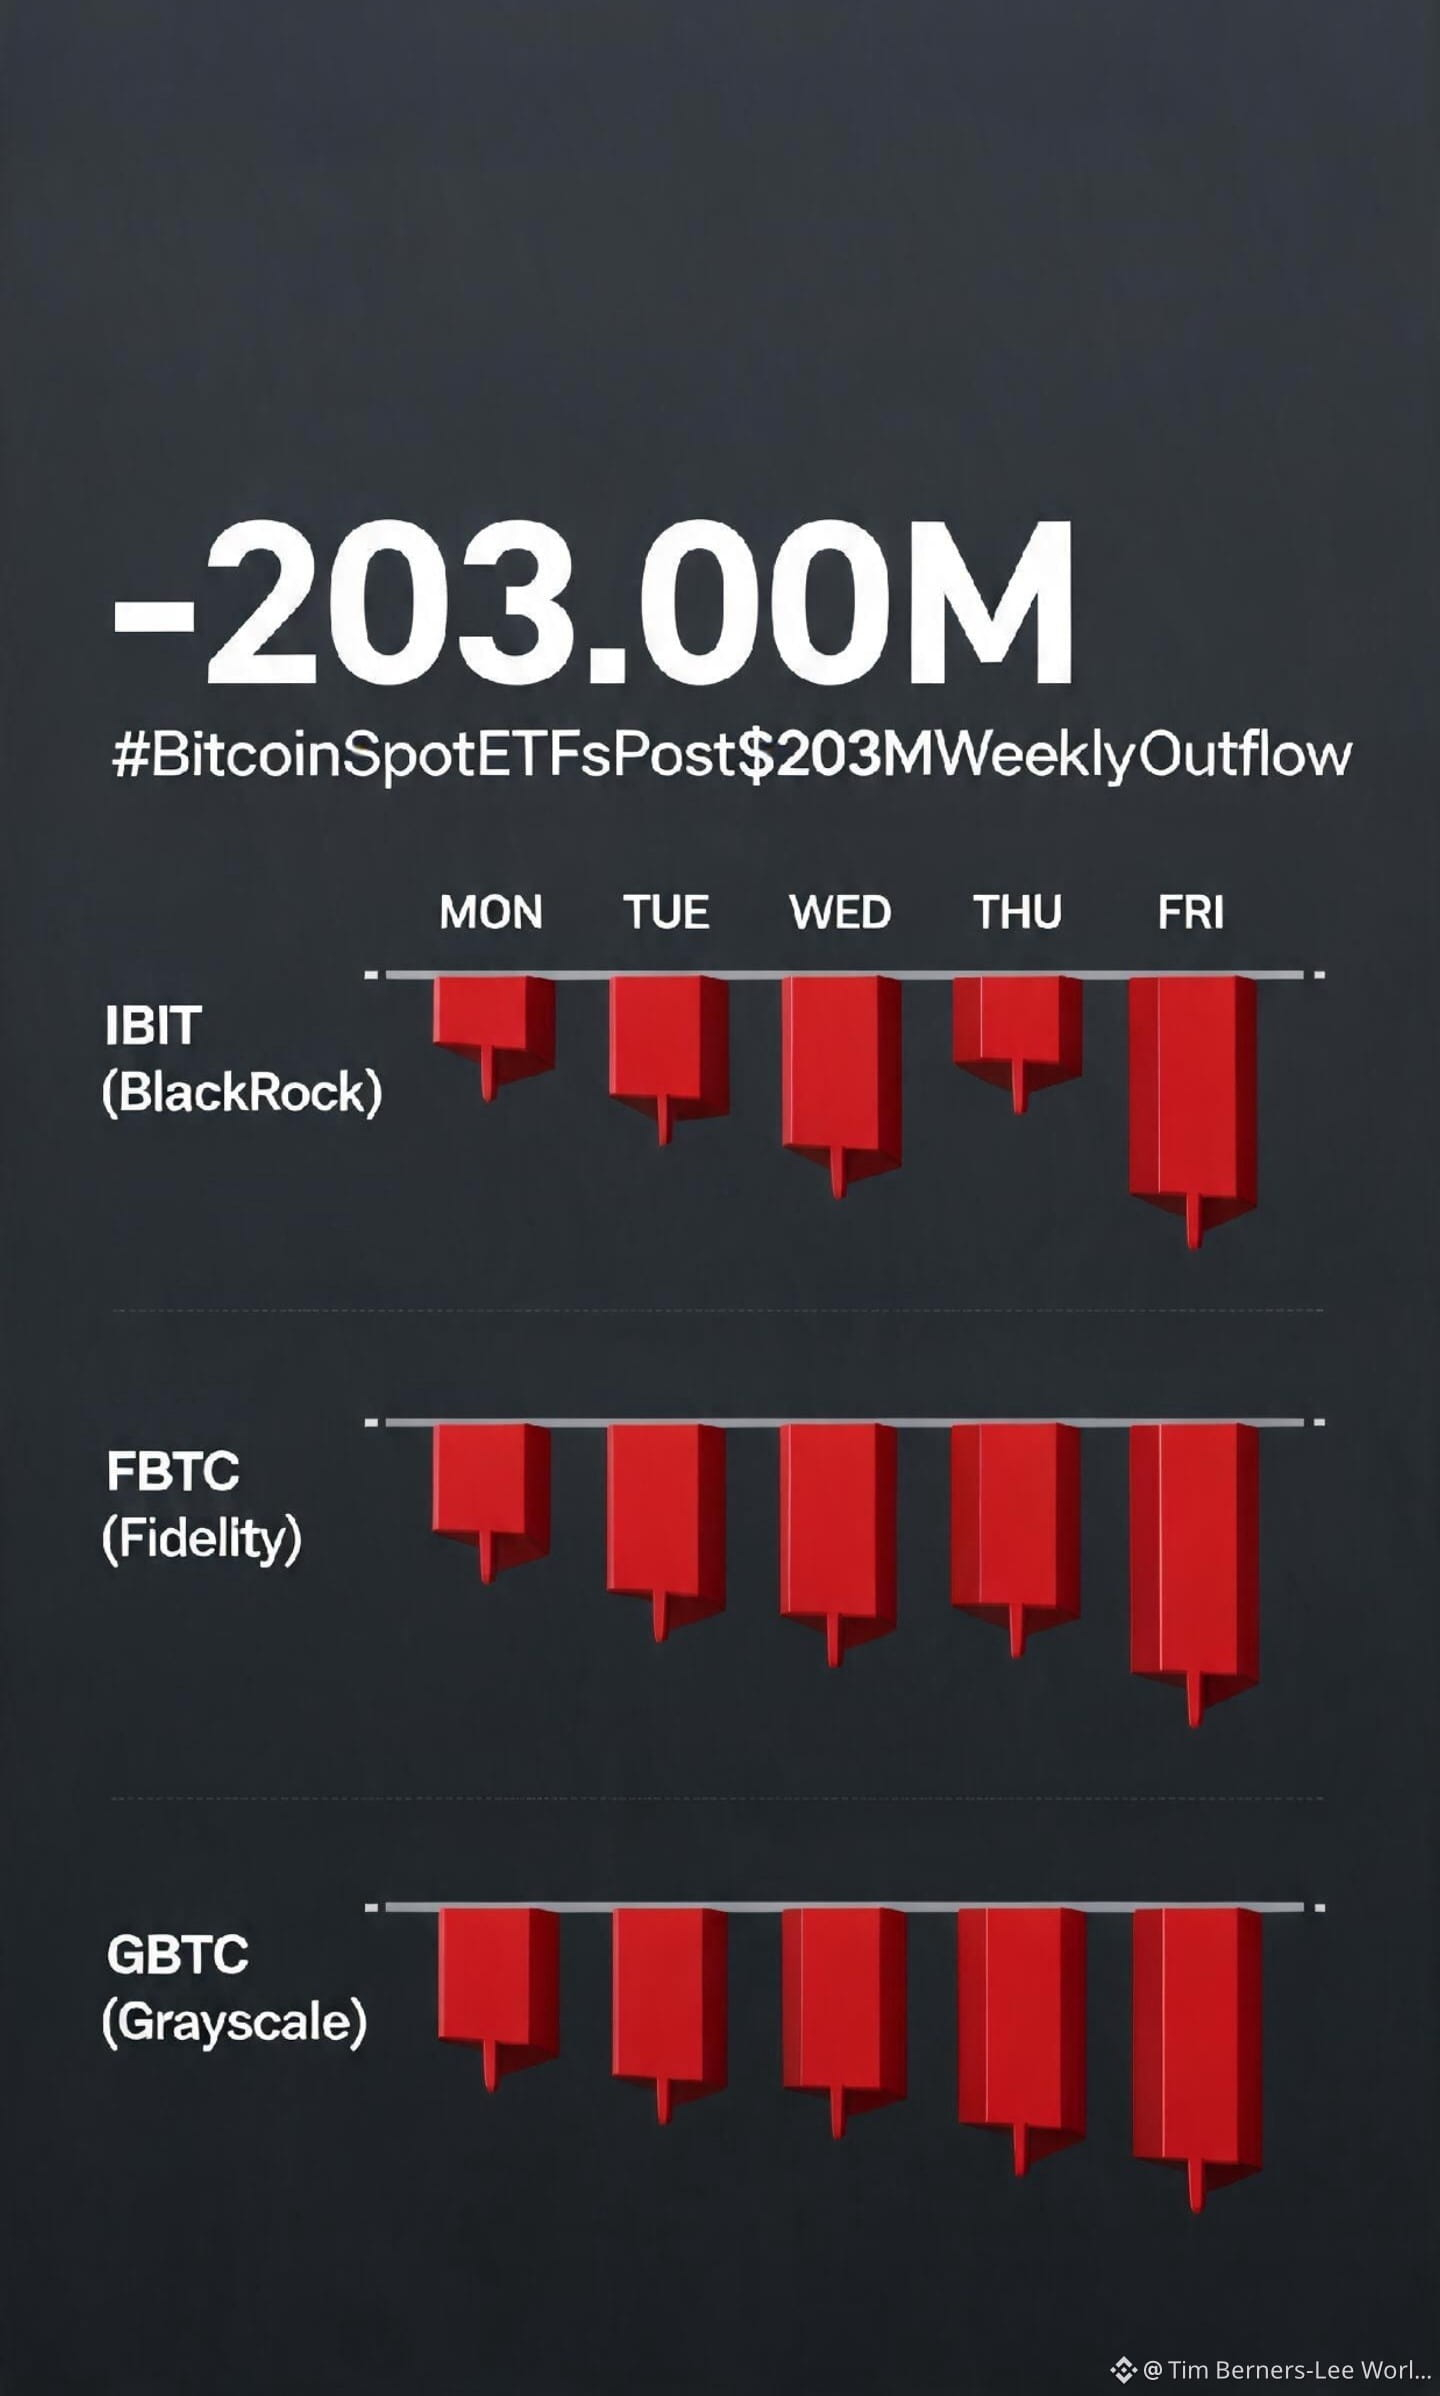
34

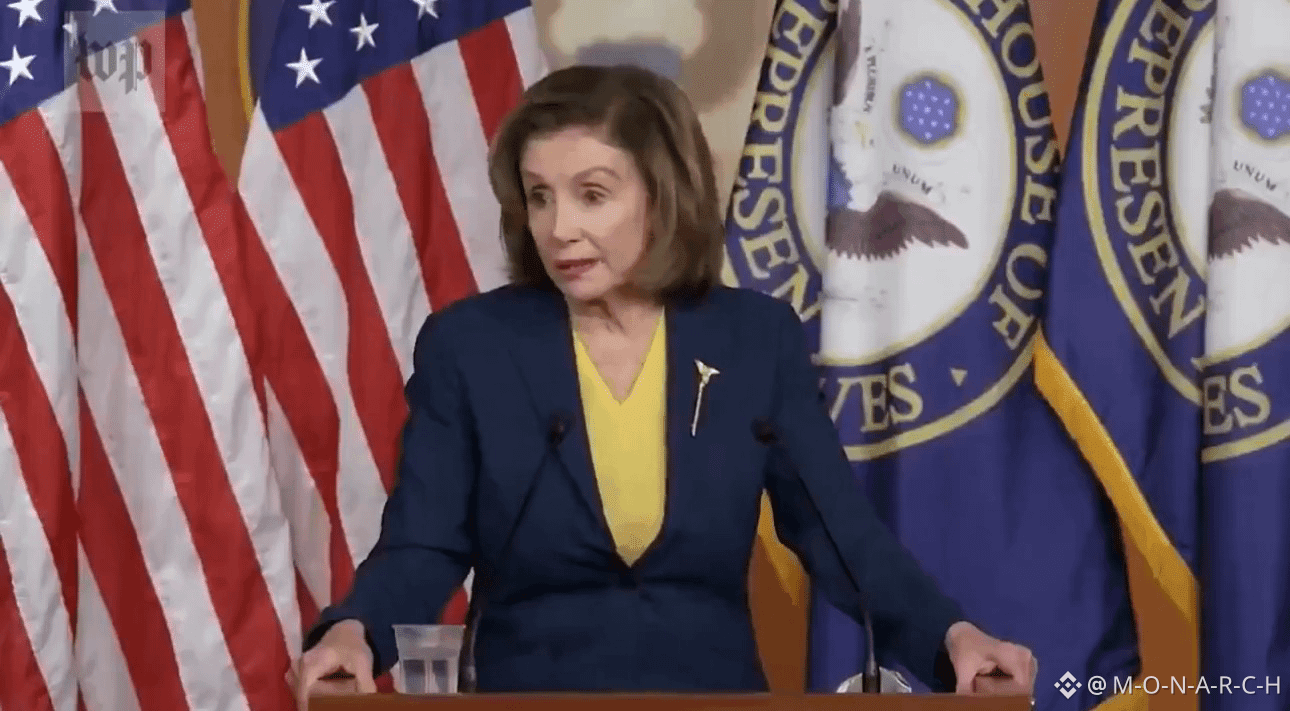
Nancy Pelosi has 60% of her portfolio in just 5 stocks.
This is how the House Democrat is invested right now.
1. NVIDIA ($NVDA): 16% of the portfolio
2. Alphabet ($GOOGL): 13% of the portfolio
3. Broadcom ($AVGO): 12% of the portfolio
4. Bloom Energy ($BE): 10% of the portfolio
5. Palo Alto Networks ($PANW): 8% of the portfolio
NFA | DYOR
#BinanceProcesses$4.65BWithdrawals #WithdrawalsBack: 15 networks live #EthereumSurpasses$2300 #BitcoinSpotETFsPost$203MWeeklyOutflow #SouthKoreanLawmakerProposesReviewOfAllListedDigitalAssets
Nancy Pelosi has 60% of her portfolio in just 5 stocks.
This is how the House Democrat is invested right now.
1. NVIDIA ($NVDA): 16% of the portfolio
2. Alphabet ($GOOGL): 13% of the portfolio
3. Broadcom ($AVGO): 12% of the portfolio
4. Bloom Energy ($BE): 10% of the portfolio
5. Palo Alto Networks ($PANW): 8% of the portfolio
NFA | DYOR
#BinanceProcesses$4.65BWithdrawals #WithdrawalsBack: 15 networks live #EthereumSurpasses$2300 #BitcoinSpotETFsPost$203MWeeklyOutflow #SouthKoreanLawmakerProposesReviewOfAllListedDigitalAssets
This is how the House Democrat is invested right now.
1. NVIDIA ($NVDA): 16% of the portfolio
2. Alphabet ($GOOGL): 13% of the portfolio
3. Broadcom ($AVGO): 12% of the portfolio
4. Bloom Energy ($BE): 10% of the portfolio
5. Palo Alto Networks ($PANW): 8% of the portfolio
NFA | DYOR
#BinanceProcesses$4.65BWithdrawals #WithdrawalsBack: 15 networks live #EthereumSurpasses$2300 #BitcoinSpotETFsPost$203MWeeklyOutflow #SouthKoreanLawmakerProposesReviewOfAllListedDigitalAssets
33

·
--
Рост
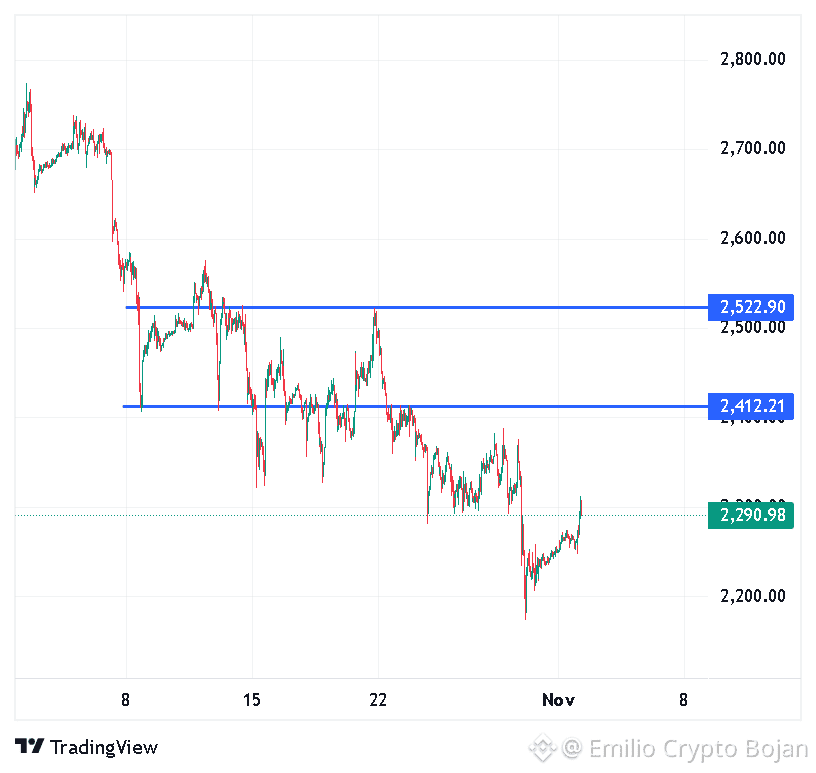
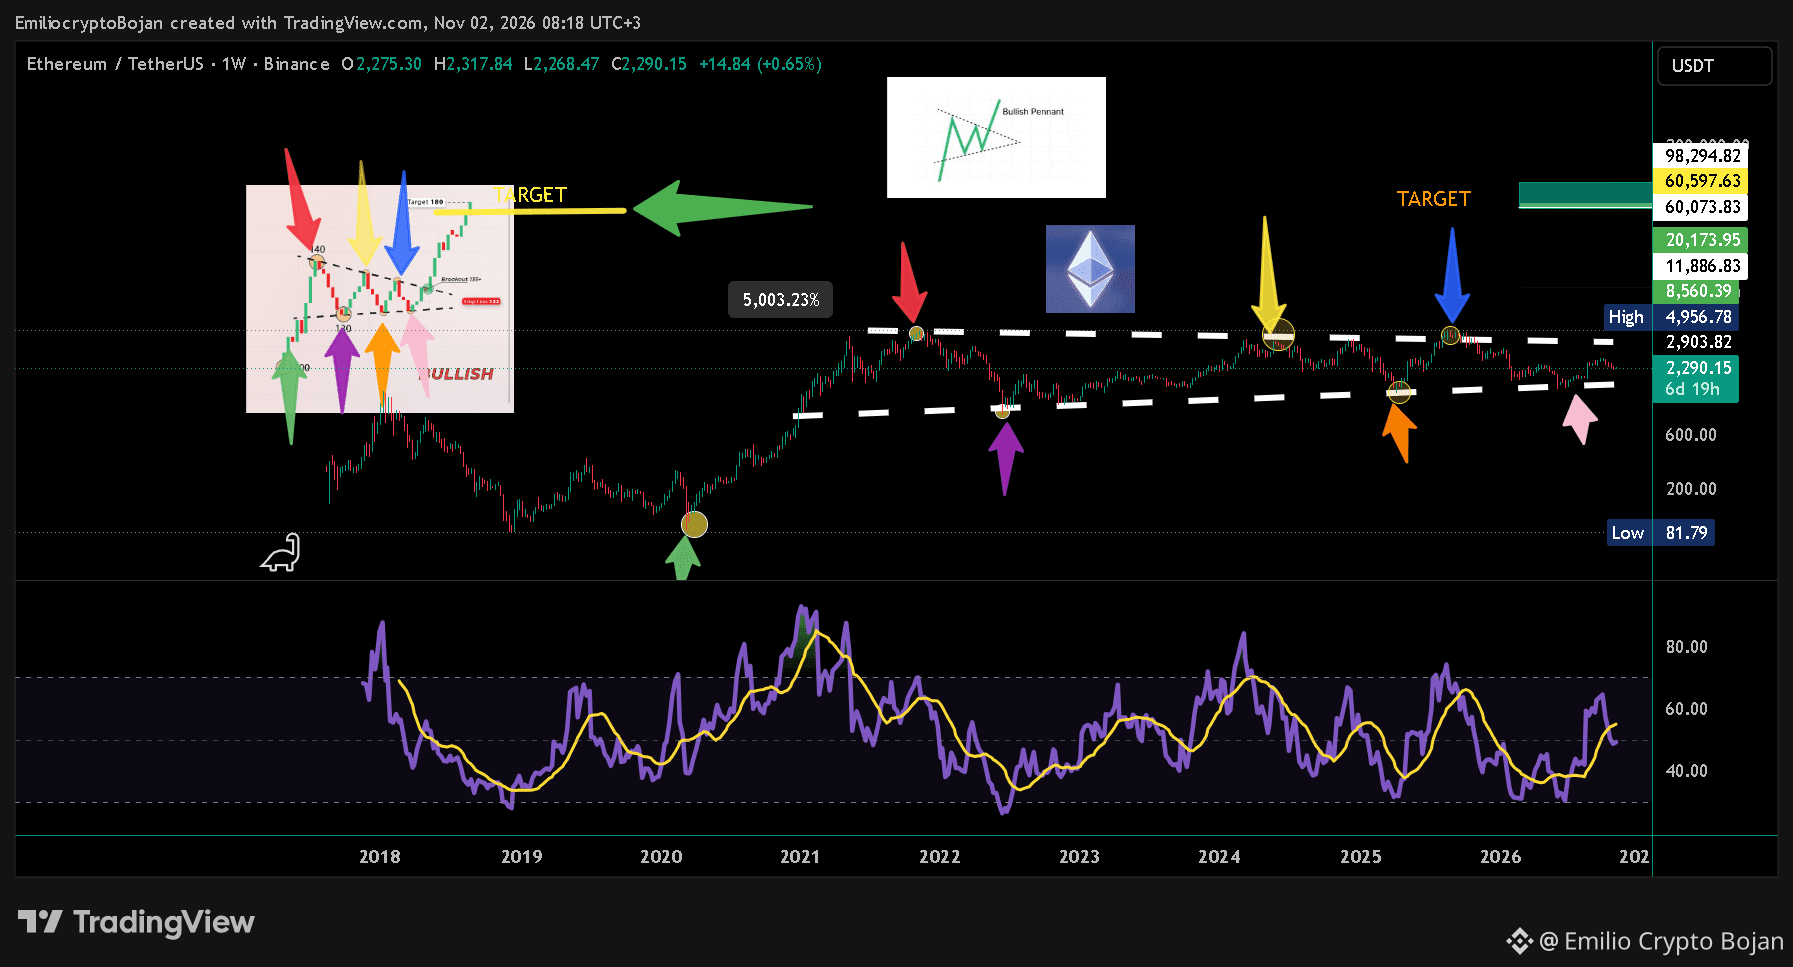
$ETH has tapped $2,300 today following Bitcoin's bullish move. 🚀
On top of that, ETH has a small but important range to reclaim: $2,412.21–$2,522.90.
Another critical level is $4,066. Clear that, and the real ascent begins.
Our targets remain unchanged:
🎯 $5,000
🎯 $8,560
🎯 $11,886.83
🎯 $20,173.95
🎯 $40,000
🎯 $60,073
Don't be among those who sell too early.
We could spend just as much time in the overbought region as we have spent in the oversold region.
Remember, the market doesn't move in a straight line.
$ETH could be the chart that ushers in the GREAT ALTSEASON 3.0. 🌍🚀
#BinanceProcesses$4.65BWithdrawals #WithdrawalsBack: 15 networks live #EthereumSurpasses$2300 #BitcoinSpotETFsPost$203MWeeklyOutflow
$ETH has tapped $2,300 today following Bitcoin's bullish move. 🚀
On top of that, ETH has a small but important range to reclaim: $2,412.21–$2,522.90.
Another critical level is $4,066. Clear that, and the real ascent begins.
Our targets remain unchanged:
🎯 $5,000
🎯 $8,560
🎯 $11,886.83
🎯 $20,173.95
🎯 $40,000
🎯 $60,073
Don't be among those who sell too early.
We could spend just as much time in the overbought region as we have spent in the oversold region.
Remember, the market doesn't move in a straight line.
$ETH could be the chart that ushers in the GREAT ALTSEASON 3.0. 🌍🚀
#BinanceProcesses$4.65BWithdrawals #WithdrawalsBack: 15 networks live #EthereumSurpasses$2300 #BitcoinSpotETFsPost$203MWeeklyOutflow
On top of that, ETH has a small but important range to reclaim: $2,412.21–$2,522.90.
Another critical level is $4,066. Clear that, and the real ascent begins.
Our targets remain unchanged:
🎯 $5,000
🎯 $8,560
🎯 $11,886.83
🎯 $20,173.95
🎯 $40,000
🎯 $60,073
Don't be among those who sell too early.
We could spend just as much time in the overbought region as we have spent in the oversold region.
Remember, the market doesn't move in a straight line.
$ETH could be the chart that ushers in the GREAT ALTSEASON 3.0. 🌍🚀
#BinanceProcesses$4.65BWithdrawals #WithdrawalsBack: 15 networks live #EthereumSurpasses$2300 #BitcoinSpotETFsPost$203MWeeklyOutflow
25
·
--
Рост
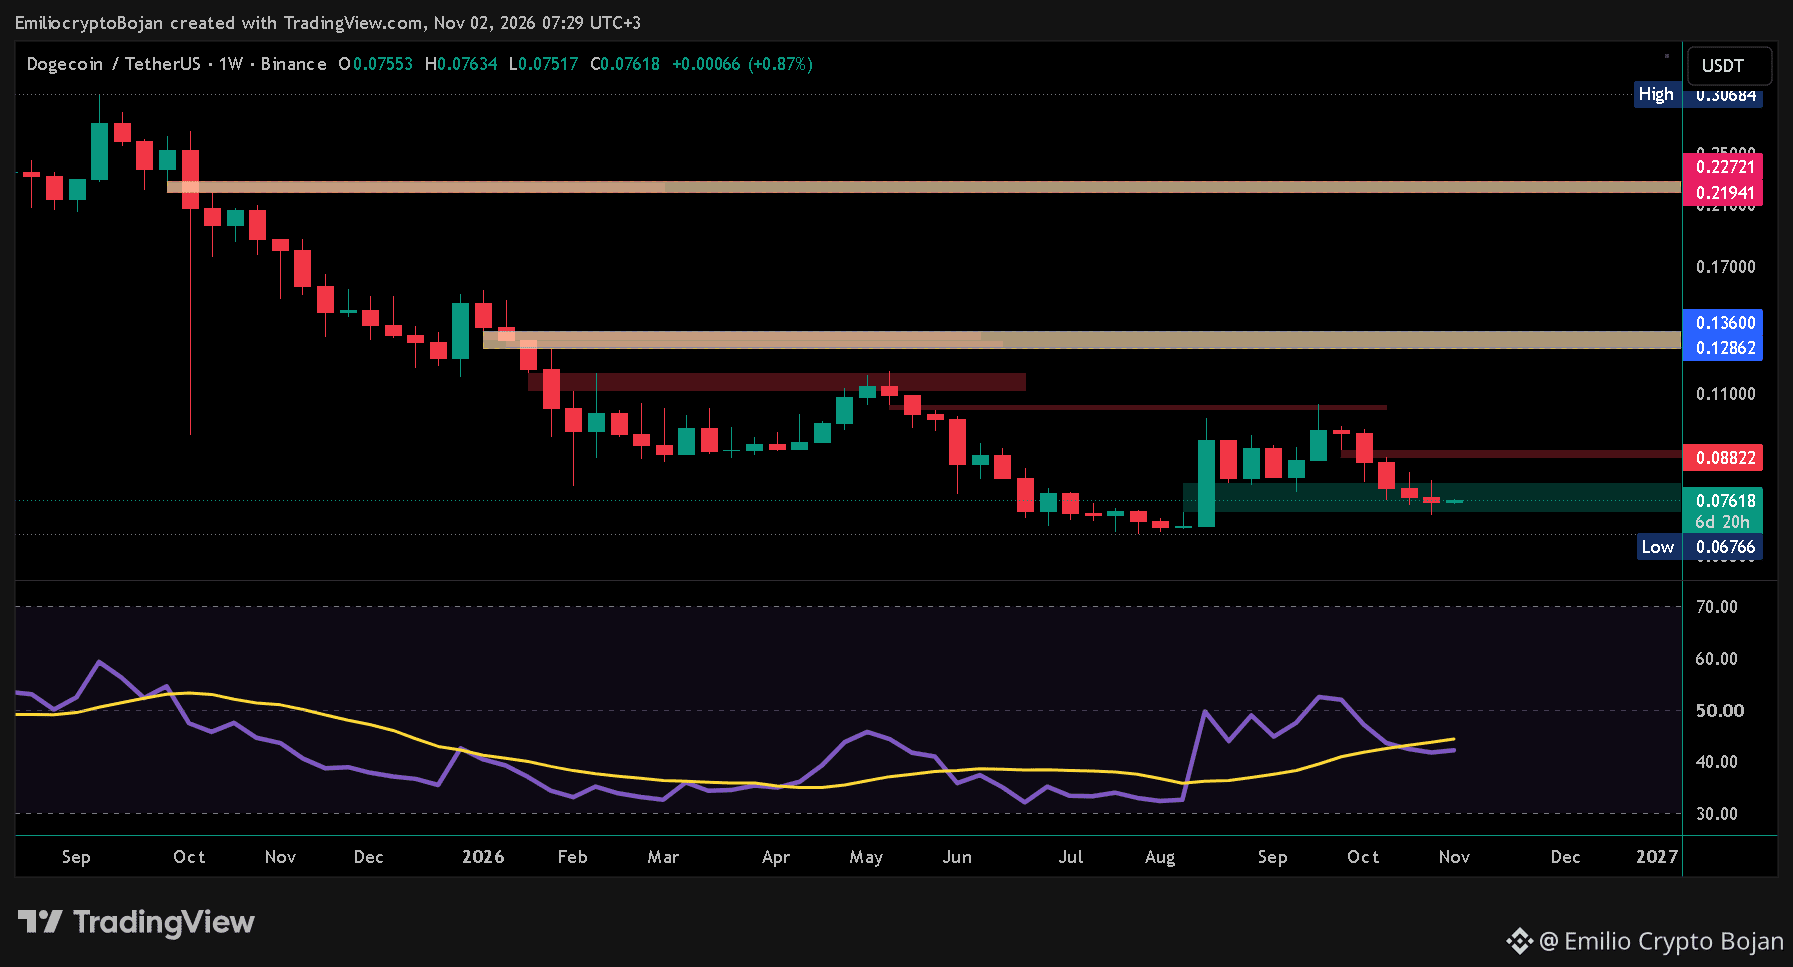
$DOGE just needs to break above $0.08822 to unlock TP1 around $0.12862–$0.22721.
A breakout here could be a major bullish catalyst for the entire memecoin sector and broader crypto market. 🐕🚀
Remember what Elon Musk said:
"SpaceX is going to put a literal Dogecoin to the literal moon."
Much wow. Much higher! 🐶🌕
#BinanceProcesses$4.65BWithdrawals #WithdrawalsBack: 15 networks live #BitcoinSpotETFsPost$203MWeeklyOutflow #DOGEUSDT
$DOGE just needs to break above $0.08822 to unlock TP1 around $0.12862–$0.22721.
A breakout here could be a major bullish catalyst for the entire memecoin sector and broader crypto market. 🐕🚀
Remember what Elon Musk said:
"SpaceX is going to put a literal Dogecoin to the literal moon."
Much wow. Much higher! 🐶🌕
#BinanceProcesses$4.65BWithdrawals #WithdrawalsBack: 15 networks live #BitcoinSpotETFsPost$203MWeeklyOutflow #DOGEUSDT
A breakout here could be a major bullish catalyst for the entire memecoin sector and broader crypto market. 🐕🚀
Remember what Elon Musk said:
"SpaceX is going to put a literal Dogecoin to the literal moon."
Much wow. Much higher! 🐶🌕
#BinanceProcesses$4.65BWithdrawals #WithdrawalsBack: 15 networks live #BitcoinSpotETFsPost$203MWeeklyOutflow #DOGEUSDT

1
58
·
--
Рост
HOT Monday: 🔥
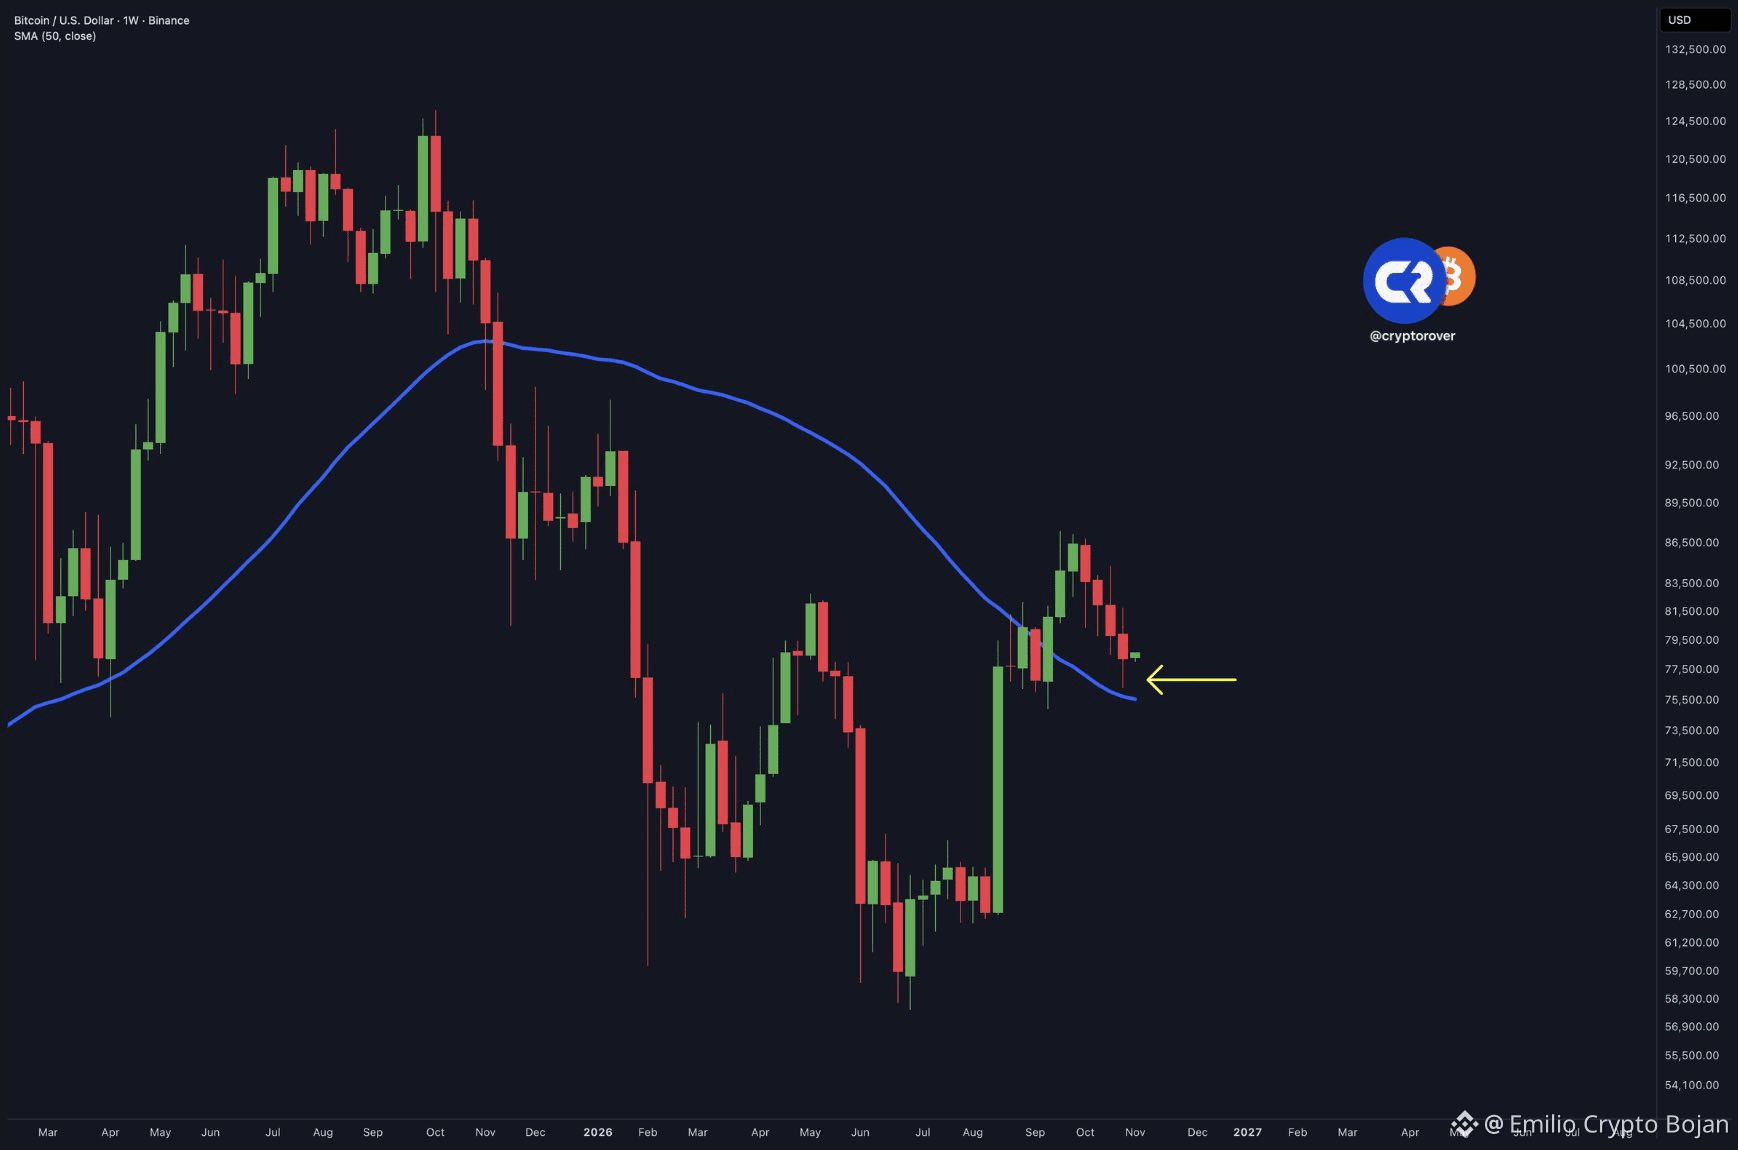
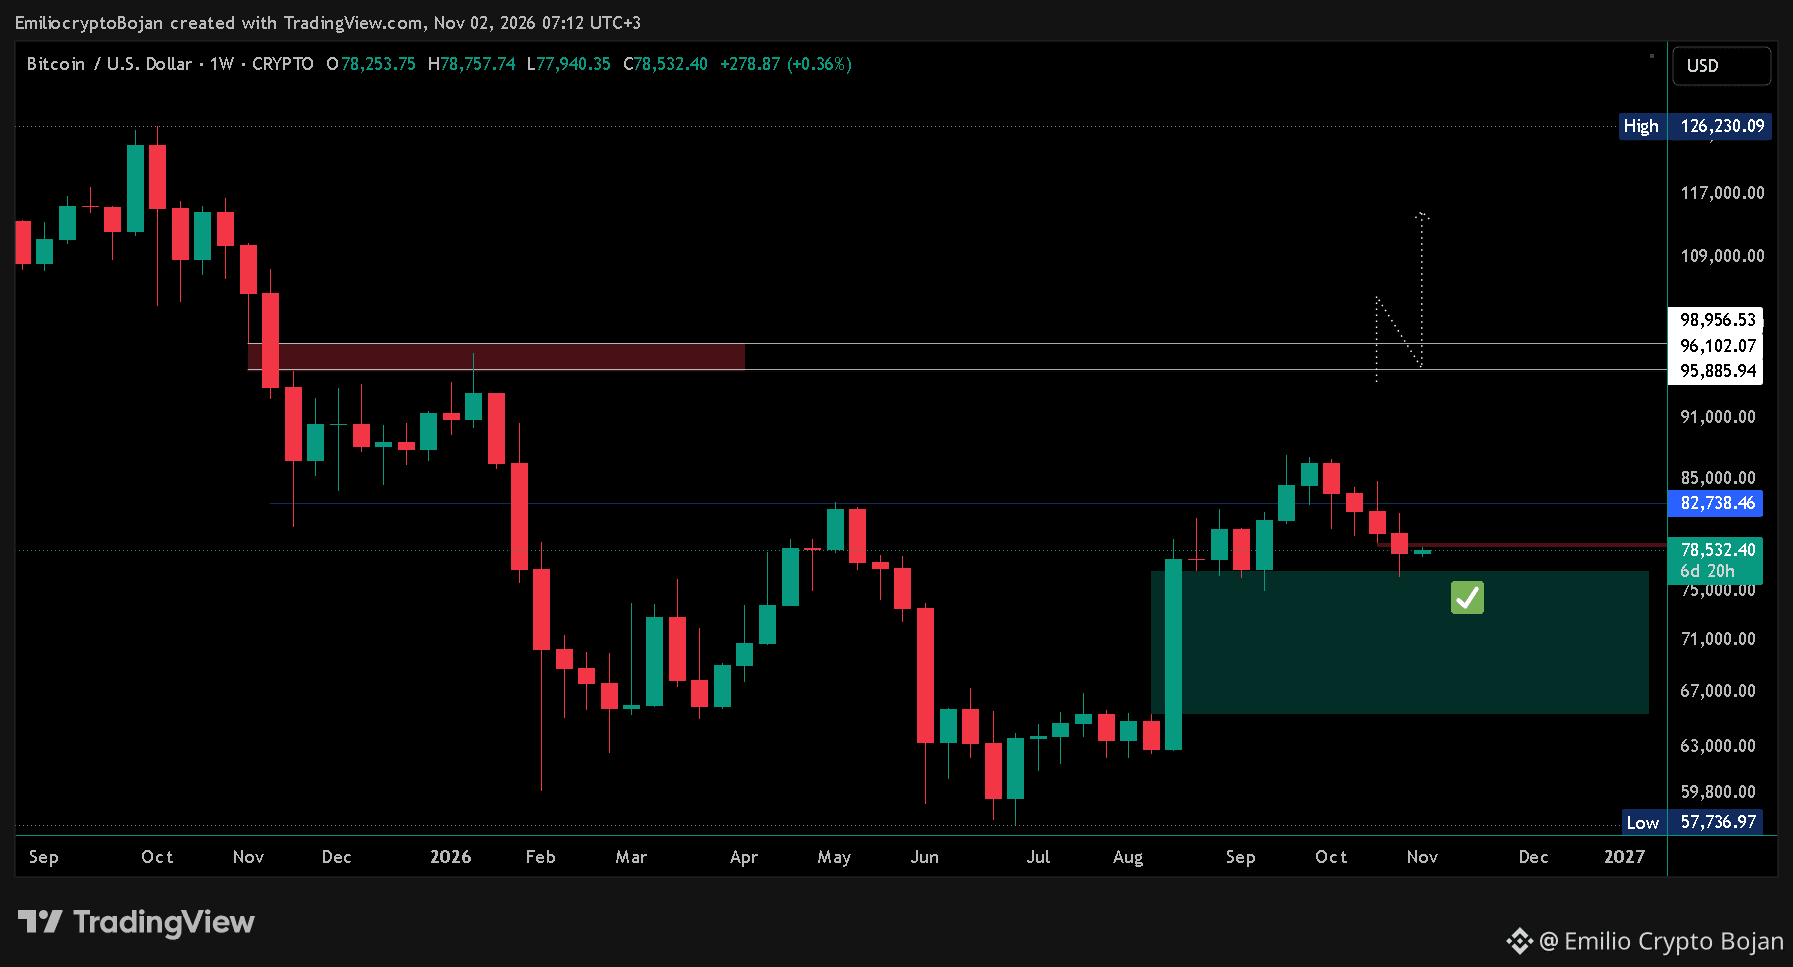
$BTC closes another weekly candle above the 50W Moving Average!
On top of that, Bitcoin has filled the FVG and reversed, setting its sights on the next FVG breakout zone at $95,885.94–$98,956.53.
A decisive weekly close above $98,956.53 would confirm the bullish reversal.
Meanwhile, $82,738.46 remains the gatepass.
🚀
#BinanceProcesses$4.65BWithdrawals #WithdrawalsBack: 15 networks live #BitcoinSpotETFsPost$203MWeeklyOutflow #SouthKoreanLawmakerProposesReviewOfAllListedDigitalAssets
HOT Monday: 🔥
$BTC closes another weekly candle above the 50W Moving Average!
On top of that, Bitcoin has filled the FVG and reversed, setting its sights on the next FVG breakout zone at $95,885.94–$98,956.53.
A decisive weekly close above $98,956.53 would confirm the bullish reversal.
Meanwhile, $82,738.46 remains the gatepass.
🚀
#BinanceProcesses$4.65BWithdrawals #WithdrawalsBack: 15 networks live #BitcoinSpotETFsPost$203MWeeklyOutflow #SouthKoreanLawmakerProposesReviewOfAllListedDigitalAssets
$BTC closes another weekly candle above the 50W Moving Average!
On top of that, Bitcoin has filled the FVG and reversed, setting its sights on the next FVG breakout zone at $95,885.94–$98,956.53.
A decisive weekly close above $98,956.53 would confirm the bullish reversal.
Meanwhile, $82,738.46 remains the gatepass.
🚀
#BinanceProcesses$4.65BWithdrawals #WithdrawalsBack: 15 networks live #BitcoinSpotETFsPost$203MWeeklyOutflow #SouthKoreanLawmakerProposesReviewOfAllListedDigitalAssets
104
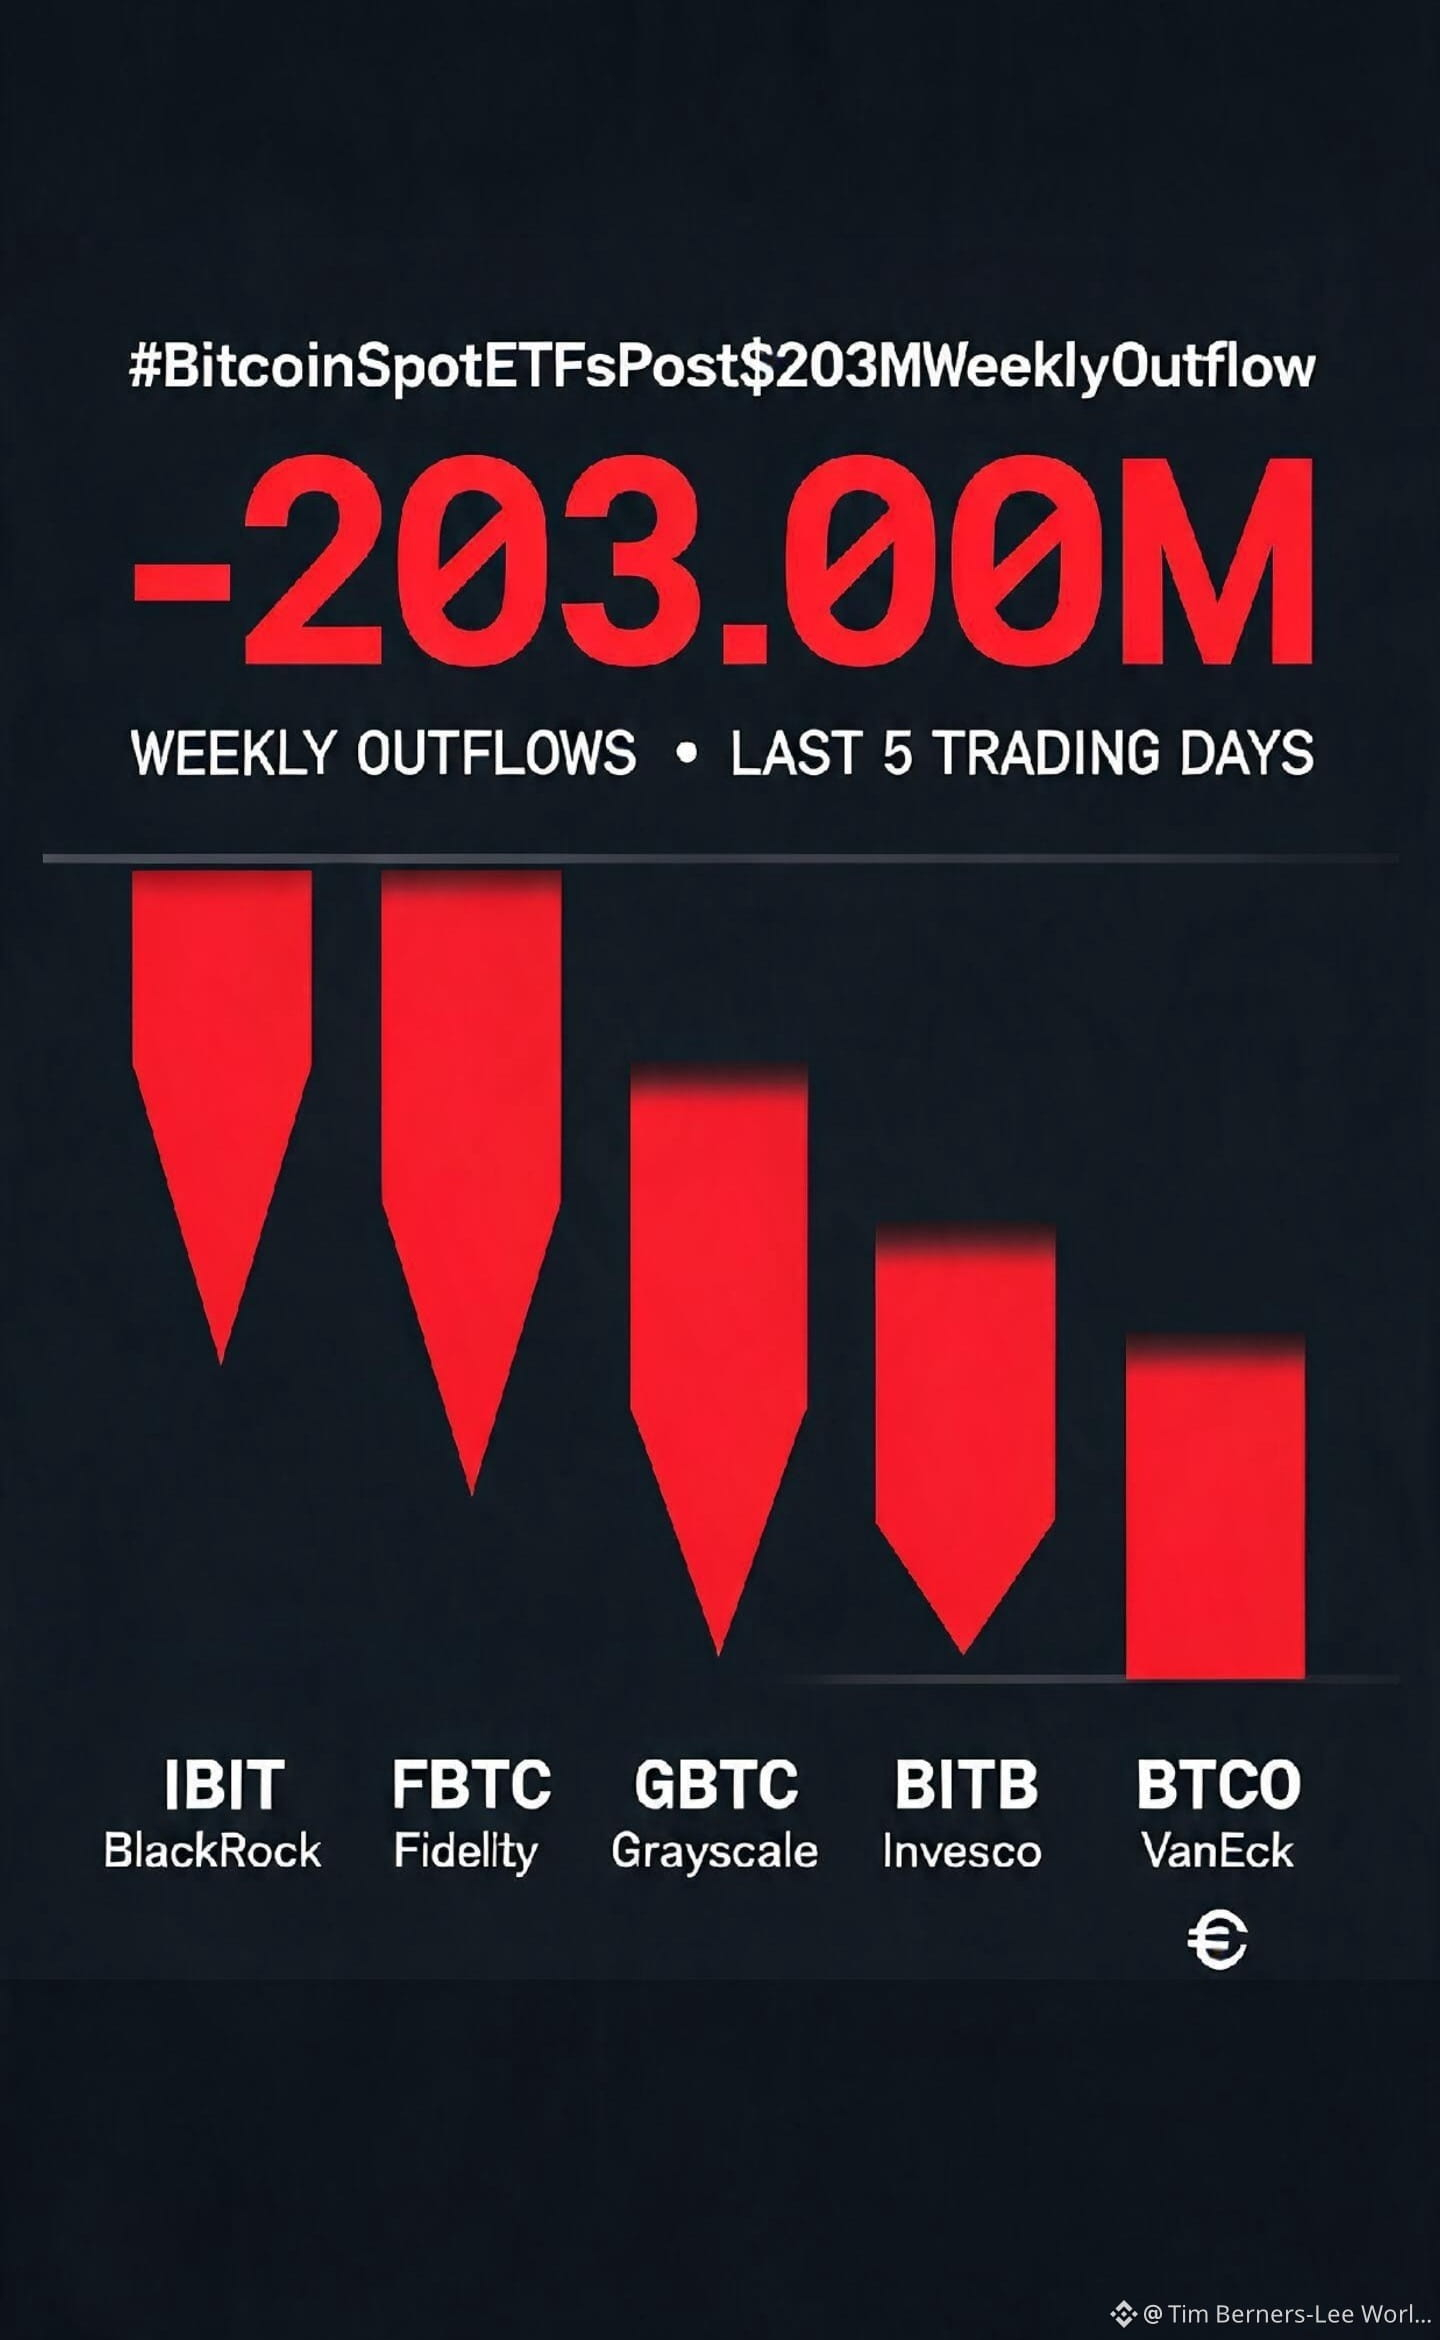
#BitcoinSpotETFsPost$203MWeeklyOutflow Por consiguiente, estos movimientos periódicos de descapitalización local deben interpretarse como una señal de la integración definitiva del ecosistema digital en los ciclos financieros tradicionales. Lejos de las antiguas dinámicas de pánico minorista, los flujos entrantes y salientes de los ETFs de criptoactivos se comportan ahora con la misma lógica algorítmica y corporativa que los mercados de materias primas o de renta variable tecnológica de alta capitalización, fijando un precedente de estabilidad e institucionalidad para la era económica contemporánea.
$BNB $BTCO.ETF $FBTC.ETF
{future}(BNBUSDT)
{etf_us}(FBTC.ETF)
{etf_us}(BTCO.ETF)
#BitcoinSpotETFsPost$203MWeeklyOutflow Por consiguiente, estos movimientos periódicos de descapitalización local deben interpretarse como una señal de la integración definitiva del ecosistema digital en los ciclos financieros tradicionales. Lejos de las antiguas dinámicas de pánico minorista, los flujos entrantes y salientes de los ETFs de criptoactivos se comportan ahora con la misma lógica algorítmica y corporativa que los mercados de materias primas o de renta variable tecnológica de alta capitalización, fijando un precedente de estabilidad e institucionalidad para la era económica contemporánea.
$BNB $BTCO.ETF $FBTC.ETF
$BNB $BTCO.ETF $FBTC.ETF
41
Войдите, чтобы посмотреть больше материала
Присоединяйтесь к пользователям криптовалют по всему миру на Binance Square
⚡️ Получайте новейшую и полезную информацию о криптоактивах.
💬 Нам доверяет крупнейшая в мире криптобиржа.
👍 Получите достоверные аналитические данные от верифицированных создателей контента.
Эл. почта/номер телефона
В тренде
1
#BinanceProcesses$4.65BWithdrawals
Просмотров: 50,616
207 обсуждают
2
#WithdrawalsBack: 15 networks live
Просмотров: 11,081
164 обсуждают
3
#EthereumSurpasses$2300
Просмотров: 181
32 обсуждают
4
#BitcoinSpotETFsPost$203MWeeklyOutflow
Просмотров: 273
16 обсуждают
5
#SouthKoreanLawmakerProposesReviewOfAllListedDigitalAssets
Просмотров: 338
19 обсуждают
6
#BrazilVirtualAssetLicenseDeadlineDrawsAbout40Firms
Просмотров: 13,075
237 обсуждают
7
#BTCPayServerUrgesOperatorsToShutDownInstances
Просмотров: 11,172
215 обсуждают
8
#BankOfKoreaSurveysFinancialFirmsOnVirtualAssetRisks
Просмотров: 473
12 обсуждают
9
#BinanceUpdatesProofofReservesAddresses
Просмотров: 189,413
1,918 обсуждают
10
#StudyFindsCircleAIAgentWalletLimitsCanBeBypassed
Просмотров: 5,720
127 обсуждают