

#bitcoinanalysis"
bitcoinanalysis"
Просмотров: 21,842
164 обсуждают
Популярные
Новые


Статья
Bitcoin’s Next Move: Can BTC Break $84,850, or Is a Pullback Coming? BTC market outlook | September$BTC
{spot}(BTCUSDT)
Bitcoin is trading around $84,330 on the BTCUSDT perpetual chart captured at 6:16 PM Pakistan time. The daily candle is green, but price is still consolidating after its recent push higher. The next move depends on whether buyers can clear the resistance above the current range.
The broader chart remains constructive. BTC has been moving within a rising channel, and the daily RSI is around 63: bullish momentum is present, though price is approaching an area where sellers may respond. My market notes also show BTC open interest easing and funding near neutral. That gives room for a move, but it does not tell us which side will win.
Levels I’m Watching
Immediate resistance: $84,843–$84,856. This is the nearby upside liquidity area. A quick move into it could trigger short liquidations, but a touch alone would not confirm a breakout.
Next resistance: $86,605, followed by $88,308 if buyers sustain momentum.
Immediate support: $83,393, then the $82,823–$82,133 zone. Losing this area would weaken the bullish case and expose lower chart supports near $80,963 and $79,719.
My Primary Trade Setup: Conditional Long
I’m watching for a one-hour candle close above $84,850, followed by a successful retest of the $84,800–$84,950 area. If that happens, a possible long setup is:
Entry: $84,800–$84,950 after the retest holdsStop loss: Below $84,200Target 1: $86,605Target 2: $88,308
I would consider taking partial profit at the first target and managing the remainder with a raised stop. Entering simply because price spikes above $84,850 is riskier; I want to see buyers defend the breakout.
What If BTC Moves Down First?
A rejection at $84,850 could send price back toward $83,393 or $82,823. That would still be a pullback within the broader upward structure unless support breaks decisively.
My bullish setup is invalidated if BTC closes below $82,823 and fails to reclaim it on a retest. In that case, I would stop looking for the long and watch for a possible short toward $80,963, then $79,719. A short would need its own confirmed entry and stop above the failed retest; it is not an automatic trade the moment support is touched.
My view: BTC has a path toward $84,850 first, but the trade comes from confirmation, not a predicted percentage. The breakout and retest are the signal. If price stays trapped between support and resistance, patience is the position.
These are chart-based scenarios, not guaranteed outcomes. Set position size from the distance to your stop, especially when trading perpetual futures with leverage.
#bitcoin #BTCUSDT #BitcoinAnalysis" #CryptoTradingInsights #muhammadranarizwan
Bitcoin’s Next Move: Can BTC Break $84,850, or Is a Pullback Coming? BTC market outlook | September
$BTC
Bitcoin is trading around $84,330 on the BTCUSDT perpetual chart captured at 6:16 PM Pakistan time. The daily candle is green, but price is still consolidating after its recent push higher. The next move depends on whether buyers can clear the resistance above the current range.
The broader chart remains constructive. BTC has been moving within a rising channel, and the daily RSI is around 63: bullish momentum is present, though price is approaching an area where sellers may respond. My market notes also show BTC open interest easing and funding near neutral. That gives room for a move, but it does not tell us which side will win.
Levels I’m Watching
Immediate resistance: $84,843–$84,856. This is the nearby upside liquidity area. A quick move into it could trigger short liquidations, but a touch alone would not confirm a breakout.
Next resistance: $86,605, followed by $88,308 if buyers sustain momentum.
Immediate support: $83,393, then the $82,823–$82,133 zone. Losing this area would weaken the bullish case and expose lower chart supports near $80,963 and $79,719.
My Primary Trade Setup: Conditional Long
I’m watching for a one-hour candle close above $84,850, followed by a successful retest of the $84,800–$84,950 area. If that happens, a possible long setup is:
Entry: $84,800–$84,950 after the retest holdsStop loss: Below $84,200Target 1: $86,605Target 2: $88,308
I would consider taking partial profit at the first target and managing the remainder with a raised stop. Entering simply because price spikes above $84,850 is riskier; I want to see buyers defend the breakout.
What If BTC Moves Down First?
A rejection at $84,850 could send price back toward $83,393 or $82,823. That would still be a pullback within the broader upward structure unless support breaks decisively.
My bullish setup is invalidated if BTC closes below $82,823 and fails to reclaim it on a retest. In that case, I would stop looking for the long and watch for a possible short toward $80,963, then $79,719. A short would need its own confirmed entry and stop above the failed retest; it is not an automatic trade the moment support is touched.
My view: BTC has a path toward $84,850 first, but the trade comes from confirmation, not a predicted percentage. The breakout and retest are the signal. If price stays trapped between support and resistance, patience is the position.
These are chart-based scenarios, not guaranteed outcomes. Set position size from the distance to your stop, especially when trading perpetual futures with leverage.
#bitcoin #BTCUSDT #BitcoinAnalysis" #CryptoTradingInsights #muhammadranarizwan
Bitcoin is trading around $84,330 on the BTCUSDT perpetual chart captured at 6:16 PM Pakistan time. The daily candle is green, but price is still consolidating after its recent push higher. The next move depends on whether buyers can clear the resistance above the current range.
The broader chart remains constructive. BTC has been moving within a rising channel, and the daily RSI is around 63: bullish momentum is present, though price is approaching an area where sellers may respond. My market notes also show BTC open interest easing and funding near neutral. That gives room for a move, but it does not tell us which side will win.
Levels I’m Watching
Immediate resistance: $84,843–$84,856. This is the nearby upside liquidity area. A quick move into it could trigger short liquidations, but a touch alone would not confirm a breakout.
Next resistance: $86,605, followed by $88,308 if buyers sustain momentum.
Immediate support: $83,393, then the $82,823–$82,133 zone. Losing this area would weaken the bullish case and expose lower chart supports near $80,963 and $79,719.
My Primary Trade Setup: Conditional Long
I’m watching for a one-hour candle close above $84,850, followed by a successful retest of the $84,800–$84,950 area. If that happens, a possible long setup is:
Entry: $84,800–$84,950 after the retest holdsStop loss: Below $84,200Target 1: $86,605Target 2: $88,308
I would consider taking partial profit at the first target and managing the remainder with a raised stop. Entering simply because price spikes above $84,850 is riskier; I want to see buyers defend the breakout.
What If BTC Moves Down First?
A rejection at $84,850 could send price back toward $83,393 or $82,823. That would still be a pullback within the broader upward structure unless support breaks decisively.
My bullish setup is invalidated if BTC closes below $82,823 and fails to reclaim it on a retest. In that case, I would stop looking for the long and watch for a possible short toward $80,963, then $79,719. A short would need its own confirmed entry and stop above the failed retest; it is not an automatic trade the moment support is touched.
My view: BTC has a path toward $84,850 first, but the trade comes from confirmation, not a predicted percentage. The breakout and retest are the signal. If price stays trapped between support and resistance, patience is the position.
These are chart-based scenarios, not guaranteed outcomes. Set position size from the distance to your stop, especially when trading perpetual futures with leverage.
#bitcoin #BTCUSDT #BitcoinAnalysis" #CryptoTradingInsights #muhammadranarizwan
71

·
--
Падение
🚨$BTC MORNING UPDATE — RESISTANCE UNDER PRESSURE! 👀📉
Bitcoin is currently trading around $84.5K and approaching the $84.6K–$85K resistance zone.
This is the area I'm watching closely today. 👇
🔴 BEARISH SCENARIO:
If BTC gets rejected around $84.6K–$85K and then loses the $84K area, bearish pressure could increase.
📍 Key levels to watch:
🔴 Resistance: $84.6K–$85K
🟡 Short-term support: $84K
🟢 Next support: $83.2K–$83.8K
🟢 Major support zone: $80K–$81K
🟢 BULLISH INVALIDATION:
If BTC breaks and holds above $85K, the bearish rejection idea becomes weaker and the market could continue testing higher levels.
⚠️ The key is confirmation — not simply touching resistance.
👀 BTC at resistance… rejection or breakout?
Vote below and tell me what you see.
$BTC #Bitcoin #BTC #Crypto #BinanceSquare #BTCUSDT #BitcoinAnalysis" #CryptoAnalysis
🚨$BTC MORNING UPDATE — RESISTANCE UNDER PRESSURE! 👀📉
Bitcoin is currently trading around $84.5K and approaching the $84.6K–$85K resistance zone.
This is the area I'm watching closely today. 👇
🔴 BEARISH SCENARIO:
If BTC gets rejected around $84.6K–$85K and then loses the $84K area, bearish pressure could increase.
📍 Key levels to watch:
🔴 Resistance: $84.6K–$85K
🟡 Short-term support: $84K
🟢 Next support: $83.2K–$83.8K
🟢 Major support zone: $80K–$81K
🟢 BULLISH INVALIDATION:
If BTC breaks and holds above $85K, the bearish rejection idea becomes weaker and the market could continue testing higher levels.
⚠️ The key is confirmation — not simply touching resistance.
👀 BTC at resistance… rejection or breakout?
Vote below and tell me what you see.
$BTC #Bitcoin #BTC #Crypto #BinanceSquare #BTCUSDT #BitcoinAnalysis" #CryptoAnalysis
Bitcoin is currently trading around $84.5K and approaching the $84.6K–$85K resistance zone.
This is the area I'm watching closely today. 👇
🔴 BEARISH SCENARIO:
If BTC gets rejected around $84.6K–$85K and then loses the $84K area, bearish pressure could increase.
📍 Key levels to watch:
🔴 Resistance: $84.6K–$85K
🟡 Short-term support: $84K
🟢 Next support: $83.2K–$83.8K
🟢 Major support zone: $80K–$81K
🟢 BULLISH INVALIDATION:
If BTC breaks and holds above $85K, the bearish rejection idea becomes weaker and the market could continue testing higher levels.
⚠️ The key is confirmation — not simply touching resistance.
👀 BTC at resistance… rejection or breakout?
Vote below and tell me what you see.
$BTC #Bitcoin #BTC #Crypto #BinanceSquare #BTCUSDT #BitcoinAnalysis" #CryptoAnalysis
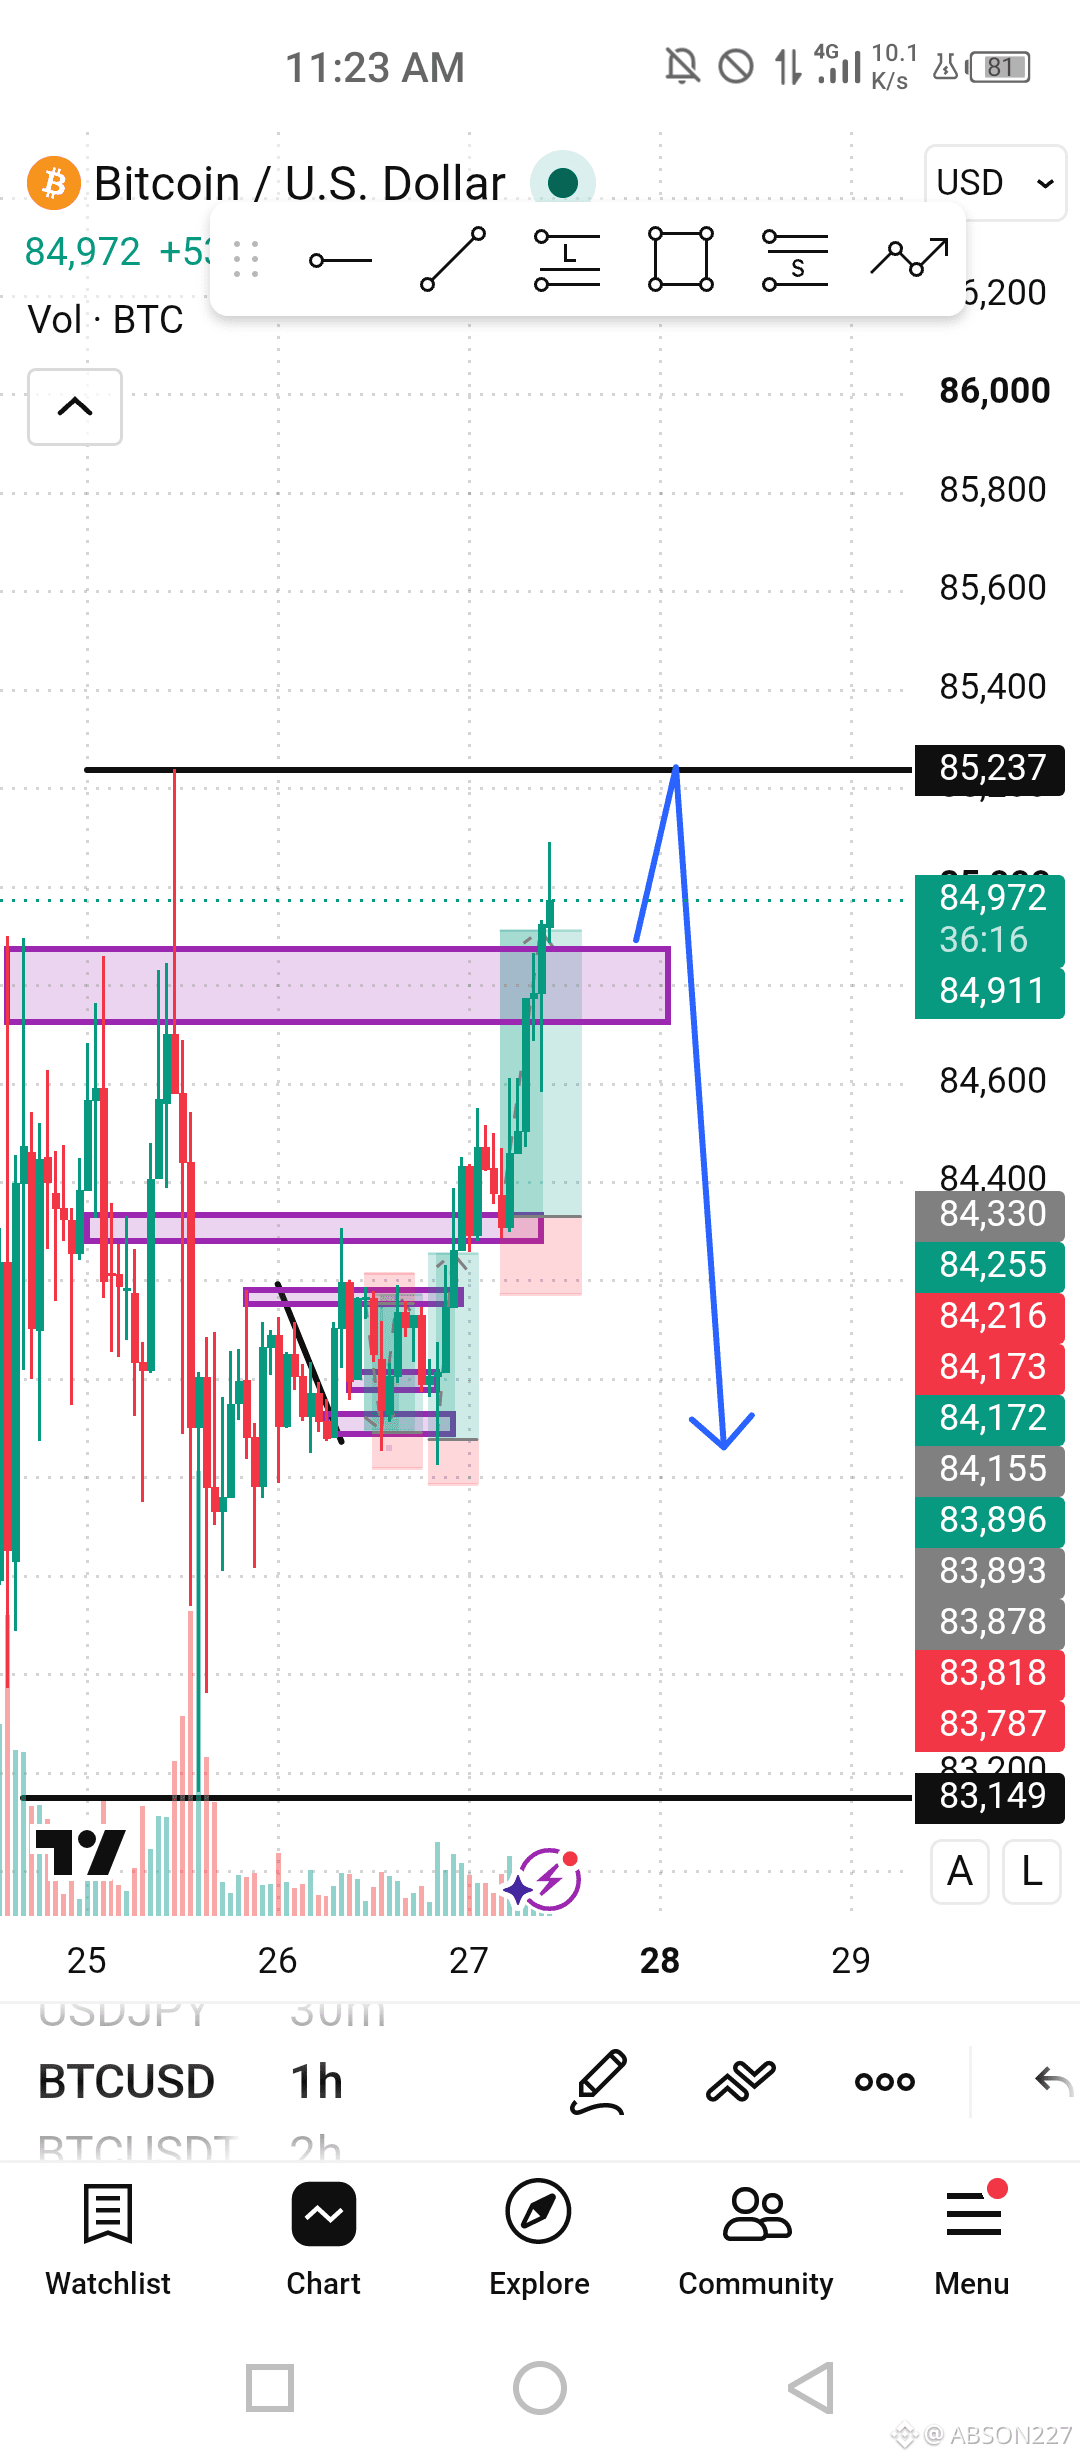
ChartScout:
That $84.6K–$85K resistance test on $BTC is a massive focal point right now. Watching closely to see if it forces a clear breakout confirmation or sweeps down to test the $84K short-term support. We use ChartScout to scan these key horizontal resistance structures automatically to catch clean breakout or rejection confirmation signals early.
1
2
52

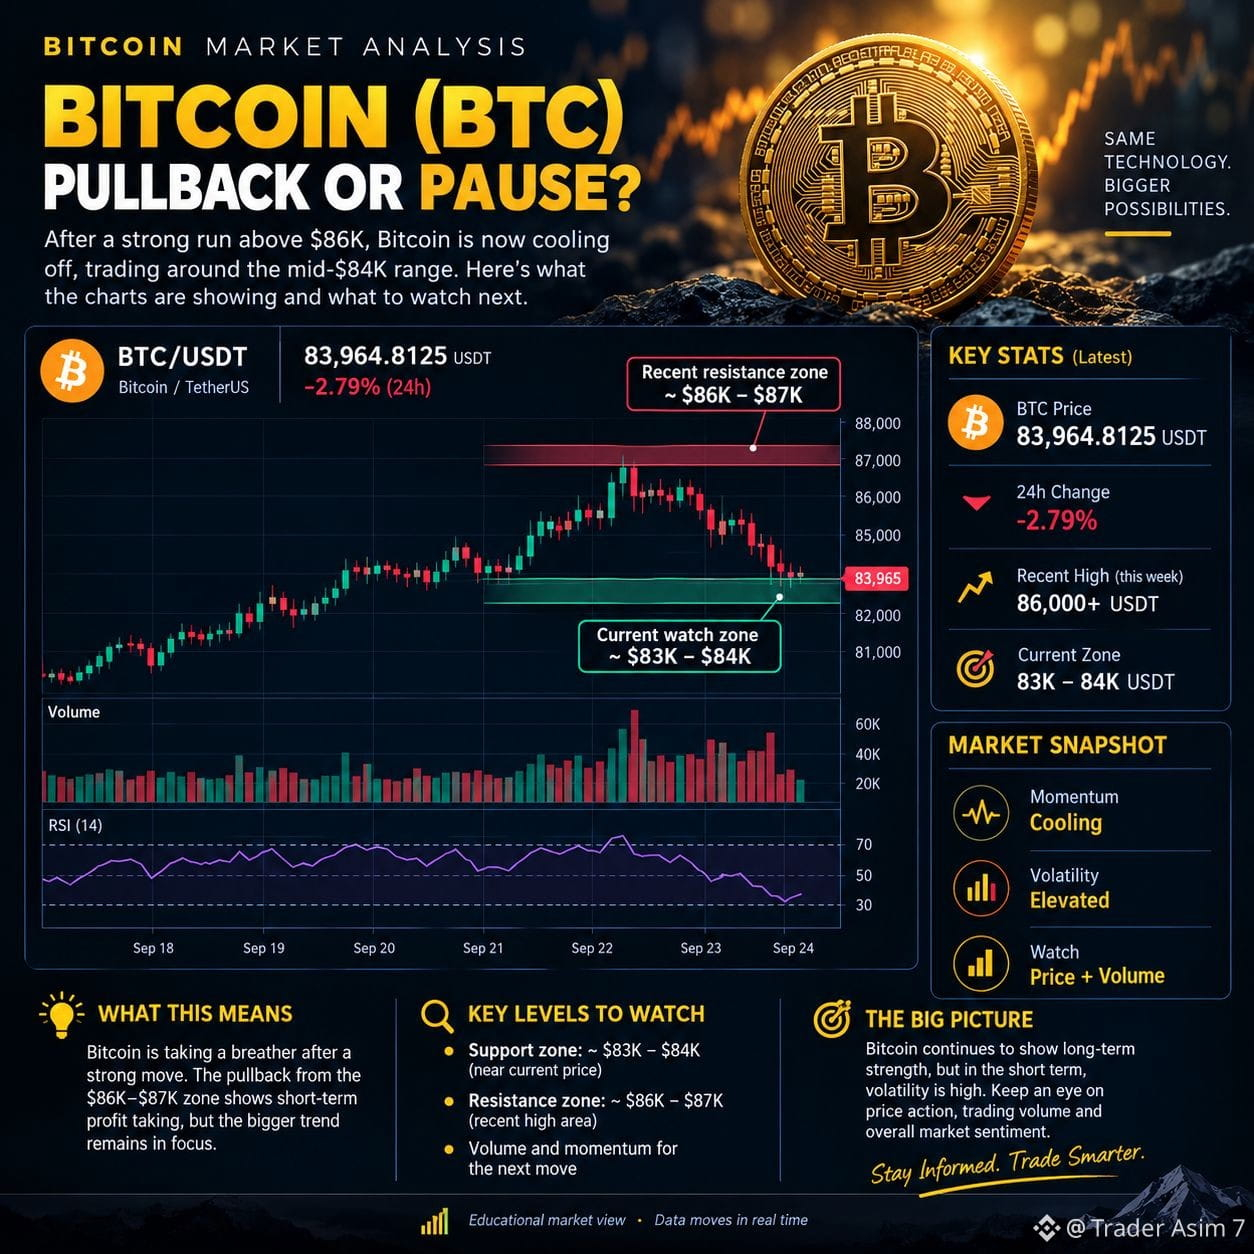
🟠 Bitcoin ($BTC): Pullback or Pause?
Bitcoin has pulled back after recently trading above $86K, with $BTC currently around the $84K area. The short-term chart shows cooling momentum, while the $83K–$84K zone is an important area to watch and the $86K–$87K region represents the recent high zone. �
Bitcoin #BTC #Binance #Crypto #BitcoinAnalysis #BTCUSDT #CryptoMarket #MarketUpdate #Trading #BinanceSquare#Bitcoin #BTC #Binance #Crypto #BitcoinAnalysis" s #BTC #CryptoMarketAlert #MarketUpdate #Trading
🟠 Bitcoin ($BTC ): Pullback or Pause?
Bitcoin has pulled back after recently trading above $86K, with $BTC currently around the $84K area. The short-term chart shows cooling momentum, while the $83K–$84K zone is an important area to watch and the $86K–$87K region represents the recent high zone. �
Bitcoin #BTC #Binance #Crypto #BitcoinAnalysis #BTCUSDT #CryptoMarket #MarketUpdate #Trading #BinanceSquare#Bitcoin #BTC #Binance #Crypto #BitcoinAnalysis" s #BTC #CryptoMarketAlert #MarketUpdate #Trading
Bitcoin has pulled back after recently trading above $86K, with $BTC currently around the $84K area. The short-term chart shows cooling momentum, while the $83K–$84K zone is an important area to watch and the $86K–$87K region represents the recent high zone. �
Bitcoin #BTC #Binance #Crypto #BitcoinAnalysis #BTCUSDT #CryptoMarket #MarketUpdate #Trading #BinanceSquare#Bitcoin #BTC #Binance #Crypto #BitcoinAnalysis" s #BTC #CryptoMarketAlert #MarketUpdate #Trading
87

·
--
📊 BTC/USDT — Wednesday 1-Day Analysis
Bitcoin is cooling slightly after yesterday’s strong move toward the $87K area. BTC is currently around the $85K zone, so today’s price action could be important for determining whether the breakout holds. (The Wall Street Journal)
🔹 Resistance: $87K–$90K
🔹 Support: $82K–$84K
🔹 Key signal: Watch volume and the daily candle close
🔹 Risk: Losing the $82K–$84K area could bring increased selling pressure.
My approach today: wait for confirmation instead of chasing the recent rally. A strong hold above support or a volume-backed breakout would give the market a clearer signal.
⚠️ This is market analysis, not a guaranteed prediction. Always manage risk.
What are you watching today — a move toward $90K or a retest of the $82K–$84K support zone? 👇
#BTC #bitcoin #BTCUSDT #crypto #BİNANCESQUARE #trading #BitcoinAnalysis"
📊 BTC/USDT — Wednesday 1-Day Analysis
Bitcoin is cooling slightly after yesterday’s strong move toward the $87K area. BTC is currently around the $85K zone, so today’s price action could be important for determining whether the breakout holds. (The Wall Street Journal)
🔹 Resistance: $87K–$90K
🔹 Support: $82K–$84K
🔹 Key signal: Watch volume and the daily candle close
🔹 Risk: Losing the $82K–$84K area could bring increased selling pressure.
My approach today: wait for confirmation instead of chasing the recent rally. A strong hold above support or a volume-backed breakout would give the market a clearer signal.
⚠️ This is market analysis, not a guaranteed prediction. Always manage risk.
What are you watching today — a move toward $90K or a retest of the $82K–$84K support zone? 👇
#BTC #bitcoin #BTCUSDT #crypto #BİNANCESQUARE #trading #BitcoinAnalysis"
Bitcoin is cooling slightly after yesterday’s strong move toward the $87K area. BTC is currently around the $85K zone, so today’s price action could be important for determining whether the breakout holds. (The Wall Street Journal)
🔹 Resistance: $87K–$90K
🔹 Support: $82K–$84K
🔹 Key signal: Watch volume and the daily candle close
🔹 Risk: Losing the $82K–$84K area could bring increased selling pressure.
My approach today: wait for confirmation instead of chasing the recent rally. A strong hold above support or a volume-backed breakout would give the market a clearer signal.
⚠️ This is market analysis, not a guaranteed prediction. Always manage risk.
What are you watching today — a move toward $90K or a retest of the $82K–$84K support zone? 👇
#BTC #bitcoin #BTCUSDT #crypto #BİNANCESQUARE #trading #BitcoinAnalysis"
84
·
--
📊 BTC/USDT — 1-Day Market Analysis
Bitcoin is showing strong short-term momentum after breaking above the $82K resistance zone and pushing toward the $87K area.
For the next 24 hours, I’m watching:
🔹 Resistance: $87K–$88.4K
🔹 Support: $81K–$82K
🔹 Confirmation: A strong close above resistance with healthy volume
🔹 Risk: A rejection followed by a move back below the breakout zone could signal a deeper pullback.
My approach today: don’t chase the move. I’d rather wait for either a confirmed breakout or a clean retest of the previous resistance zone.
What are you watching today — continuation above $88K or a BTC pullback toward support? 👇
#BTC #Bitcoin #BTCUSDT #crypto #BİNANCESQUARE #trading #BitcoinAnalysis"
📊 BTC/USDT — 1-Day Market Analysis
Bitcoin is showing strong short-term momentum after breaking above the $82K resistance zone and pushing toward the $87K area.
For the next 24 hours, I’m watching:
🔹 Resistance: $87K–$88.4K
🔹 Support: $81K–$82K
🔹 Confirmation: A strong close above resistance with healthy volume
🔹 Risk: A rejection followed by a move back below the breakout zone could signal a deeper pullback.
My approach today: don’t chase the move. I’d rather wait for either a confirmed breakout or a clean retest of the previous resistance zone.
What are you watching today — continuation above $88K or a BTC pullback toward support? 👇
#BTC #Bitcoin #BTCUSDT #crypto #BİNANCESQUARE #trading #BitcoinAnalysis"
Bitcoin is showing strong short-term momentum after breaking above the $82K resistance zone and pushing toward the $87K area.
For the next 24 hours, I’m watching:
🔹 Resistance: $87K–$88.4K
🔹 Support: $81K–$82K
🔹 Confirmation: A strong close above resistance with healthy volume
🔹 Risk: A rejection followed by a move back below the breakout zone could signal a deeper pullback.
My approach today: don’t chase the move. I’d rather wait for either a confirmed breakout or a clean retest of the previous resistance zone.
What are you watching today — continuation above $88K or a BTC pullback toward support? 👇
#BTC #Bitcoin #BTCUSDT #crypto #BİNANCESQUARE #trading #BitcoinAnalysis"
84

🚨 DON’T CONFUSE A Saylor MOVE WITH AN AUTOMATIC BTC BUY SIGNAL
It’s easy to see Strategy buying Bitcoin and immediately think, “Maybe I should buy too.”
But there’s a big difference between following a company’s long-term Bitcoin strategy and managing your own trading risk.
Strategy has built its reputation around using market weakness as an opportunity to increase its Bitcoin exposure. That approach can make sense for a company with a long-term treasury plan — but individual traders may react very differently when the market suddenly drops.
And this time, the market has more moving parts.
Spot Bitcoin demand, global liquidity, macroeconomic conditions and the growing number of companies exploring Bitcoin as a treasury asset are all becoming part of the bigger picture.
With market sentiment already leaning toward Greed, traders should be careful about assuming that every bullish signal will lead to another immediate move higher.
The real question isn’t simply:
“Is Saylor buying Bitcoin?”
The better question is:
What is driving the current demand — genuine accumulation, or another wave of market excitement?
BTC, USDT flows and assets connected to the broader crypto ecosystem are all worth watching as this story develops.
Saylor’s strategy remains a major part of the Bitcoin narrative, but no single buyer can explain the entire market.
👀 So what do you think — is Bitcoin entering another accumulation phase, or is the market getting too confident too quickly?
⚠️ Disclaimer: This is my personal market analysis for educational purposes only, not financial advice.
#BTC #Saylor #Crypto #BitcoinAnalysis" #CryptoMarket
🚨 DON’T CONFUSE A Saylor MOVE WITH AN AUTOMATIC BTC BUY SIGNAL
It’s easy to see Strategy buying Bitcoin and immediately think, “Maybe I should buy too.”
But there’s a big difference between following a company’s long-term Bitcoin strategy and managing your own trading risk.
Strategy has built its reputation around using market weakness as an opportunity to increase its Bitcoin exposure. That approach can make sense for a company with a long-term treasury plan — but individual traders may react very differently when the market suddenly drops.
And this time, the market has more moving parts.
Spot Bitcoin demand, global liquidity, macroeconomic conditions and the growing number of companies exploring Bitcoin as a treasury asset are all becoming part of the bigger picture.
With market sentiment already leaning toward Greed, traders should be careful about assuming that every bullish signal will lead to another immediate move higher.
The real question isn’t simply:
“Is Saylor buying Bitcoin?”
The better question is:
What is driving the current demand — genuine accumulation, or another wave of market excitement?
BTC, USDT flows and assets connected to the broader crypto ecosystem are all worth watching as this story develops.
Saylor’s strategy remains a major part of the Bitcoin narrative, but no single buyer can explain the entire market.
👀 So what do you think — is Bitcoin entering another accumulation phase, or is the market getting too confident too quickly?
⚠️ Disclaimer: This is my personal market analysis for educational purposes only, not financial advice.
#BTC #Saylor #Crypto #BitcoinAnalysis" #CryptoMarket
It’s easy to see Strategy buying Bitcoin and immediately think, “Maybe I should buy too.”
But there’s a big difference between following a company’s long-term Bitcoin strategy and managing your own trading risk.
Strategy has built its reputation around using market weakness as an opportunity to increase its Bitcoin exposure. That approach can make sense for a company with a long-term treasury plan — but individual traders may react very differently when the market suddenly drops.
And this time, the market has more moving parts.
Spot Bitcoin demand, global liquidity, macroeconomic conditions and the growing number of companies exploring Bitcoin as a treasury asset are all becoming part of the bigger picture.
With market sentiment already leaning toward Greed, traders should be careful about assuming that every bullish signal will lead to another immediate move higher.
The real question isn’t simply:
“Is Saylor buying Bitcoin?”
The better question is:
What is driving the current demand — genuine accumulation, or another wave of market excitement?
BTC, USDT flows and assets connected to the broader crypto ecosystem are all worth watching as this story develops.
Saylor’s strategy remains a major part of the Bitcoin narrative, but no single buyer can explain the entire market.
👀 So what do you think — is Bitcoin entering another accumulation phase, or is the market getting too confident too quickly?
⚠️ Disclaimer: This is my personal market analysis for educational purposes only, not financial advice.
#BTC #Saylor #Crypto #BitcoinAnalysis" #CryptoMarket

67

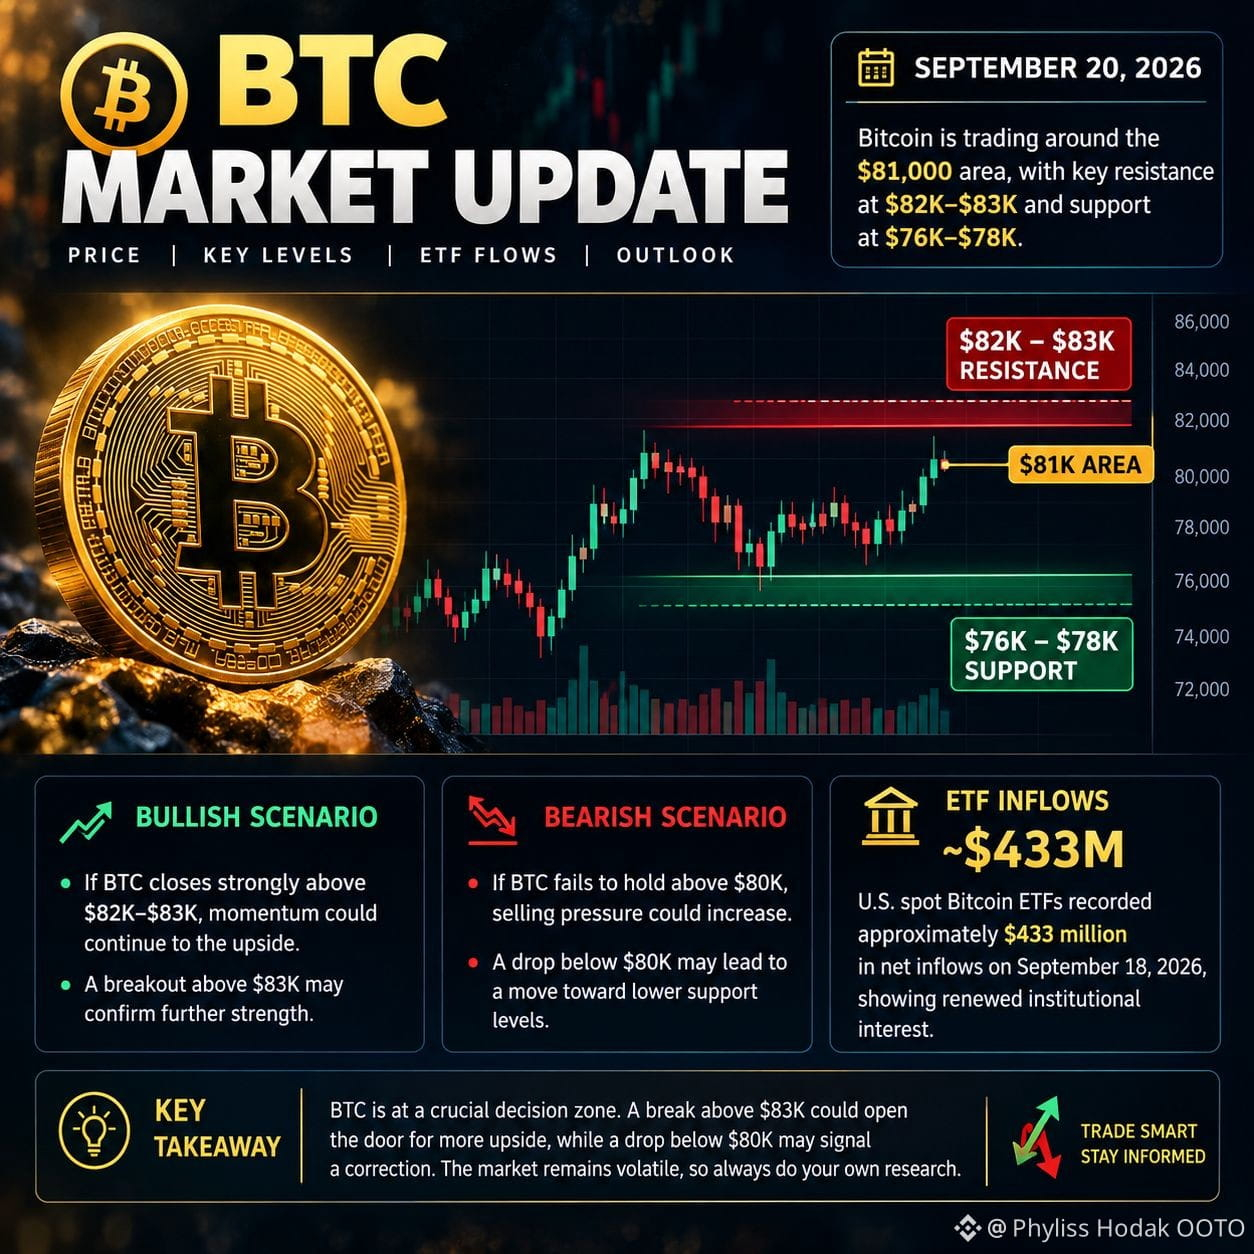
🚨 $BTC MARKET UPDATE — September 20, 2026
Bitcoin (BTC) is trading around the $81,000 area after a strong recovery from the recent September low near $75,000.
📊 KEY LEVELS
🔴 Resistance: $82K–$83K
🟡 Current area: ~$81K
🟢 Support: $76K–$78K
🔥 BULLISH SCENARIO
If BTC breaks and holds above the $82K–$83K resistance zone, the market could see further upward momentum. A sustained move above $83K would be an important technical confirmation.
⚠️ BEARISH SCENARIO
If BTC fails to hold the $80K area, selling pressure could increase and price may revisit lower support zones around $76K–$78K.
🏦 ETF UPDATE
U.S. spot Bitcoin ETFs recorded roughly $433M in net inflows on September 18, helping offset earlier outflows and bringing the week to a small net inflow.
🎯 KEY TAKEAWAY
BTC is currently sitting in an important decision zone. The reaction around $82K–$83K could provide useful information about the next short-term direction.
No guaranteed prediction — Bitcoin remains highly volatile.
#BTC #bitcoin #BinanceSquare #crypto #BitcoinAnalysis" #BTCUpdate #CryptoNews #BitcoinPrice
{spot}(BTCUSDT)
🚨 $BTC MARKET UPDATE — September 20, 2026
Bitcoin (BTC) is trading around the $81,000 area after a strong recovery from the recent September low near $75,000.
📊 KEY LEVELS
🔴 Resistance: $82K–$83K
🟡 Current area: ~$81K
🟢 Support: $76K–$78K
🔥 BULLISH SCENARIO
If BTC breaks and holds above the $82K–$83K resistance zone, the market could see further upward momentum. A sustained move above $83K would be an important technical confirmation.
⚠️ BEARISH SCENARIO
If BTC fails to hold the $80K area, selling pressure could increase and price may revisit lower support zones around $76K–$78K.
🏦 ETF UPDATE
U.S. spot Bitcoin ETFs recorded roughly $433M in net inflows on September 18, helping offset earlier outflows and bringing the week to a small net inflow.
🎯 KEY TAKEAWAY
BTC is currently sitting in an important decision zone. The reaction around $82K–$83K could provide useful information about the next short-term direction.
No guaranteed prediction — Bitcoin remains highly volatile.
#BTC #bitcoin #BinanceSquare #crypto #BitcoinAnalysis" #BTCUpdate #CryptoNews #BitcoinPrice
Bitcoin (BTC) is trading around the $81,000 area after a strong recovery from the recent September low near $75,000.
📊 KEY LEVELS
🔴 Resistance: $82K–$83K
🟡 Current area: ~$81K
🟢 Support: $76K–$78K
🔥 BULLISH SCENARIO
If BTC breaks and holds above the $82K–$83K resistance zone, the market could see further upward momentum. A sustained move above $83K would be an important technical confirmation.
⚠️ BEARISH SCENARIO
If BTC fails to hold the $80K area, selling pressure could increase and price may revisit lower support zones around $76K–$78K.
🏦 ETF UPDATE
U.S. spot Bitcoin ETFs recorded roughly $433M in net inflows on September 18, helping offset earlier outflows and bringing the week to a small net inflow.
🎯 KEY TAKEAWAY
BTC is currently sitting in an important decision zone. The reaction around $82K–$83K could provide useful information about the next short-term direction.
No guaranteed prediction — Bitcoin remains highly volatile.
#BTC #bitcoin #BinanceSquare #crypto #BitcoinAnalysis" #BTCUpdate #CryptoNews #BitcoinPrice
55

·
--
BTC FUTURE PLAN 🚨
Bitcoin is currently trading around the $81K area, which is an important decision zone.
📈 BULLISH SCENARIO: If BTC breaks and holds above $81.7K with strong volume: ➡️ $83K–$84K ➡️ $86K–$88K ➡️ $90K+ if momentum continues
📉 BEARISH SCENARIO: If BTC loses the $80K support: ➡️ $78K ➡️ $75K–$76K
🎯 MY TRADING PLAN: ✅ Wait for confirmation before entering ✅ Look for long opportunities after a confirmed breakout ✅ Watch the $80K–$78K zone for a potential reaction ❌ Avoid FOMO entries near resistance ⚠️ Always use proper risk management and a stop-loss
BTC is at a key level. The next confirmed breakout or breakdown could determine the short-term direction.
DYOR. Not Financial Advice.
#BinanceSquareBTC #BTCUSDT. #cryptouniverseofficial #BitcoinAnalysis" #trading
BTC FUTURE PLAN 🚨
Bitcoin is currently trading around the $81K area, which is an important decision zone.
📈 BULLISH SCENARIO: If BTC breaks and holds above $81.7K with strong volume: ➡️ $83K–$84K ➡️ $86K–$88K ➡️ $90K+ if momentum continues
📉 BEARISH SCENARIO: If BTC loses the $80K support: ➡️ $78K ➡️ $75K–$76K
🎯 MY TRADING PLAN: ✅ Wait for confirmation before entering ✅ Look for long opportunities after a confirmed breakout ✅ Watch the $80K–$78K zone for a potential reaction ❌ Avoid FOMO entries near resistance ⚠️ Always use proper risk management and a stop-loss
BTC is at a key level. The next confirmed breakout or breakdown could determine the short-term direction.
DYOR. Not Financial Advice.
#BinanceSquareBTC #BTCUSDT. #cryptouniverseofficial #BitcoinAnalysis" #trading
Bitcoin is currently trading around the $81K area, which is an important decision zone.
📈 BULLISH SCENARIO: If BTC breaks and holds above $81.7K with strong volume: ➡️ $83K–$84K ➡️ $86K–$88K ➡️ $90K+ if momentum continues
📉 BEARISH SCENARIO: If BTC loses the $80K support: ➡️ $78K ➡️ $75K–$76K
🎯 MY TRADING PLAN: ✅ Wait for confirmation before entering ✅ Look for long opportunities after a confirmed breakout ✅ Watch the $80K–$78K zone for a potential reaction ❌ Avoid FOMO entries near resistance ⚠️ Always use proper risk management and a stop-loss
BTC is at a key level. The next confirmed breakout or breakdown could determine the short-term direction.
DYOR. Not Financial Advice.
#BinanceSquareBTC #BTCUSDT. #cryptouniverseofficial #BitcoinAnalysis" #trading
83

🚨$BTC BREAKOUT ALERT 🚨
Bitcoin is back above $80K! 🔥
BTC is trading around $80,855 after hitting a 4H high of $81,258. The 4H chart shows strong bullish momentum, but after such a sharp move, a retest could come before the next push.
📌 Key Levels:
🔴 Resistance: $81,258
🚀 Breakout target: $82,000–$82,100
🟢 Key support: $80,000
🟡 Retest zone: $79,800–$79,000
🔵 Major support: $77,050
Bullish above $80K.
If BTC holds the breakout zone and reclaims $81.25K, the next major battle could be around $82K.
⚠️ Don't FOMO into a vertical candle. Watch the retest and confirmation.
BTC bulls are awake. 👀
#Bitcoin #BTC #cryptouniverseofficial a#BitcoinAnalysis" #btcupdates #CryptoMarketAlert
🚨$BTC BREAKOUT ALERT 🚨
Bitcoin is back above $80K! 🔥
BTC is trading around $80,855 after hitting a 4H high of $81,258. The 4H chart shows strong bullish momentum, but after such a sharp move, a retest could come before the next push.
📌 Key Levels:
🔴 Resistance: $81,258
🚀 Breakout target: $82,000–$82,100
🟢 Key support: $80,000
🟡 Retest zone: $79,800–$79,000
🔵 Major support: $77,050
Bullish above $80K.
If BTC holds the breakout zone and reclaims $81.25K, the next major battle could be around $82K.
⚠️ Don't FOMO into a vertical candle. Watch the retest and confirmation.
BTC bulls are awake. 👀
#Bitcoin #BTC #cryptouniverseofficial a#BitcoinAnalysis" #btcupdates #CryptoMarketAlert
Bitcoin is back above $80K! 🔥
BTC is trading around $80,855 after hitting a 4H high of $81,258. The 4H chart shows strong bullish momentum, but after such a sharp move, a retest could come before the next push.
📌 Key Levels:
🔴 Resistance: $81,258
🚀 Breakout target: $82,000–$82,100
🟢 Key support: $80,000
🟡 Retest zone: $79,800–$79,000
🔵 Major support: $77,050
Bullish above $80K.
If BTC holds the breakout zone and reclaims $81.25K, the next major battle could be around $82K.
⚠️ Don't FOMO into a vertical candle. Watch the retest and confirmation.
BTC bulls are awake. 👀
#Bitcoin #BTC #cryptouniverseofficial a#BitcoinAnalysis" #btcupdates #CryptoMarketAlert
1
101
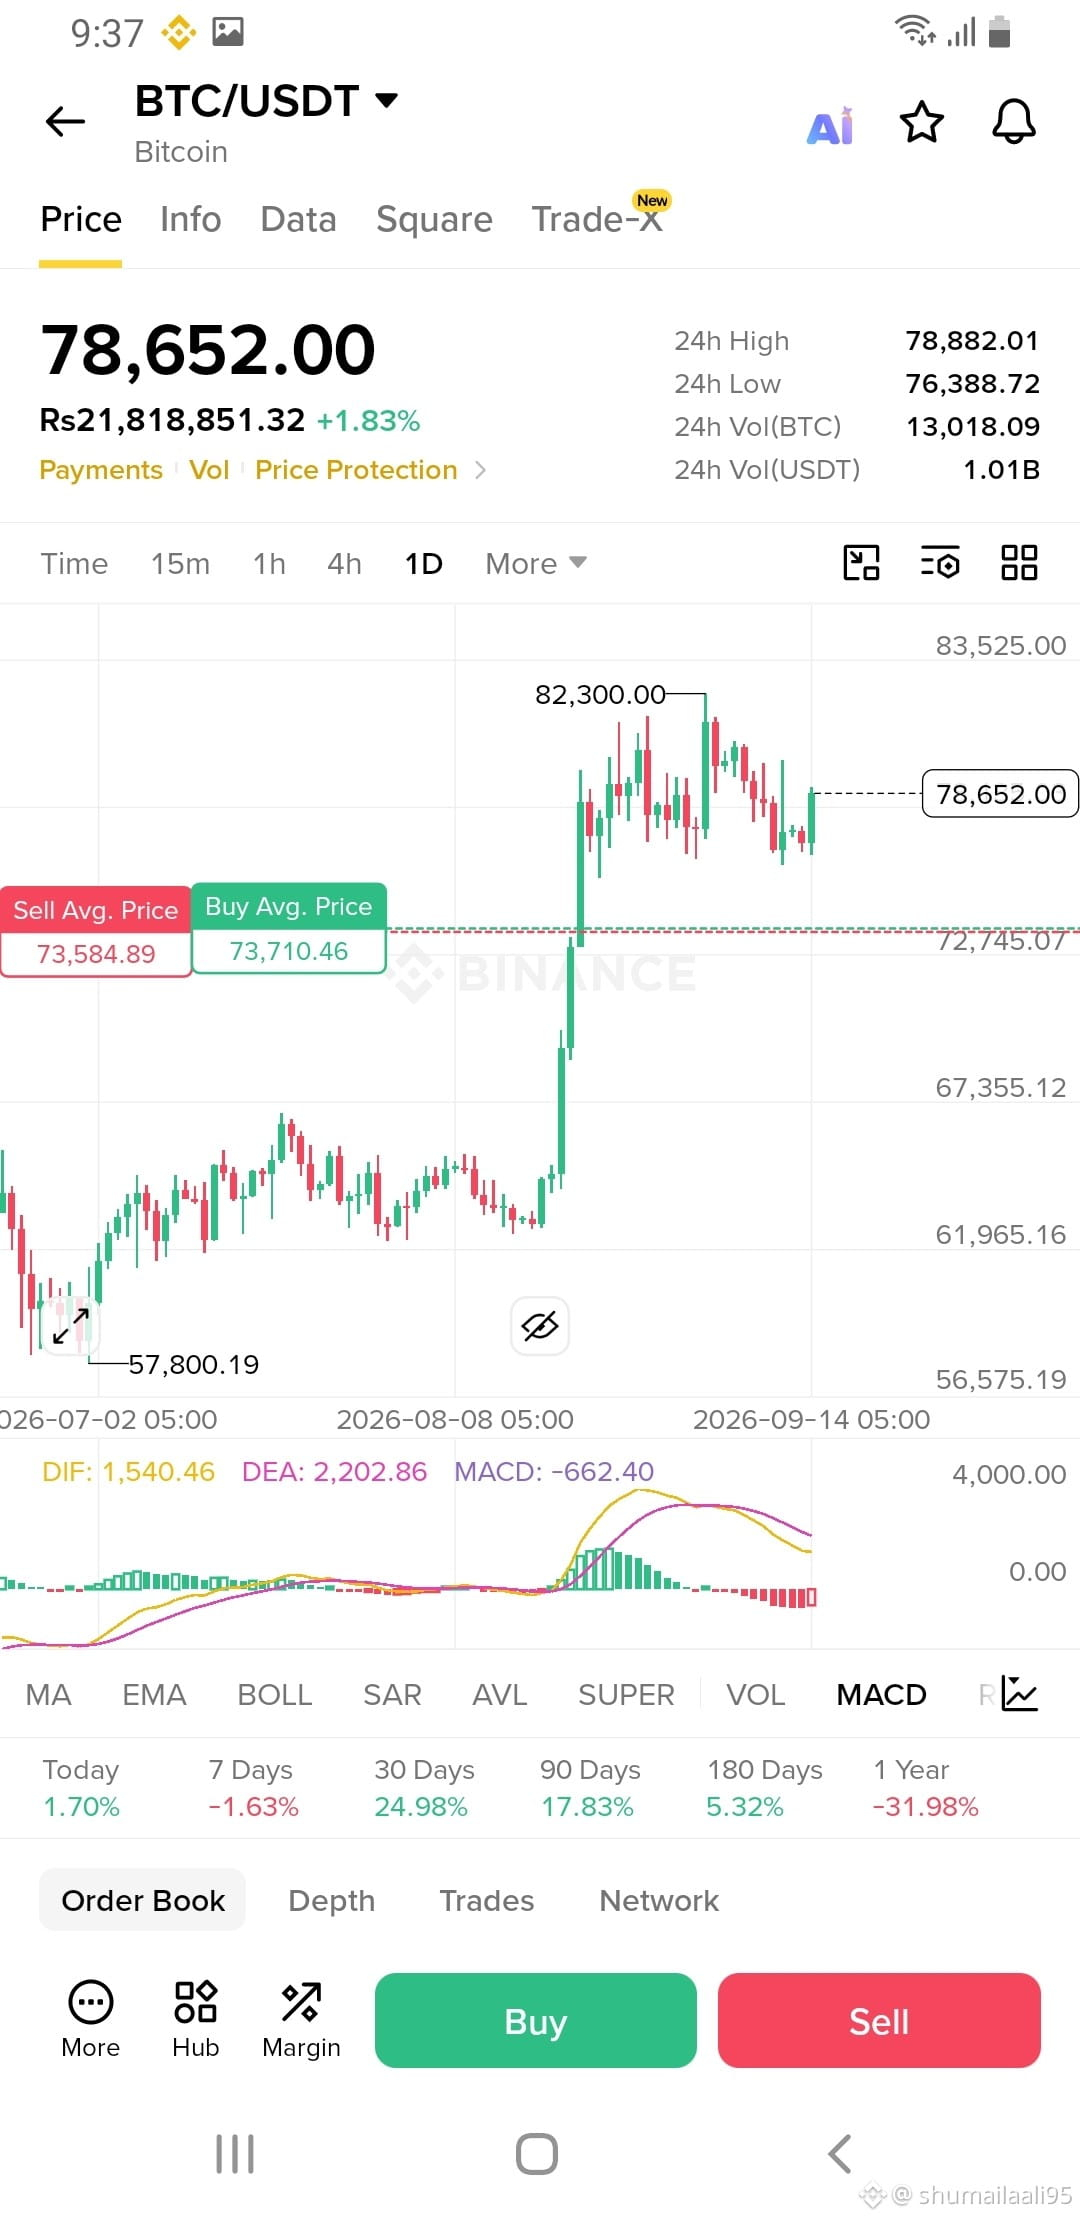
🔥 $BTC /USDT — THE NEXT BIG MOVE IS LOADING! 🚨
Bitcoin is sitting around $78.6K after a strong rally, but the chart is now showing a critical battle between buyers and sellers.
📌 Key Levels to Watch:
🟢 $76.4K–$76.8K → Key support
⭐ $72.7K → Major bullish structure
🔴 $80K–$81K → Immediate resistance
🚀 $82.3K → Major breakout level
If $BTC reclaims $80K and breaks $82.3K with a strong daily close, the next targets could be $84K → $85K+.
But if $76.4K breaks, BTC could revisit $72.7K before the next major move.
📊 MACD is still showing weak momentum, so patience is key. Don't chase the pump—watch the levels.
BTC is at the decision zone. 👀
Breakout or deeper pullback?
#BTC #BTC #BitcoinAnalysis" #altcoins #BullishMomentum
🔥 $BTC /USDT — THE NEXT BIG MOVE IS LOADING! 🚨
Bitcoin is sitting around $78.6K after a strong rally, but the chart is now showing a critical battle between buyers and sellers.
📌 Key Levels to Watch:
🟢 $76.4K–$76.8K → Key support
⭐ $72.7K → Major bullish structure
🔴 $80K–$81K → Immediate resistance
🚀 $82.3K → Major breakout level
If $BTC reclaims $80K and breaks $82.3K with a strong daily close, the next targets could be $84K → $85K+.
But if $76.4K breaks, BTC could revisit $72.7K before the next major move.
📊 MACD is still showing weak momentum, so patience is key. Don't chase the pump—watch the levels.
BTC is at the decision zone. 👀
Breakout or deeper pullback?
#BTC #BTC #BitcoinAnalysis" #altcoins #BullishMomentum
Bitcoin is sitting around $78.6K after a strong rally, but the chart is now showing a critical battle between buyers and sellers.
📌 Key Levels to Watch:
🟢 $76.4K–$76.8K → Key support
⭐ $72.7K → Major bullish structure
🔴 $80K–$81K → Immediate resistance
🚀 $82.3K → Major breakout level
If $BTC reclaims $80K and breaks $82.3K with a strong daily close, the next targets could be $84K → $85K+.
But if $76.4K breaks, BTC could revisit $72.7K before the next major move.
📊 MACD is still showing weak momentum, so patience is key. Don't chase the pump—watch the levels.
BTC is at the decision zone. 👀
Breakout or deeper pullback?
#BTC #BTC #BitcoinAnalysis" #altcoins #BullishMomentum
1
52

·
--
🔥 BTC MARKET SCENARIO — SEPTEMBER 11
Bitcoin is currently trading around the $76K–$78K zone after failing to sustain the recent move toward $80K+.
📊 Key Levels to Watch:
🟢 Bullish Scenario
If BTC reclaims $78,500–$80,000 and holds above it, the next targets could be:
➡️ $81,000
➡️ $82,500
➡️ $84,000+
A strong breakout above $82.5K–$84K could bring a much bigger bullish move.
🔴 Bearish Scenario
If BTC loses $76,500–$77,000 with strong selling volume, downside risk increases toward:
➡️ $75,000
➡️ $73,000
➡️ $70,000–$72,000
⚠️ Macro Catalyst: U.S. CPI data and the upcoming Federal Reserve decision could create high volatility. Bitcoin is currently sensitive to rising U.S. yields and changing rate expectations.
🎯 My View:
BTC is at a critical decision zone. I would avoid chasing the middle of the range. A confirmed breakout above resistance could favor LONGS, while a confirmed breakdown below support could open the door for SHORTS.
Watch the breakout — not the prediction. 📈📉
#BTCUSDT #Crypto_Jobs🎯 #BTC #BinanceSquareTalks #BitcoinAnalysis" s #cryptotrading
🔥 BTC MARKET SCENARIO — SEPTEMBER 11
Bitcoin is currently trading around the $76K–$78K zone after failing to sustain the recent move toward $80K+.
📊 Key Levels to Watch:
🟢 Bullish Scenario
If BTC reclaims $78,500–$80,000 and holds above it, the next targets could be:
➡️ $81,000
➡️ $82,500
➡️ $84,000+
A strong breakout above $82.5K–$84K could bring a much bigger bullish move.
🔴 Bearish Scenario
If BTC loses $76,500–$77,000 with strong selling volume, downside risk increases toward:
➡️ $75,000
➡️ $73,000
➡️ $70,000–$72,000
⚠️ Macro Catalyst: U.S. CPI data and the upcoming Federal Reserve decision could create high volatility. Bitcoin is currently sensitive to rising U.S. yields and changing rate expectations.
🎯 My View:
BTC is at a critical decision zone. I would avoid chasing the middle of the range. A confirmed breakout above resistance could favor LONGS, while a confirmed breakdown below support could open the door for SHORTS.
Watch the breakout — not the prediction. 📈📉
#BTCUSDT #Crypto_Jobs🎯 #BTC #BinanceSquareTalks #BitcoinAnalysis" s #cryptotrading
Bitcoin is currently trading around the $76K–$78K zone after failing to sustain the recent move toward $80K+.
📊 Key Levels to Watch:
🟢 Bullish Scenario
If BTC reclaims $78,500–$80,000 and holds above it, the next targets could be:
➡️ $81,000
➡️ $82,500
➡️ $84,000+
A strong breakout above $82.5K–$84K could bring a much bigger bullish move.
🔴 Bearish Scenario
If BTC loses $76,500–$77,000 with strong selling volume, downside risk increases toward:
➡️ $75,000
➡️ $73,000
➡️ $70,000–$72,000
⚠️ Macro Catalyst: U.S. CPI data and the upcoming Federal Reserve decision could create high volatility. Bitcoin is currently sensitive to rising U.S. yields and changing rate expectations.
🎯 My View:
BTC is at a critical decision zone. I would avoid chasing the middle of the range. A confirmed breakout above resistance could favor LONGS, while a confirmed breakdown below support could open the door for SHORTS.
Watch the breakout — not the prediction. 📈📉
#BTCUSDT #Crypto_Jobs🎯 #BTC #BinanceSquareTalks #BitcoinAnalysis" s #cryptotrading
53

🚨 BTC IS AT A DECISION POINT
Bitcoin is hovering around the $79K area while the market is getting hit with higher oil prices, inflation concerns and rising Treasury yields.
But here's what caught my attention:
📈 BTC just flashed a Golden Cross the 50-day moving average has crossed above the 200-day moving average.
Historically, that's a bullish signal.
BUT…
A signal isn't a guarantee.
The real question is whether BTC can reclaim and hold the key resistance zones around $80K+.
If bulls take control → momentum could accelerate.
If BTC gets rejected → we could see another pullback before the next attempt.
Personally, I'm watching PRICE ACTION more than predictions.
What do you think?
🔥 Breakout
📉 Pullback
🤔 Sideways
Drop your view below. 👇
#Bitcoin #BTC #Crypto #BinanceSquareBTC #CryptoTrading. ading #BitcoinAnalysis" #TradingSignals
🚨 BTC IS AT A DECISION POINT
Bitcoin is hovering around the $79K area while the market is getting hit with higher oil prices, inflation concerns and rising Treasury yields.
But here's what caught my attention:
📈 BTC just flashed a Golden Cross the 50-day moving average has crossed above the 200-day moving average.
Historically, that's a bullish signal.
BUT…
A signal isn't a guarantee.
The real question is whether BTC can reclaim and hold the key resistance zones around $80K+.
If bulls take control → momentum could accelerate.
If BTC gets rejected → we could see another pullback before the next attempt.
Personally, I'm watching PRICE ACTION more than predictions.
What do you think?
🔥 Breakout
📉 Pullback
🤔 Sideways
Drop your view below. 👇
#Bitcoin #BTC #Crypto #BinanceSquareBTC #CryptoTrading. ading #BitcoinAnalysis" #TradingSignals
Bitcoin is hovering around the $79K area while the market is getting hit with higher oil prices, inflation concerns and rising Treasury yields.
But here's what caught my attention:
📈 BTC just flashed a Golden Cross the 50-day moving average has crossed above the 200-day moving average.
Historically, that's a bullish signal.
BUT…
A signal isn't a guarantee.
The real question is whether BTC can reclaim and hold the key resistance zones around $80K+.
If bulls take control → momentum could accelerate.
If BTC gets rejected → we could see another pullback before the next attempt.
Personally, I'm watching PRICE ACTION more than predictions.
What do you think?
🔥 Breakout
📉 Pullback
🤔 Sideways
Drop your view below. 👇
#Bitcoin #BTC #Crypto #BinanceSquareBTC #CryptoTrading. ading #BitcoinAnalysis" #TradingSignals
65

·
--
Статья
🚨 Bitcoin (BTC) at a Key Decision Zone$Bitcoin is trading around the $79K area, with bulls and bears fighting for short-term control. BTC recently pushed above $82K before sellers brought price back below $80K, so the next move could be important for market direction.
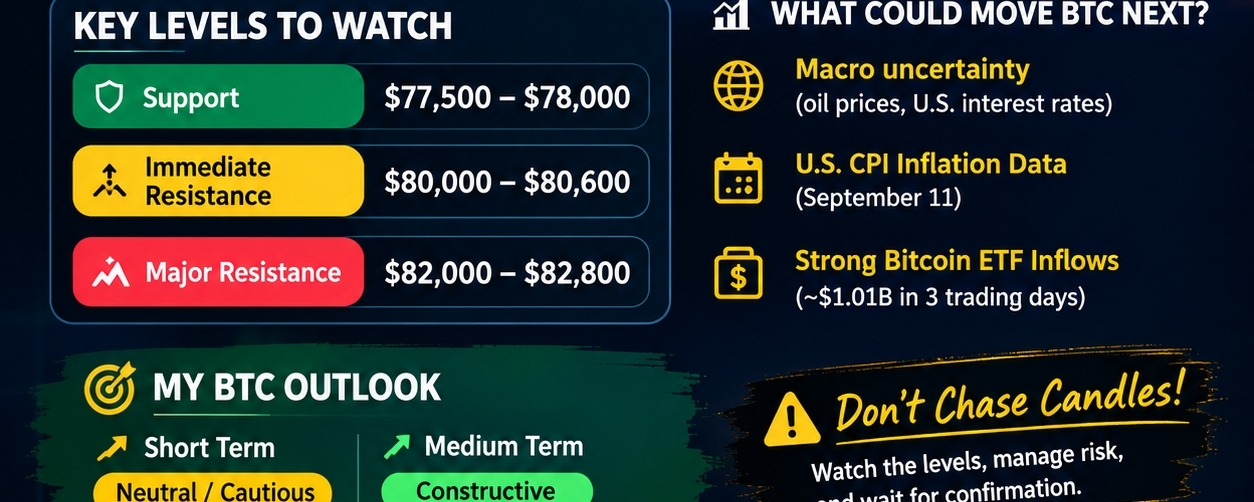
📊 Key Levels to Watch
🟢 Support: $77,500–$78,000
🟡 Immediate resistance: $80,000–$80,600
🔴 Major resistance: $82,000–$82,800
A strong move above $80.6K could improve bullish momentum and put the $82K–$82.8K zone back into focus.
On the other hand, losing the $77.5K–$78K support area could increase short-term selling pressure and expose lower support around $75.5K–$76K.
🔥 What Could Move BTC Next?
Macro conditions are important right now. Rising oil prices and uncertainty around U.S. interest rates are keeping risk assets volatile. The upcoming U.S. CPI inflation data on September 11 is another major event for traders to watch.
Interestingly, Bitcoin ETF flows have also shown strong buying activity recently, with reported net inflows of about $1.01 billion over three trading days.
🎯 My BTC Outlook
Short term: ⚠️ Neutral / cautious
Medium term: 🟢 Constructive while BTC holds major support
For bulls, the key confirmation would be a sustained reclaim of $80.6K, followed by a breakout above $82K–$82.8K.
For bears, a decisive break below $77.5K–$78K would weaken the current structure.
📌 Don't chase candles. Watch the levels, manage risk, and wait for confirmation.
#Bitcoin #BTC #Crypto #Binance #BTCAnalysis #CryptoMarket #BitcoinAnalysis"
🚨 Bitcoin (BTC) at a Key Decision Zone
$Bitcoin is trading around the $79K area, with bulls and bears fighting for short-term control. BTC recently pushed above $82K before sellers brought price back below $80K, so the next move could be important for market direction.
📊 Key Levels to Watch
🟢 Support: $77,500–$78,000
🟡 Immediate resistance: $80,000–$80,600
🔴 Major resistance: $82,000–$82,800
A strong move above $80.6K could improve bullish momentum and put the $82K–$82.8K zone back into focus.
On the other hand, losing the $77.5K–$78K support area could increase short-term selling pressure and expose lower support around $75.5K–$76K.
🔥 What Could Move BTC Next?
Macro conditions are important right now. Rising oil prices and uncertainty around U.S. interest rates are keeping risk assets volatile. The upcoming U.S. CPI inflation data on September 11 is another major event for traders to watch.
Interestingly, Bitcoin ETF flows have also shown strong buying activity recently, with reported net inflows of about $1.01 billion over three trading days.
🎯 My BTC Outlook
Short term: ⚠️ Neutral / cautious
Medium term: 🟢 Constructive while BTC holds major support
For bulls, the key confirmation would be a sustained reclaim of $80.6K, followed by a breakout above $82K–$82.8K.
For bears, a decisive break below $77.5K–$78K would weaken the current structure.
📌 Don't chase candles. Watch the levels, manage risk, and wait for confirmation.
#Bitcoin #BTC #Crypto #Binance #BTCAnalysis #CryptoMarket #BitcoinAnalysis"
📊 Key Levels to Watch
🟢 Support: $77,500–$78,000
🟡 Immediate resistance: $80,000–$80,600
🔴 Major resistance: $82,000–$82,800
A strong move above $80.6K could improve bullish momentum and put the $82K–$82.8K zone back into focus.
On the other hand, losing the $77.5K–$78K support area could increase short-term selling pressure and expose lower support around $75.5K–$76K.
🔥 What Could Move BTC Next?
Macro conditions are important right now. Rising oil prices and uncertainty around U.S. interest rates are keeping risk assets volatile. The upcoming U.S. CPI inflation data on September 11 is another major event for traders to watch.
Interestingly, Bitcoin ETF flows have also shown strong buying activity recently, with reported net inflows of about $1.01 billion over three trading days.
🎯 My BTC Outlook
Short term: ⚠️ Neutral / cautious
Medium term: 🟢 Constructive while BTC holds major support
For bulls, the key confirmation would be a sustained reclaim of $80.6K, followed by a breakout above $82K–$82.8K.
For bears, a decisive break below $77.5K–$78K would weaken the current structure.
📌 Don't chase candles. Watch the levels, manage risk, and wait for confirmation.
#Bitcoin #BTC #Crypto #Binance #BTCAnalysis #CryptoMarket #BitcoinAnalysis"
1
62
$BTC /USDT DAILY ANALYSIS — BIG BREAKOUT IN PLAY!
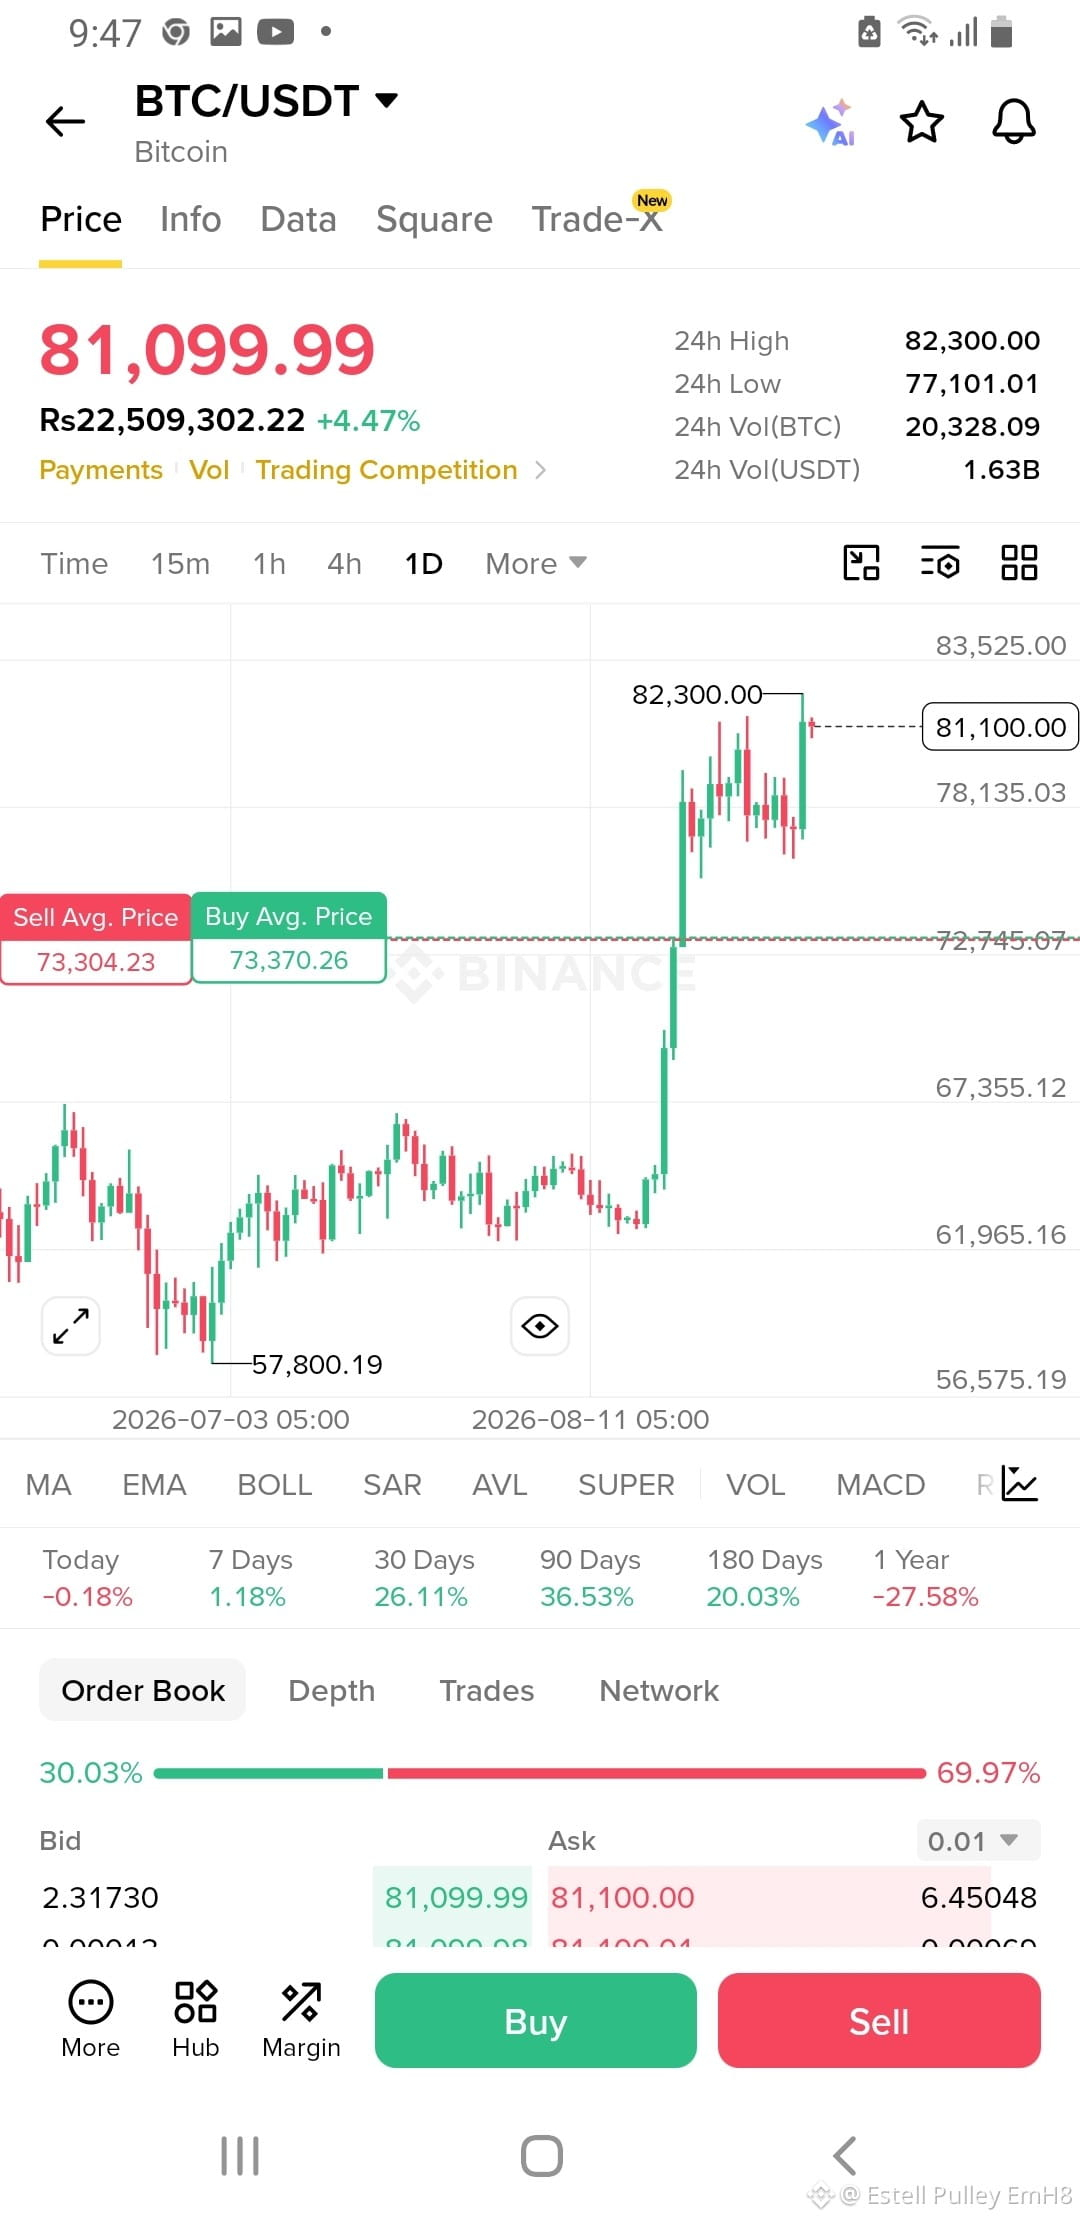
Bitcoin is currently trading around $81,100, after a strong breakout from the $72.7K zone. 📈
$BTC is now approaching a major resistance area, so the next move could be very important.
🔴 KEY RESISTANCE
• $82,300 — Recent High
• $83,500 — Major Resistance
• $85,000 — Psychological Level
• $90,000 — Bullish Target 🎯
🟢 KEY SUPPORT
• $80,000 — First Support
• $78,135 — Strong Support
• $76,000 — Pullback Zone
• $72,745 — Major Breakout Support
🔥 BULLISH SCENARIO:
If $BTC #gives a strong daily close above $82.3K–$83.5K, the next targets could be $85K → $87K → $90K.
⚠️ BEARISH SCENARIO:
If BTC gets rejected from $82K–$83.5K and loses $80K, we could see a pullback toward $78.1K → $76K → $72.7K.
📌 My Bias:
🟢 Bullish above $78K
🔥 Breakout above $83.5K = strong continuation setup
⚠️ Rejection near $82K–$83.5K = possible correction
For spot buyers, patience is key. Don't chase the pump — wait for either a confirmed breakout/retest or a healthy pullbac
BTC #Bitcoin #CryptoAnalysis #BitcoinAnalysis" #CryptoTradingPrediction
$BTC /USDT DAILY ANALYSIS — BIG BREAKOUT IN PLAY!
Bitcoin is currently trading around $81,100, after a strong breakout from the $72.7K zone. 📈
$BTC is now approaching a major resistance area, so the next move could be very important.
🔴 KEY RESISTANCE
• $82,300 — Recent High
• $83,500 — Major Resistance
• $85,000 — Psychological Level
• $90,000 — Bullish Target 🎯
🟢 KEY SUPPORT
• $80,000 — First Support
• $78,135 — Strong Support
• $76,000 — Pullback Zone
• $72,745 — Major Breakout Support
🔥 BULLISH SCENARIO:
If $BTC #gives a strong daily close above $82.3K–$83.5K, the next targets could be $85K → $87K → $90K.
⚠️ BEARISH SCENARIO:
If BTC gets rejected from $82K–$83.5K and loses $80K, we could see a pullback toward $78.1K → $76K → $72.7K.
📌 My Bias:
🟢 Bullish above $78K
🔥 Breakout above $83.5K = strong continuation setup
⚠️ Rejection near $82K–$83.5K = possible correction
For spot buyers, patience is key. Don't chase the pump — wait for either a confirmed breakout/retest or a healthy pullbac
BTC #Bitcoin #CryptoAnalysis #BitcoinAnalysis" #CryptoTradingPrediction
Bitcoin is currently trading around $81,100, after a strong breakout from the $72.7K zone. 📈
$BTC is now approaching a major resistance area, so the next move could be very important.
🔴 KEY RESISTANCE
• $82,300 — Recent High
• $83,500 — Major Resistance
• $85,000 — Psychological Level
• $90,000 — Bullish Target 🎯
🟢 KEY SUPPORT
• $80,000 — First Support
• $78,135 — Strong Support
• $76,000 — Pullback Zone
• $72,745 — Major Breakout Support
🔥 BULLISH SCENARIO:
If $BTC #gives a strong daily close above $82.3K–$83.5K, the next targets could be $85K → $87K → $90K.
⚠️ BEARISH SCENARIO:
If BTC gets rejected from $82K–$83.5K and loses $80K, we could see a pullback toward $78.1K → $76K → $72.7K.
📌 My Bias:
🟢 Bullish above $78K
🔥 Breakout above $83.5K = strong continuation setup
⚠️ Rejection near $82K–$83.5K = possible correction
For spot buyers, patience is key. Don't chase the pump — wait for either a confirmed breakout/retest or a healthy pullbac
BTC #Bitcoin #CryptoAnalysis #BitcoinAnalysis" #CryptoTradingPrediction
1
81

$BTC Right now, Bitcoin is trading around the $78,000 area and the candles are showing a period of consolidation after the recent move upward. The main resistance is around $79,200–$80,000, while $77,700–$78,000 is acting as immediate support. If a strong 4-hour candle closes above $80,000 with good volume, it could indicate bullish momentum and open the way toward $82,000–$85,000. On the other hand, if BTC gets rejected around $79,000–$80,000 and a 4-hour candle closes below $77,700, the price could move toward the $75,500–$76,000 support zone. For now, I would consider the market neutral to slightly bullish and wait for a confirmed candle breakout or breakdown rather than entering based on a single candle.
{spot}(BTCUSDT)
#btc70k #BTC #crypto #bitcoin #BitcoinAnalysis"
$BTC Right now, Bitcoin is trading around the $78,000 area and the candles are showing a period of consolidation after the recent move upward. The main resistance is around $79,200–$80,000, while $77,700–$78,000 is acting as immediate support. If a strong 4-hour candle closes above $80,000 with good volume, it could indicate bullish momentum and open the way toward $82,000–$85,000. On the other hand, if BTC gets rejected around $79,000–$80,000 and a 4-hour candle closes below $77,700, the price could move toward the $75,500–$76,000 support zone. For now, I would consider the market neutral to slightly bullish and wait for a confirmed candle breakout or breakdown rather than entering based on a single candle.
#btc70k #BTC #crypto #bitcoin #BitcoinAnalysis"
#btc70k #BTC #crypto #bitcoin #BitcoinAnalysis"
1
118

·
--
📊 O Bitcoin pode subir, cair ou ficar lateral. O que você acha que vem agora? $BTC
Escolha uma opção:
1️⃣ Continuação da alta
2️⃣ Correção saudável
3️⃣ Queda mais profunda
4️⃣ Mercado lateral
Minha leitura é simples: enquanto o Bitcoin mantiver sua estrutura de alta nos períodos maiores, uma correção de curto prazo não representa necessariamente uma reversão.
O sinal de alerta aparece quando suportes importantes são perdidos, antigos suportes viram resistências e os vendedores passam a dominar os repiques.
Comente apenas o número da sua escolha e explique o motivo. 👇
#BTC #BitcoinAnalysis" #CryptoMarket #Criptomonedas #BinanceSquare
📊 O Bitcoin pode subir, cair ou ficar lateral. O que você acha que vem agora? $BTC
Escolha uma opção:
1️⃣ Continuação da alta
2️⃣ Correção saudável
3️⃣ Queda mais profunda
4️⃣ Mercado lateral
Minha leitura é simples: enquanto o Bitcoin mantiver sua estrutura de alta nos períodos maiores, uma correção de curto prazo não representa necessariamente uma reversão.
O sinal de alerta aparece quando suportes importantes são perdidos, antigos suportes viram resistências e os vendedores passam a dominar os repiques.
Comente apenas o número da sua escolha e explique o motivo. 👇
#BTC #BitcoinAnalysis" #CryptoMarket #Criptomonedas #BinanceSquare
Escolha uma opção:
1️⃣ Continuação da alta
2️⃣ Correção saudável
3️⃣ Queda mais profunda
4️⃣ Mercado lateral
Minha leitura é simples: enquanto o Bitcoin mantiver sua estrutura de alta nos períodos maiores, uma correção de curto prazo não representa necessariamente uma reversão.
O sinal de alerta aparece quando suportes importantes são perdidos, antigos suportes viram resistências e os vendedores passam a dominar os repiques.
Comente apenas o número da sua escolha e explique o motivo. 👇
#BTC #BitcoinAnalysis" #CryptoMarket #Criptomonedas #BinanceSquare

1
67

·
--
🚨 $BTC /USDT MARKET UPDATE 📊
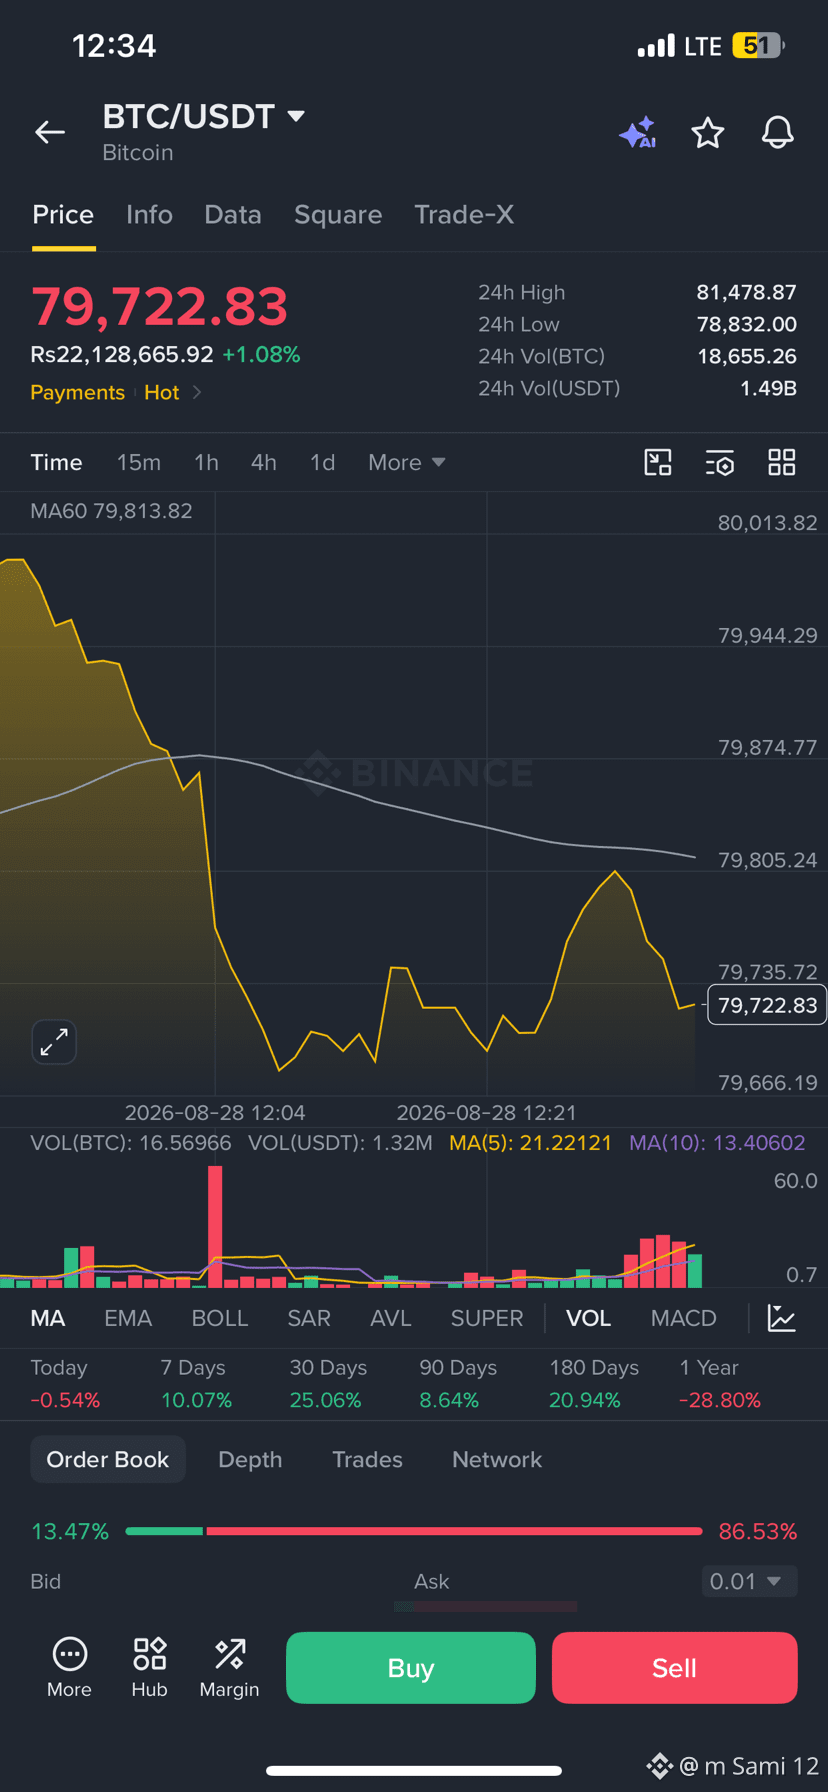
₿ $Bitcoin: $79,722.83 | +1.08%
$BTC is trading below the MA60 (~$79,814) after a sharp pullback. Buyers are attempting a recovery, but selling pressure remains strong.
📌 Key Levels
• Resistance: $79,800–$80,000
• Support: $79,650–$79,700
• Break above $80K → bullish continuation watch 👀
• Lose $79.65K → possible further downside ⚠️
🔥 Filler Sign: Watch for volume confirmation before the next move.
BTC is at a decision zone — stay alert! 🚀
Not financial advice. DYOR.
#BTC #bitcoin #BTCUSDT #Crypto #CryptoTrading #BinanceSquare #BitcoinAnalysis" #Trading #CryptoMarket #BTCUpdate #FillerSign
{spot}(BTCUSDT)
🚨 $BTC /USDT MARKET UPDATE 📊
₿ $Bitcoin: $79,722.83 | +1.08%
$BTC is trading below the MA60 (~$79,814) after a sharp pullback. Buyers are attempting a recovery, but selling pressure remains strong.
📌 Key Levels
• Resistance: $79,800–$80,000
• Support: $79,650–$79,700
• Break above $80K → bullish continuation watch 👀
• Lose $79.65K → possible further downside ⚠️
🔥 Filler Sign: Watch for volume confirmation before the next move.
BTC is at a decision zone — stay alert! 🚀
Not financial advice. DYOR.
#BTC #bitcoin #BTCUSDT #Crypto #CryptoTrading #BinanceSquare #BitcoinAnalysis" #Trading #CryptoMarket #BTCUpdate #FillerSign
₿ $Bitcoin: $79,722.83 | +1.08%
$BTC is trading below the MA60 (~$79,814) after a sharp pullback. Buyers are attempting a recovery, but selling pressure remains strong.
📌 Key Levels
• Resistance: $79,800–$80,000
• Support: $79,650–$79,700
• Break above $80K → bullish continuation watch 👀
• Lose $79.65K → possible further downside ⚠️
🔥 Filler Sign: Watch for volume confirmation before the next move.
BTC is at a decision zone — stay alert! 🚀
Not financial advice. DYOR.
#BTC #bitcoin #BTCUSDT #Crypto #CryptoTrading #BinanceSquare #BitcoinAnalysis" #Trading #CryptoMarket #BTCUpdate #FillerSign
52

·
--
Статья
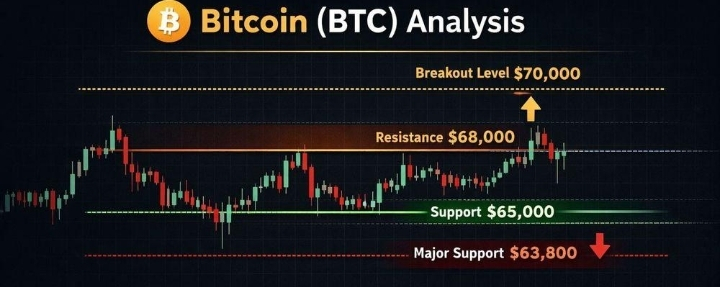
Bitcoin Faces Growing Pressure as Bullish Momentum Weakens$BTC Fails to Deliver the Breakout Bulls Expected
Bitcoin is beginning to show signs of weakness after failing to continue its upward expansion toward the unfilled CME gap near the $84k region.
Many traders were expecting $BTC to maintain bullish momentum and push into higher resistance levels. Instead, the market has shifted direction, with Bitcoin now forming lower highs and lower lows — a technical signal that often indicates weakening bullish structure.
This recent change in price action has reduced confidence among short-term bulls and increased concerns about a possible deeper correction.
$78.2K Emerges as the Key Support Zone
The most important level traders are monitoring right now is the $78.2k support area.
As long as buyers continue defending this zone, Bitcoin could still recover and attempt another move toward recent highs. However, current market conditions suggest that this bullish scenario is becoming less likely compared to earlier expectations.
A strong bounce from support may temporarily restore momentum, but if sellers gain control below this level, downside pressure could accelerate quickly.
Why a Retest of the Monthly Open Looks More Likely
Based on the current market structure, many traders now believe Bitcoin is more likely to break below support before finding stronger demand near the monthly open.
This area is important because it often acts as:
A liquidity zone
A major reaction level
A potential long-entry region for swing traders
If $BTC revisits that zone, traders may begin looking for stronger confirmation signals before entering new long positions.
Market Sentiment Turns More Defensive
Although long-term sentiment around Bitcoin remains positive, short-term momentum has clearly slowed. Traders are becoming more cautious and focusing heavily on risk management.
Key things the market is watching now:
Whether BTC can defend the $78.2k support
Volume during pullbacks
Market reaction near the monthly open
Signs of renewed buyer strength
Final Thoughts
Bitcoin’s recent price action is not what bullish traders were hoping for. The failure to continue higher and the formation of lower highs and lower lows have weakened the market structure significantly.
While another move upward is still possible if support holds, the probability of a deeper pullback currently appears stronger. For many traders, patience and confirmation remain more important than rushing into positions during uncertain market conditions.
#BTC #Bitcoin #Crypto #BitcoinAnalysis"
#BTCUpdate
Bitcoin Faces Growing Pressure as Bullish Momentum Weakens
$BTC Fails to Deliver the Breakout Bulls Expected
Bitcoin is beginning to show signs of weakness after failing to continue its upward expansion toward the unfilled CME gap near the $84k region.
Many traders were expecting $BTC to maintain bullish momentum and push into higher resistance levels. Instead, the market has shifted direction, with Bitcoin now forming lower highs and lower lows — a technical signal that often indicates weakening bullish structure.
This recent change in price action has reduced confidence among short-term bulls and increased concerns about a possible deeper correction.
$78.2K Emerges as the Key Support Zone
The most important level traders are monitoring right now is the $78.2k support area.
As long as buyers continue defending this zone, Bitcoin could still recover and attempt another move toward recent highs. However, current market conditions suggest that this bullish scenario is becoming less likely compared to earlier expectations.
A strong bounce from support may temporarily restore momentum, but if sellers gain control below this level, downside pressure could accelerate quickly.
Why a Retest of the Monthly Open Looks More Likely
Based on the current market structure, many traders now believe Bitcoin is more likely to break below support before finding stronger demand near the monthly open.
This area is important because it often acts as:
A liquidity zone
A major reaction level
A potential long-entry region for swing traders
If $BTC revisits that zone, traders may begin looking for stronger confirmation signals before entering new long positions.
Market Sentiment Turns More Defensive
Although long-term sentiment around Bitcoin remains positive, short-term momentum has clearly slowed. Traders are becoming more cautious and focusing heavily on risk management.
Key things the market is watching now:
Whether BTC can defend the $78.2k support
Volume during pullbacks
Market reaction near the monthly open
Signs of renewed buyer strength
Final Thoughts
Bitcoin’s recent price action is not what bullish traders were hoping for. The failure to continue higher and the formation of lower highs and lower lows have weakened the market structure significantly.
While another move upward is still possible if support holds, the probability of a deeper pullback currently appears stronger. For many traders, patience and confirmation remain more important than rushing into positions during uncertain market conditions.
#BTC #Bitcoin #Crypto #BitcoinAnalysis"
#BTCUpdate
Bitcoin is beginning to show signs of weakness after failing to continue its upward expansion toward the unfilled CME gap near the $84k region.
Many traders were expecting $BTC to maintain bullish momentum and push into higher resistance levels. Instead, the market has shifted direction, with Bitcoin now forming lower highs and lower lows — a technical signal that often indicates weakening bullish structure.
This recent change in price action has reduced confidence among short-term bulls and increased concerns about a possible deeper correction.
$78.2K Emerges as the Key Support Zone
The most important level traders are monitoring right now is the $78.2k support area.
As long as buyers continue defending this zone, Bitcoin could still recover and attempt another move toward recent highs. However, current market conditions suggest that this bullish scenario is becoming less likely compared to earlier expectations.
A strong bounce from support may temporarily restore momentum, but if sellers gain control below this level, downside pressure could accelerate quickly.
Why a Retest of the Monthly Open Looks More Likely
Based on the current market structure, many traders now believe Bitcoin is more likely to break below support before finding stronger demand near the monthly open.
This area is important because it often acts as:
A liquidity zone
A major reaction level
A potential long-entry region for swing traders
If $BTC revisits that zone, traders may begin looking for stronger confirmation signals before entering new long positions.
Market Sentiment Turns More Defensive
Although long-term sentiment around Bitcoin remains positive, short-term momentum has clearly slowed. Traders are becoming more cautious and focusing heavily on risk management.
Key things the market is watching now:
Whether BTC can defend the $78.2k support
Volume during pullbacks
Market reaction near the monthly open
Signs of renewed buyer strength
Final Thoughts
Bitcoin’s recent price action is not what bullish traders were hoping for. The failure to continue higher and the formation of lower highs and lower lows have weakened the market structure significantly.
While another move upward is still possible if support holds, the probability of a deeper pullback currently appears stronger. For many traders, patience and confirmation remain more important than rushing into positions during uncertain market conditions.
#BTC #Bitcoin #Crypto #BitcoinAnalysis"
#BTCUpdate
2
428

$BTC Liquidity Hunt
Downside Gap: Bottom liquidity near $70,000 – $72,000 remains untouched.
Upside Magnet: A fresh liquidity cluster is forming at the $79,000 zone.
Market Bias: Prices often "sweep" the nearest cluster before a major reversal.
The Big Question: Will $BTC dip to clear the $70k longs first, or squeeze the $79k shorts?
Watch closely: Volume at the current range will confirm the first move. Be ready for volatility. #BitcoinAnalysis" #liquidity
#Crypto2026🔥 #Market_Update #Binance
{spot}(BTCUSDT)
$BTC Liquidity Hunt
Downside Gap: Bottom liquidity near $70,000 – $72,000 remains untouched.
Upside Magnet: A fresh liquidity cluster is forming at the $79,000 zone.
Market Bias: Prices often "sweep" the nearest cluster before a major reversal.
The Big Question: Will $BTC dip to clear the $70k longs first, or squeeze the $79k shorts?
Watch closely: Volume at the current range will confirm the first move. Be ready for volatility. #BitcoinAnalysis" #liquidity
#Crypto2026🔥 #Market_Update #Binance
Downside Gap: Bottom liquidity near $70,000 – $72,000 remains untouched.
Upside Magnet: A fresh liquidity cluster is forming at the $79,000 zone.
Market Bias: Prices often "sweep" the nearest cluster before a major reversal.
The Big Question: Will $BTC dip to clear the $70k longs first, or squeeze the $79k shorts?
Watch closely: Volume at the current range will confirm the first move. Be ready for volatility. #BitcoinAnalysis" #liquidity
#Crypto2026🔥 #Market_Update #Binance
115

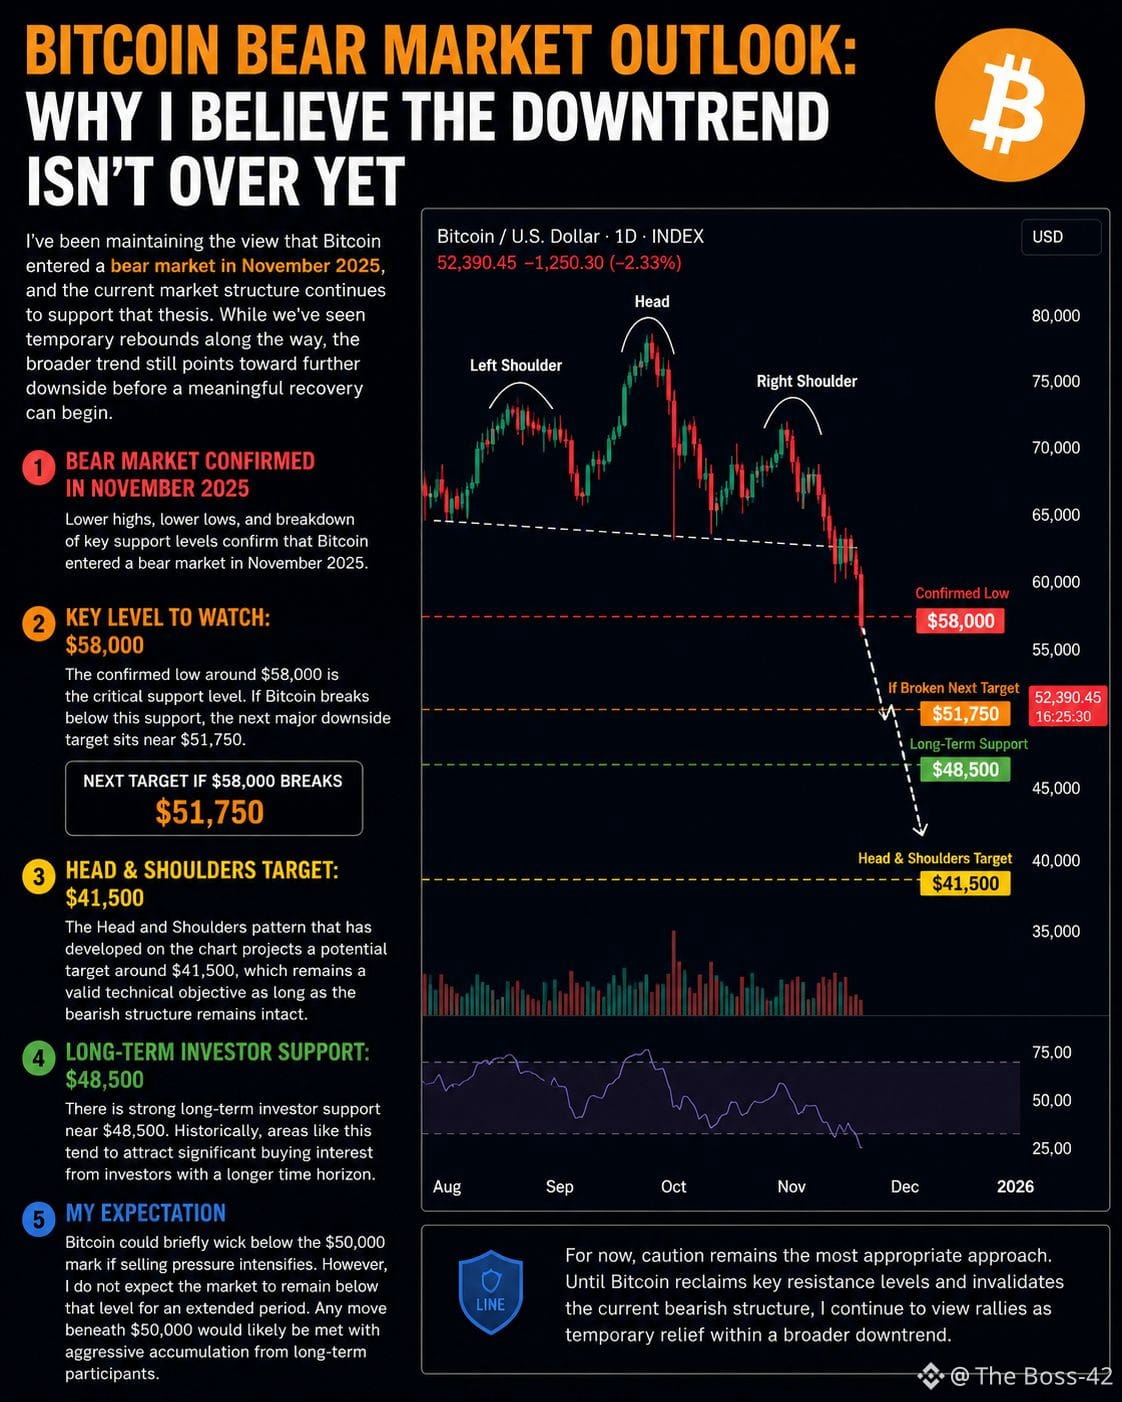
Bitcoin Bear Market Outlook: Why I Believe the Downtrend Isn't Over Yet
I've been maintaining the view that Bitcoin entered a bear market in November 2025, and the current market structure continues to support that thesis. While we've seen temporary rebounds along the way, the broader trend still points toward further downside before a meaningful recovery can begin.
At the moment, the key level I'm watching is the confirmed low around $58,000. If Bitcoin breaks below this support, the next major downside target sits near $51,750. Based on current price action and market sentiment, I consider a move to this level highly probable.
Additionally, the larger Head and Shoulders pattern that has developed on the chart projects a potential target around $41,500. While reaching that level is not guaranteed, it remains a valid technical objective as long as the bearish structure remains intact.
That said, I also recognize the presence of strong long-term investor support near $48,500. Historically, areas like this tend to attract significant buying interest from investors with a longer time horizon.
My expectation is that Bitcoin could briefly wick below the $50,000 mark if selling pressure intensifies. However, I do not expect the market to remain below that level for an extended period. Any move beneath $50,000 would likely be met with aggressive accumulation from long-term participants.
For now, caution remains the most appropriate approach. Until Bitcoin reclaims key resistance levels and invalidates the current bearish structure, I continue to view rallies as temporary relief within a broader downtrend.
$BTC $ETH $BNB
#bitcoin #BTC #Crypto #BitcoinAnalysis" #CryptoMarkets
{future}(SOLUSDT)
{spot}(BTCUSDT)
{spot}(BNBUSDT)
Bitcoin Bear Market Outlook: Why I Believe the Downtrend Isn't Over Yet
I've been maintaining the view that Bitcoin entered a bear market in November 2025, and the current market structure continues to support that thesis. While we've seen temporary rebounds along the way, the broader trend still points toward further downside before a meaningful recovery can begin.
At the moment, the key level I'm watching is the confirmed low around $58,000. If Bitcoin breaks below this support, the next major downside target sits near $51,750. Based on current price action and market sentiment, I consider a move to this level highly probable.
Additionally, the larger Head and Shoulders pattern that has developed on the chart projects a potential target around $41,500. While reaching that level is not guaranteed, it remains a valid technical objective as long as the bearish structure remains intact.
That said, I also recognize the presence of strong long-term investor support near $48,500. Historically, areas like this tend to attract significant buying interest from investors with a longer time horizon.
My expectation is that Bitcoin could briefly wick below the $50,000 mark if selling pressure intensifies. However, I do not expect the market to remain below that level for an extended period. Any move beneath $50,000 would likely be met with aggressive accumulation from long-term participants.
For now, caution remains the most appropriate approach. Until Bitcoin reclaims key resistance levels and invalidates the current bearish structure, I continue to view rallies as temporary relief within a broader downtrend.
$BTC $ETH $BNB
#bitcoin #BTC #Crypto #BitcoinAnalysis" #CryptoMarkets
I've been maintaining the view that Bitcoin entered a bear market in November 2025, and the current market structure continues to support that thesis. While we've seen temporary rebounds along the way, the broader trend still points toward further downside before a meaningful recovery can begin.
At the moment, the key level I'm watching is the confirmed low around $58,000. If Bitcoin breaks below this support, the next major downside target sits near $51,750. Based on current price action and market sentiment, I consider a move to this level highly probable.
Additionally, the larger Head and Shoulders pattern that has developed on the chart projects a potential target around $41,500. While reaching that level is not guaranteed, it remains a valid technical objective as long as the bearish structure remains intact.
That said, I also recognize the presence of strong long-term investor support near $48,500. Historically, areas like this tend to attract significant buying interest from investors with a longer time horizon.
My expectation is that Bitcoin could briefly wick below the $50,000 mark if selling pressure intensifies. However, I do not expect the market to remain below that level for an extended period. Any move beneath $50,000 would likely be met with aggressive accumulation from long-term participants.
For now, caution remains the most appropriate approach. Until Bitcoin reclaims key resistance levels and invalidates the current bearish structure, I continue to view rallies as temporary relief within a broader downtrend.
$BTC $ETH $BNB
#bitcoin #BTC #Crypto #BitcoinAnalysis" #CryptoMarkets
99
Войдите, чтобы посмотреть больше материала
Присоединяйтесь к пользователям криптовалют по всему миру на Binance Square
⚡️ Получайте новейшую и полезную информацию о криптоактивах.
💬 Нам доверяет крупнейшая в мире криптобиржа.
👍 Получите достоверные аналитические данные от верифицированных создателей контента.
Эл. почта/номер телефона
В тренде
1
#BinanceKZ
Просмотров: 18,000
69 обсуждают
2
#BitcoinClears$85200
Просмотров: 3,043
118 обсуждают
3
#AltcoinSeasonIndexHoldsAbove60For5Days
Просмотров: 20,399
734 обсуждают
4
#USADPAdds90000JobsInSeptember
Просмотров: 7,430
406 обсуждают
5
#USCorePCEEasesTo3%InAugust
Просмотров: 6,367
347 обсуждают
6
#KospiPostsWorstQuarterSince2020
Просмотров: 5,559
369 обсуждают
7
#SECToClarifyOnChainFundraisingRules
Просмотров: 14,111
536 обсуждают
8
#UKFCAOpensCryptoFirmAuthorization
Просмотров: 16,840
474 обсуждают
9
#JapanMOFStudyGroupOnTokenizedGovtBonds
Просмотров: 14,502
384 обсуждают
10
#QNTRises287%
Просмотров: 64,825
806 обсуждают