btcusd

Просмотров: 3M
3,749 обсуждают
Danish Ali 786912
·
--
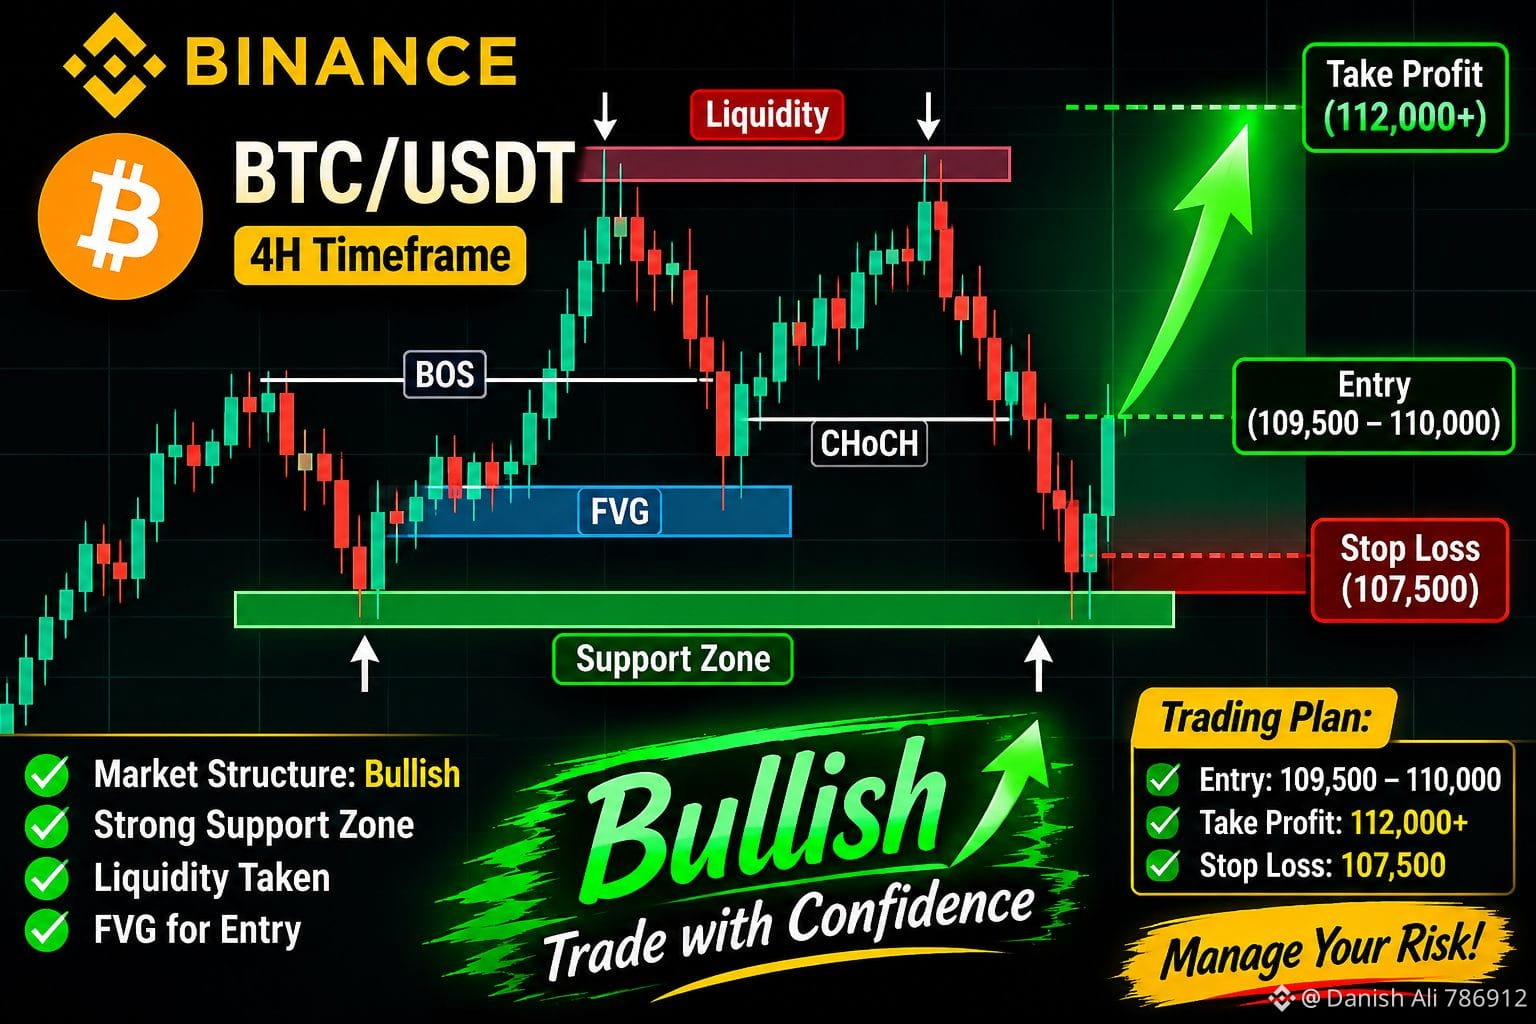
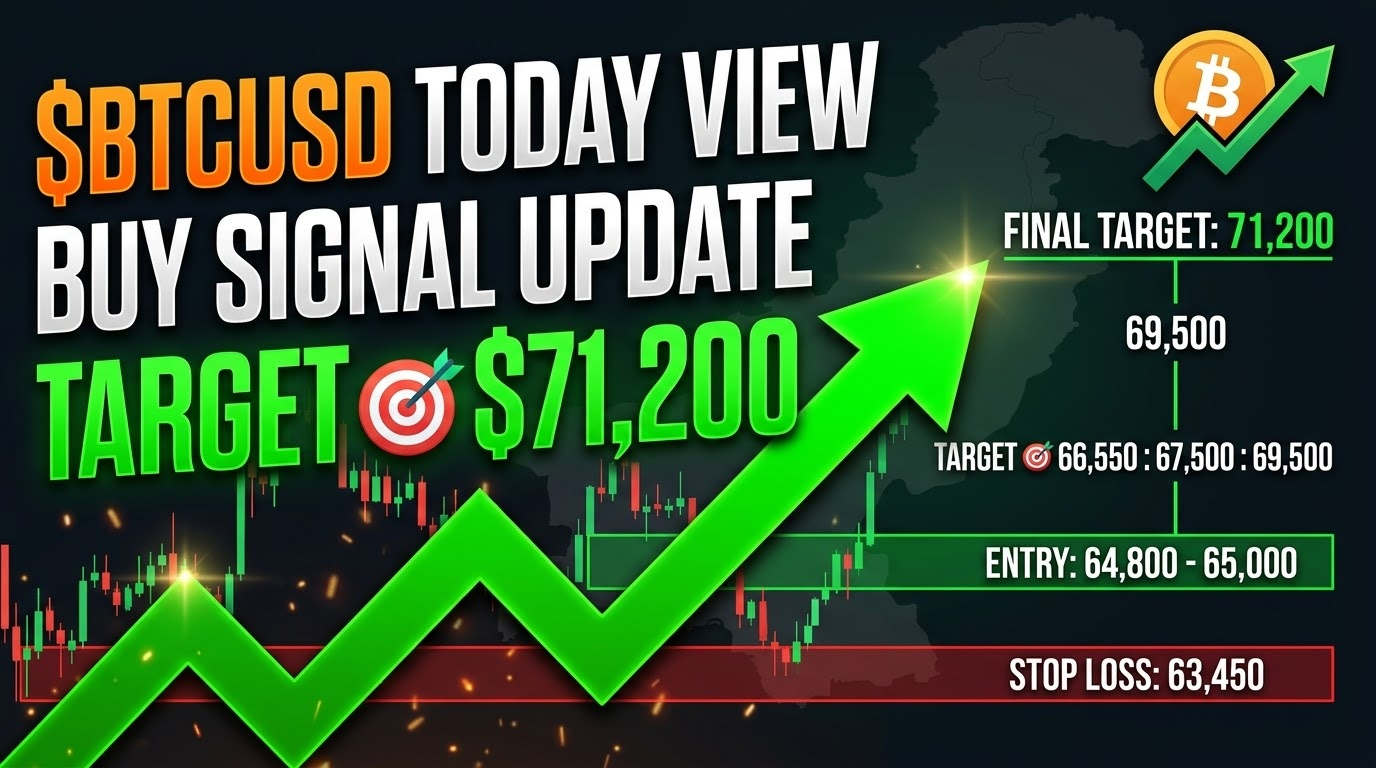
🚀 #BTCUSD – Bullish Market Analysis! Bitcoin is showing a potential bullish structure. Watch liquidity, BOS, CHoCH and FVG for possible entry opportunities. Stay patient and manage your risk. #Bitcoin #BTC #cryptotrading
🚀 #BTCUSD – Bullish Market Analysis!

Bitcoin is showing a potential bullish structure. Watch liquidity, BOS, CHoCH and FVG for possible entry opportunities.

Stay patient and manage your risk.

#Bitcoin #BTC #cryptotrading
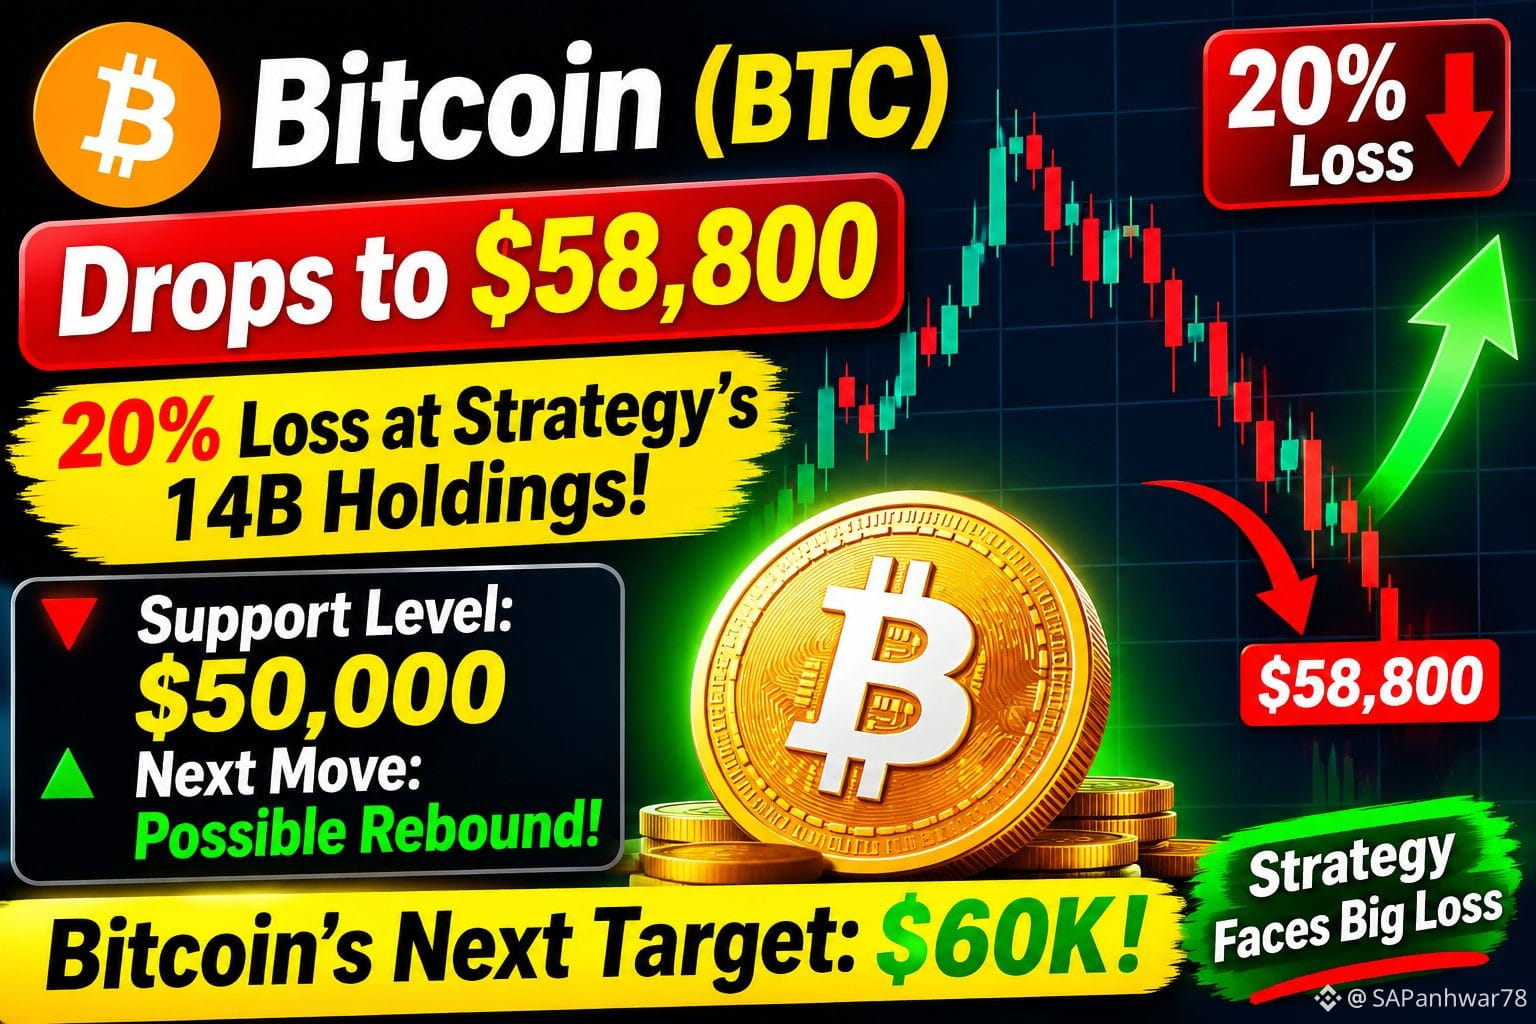
$Bitcoin falls to around $58,800, breaking the $60K support level. ⚠️ Analysts warn that $50,000 could become the next key support level if selling pressure continues. 📊 Crypto markets remain under pressure. Volatility is high. Stay alert and DYOR! #Bitcoin #BTC #CryptoNews #Binance #BTCUSD
$Bitcoin falls to around $58,800, breaking the $60K support level.
⚠️ Analysts warn that $50,000 could become the next key support level if selling pressure continues.
📊 Crypto markets remain under pressure. Volatility is high.
Stay alert and DYOR!
#Bitcoin #BTC #CryptoNews #Binance #BTCUSD
·
--
Падение
₿ BITCOIN WATCH: MARKET UNDER PRESSURE! Bitcoin is trading around $61,735 today, with a 3.2% daily decline. 📉 Market focus: Selling pressure across major cryptocurrenciesWeak investor sentimentInstitutional ETF outflowsKey support near $61,200 ⚡ Traders are watching whether $BTC can stabilize or experience another drop. What is your Bitcoin outlook? #Bitcoin #BTCUSD #CryptoTrading #BitcoinNews {spot}(BTCUSDT)
₿ BITCOIN WATCH: MARKET UNDER PRESSURE!
Bitcoin is trading around $61,735 today, with a 3.2% daily decline.
📉 Market focus:
Selling pressure across major cryptocurrenciesWeak investor sentimentInstitutional ETF outflowsKey support near $61,200
⚡ Traders are watching whether $BTC can stabilize or experience another drop.
What is your Bitcoin outlook?
#Bitcoin #BTCUSD #CryptoTrading #BitcoinNews
·
--
Падение
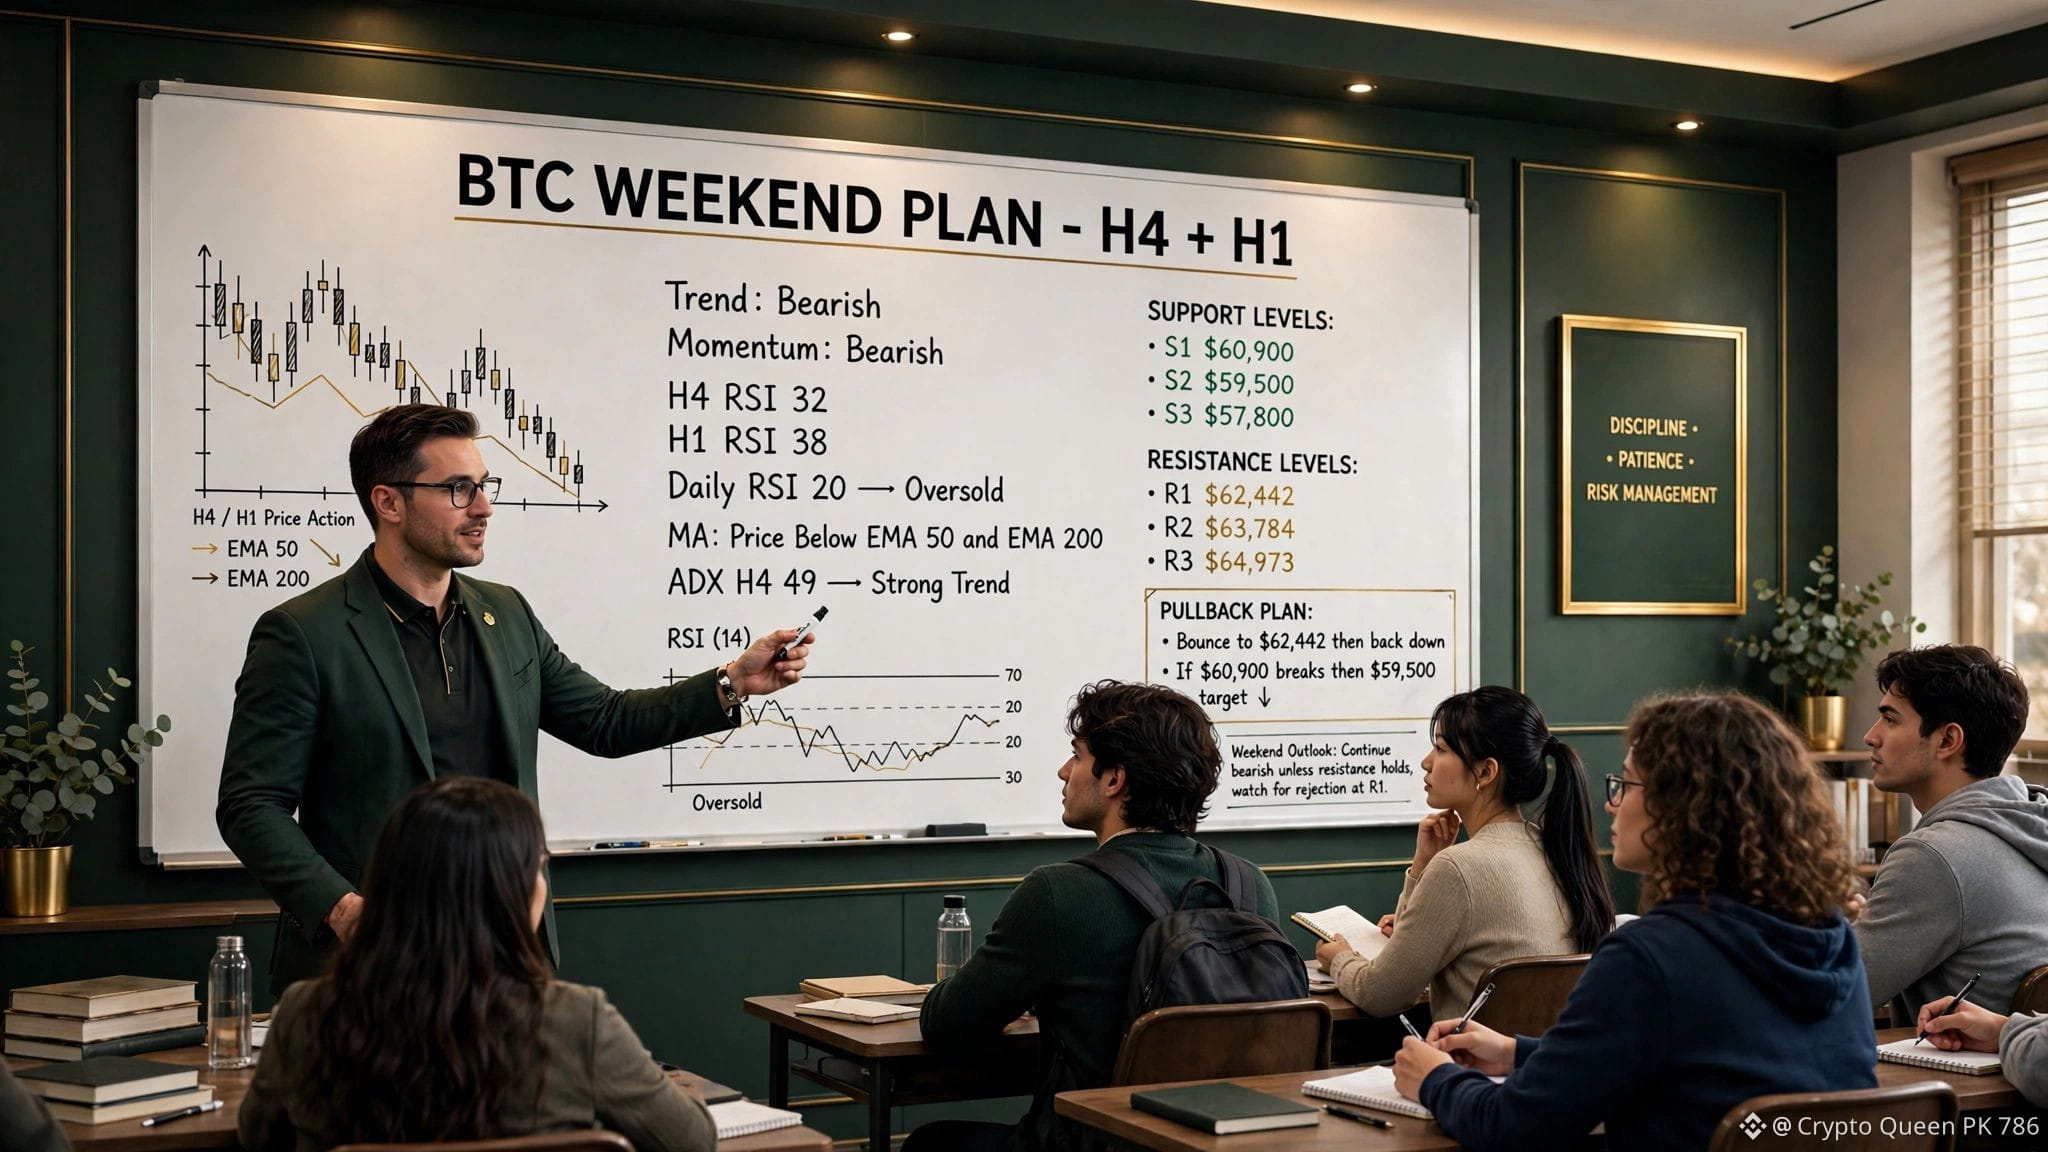
BTC WEEKEND PLAN - 22-23 NOV 2026 H4 + H1 COMBO - TRADE ONLY ON CONFIRMATION PRICE NOW: BTC Around $61,650 - $61,960 MOMENTUM: - Momentum: BEARISH - Trend: DOWNTREND - H4 RSI: 32 - Weak - H1 RSI: 38 - Weak - Daily RSI: 20 - Oversold, But No Bottom Confirmed - ADX H4: 49 - Strong Trend, Don't Trade Against It - Fear & Greed: 12 - Extreme Fear H4 - MAIN TREND: - Trend: BEARISH - Below H4 = Only Think SELL - Resistance: $62,442 / $63,784 - Support: $60,900 / $59,500 H1 - ENTRY: - Trend: BEARISH - Wait For Pullback Only - Resistance Zone: $62,400 - $63,000 - Support Zone: $60,900 - $60,000 RESISTANCE: - R1: $62,442 - First Pullback Point - R2: $63,784 - Strong Pullback Point - R3: $64,973 - Major Pullback Point SUPPORT: - S1: $60,900 - Most Important Support - S2: $59,500 - If S1 Breaks - S3: $57,800 - Last Support 3 WEEKEND SCENARIOS: 1. BEARISH CONTINUE - Highest Chance: - If Price Stays Below $62,442 - Then $60,900 Will Be Tested - If $60,900 Breaks, Target $59,500 - If $59,500 Breaks, Target $57,800 2. PULLBACK THEN DOWN - Bounce Trap: - If Price Holds At $60,900 - Bounce To $62,442 Is Possible - Rejection From $62,442 - $63,784 Is Possible - Then Think SELL Again, Not BUY 3. REVERSAL - Lowest Chance: - Only If H4 Candle Closes Above $63,784 - Only Then Trend Will Change - Then Target $64,973 - Don't BUY Before That WEEKEND RULES: - Weekend Volume Is Low, Don't Take Big Trades - Take Only A+ Setups - Always Use Stop Loss - Risk Max 1% Per Trade - Daily Close Below $60,900 = More Bearish I Am Not A Financial Advisor. This Is Just My Technical Analysis And This Is My Plan. Trading Is Risky, Do Your Own Research. #BTC #Bitcoin #BTCUSD #CryptoNewss #trading
BTC WEEKEND PLAN - 22-23 NOV 2026
H4 + H1 COMBO - TRADE ONLY ON CONFIRMATION

PRICE NOW:
BTC Around $61,650 - $61,960

MOMENTUM:
- Momentum: BEARISH
- Trend: DOWNTREND
- H4 RSI: 32 - Weak
- H1 RSI: 38 - Weak
- Daily RSI: 20 - Oversold, But No Bottom Confirmed
- ADX H4: 49 - Strong Trend, Don't Trade Against It
- Fear & Greed: 12 - Extreme Fear

H4 - MAIN TREND:
- Trend: BEARISH
- Below H4 = Only Think SELL
- Resistance: $62,442 / $63,784
- Support: $60,900 / $59,500

H1 - ENTRY:
- Trend: BEARISH
- Wait For Pullback Only
- Resistance Zone: $62,400 - $63,000
- Support Zone: $60,900 - $60,000

RESISTANCE:
- R1: $62,442 - First Pullback Point
- R2: $63,784 - Strong Pullback Point
- R3: $64,973 - Major Pullback Point

SUPPORT:
- S1: $60,900 - Most Important Support
- S2: $59,500 - If S1 Breaks
- S3: $57,800 - Last Support

3 WEEKEND SCENARIOS:

1. BEARISH CONTINUE - Highest Chance:
- If Price Stays Below $62,442
- Then $60,900 Will Be Tested
- If $60,900 Breaks, Target $59,500
- If $59,500 Breaks, Target $57,800

2. PULLBACK THEN DOWN - Bounce Trap:
- If Price Holds At $60,900
- Bounce To $62,442 Is Possible
- Rejection From $62,442 - $63,784 Is Possible
- Then Think SELL Again, Not BUY

3. REVERSAL - Lowest Chance:
- Only If H4 Candle Closes Above $63,784
- Only Then Trend Will Change
- Then Target $64,973
- Don't BUY Before That

WEEKEND RULES:
- Weekend Volume Is Low, Don't Take Big Trades
- Take Only A+ Setups
- Always Use Stop Loss
- Risk Max 1% Per Trade
- Daily Close Below $60,900 = More Bearish

I Am Not A Financial Advisor. This Is Just My Technical Analysis And This Is My Plan. Trading Is Risky, Do Your Own Research.

#BTC #Bitcoin #BTCUSD #CryptoNewss #trading
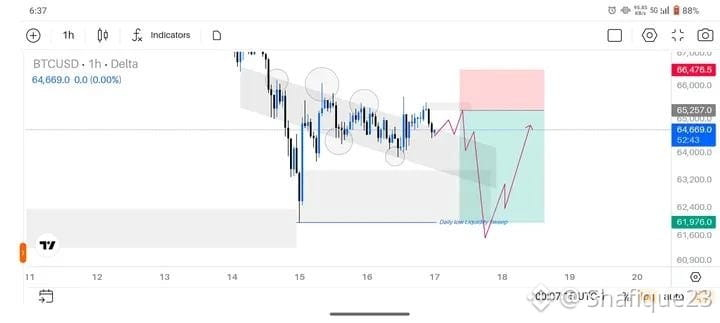
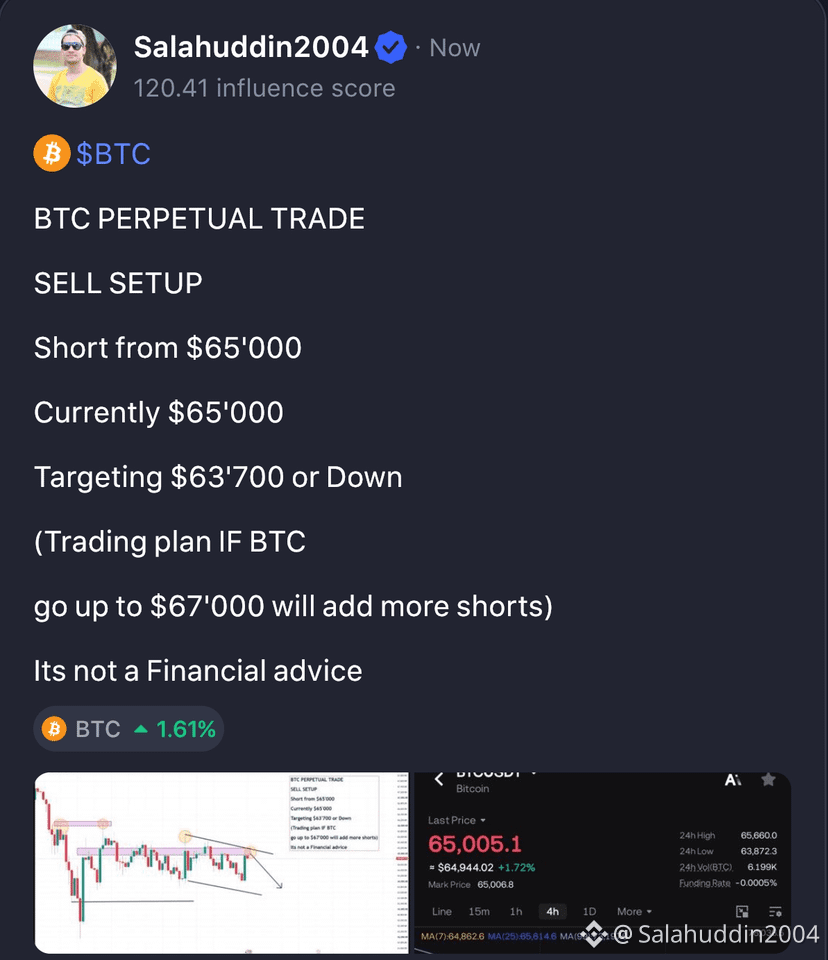
$BTC 1H Outlook 👀 Watching the $65,257 resistance zone closely for a short entry. If rejected, price could sweep the daily low liquidity around $61,976. • SL: $66,476 • TP: $61,976 What’s your bias on $BTC right now—bullish or bearish? 👇 #BTCUSD #Crypto #TradingSetup #PriceAction
$BTC 1H Outlook 👀
Watching the $65,257 resistance zone closely for a short entry. If rejected, price could sweep the daily low liquidity around $61,976.
• SL: $66,476
• TP: $61,976
What’s your bias on $BTC right now—bullish or bearish? 👇
#BTCUSD #Crypto #TradingSetup #PriceAction
🚨 BITCOIN MARKET UPDATE | NOVEMBER 18, 2026 📉📈 Bitcoin (BTC) is facing another challenging day as selling pressure continues to dominate the crypto market. 🔴 Current Market Situation: - BTC is trading around $63,500–$64,500. - Bitcoin has struggled to stay above the $65,000 level. - BTC is down significantly from its November highs. - US Spot Bitcoin ETFs recorded approximately $239.9 million in outflows on November 17. - Investors are watching the Federal Reserve's latest economic signals. 📉 Why Is Bitcoin Falling? Weak institutional demand. ETF outflows. Uncertainty around US interest rates. Continued selling pressure in the crypto market. 📈 What's Next? Bitcoin could attempt a recovery if buying pressure returns. However, further downside remains possible if selling continues. ⚠️ Market Outlook: Bearish pressure remains strong, but a short-term recovery is still possible. 💬 What do you think? Will BTC recover above $65K or fall below $62K? #Bitcoin #BTC #CryptoNews #BitcoinUpdate #CryptoMarket #November182026 #BTCUSD
🚨 BITCOIN MARKET UPDATE | NOVEMBER 18, 2026 📉📈

Bitcoin (BTC) is facing another challenging day as selling pressure continues to dominate the crypto market.

🔴 Current Market Situation:

- BTC is trading around $63,500–$64,500.
- Bitcoin has struggled to stay above the $65,000 level.
- BTC is down significantly from its November highs.
- US Spot Bitcoin ETFs recorded approximately $239.9 million in outflows on November 17.
- Investors are watching the Federal Reserve's latest economic signals.

📉 Why Is Bitcoin Falling?
Weak institutional demand.
ETF outflows.
Uncertainty around US interest rates.
Continued selling pressure in the crypto market.
📈 What's Next? Bitcoin could attempt a recovery if buying pressure returns. However, further downside remains possible if selling continues.
⚠️ Market Outlook: Bearish pressure remains strong, but a short-term recovery is still possible.
💬 What do you think? Will BTC recover above $65K or fall below $62K?
#Bitcoin #BTC #CryptoNews #BitcoinUpdate #CryptoMarket #November182026 #BTCUSD
Bitcoin Up or Down on November 18?

Bitcoin Up or Down on November 18?

1%Up99%Down
Объем $248,351.12
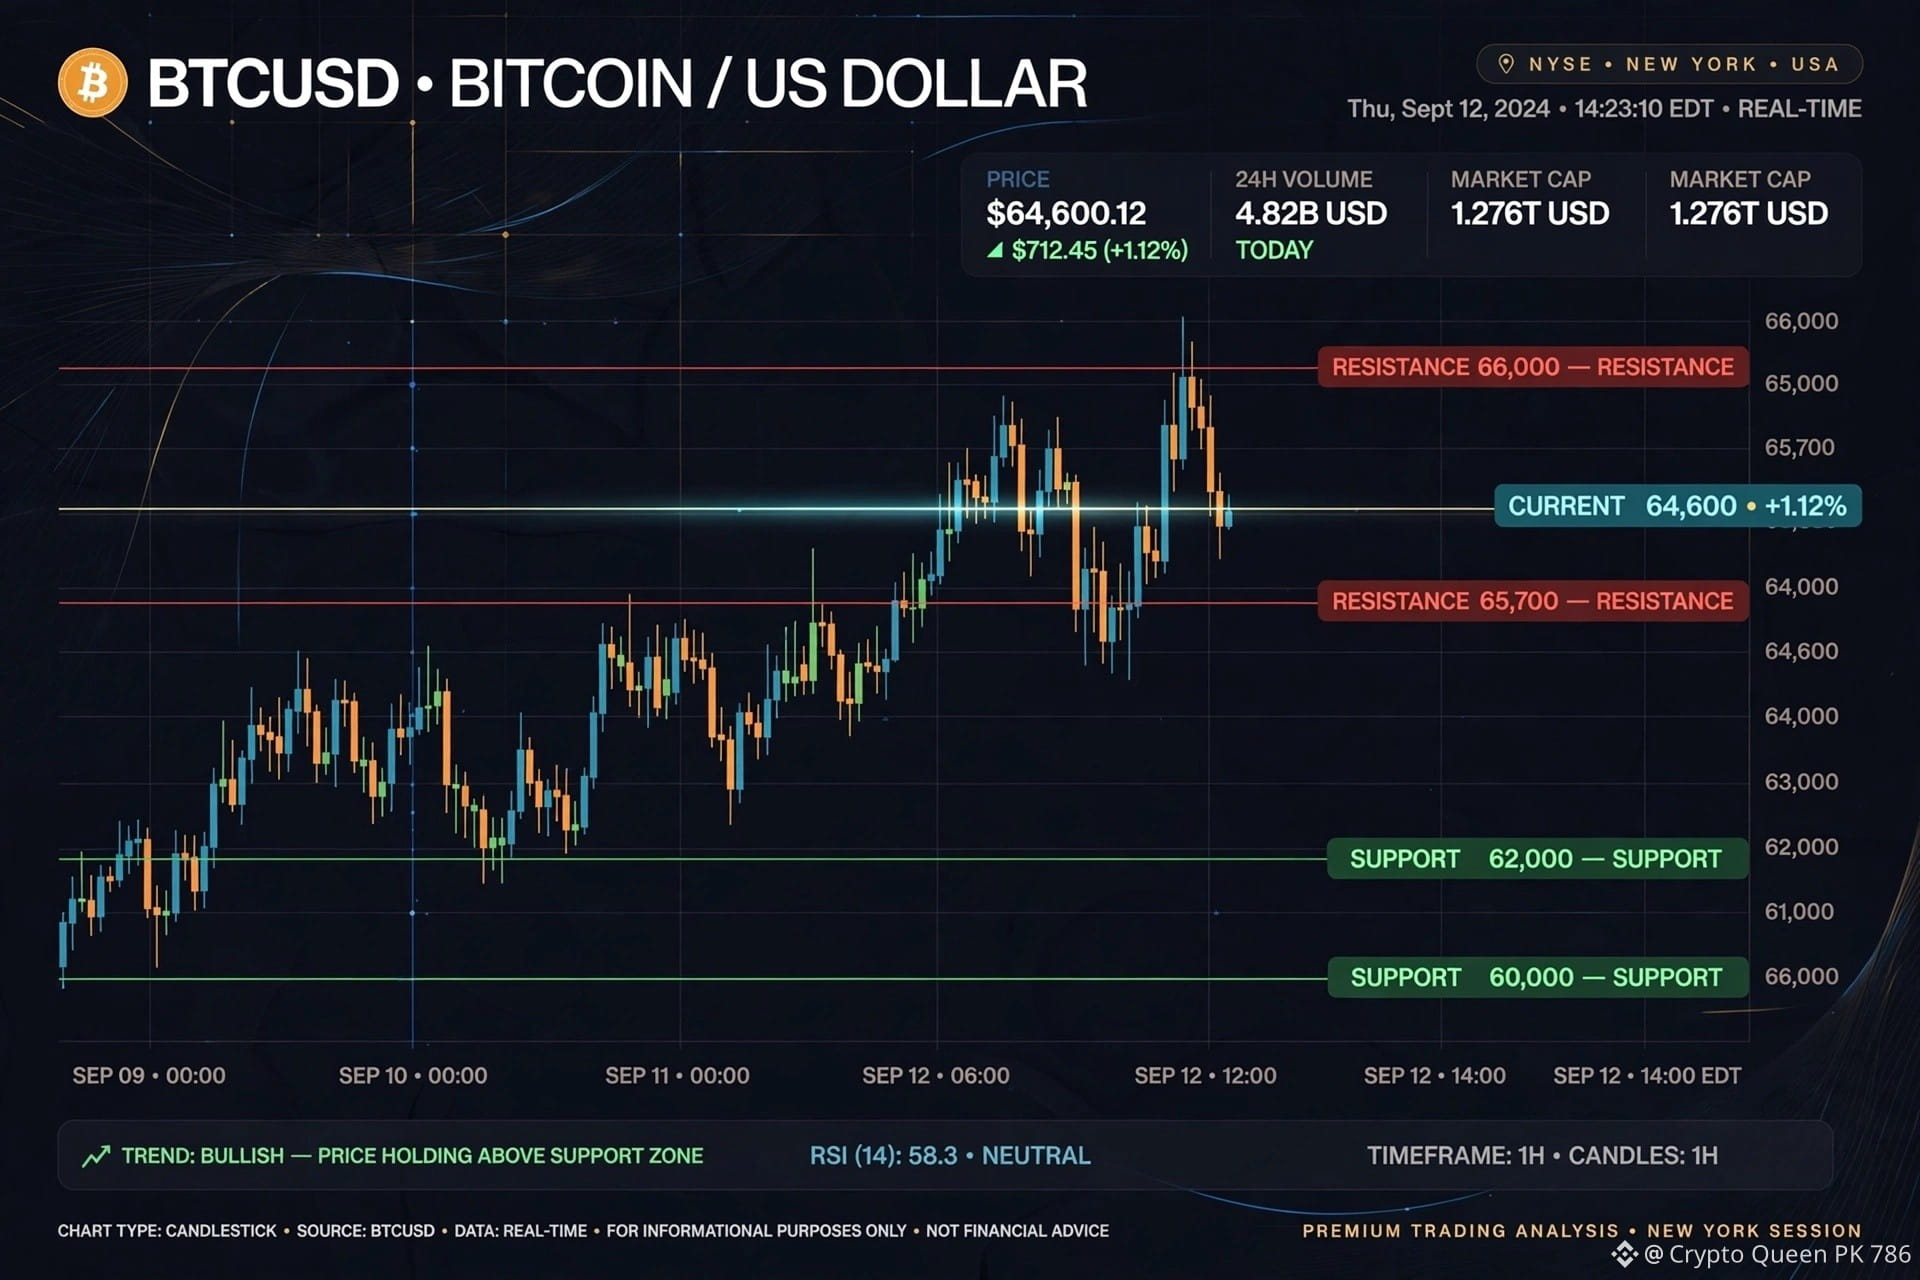
BTC AT KEY SUPPORT - HOLD OR BREAK? Bitcoin is trading near $64,600 after ETF outflows and heavy selling pressure. Key Levels: Support: $62,000 / $60,000 Resistance: $65,700 / $66,000 RSI is oversold, so a short bounce is possible. But until BTC reclaims $65,700, sellers are still in control. Hold $62K = bounce toward $68K Lose $62K = next stop $58K - $56K Are you buying this dip or waiting? #BTC #Bitcoin #Crypto #BTCUSD
BTC AT KEY SUPPORT - HOLD OR BREAK?

Bitcoin is trading near $64,600 after ETF outflows and heavy selling pressure.

Key Levels:
Support: $62,000 / $60,000
Resistance: $65,700 / $66,000

RSI is oversold, so a short bounce is possible. But until BTC reclaims $65,700, sellers are still in control.

Hold $62K = bounce toward $68K
Lose $62K = next stop $58K - $56K

Are you buying this dip or waiting?

#BTC #Bitcoin #Crypto #BTCUSD
·
--
Падение
Jacquelin Harker oOmi:
😘
最近市场跌麻,很多人抄底被套。别急着动手,耐心等机会! 重点事件: ✅ 11.18 英伟达财报 ✅ 11.19 美联储纪要 + Anthropic 上市 ✅ 12.10 美联储议息 利空没落地前大多只是弱反弹,控制仓位留住本金。等靴子全部落地,才有大机会。市场自有周期,别倒在黎明前。#BTCUSD #本周财报与宏观事件密集,市场再迎波动考验
最近市场跌麻,很多人抄底被套。别急着动手,耐心等机会!

重点事件:
✅ 11.18 英伟达财报
✅ 11.19 美联储纪要 + Anthropic 上市
✅ 12.10 美联储议息

利空没落地前大多只是弱反弹,控制仓位留住本金。等靴子全部落地,才有大机会。市场自有周期,别倒在黎明前。#BTCUSD #本周财报与宏观事件密集,市场再迎波动考验
Ula Frances:
这行情抄底像接飞刀,手慢点不丢人。不过日期和 Anthropic 上市消息得再核实,别靴子没等到,先被假日历踹一脚。
·
--
Статья
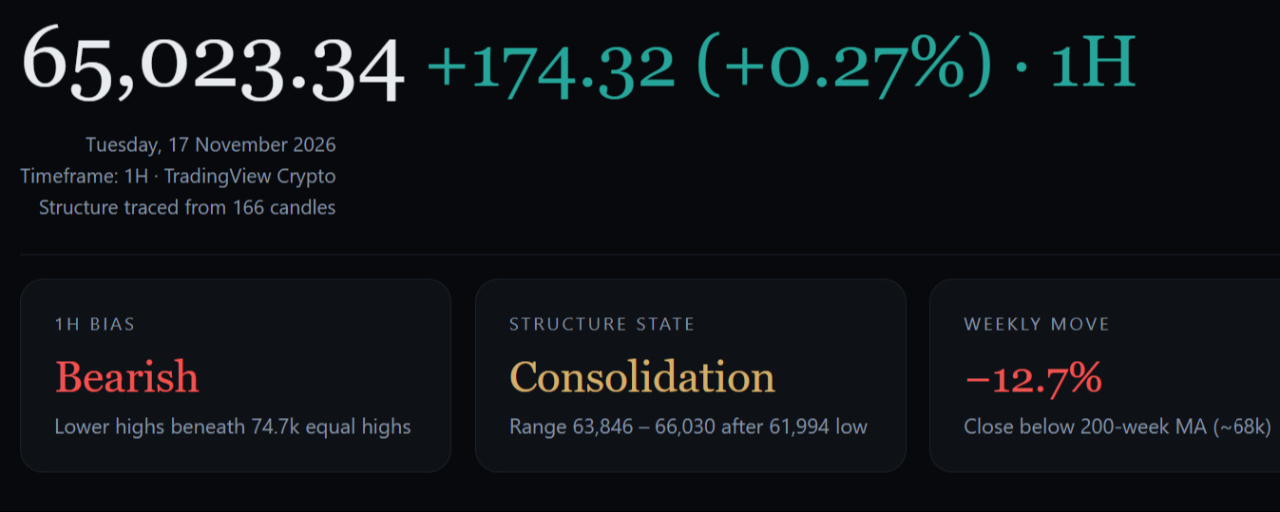
Bitcoin (BTCUSD) Technical and Fundamentals 17 Nov!!I've Made a Sniper Entry Yesterday!!!! Here You go with my technical and fundamental analysis on $BTC {spot}(BTCUSDT) #bitcoin #BTC #BTCUSD #bitcointechnicalAndFundamentalOutlook

Bitcoin (BTCUSD) Technical and Fundamentals 17 Nov!!

I've Made a Sniper Entry Yesterday!!!!
Here You go with my technical and fundamental analysis on $BTC
#bitcoin #BTC #BTCUSD #bitcointechnicalAndFundamentalOutlook
Статья
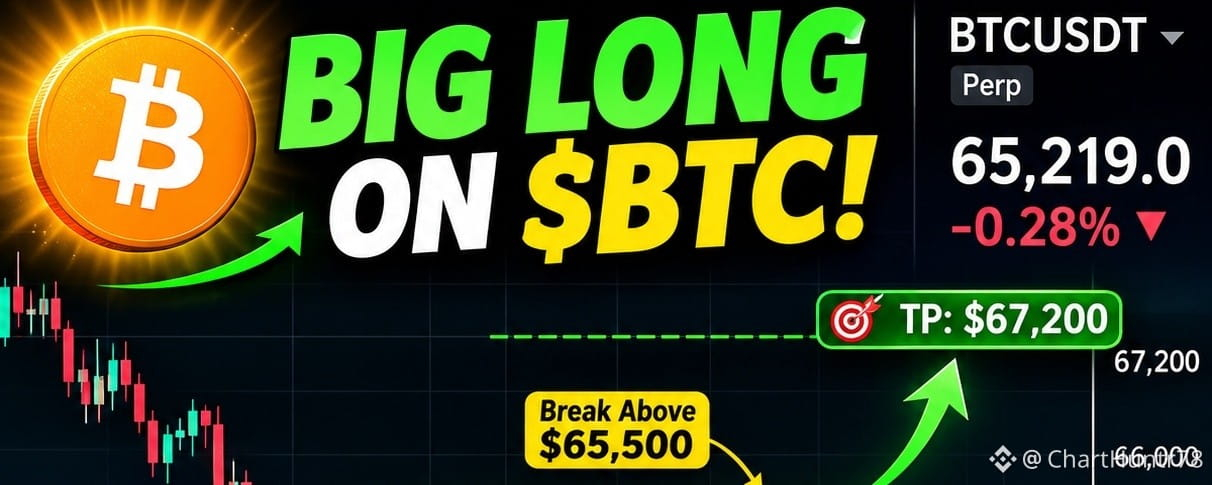
🚨 BTC BULLISH REVERSAL? I'M WATCHING THIS BREAKOUT! 🐂Bitcoin is showing signs of strength after a heavy sell-off $BTC is holding the $64K–$65K range, and buyers are stepping in whenever sellers try to push prices lower. 📊 My BTC Long Setup: - Current Price: $65,219 - Key Resistance: $65,500 - Take Profit: $67,200 - Stop Loss: $63,175 🔥 What I'm Watching: A strong breakout above $65,500 with confirmation could trigger short liquidations and push $BTC toward $67,200. However, rejection at resistance could bring another pullback. Risk management is essential. 💡 My view: I'm cautiously bullish, but I want confirmation before trusting this recovery. TRADERS, WHAT'S YOUR MOVE? 🐂 LONG 🐻 SHORT ⏳ WAIT FOR CONFIRMATION Drop your prediction below! 👇 #bitcoin #BTC走势分析 #BTCUSD T #CryptoTrading #BinanceSquare

🚨 BTC BULLISH REVERSAL? I'M WATCHING THIS BREAKOUT! 🐂

Bitcoin is showing signs of strength after a heavy sell-off
$BTC is holding the $64K–$65K range, and buyers are stepping in whenever sellers try to push prices lower.
📊 My BTC Long Setup:
- Current Price: $65,219
- Key Resistance: $65,500
- Take Profit: $67,200
- Stop Loss: $63,175
🔥 What I'm Watching:
A strong breakout above $65,500 with confirmation could trigger short liquidations and push $BTC toward $67,200.
However, rejection at resistance could bring another pullback. Risk management is essential.
💡 My view: I'm cautiously bullish, but I want confirmation before trusting this recovery.
TRADERS, WHAT'S YOUR MOVE?
🐂 LONG
🐻 SHORT
⏳ WAIT FOR CONFIRMATION
Drop your prediction below! 👇
#bitcoin #BTC走势分析 #BTCUSD T #CryptoTrading #BinanceSquare
Статья
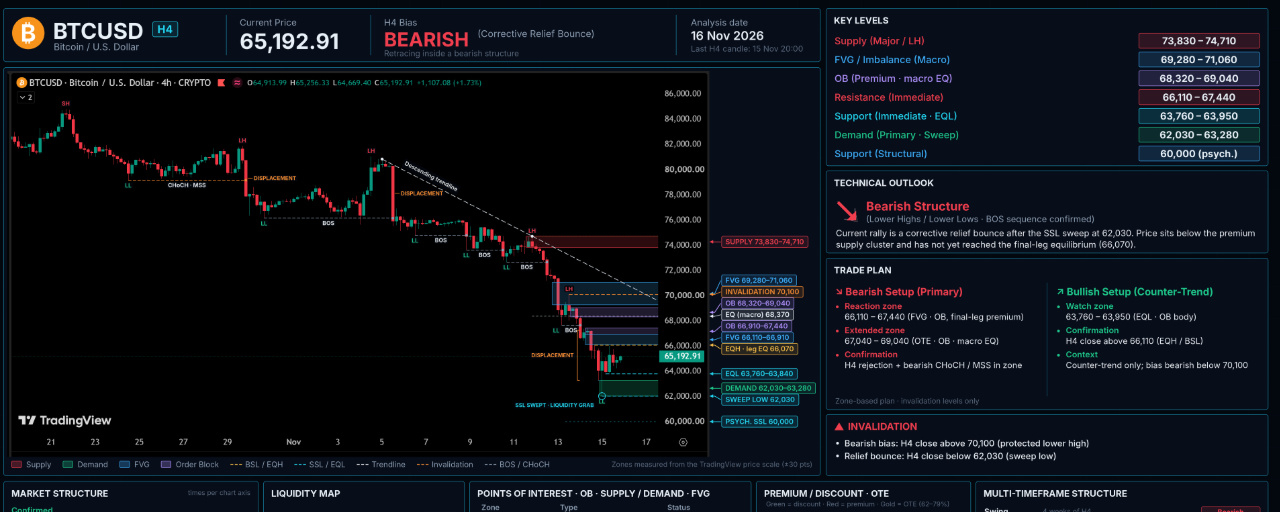
BITCOIN (BTCUSD) SMC Analysis Today!H4 Bias: Bearish Structure State: Confirmed bearish market structure characterized by lower highs and lower lows, with successive bearish breaks of structure and a corrective relief bounce following the sell-side liquidity sweep around 62,030–63,950. Market Structure {spot}(BTCUSDT) $BTC maintains a bearish H4 structure following a prolonged sequence of lower highs and lower lows. The chart confirms multiple bearish breaks of structure, including the significant downside movements through 78,780, 74,790, 73,920 and 72,060. The descending trendline and repeated bearish displacement reinforce the prevailing downside momentum. Price subsequently declined toward the 62,030–63,950 demand region, sweeping the lower liquidity area before producing a corrective recovery toward 65,192.91. Despite the latest rebound, the broader bearish structure remains intact. Price is still trading below the premium supply cluster and has not established a confirmed bullish market structure shift. The immediate outlook favors bearish continuation unless price reclaims the 68,320–69,040 region and establishes sustained acceptance above higher resistance. Key Resistance Immediate Resistance: 66,110–67,440 — nearest overhead resistance and potential bearish reaction region.Bearish FVG: 68,320–70,040 — fair value gap and intermediate supply.Macro FVG: 69,280–71,060 — higher imbalance region.Major Supply: 73,830–74,730 — principal overhead supply and premium resistance.OTE Zone: 67,040–68,960.Premium Equilibrium: 66,070. Key Support Immediate Support: 63,760–63,950 — intermediate support and liquidity reference.Demand Zone: 62,030–63,280 — primary demand and sell-side liquidity region.Structural Support: 60,000 — psychological support and lower structural liquidity. FVG — Fair Value Gap The 68,320–70,040 region represents an important bearish imbalance following the preceding downside displacement. A deeper recovery toward this area may provide an opportunity for sellers to re-enter the market. The higher 69,280–71,060 imbalance represents additional overhead resistance. These regions remain important retracement references while the broader bearish structure remains intact. Order Block (OB) The 68,320–69,040 region represents the principal bearish order block reference within the overhead supply structure. A recovery into this area followed by bearish rejection would strengthen the continuation thesis. The broader 73,830–74,730 supply region remains the major overhead resistance. Liquidity Map Buy-Side Liquidity (BSL): Above 68,320–69,040 and the 73,830–74,730 supply region.Sell-Side Liquidity (SSL): Around 63,760–63,950, with the broader demand region extending toward 62,030.Structural Support: 60,000.Premium Zone: 66,070–71,060.OTE Region: 67,040–68,960. Trade Scenarios Bearish continuation: A corrective recovery toward 66,110–67,440 or the higher 68,320–70,040 bearish imbalance, followed by bearish rejection and a lower-timeframe change of character, would favor renewed downside toward 63,950 and 62,030–63,280. Bullish recovery: A sustained H4 reclaim of 68,320–69,040 would weaken the immediate bearish continuation thesis. A stronger bullish reversal would require a confirmed structural shift above the higher resistance and supply regions. Trendline The descending trendline continues to define the broader bearish trajectory. The latest relief bounce has not invalidated the established sequence of lower highs and lower lows. Invalidation A sustained H4 close above 70,100 would invalidate the immediate bearish continuation setup. The broader bearish bias would require a stronger structural reassessment following a sustained reclaim of the higher supply region. Professional Summary Primary Bias: Bearish.Current Price: 65,192.91.Immediate Resistance: 66,110–67,440.Bearish FVG: 68,320–70,040.Higher FVG: 69,280–71,060.Major Supply: 73,830–74,730.Immediate Support: 63,760–63,950.Primary Demand: 62,030–63,280.Structural Support: 60,000.Bearish Trigger: Rejection from overhead resistance or renewed downside displacement.Invalidation: H4 close above 70,100. Risk Consideration: BTCUSD has already experienced a significant downside move and a corrective recovery following the sell-side liquidity sweep. Avoid chasing shorts near the current price without confirmation of renewed bearish momentum or a favorable retracement into overhead supply. #BTC #BTCUSD #BTC走势分析 #bitcoin

BITCOIN (BTCUSD) SMC Analysis Today!

H4 Bias: Bearish
Structure State: Confirmed bearish market structure characterized by lower highs and lower lows, with successive bearish breaks of structure and a corrective relief bounce following the sell-side liquidity sweep around 62,030–63,950.
Market Structure
$BTC maintains a bearish H4 structure following a prolonged sequence of lower highs and lower lows. The chart confirms multiple bearish breaks of structure, including the significant downside movements through 78,780, 74,790, 73,920 and 72,060.
The descending trendline and repeated bearish displacement reinforce the prevailing downside momentum. Price subsequently declined toward the 62,030–63,950 demand region, sweeping the lower liquidity area before producing a corrective recovery toward 65,192.91.
Despite the latest rebound, the broader bearish structure remains intact. Price is still trading below the premium supply cluster and has not established a confirmed bullish market structure shift. The immediate outlook favors bearish continuation unless price reclaims the 68,320–69,040 region and establishes sustained acceptance above higher resistance.
Key Resistance
Immediate Resistance: 66,110–67,440 — nearest overhead resistance and potential bearish reaction region.Bearish FVG: 68,320–70,040 — fair value gap and intermediate supply.Macro FVG: 69,280–71,060 — higher imbalance region.Major Supply: 73,830–74,730 — principal overhead supply and premium resistance.OTE Zone: 67,040–68,960.Premium Equilibrium: 66,070.
Key Support
Immediate Support: 63,760–63,950 — intermediate support and liquidity reference.Demand Zone: 62,030–63,280 — primary demand and sell-side liquidity region.Structural Support: 60,000 — psychological support and lower structural liquidity.
FVG — Fair Value Gap
The 68,320–70,040 region represents an important bearish imbalance following the preceding downside displacement. A deeper recovery toward this area may provide an opportunity for sellers to re-enter the market.
The higher 69,280–71,060 imbalance represents additional overhead resistance. These regions remain important retracement references while the broader bearish structure remains intact.
Order Block (OB)
The 68,320–69,040 region represents the principal bearish order block reference within the overhead supply structure. A recovery into this area followed by bearish rejection would strengthen the continuation thesis. The broader 73,830–74,730 supply region remains the major overhead resistance.
Liquidity Map
Buy-Side Liquidity (BSL): Above 68,320–69,040 and the 73,830–74,730 supply region.Sell-Side Liquidity (SSL): Around 63,760–63,950, with the broader demand region extending toward 62,030.Structural Support: 60,000.Premium Zone: 66,070–71,060.OTE Region: 67,040–68,960.
Trade Scenarios
Bearish continuation: A corrective recovery toward 66,110–67,440 or the higher 68,320–70,040 bearish imbalance, followed by bearish rejection and a lower-timeframe change of character, would favor renewed downside toward 63,950 and 62,030–63,280.
Bullish recovery: A sustained H4 reclaim of 68,320–69,040 would weaken the immediate bearish continuation thesis. A stronger bullish reversal would require a confirmed structural shift above the higher resistance and supply regions.
Trendline
The descending trendline continues to define the broader bearish trajectory. The latest relief bounce has not invalidated the established sequence of lower highs and lower lows.
Invalidation
A sustained H4 close above 70,100 would invalidate the immediate bearish continuation setup. The broader bearish bias would require a stronger structural reassessment following a sustained reclaim of the higher supply region.
Professional Summary
Primary Bias: Bearish.Current Price: 65,192.91.Immediate Resistance: 66,110–67,440.Bearish FVG: 68,320–70,040.Higher FVG: 69,280–71,060.Major Supply: 73,830–74,730.Immediate Support: 63,760–63,950.Primary Demand: 62,030–63,280.Structural Support: 60,000.Bearish Trigger: Rejection from overhead resistance or renewed downside displacement.Invalidation: H4 close above 70,100.
Risk Consideration: BTCUSD has already experienced a significant downside move and a corrective recovery following the sell-side liquidity sweep. Avoid chasing shorts near the current price without confirmation of renewed bearish momentum or a favorable retracement into overhead supply.
#BTC #BTCUSD #BTC走势分析 #bitcoin

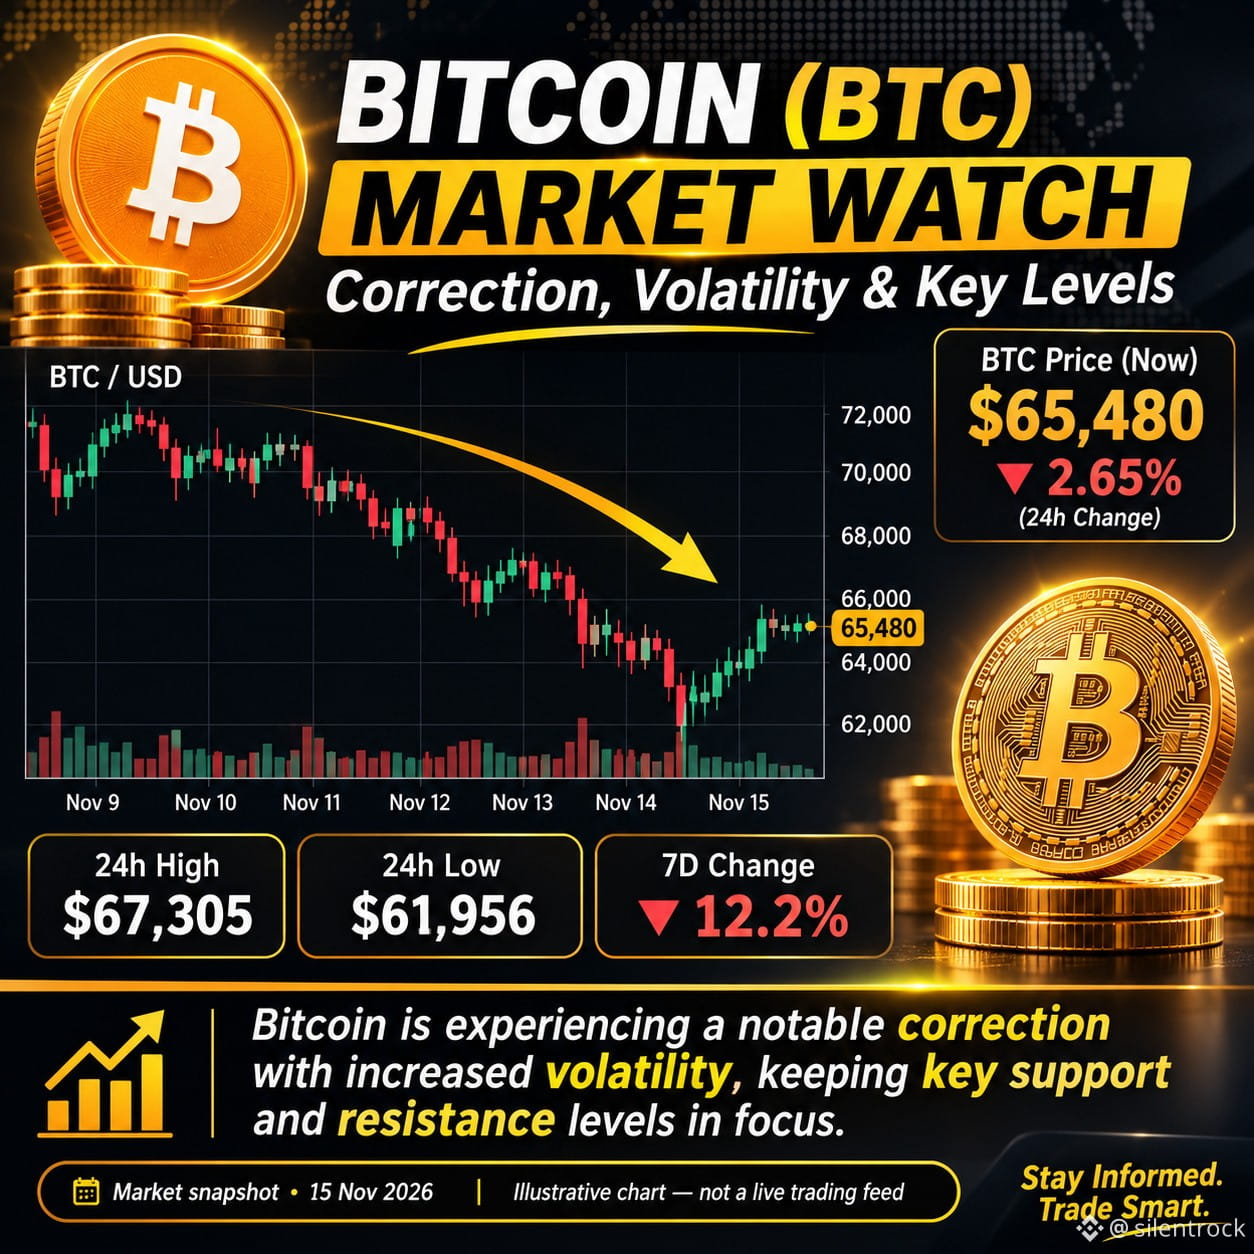
$BITCOIN oin ₿ BITCOIN (BTC) – Market Correction or a New Opportunity? Bitcoin continues to attract attention as the crypto market experiences significant volatility. Currently trading around $65,480, BTC has faced selling pressure, with a decline of approximately 2.65% over the last 24 hours and 12.2% over the past seven days. The recent price movement highlights the importance of monitoring market sentiment, trading volume, support levels, and resistance zones. 📊 Key Market Focus: Bitcoin's next move could be important for the broader crypto market. Traders should watch for confirmation before making any trading decisions. The big question is: Is Bitcoin preparing for a recovery, or could further correction be ahead? What's your view on BTC? Bullish or Bearish? 👀 #Bitcoin #BTC #CryptoMarket #BinanceSquare #BitcoinAnalysis #CryptoTrading #MarketUpdate #BTCUSD #Bitcoin #BTC #BitcoinAnalysis #BTCTrading #BTCUSD #BitcoinPrice #CryptoMarket #BitcoinNews #CryptoTrading #Bullish #Bearish #BinanceSquare #CryptoCommunity
$BITCOIN oin ₿ BITCOIN (BTC) – Market Correction or a New Opportunity?

Bitcoin continues to attract attention as the crypto market experiences significant volatility.

Currently trading around $65,480, BTC has faced selling pressure, with a decline of approximately 2.65% over the last 24 hours and 12.2% over the past seven days.

The recent price movement highlights the importance of monitoring market sentiment, trading volume, support levels, and resistance zones.

📊 Key Market Focus:
Bitcoin's next move could be important for the broader crypto market. Traders should watch for confirmation before making any trading decisions.

The big question is: Is Bitcoin preparing for a recovery, or could further correction be ahead?

What's your view on BTC? Bullish or Bearish? 👀

#Bitcoin #BTC #CryptoMarket #BinanceSquare #BitcoinAnalysis #CryptoTrading #MarketUpdate #BTCUSD
#Bitcoin #BTC #BitcoinAnalysis #BTCTrading #BTCUSD #BitcoinPrice #CryptoMarket #BitcoinNews #CryptoTrading #Bullish #Bearish #BinanceSquare #CryptoCommunity
$BTC BULLISH EXPLOSION INCOMING #BTCUSD Bitcoin is approaching a major HTF Demand Zone with strong Order Block support 🟢 BUY ZONE: 62320 – 59500 🎯 TARGETS: 76K → 80K → 82K Wait for bullish confirmation Like & Follow for more updates #BTC #bitcoin #crypto #SMC
$BTC BULLISH EXPLOSION INCOMING

#BTCUSD

Bitcoin is approaching a major HTF Demand Zone with strong Order Block support

🟢 BUY ZONE: 62320 – 59500

🎯 TARGETS: 76K → 80K → 82K

Wait for bullish confirmation

Like & Follow for more updates

#BTC #bitcoin #crypto #SMC

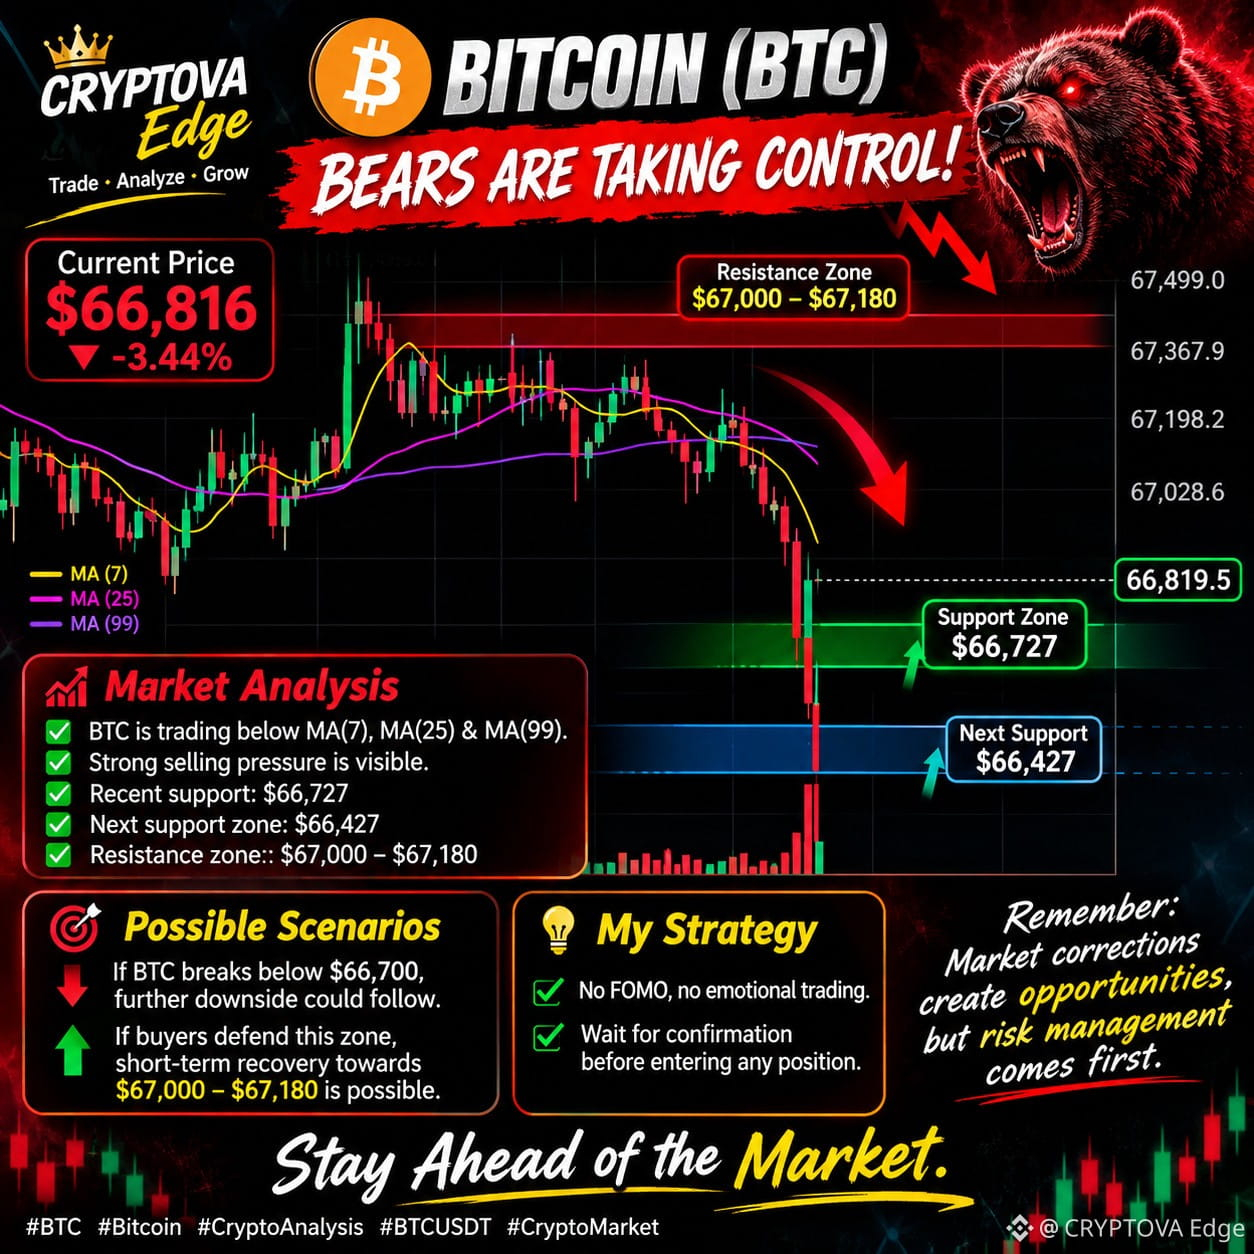
🚨 BITCOIN (BTC) — BEARS ARE TAKING CONTROL! 📉 Bitcoin is currently trading around $66,816, down approximately 3.44%. 🔴 Market Analysis (5M Chart) • BTC is trading below MA(7), MA(25) & MA(99). • Strong selling pressure is visible. • Recent support: $66,727 • Next support zone: $66,427 • Resistance zone: $67,000 – $67,180 📉 Possible Scenarios: If BTC breaks below $66,700, further downside could follow. If buyers defend this zone, a short-term recovery towards $67,000–$67,180 is possible. ⚠️ My Strategy: No FOMO, no emotional trading. Wait for confirmation before entering any position. Remember: Market corrections create opportunities, but risk management comes first. 🔥 CRYPTOVA Edge | Stay Ahead of the Market. #BTC #Bitcoin #CryptoAnalysis #BTCUSD T #CryptoMarket
🚨 BITCOIN (BTC) — BEARS ARE TAKING CONTROL! 📉

Bitcoin is currently trading around $66,816, down approximately 3.44%.

🔴 Market Analysis (5M Chart)

• BTC is trading below MA(7), MA(25) & MA(99). • Strong selling pressure is visible. • Recent support: $66,727 • Next support zone: $66,427 • Resistance zone: $67,000 – $67,180

📉 Possible Scenarios: If BTC breaks below $66,700, further downside could follow.

If buyers defend this zone, a short-term recovery towards $67,000–$67,180 is possible.

⚠️ My Strategy: No FOMO, no emotional trading. Wait for confirmation before entering any position.

Remember: Market corrections create opportunities, but risk management comes first.

🔥 CRYPTOVA Edge | Stay Ahead of the Market.

#BTC #Bitcoin #CryptoAnalysis #BTCUSD T #CryptoMarket
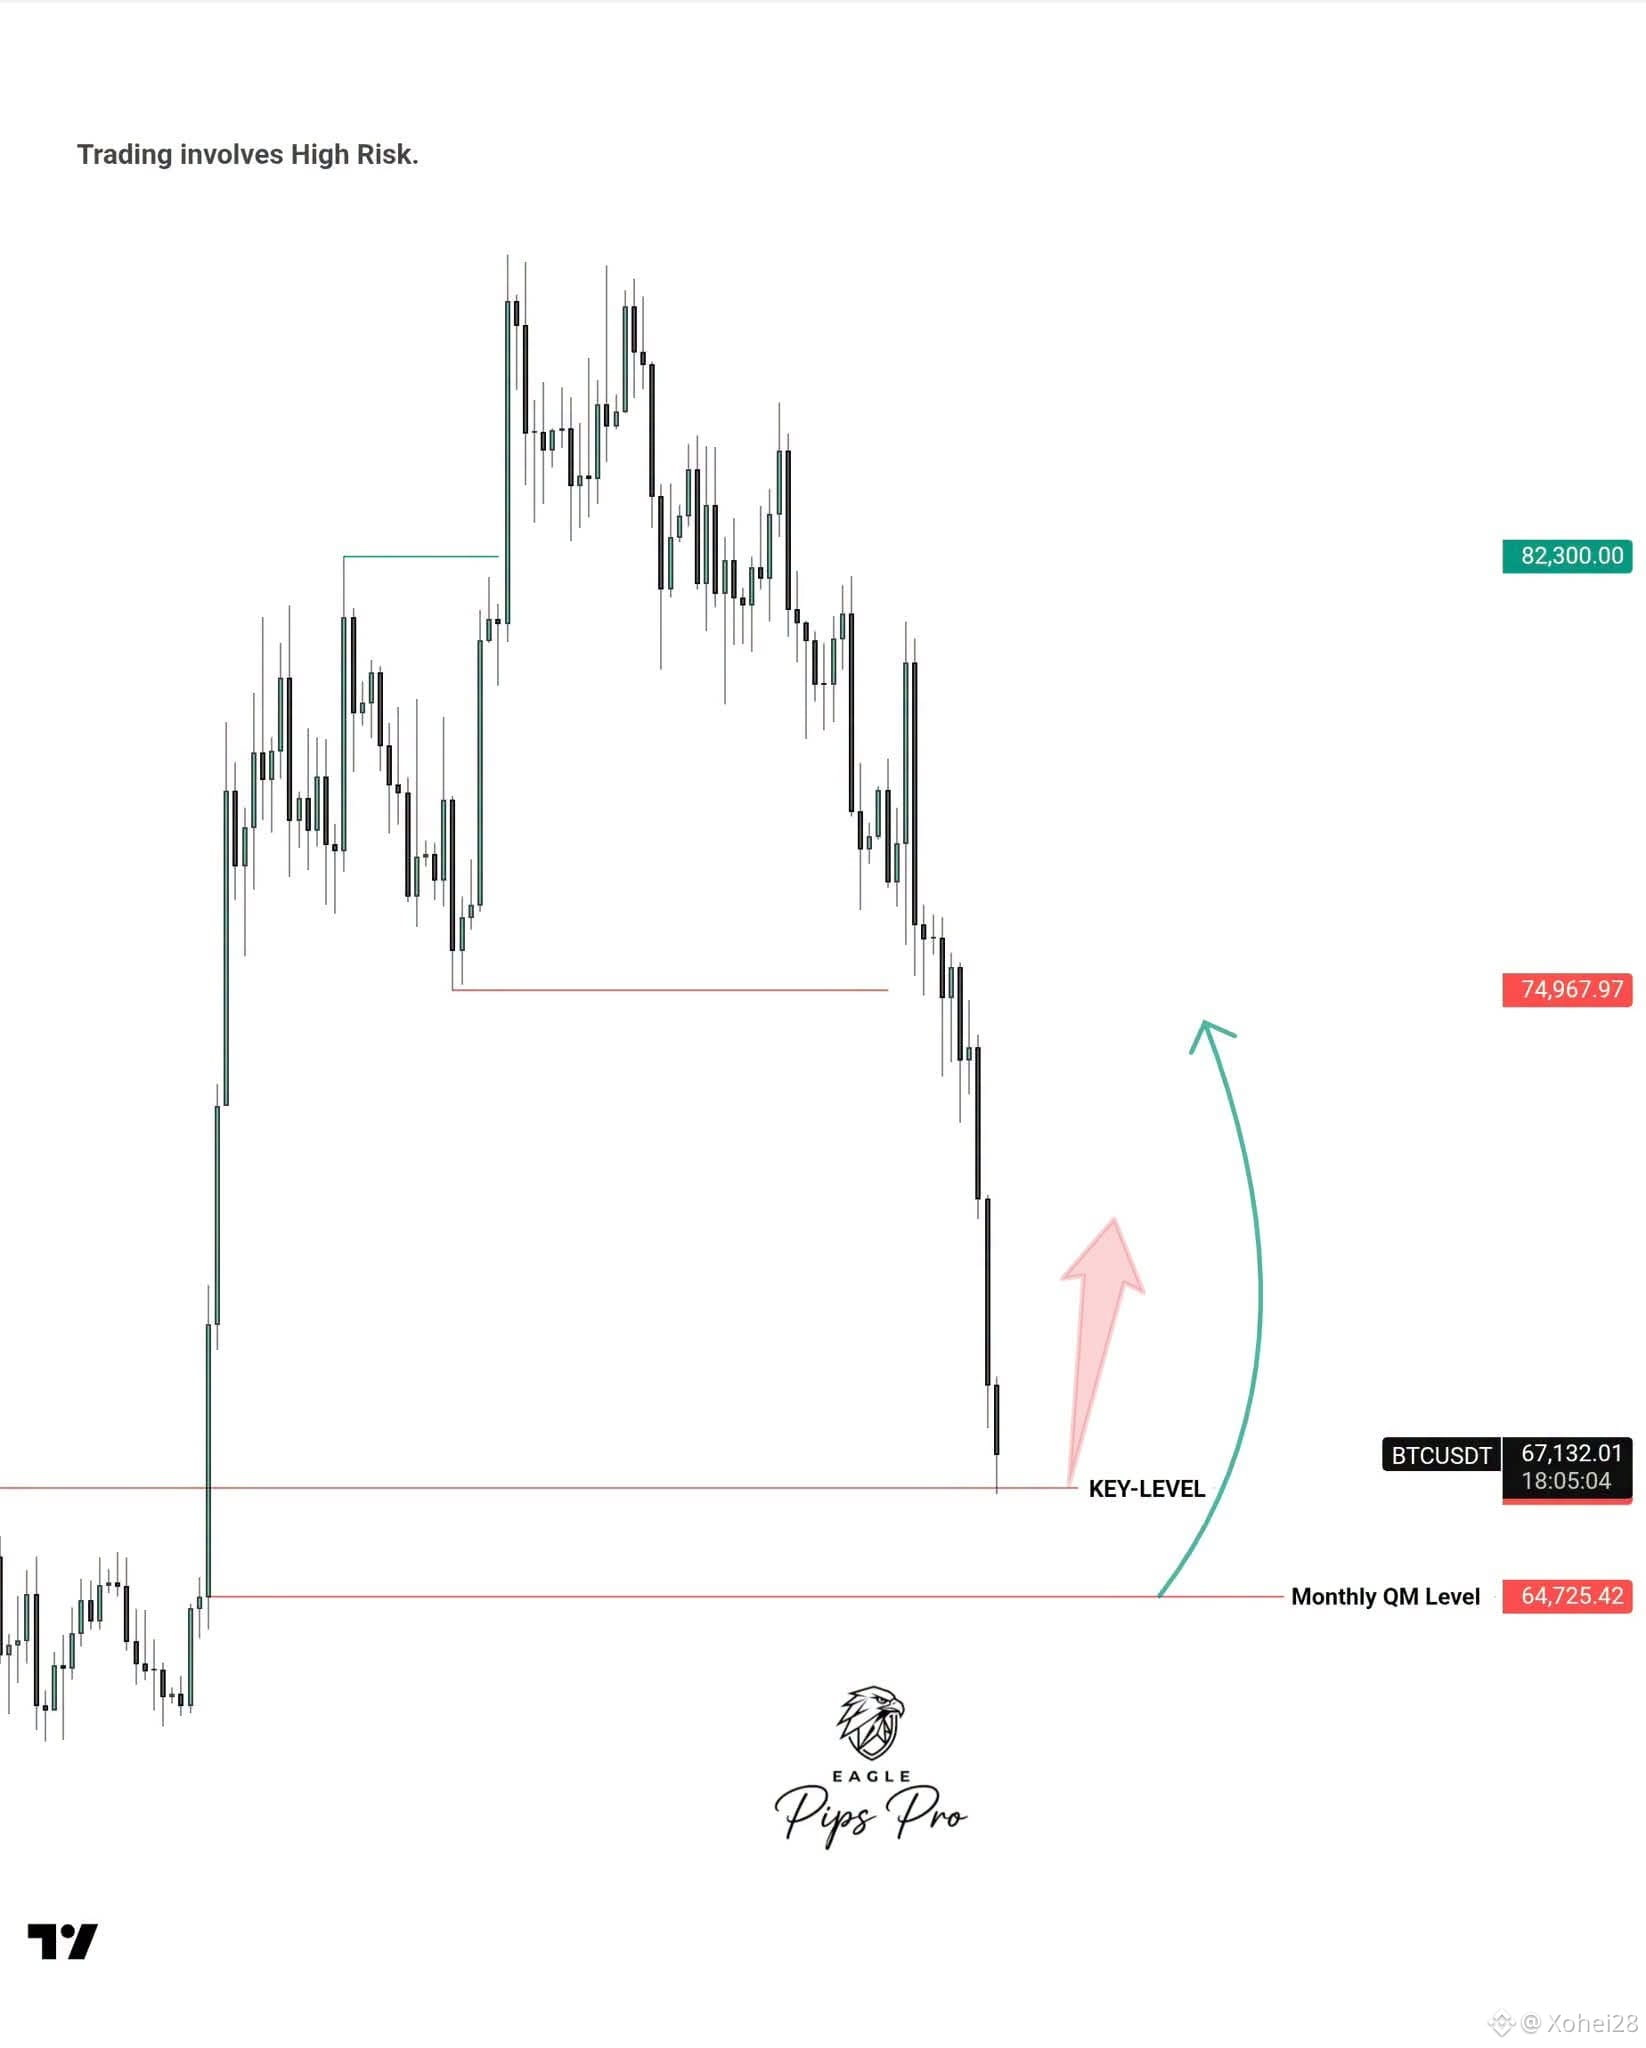
#BTCUSD long-term buy plan Bitcoin dumped straight into the key level just under 65K. I'm starting buys there for the long term. If price drops deeper, the monthly QM level at 64725 is my second entry. Buy 67000 Buy 64725 TP1 74968 | TP2 82300 This is a swing trade, so be patient and size small. Would you buy here or wait for the monthly level? #bitcoin #BTC $BTC
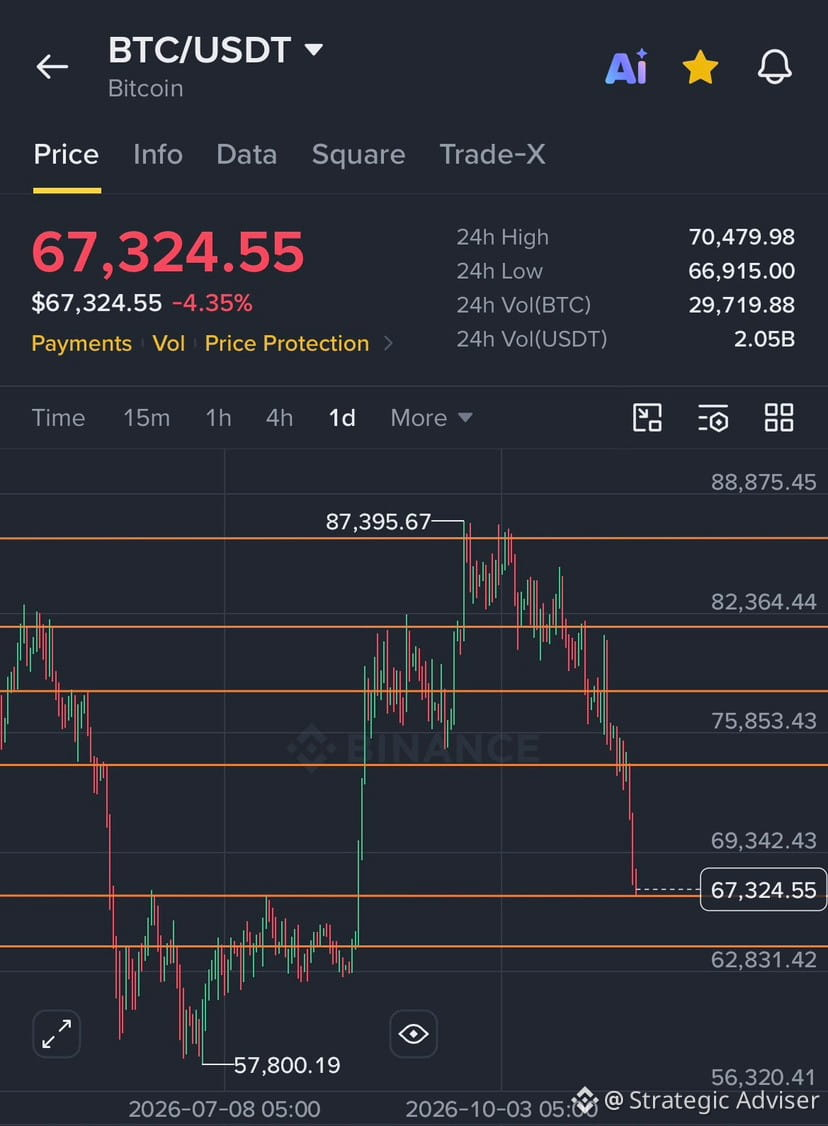
#BTCUSD long-term buy plan

Bitcoin dumped straight into the key level just under 65K. I'm starting buys there for the long term. If price drops deeper, the monthly QM level at 64725 is my second entry.

Buy 67000
Buy 64725
TP1 74968 | TP2 82300

This is a swing trade, so be patient and size small. Would you buy here or wait for the monthly level?

#bitcoin #BTC $BTC
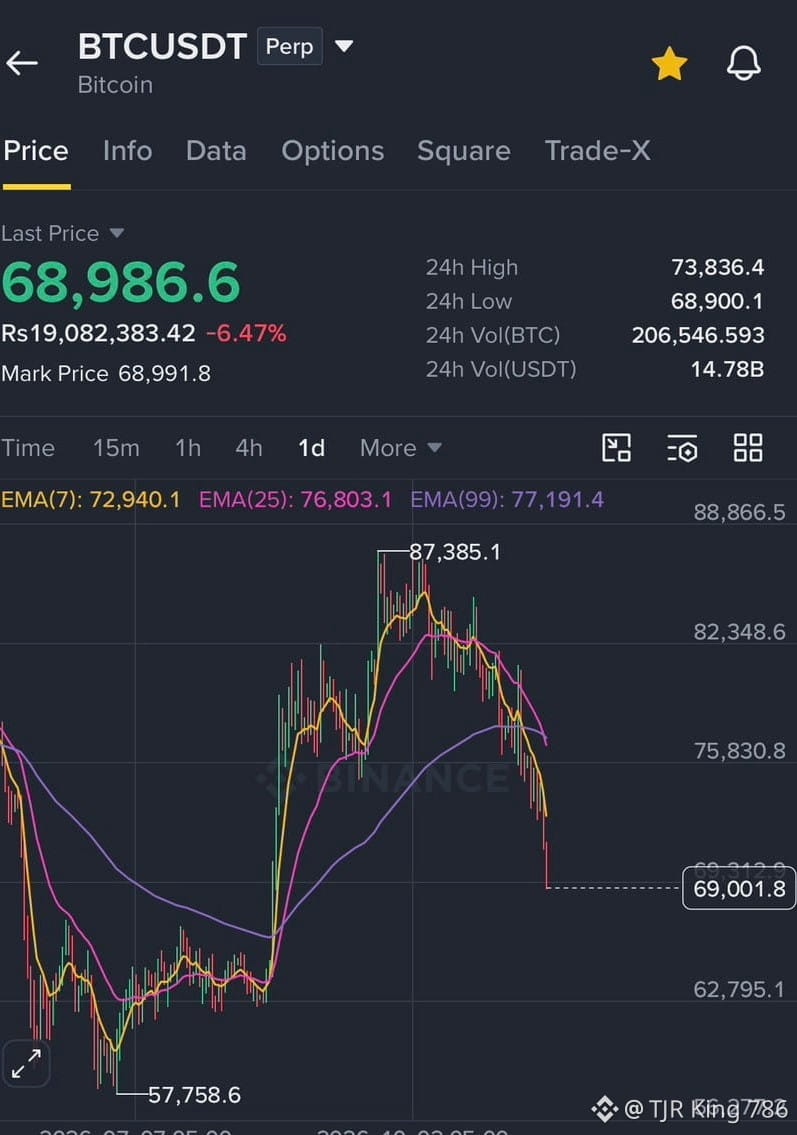
🚨⚠️ تحديث البيتكوين — هبوط محتمل، لكن انتبهوا لسيولة الشورت! 📉💰 ما زلت أتبنى نظرة هبوطية تجاه البيتكوين بسبب استمرار الإشارات السلبية في السوق. لكن هناك أمراً مهماً لا يجب تجاهله: سيولة تصفية صفقات الشورت الكبيرة فوق 74 ألف دولار! 💲💸 📊 أهم مستويات BTC 💰 السعر الحالي: 68,900 دولار 💵 إغلاق أسبوعي مهم: 70,000 دولار 🚀 المقاومة الأولى: 73,300 دولار 🚀 المقاومة الثانية: 75,100 دولار إذا أغلق BTC أسبوعياً فوق 70 ألف دولار، فقد نشهد محاولة صعود نحو مناطق المقاومة قبل احتمال الهبوط مجدداً. ⚠️ السيناريو الهبوطي إذا فقد البيتكوين مستوى 68,900 دولار، فقد يكون الهدف التالي 64,000 دولار، وهي منطقة دعم محتملة ومهمة للتجميع. 💲 وجهة نظري أعتقد أن البيتكوين قد يستهدف أولاً بعض سيولة الشورت فوق السعر الحالي قبل حركة هبوطية أخرى. وقد يساعد ذلك على إعادة توازن السوق. 🤑💰 👀 ماذا تتوقعون؟ هل سيجمع BTC السيولة فوق 74 ألف دولار أم سيكسر 68,900 دولار ويتجه نحو 64 ألف دولار؟ 💬 شاركونا توقعاتكم! #Bitcoin #BTCUSD #CryptoTrading #Cryptocurrency #BitcoinAnalysis #CoinPulse ⚠️ تحليل للسوق وليس نصيحة مالية. أدر مخاطر التداول بحكمة.

🚨⚠️ تحديث البيتكوين — هبوط محتمل، لكن انتبهوا لسيولة الشورت! 📉💰

ما زلت أتبنى نظرة هبوطية تجاه البيتكوين بسبب استمرار الإشارات السلبية في السوق. لكن هناك أمراً مهماً لا يجب تجاهله: سيولة تصفية صفقات الشورت الكبيرة فوق 74 ألف دولار! 💲💸

📊 أهم مستويات BTC

💰 السعر الحالي: 68,900 دولار

💵 إغلاق أسبوعي مهم: 70,000 دولار

🚀 المقاومة الأولى: 73,300 دولار

🚀 المقاومة الثانية: 75,100 دولار

إذا أغلق BTC أسبوعياً فوق 70 ألف دولار، فقد نشهد محاولة صعود نحو مناطق المقاومة قبل احتمال الهبوط مجدداً.

⚠️ السيناريو الهبوطي

إذا فقد البيتكوين مستوى 68,900 دولار، فقد يكون الهدف التالي 64,000 دولار، وهي منطقة دعم محتملة ومهمة للتجميع.

💲 وجهة نظري

أعتقد أن البيتكوين قد يستهدف أولاً بعض سيولة الشورت فوق السعر الحالي قبل حركة هبوطية أخرى. وقد يساعد ذلك على إعادة توازن السوق. 🤑💰

👀 ماذا تتوقعون؟

هل سيجمع BTC السيولة فوق 74 ألف دولار أم سيكسر 68,900 دولار ويتجه نحو 64 ألف دولار؟

💬 شاركونا توقعاتكم!

#Bitcoin #BTCUSD #CryptoTrading #Cryptocurrency #BitcoinAnalysis #CoinPulse
⚠️ تحليل للسوق وليس نصيحة مالية. أدر مخاطر التداول بحكمة.
BITCOIN IS AT A CRITICAL TURNING POINT WHAT COMES NEXT? 🚨⚠️ If you look at Bitcoin’s daily chart, BTC is already down around 30% from $87K and continues to decline. It’s possible that BTC could reach $64K if it fails to hold the $66K area. The last major support zone is between $62K and $64K. Although the PPI data wasn’t bad, the market is still continuously dropping despite that. Many people are now expecting Bitcoin to drop to $20K, $30K, or even $40K. Personally, I think such a massive decline could take time. Anything is possible in this market, but I believe BTC should find support around $62K / $64K and then experience a corrective pump of around 5%–10%. The reason is simple: the market needs to stabilize before another major move. A corrective pump could also create another opportunity to trap traders. From a technical perspective, this scenario makes sense because after such aggressive drops, markets usually experience corrective movements. I’m still bearish myself, but what concerns me is that we haven’t seen a proper corrective move yet. The bigger question is: from which price area will Bitcoin bounce and start liquidating short positions? Another important thing I’m watching is the Bull Market Support Band on the daily and weekly charts. Its position relative to the $62K $64K support zone will be crucial. If Bitcoin approaches this area, I’ll be watching closely to see whether the band acts as resistance or whether BTC can reclaim it and turn it into support. This could help us understand whether the market is preparing for a corrective recovery or another leg down. Anyway, I’m keeping a close eye on every market movement. Anyone who needs personal guidance can let me know. #BTCUSD #USPPIMissMayEaseBTCPressure #cryptocurrency

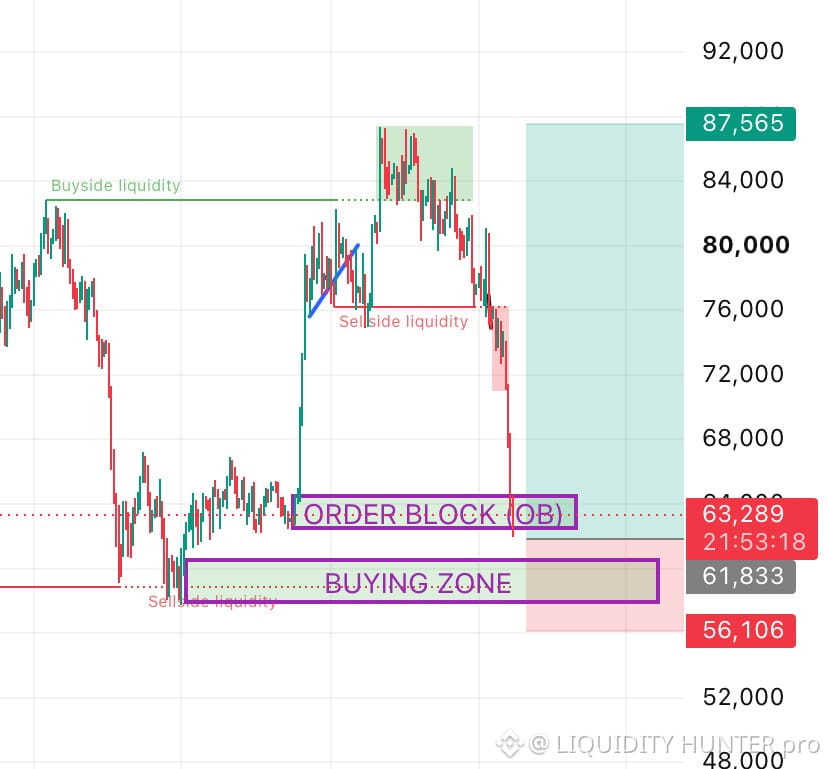
BITCOIN IS AT A CRITICAL TURNING POINT WHAT COMES NEXT? 🚨⚠️

If you look at Bitcoin’s daily chart, BTC is already down around 30% from $87K and continues to decline. It’s possible that BTC could reach $64K if it fails to hold the $66K area. The last major support zone is between $62K and $64K.

Although the PPI data wasn’t bad, the market is still continuously dropping despite that.

Many people are now expecting Bitcoin to drop to $20K, $30K, or even $40K. Personally, I think such a massive decline could take time. Anything is possible in this market, but I believe BTC should find support around $62K / $64K and then experience a corrective pump of around 5%–10%.

The reason is simple: the market needs to stabilize before another major move. A corrective pump could also create another opportunity to trap traders. From a technical perspective, this scenario makes sense because after such aggressive drops, markets usually experience corrective movements.

I’m still bearish myself, but what concerns me is that we haven’t seen a proper corrective move yet. The bigger question is: from which price area will Bitcoin bounce and start liquidating short positions?

Another important thing I’m watching is the Bull Market Support Band on the daily and weekly charts. Its position relative to the $62K $64K support zone will be crucial. If Bitcoin approaches this area, I’ll be watching closely to see whether the band acts as resistance or whether BTC can reclaim it and turn it into support. This could help us understand whether the market is preparing for a corrective recovery or another leg down.

Anyway, I’m keeping a close eye on every market movement. Anyone who needs personal guidance can let me know.

#BTCUSD #USPPIMissMayEaseBTCPressure #cryptocurrency
BTC King BD:
❤️❤️❤️❤️❤️
·
--
Падение
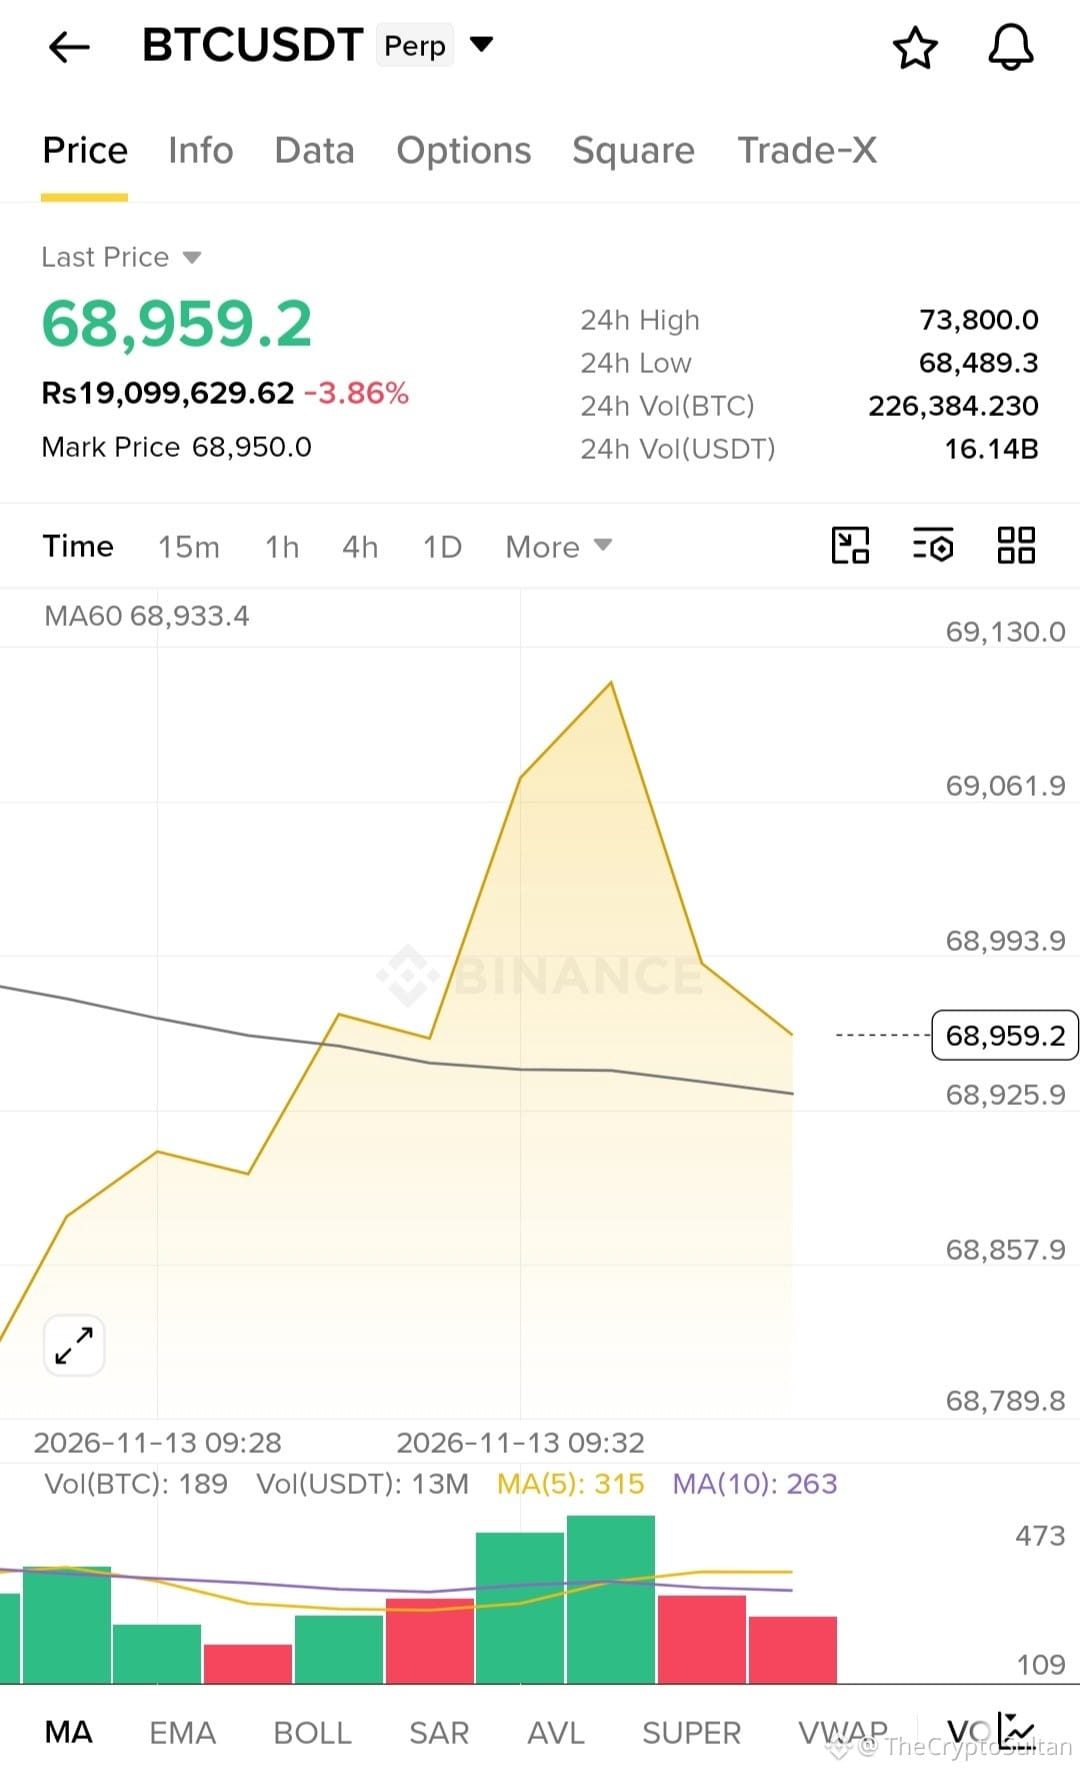
🚨 $BTC MARKET UPDATE | CRITICAL SUPPORT ZONE! 📉📈 Bitcoin is currently trading around $68,959, down approximately 3.86% in the last 24 hours. BTC is testing the important MA60 support near $68,933. Buyers are attempting to defend this level, but market volatility remains high. 📊 Key Levels to Watch: 🟢 Immediate Support: $68,933 🟢 Strong Support: $68,489 🔴 Immediate Resistance: $68,994 🔴 Major Resistance: $69,062–$69,130 🚀 Bullish Scenario: A strong recovery above $69,000 could bring fresh buying momentum. ⚠️ Bearish Scenario: Losing the $68,900 support may trigger another downside move toward $68,489. My Strategy: Watch the support and resistance levels carefully. Wait for confirmation before entering any trade and manage your risk wisely. Stay alert, traders! Smart decisions matter more than emotional trades. DYOR! 🔥 #bitcoin #BTCUSD #cryptotrading
🚨 $BTC MARKET UPDATE | CRITICAL SUPPORT ZONE! 📉📈
Bitcoin is currently trading around $68,959, down approximately 3.86% in the last 24 hours.
BTC is testing the important MA60 support near $68,933. Buyers are attempting to defend this level, but market volatility remains high.
📊 Key Levels to Watch:
🟢 Immediate Support: $68,933
🟢 Strong Support: $68,489
🔴 Immediate Resistance: $68,994
🔴 Major Resistance: $69,062–$69,130
🚀 Bullish Scenario: A strong recovery above $69,000 could bring fresh buying momentum.
⚠️ Bearish Scenario: Losing the $68,900 support may trigger another downside move toward $68,489.
My Strategy: Watch the support and resistance levels carefully. Wait for confirmation before entering any trade and manage your risk wisely.
Stay alert, traders! Smart decisions matter more than emotional trades. DYOR! 🔥
#bitcoin #BTCUSD #cryptotrading
Войдите, чтобы посмотреть больше материала
Присоединяйтесь к пользователям криптовалют по всему миру на Binance Square
⚡️ Получайте новейшую и полезную информацию о криптоактивах.
💬 Нам доверяет крупнейшая в мире криптобиржа.
👍 Получите достоверные аналитические данные от верифицированных создателей контента.
Эл. почта/номер телефона