
#5
5
Просмотров: 242,153
1,431 обсуждают
Популярные
Новые


·
--
122

·
--
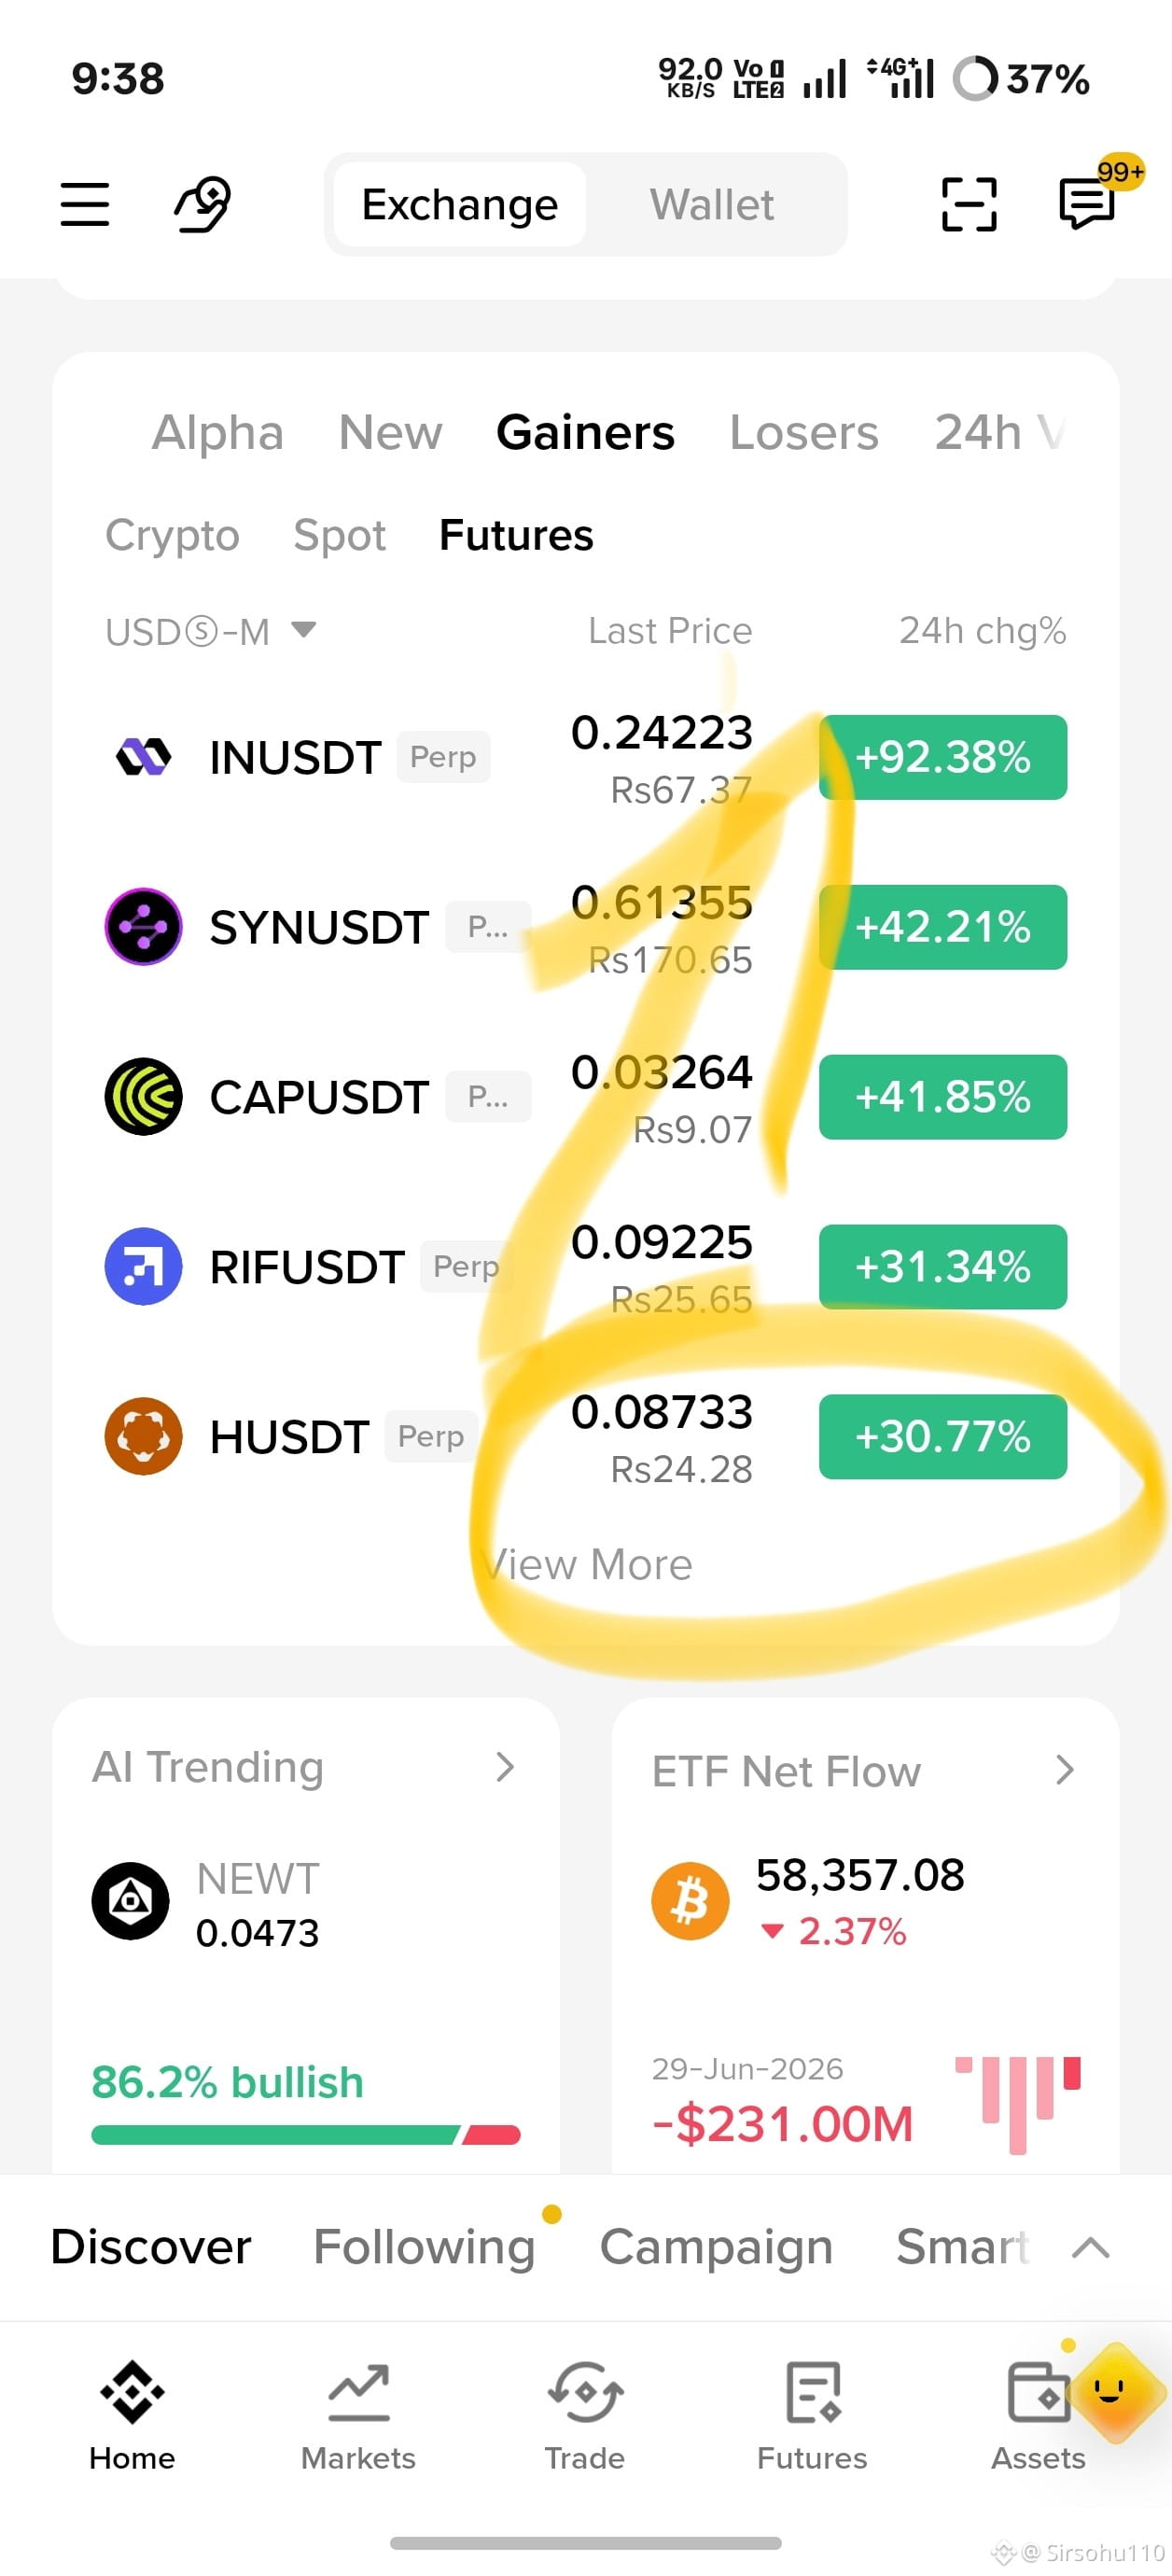
$牛来 Surges Into the Top 5 Trending as Volume Explodes
$牛来 is capturing serious market attention today, claiming the #5 spot on the trending list after a solid 10.45% push. This Chinese-cultural themed token is riding a massive wave of momentum, backed by a staggering 24-hour trading volume of over $353 million. The sheer liquidity moving through this asset suggests heavy institutional and retail interest, pushing its market cap rank up to 254. In a market hungry for fresh narratives, the "bull arrival" theme of $牛来 is clearly resonating with traders looking for high-velocity plays. Keep a close eye on the volume profile here—sustained liquidity is key to keeping this momentum alive.
Follow for more crypto setups.
#DeGenYuv #NiuLai
$牛来 Surges Into the Top 5 Trending as Volume Explodes
$牛来 is capturing serious market attention today, claiming the #5 spot on the trending list after a solid 10.45% push. This Chinese-cultural themed token is riding a massive wave of momentum, backed by a staggering 24-hour trading volume of over $353 million. The sheer liquidity moving through this asset suggests heavy institutional and retail interest, pushing its market cap rank up to 254. In a market hungry for fresh narratives, the "bull arrival" theme of $牛来 is clearly resonating with traders looking for high-velocity plays. Keep a close eye on the volume profile here—sustained liquidity is key to keeping this momentum alive.
Follow for more crypto setups.
#DeGenYuv #NiuLai
$牛来 is capturing serious market attention today, claiming the #5 spot on the trending list after a solid 10.45% push. This Chinese-cultural themed token is riding a massive wave of momentum, backed by a staggering 24-hour trading volume of over $353 million. The sheer liquidity moving through this asset suggests heavy institutional and retail interest, pushing its market cap rank up to 254. In a market hungry for fresh narratives, the "bull arrival" theme of $牛来 is clearly resonating with traders looking for high-velocity plays. Keep a close eye on the volume profile here—sustained liquidity is key to keeping this momentum alive.
Follow for more crypto setups.
#DeGenYuv #NiuLai

203
·
--
$牛来 Surges Into the Top 5 Trending Coins
$牛来 is making massive waves today, climbing to the #5 spot on the trending list after booking a solid 10.45% gain. The market is paying close attention, and for good reason—24-hour trading volume has absolutely exploded to over $353 million, signaling intense liquidity and massive interest from active traders. Sitting at a market cap rank of 254, this momentum suggests that $牛来 is rapidly transitioning from a niche favorite into a highly liquid market mover. The sheer volume spike indicates strong accumulation and high-velocity trading. Keep a close eye on this one as the market continues to fuel its current breakout structure.
Follow for daily crypto updates.
#DeGenYuv #NiuLai
$牛来 Surges Into the Top 5 Trending Coins
$牛来 is making massive waves today, climbing to the #5 spot on the trending list after booking a solid 10.45% gain. The market is paying close attention, and for good reason—24-hour trading volume has absolutely exploded to over $353 million, signaling intense liquidity and massive interest from active traders. Sitting at a market cap rank of 254, this momentum suggests that $牛来 is rapidly transitioning from a niche favorite into a highly liquid market mover. The sheer volume spike indicates strong accumulation and high-velocity trading. Keep a close eye on this one as the market continues to fuel its current breakout structure.
Follow for daily crypto updates.
#DeGenYuv #NiuLai
$牛来 is making massive waves today, climbing to the #5 spot on the trending list after booking a solid 10.45% gain. The market is paying close attention, and for good reason—24-hour trading volume has absolutely exploded to over $353 million, signaling intense liquidity and massive interest from active traders. Sitting at a market cap rank of 254, this momentum suggests that $牛来 is rapidly transitioning from a niche favorite into a highly liquid market mover. The sheer volume spike indicates strong accumulation and high-velocity trading. Keep a close eye on this one as the market continues to fuel its current breakout structure.
Follow for daily crypto updates.
#DeGenYuv #NiuLai

230
·
--
$牛来 Surges Into the Top 5 Trending Spotlights
$牛来 is capturing major market attention today, locking in the #5 trending spot with a solid 10.45% gain over the last 24 hours. The token is currently trading at $0.10683, backed by a massive $353.6M trading volume. This explosive liquidity spike indicates heavy institutional and retail participation. As a cultural narrative play, $牛来 (meaning "the bull run is coming") is perfectly aligned with the broader market's bullish sentiment. With its market cap ranking climbing to #254, momentum is rapidly building. Traders are closely watching this volume surge to see if the token can sustain its upward trajectory and lead the next wave of meme-driven momentum.
Follow for more crypto setups.
#DeGenYuv #NiuLai
$牛来 Surges Into the Top 5 Trending Spotlights
$牛来 is capturing major market attention today, locking in the #5 trending spot with a solid 10.45% gain over the last 24 hours. The token is currently trading at $0.10683, backed by a massive $353.6M trading volume. This explosive liquidity spike indicates heavy institutional and retail participation. As a cultural narrative play, $牛来 (meaning "the bull run is coming") is perfectly aligned with the broader market's bullish sentiment. With its market cap ranking climbing to #254, momentum is rapidly building. Traders are closely watching this volume surge to see if the token can sustain its upward trajectory and lead the next wave of meme-driven momentum.
Follow for more crypto setups.
#DeGenYuv #NiuLai
$牛来 is capturing major market attention today, locking in the #5 trending spot with a solid 10.45% gain over the last 24 hours. The token is currently trading at $0.10683, backed by a massive $353.6M trading volume. This explosive liquidity spike indicates heavy institutional and retail participation. As a cultural narrative play, $牛来 (meaning "the bull run is coming") is perfectly aligned with the broader market's bullish sentiment. With its market cap ranking climbing to #254, momentum is rapidly building. Traders are closely watching this volume surge to see if the token can sustain its upward trajectory and lead the next wave of meme-driven momentum.
Follow for more crypto setups.
#DeGenYuv #NiuLai
173

Проверено
Hai thông báo của Binance ngày 02 và 03/11 trả lời hai câu hỏi khác nhau, đừng gộp làm một.
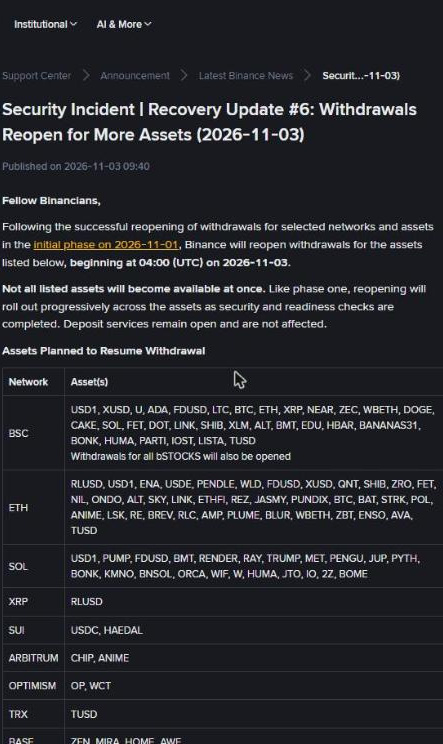
Thông báo #6 sáng 03/11 mở lại rút tiền cho thêm nhiều tài sản từ 04:00 UTC, tức 11:00 giờ VN, mở dần theo từng tài sản. NEAR trong danh sách là NEAR trên mạng BSC, không phải mạng NEAR gốc.
Thông báo #5 ngày 02/11 là tin về bằng chứng: bằng chứng zero-knowledge cho ảnh chụp dự trữ lúc 31/10 00:00 UTC đã xong. Người giữ một trong 10 token BTC, ETH, USDT, BNB, SOL, USDC, XRP, USD1, RLUSD, ZEC tự kiểm được số dư có bảo chứng tối thiểu 1:1.
Giới hạn: bằng chứng chỉ nói về ảnh chụp 31/10 và 10 token đó, không bao phủ token ngoài top 10 hay dòng tiền sau 31/10. Ảnh chụp kế tiếp dự kiến 04/11, tạo bằng chứng ước 40 đến 50 giờ.
Anh em thấy phần gỡ rối này hữu ích thì thả tim cho mình có động lực viết tiếp.
#Binance #ProofOfReserves $BTC $BNB
Hai thông báo của Binance ngày 02 và 03/11 trả lời hai câu hỏi khác nhau, đừng gộp làm một.
Thông báo #6 sáng 03/11 mở lại rút tiền cho thêm nhiều tài sản từ 04:00 UTC, tức 11:00 giờ VN, mở dần theo từng tài sản. NEAR trong danh sách là NEAR trên mạng BSC, không phải mạng NEAR gốc.
Thông báo #5 ngày 02/11 là tin về bằng chứng: bằng chứng zero-knowledge cho ảnh chụp dự trữ lúc 31/10 00:00 UTC đã xong. Người giữ một trong 10 token BTC, ETH, USDT, BNB, SOL, USDC, XRP, USD1, RLUSD, ZEC tự kiểm được số dư có bảo chứng tối thiểu 1:1.
Giới hạn: bằng chứng chỉ nói về ảnh chụp 31/10 và 10 token đó, không bao phủ token ngoài top 10 hay dòng tiền sau 31/10. Ảnh chụp kế tiếp dự kiến 04/11, tạo bằng chứng ước 40 đến 50 giờ.
Anh em thấy phần gỡ rối này hữu ích thì thả tim cho mình có động lực viết tiếp.
#Binance #ProofOfReserves $BTC $BNB
Thông báo #6 sáng 03/11 mở lại rút tiền cho thêm nhiều tài sản từ 04:00 UTC, tức 11:00 giờ VN, mở dần theo từng tài sản. NEAR trong danh sách là NEAR trên mạng BSC, không phải mạng NEAR gốc.
Thông báo #5 ngày 02/11 là tin về bằng chứng: bằng chứng zero-knowledge cho ảnh chụp dự trữ lúc 31/10 00:00 UTC đã xong. Người giữ một trong 10 token BTC, ETH, USDT, BNB, SOL, USDC, XRP, USD1, RLUSD, ZEC tự kiểm được số dư có bảo chứng tối thiểu 1:1.
Giới hạn: bằng chứng chỉ nói về ảnh chụp 31/10 và 10 token đó, không bao phủ token ngoài top 10 hay dòng tiền sau 31/10. Ảnh chụp kế tiếp dự kiến 04/11, tạo bằng chứng ước 40 đến 50 giờ.
Anh em thấy phần gỡ rối này hữu ích thì thả tim cho mình có động lực viết tiếp.
#Binance #ProofOfReserves $BTC $BNB
1.2k

·
--
Проверено
被偷走 63 亿之后,币安交出的第一份“成绩单”不是道歉信,是一道你能自己验算的题。
【新确认的】
· 官方 11 月 2 日恢复进展公告 #5:10 月 31 日 08:00(北京时间)那轮储备金快照的零知识证明已经生成,原估计要等到 11 月 3 日。BTC、ETH、USDT、BNB、SOL、USDC、XRP、USD1、RLUSD、ZEC 十大币种,官方称均已获得 100% 足额储备支持,持有这些币的人现在就能在储备证明页面独立验证自己的余额有没有被算进去。
· 补仓进度约 95%(11 月 1 日官方数字,11 月 2 日未再更新)。剩下约 5% 是十大之外的低流动性代币,还在继续买入补足。
· 提币第一阶段的官方账也出了:11 月 1 日 14:00–23:30(北京时间),共处理提现 46.49 亿美元、充值 10.1 亿美元,净流出约 36.4 亿美元,官方称相当于其 1,710 亿美元资产管理规模的 2.1%。
【还没解决的】
· 这份证明只覆盖十大币种。上一轮 10 月 1 日的储备快照覆盖过 55 个币种,其余币种要等 11 月 4 日的新一轮快照,证明还要再计算约 40–50 小时。
· 11 月 3 日会再恢复一批提币网络和资产,但截至北京时间 11 月 3 日凌晨,官方还没公布具体名单和开放时间,任何“内部名单”都别信。
· 第三方按链上钱包追踪的口径里,提币恢复后单日流出超过 60 亿美元(CoinDesk 报道),那是全天链上口径,和上面官方第一阶段窗口的账不是一回事,两个数字别混着喊。
· 还有一件事正在发生:现在广场热门话题排第一位的是“提币诈骗警告”。恢复期最活跃的不只是行情,还有骗子——任何私信你的“客服”“紧急提币通道”都是钓鱼,只认官方公告渠道。
【我的看法】
能验算,比喊话强。但验证的正确用法是真去验一次自己的余额,而不是看别人说“已经通过”。也提醒一句行情:截至北京时间 11 月 3 日凌晨,$BTC 约 77,070 美元、24 小时跌约 1.4%,$BNB 约 699 美元、跌约 1.8%(币安现货真实行情,当日 K 线未收盘)。事件在往回收,市场还没翻篇。
最后问一句:这份能自查的证明出来后,你会真的去验一次自己的余额,还是继续等 11 月 4 日那份覆盖更多币种的快照?
$BTC $BNB
—— 来源:币安官方恢复进展公告 #5(2026-11-02)与币安官方广场帖、crypto.news、CoinDesk;行情来自币安现货公开接口,抓取于北京时间 2026-11-03 01:33,为未收盘数据。事件仍在发展中,状态以官方公告为准。
被偷走 63 亿之后,币安交出的第一份“成绩单”不是道歉信,是一道你能自己验算的题。
【新确认的】
· 官方 11 月 2 日恢复进展公告 #5:10 月 31 日 08:00(北京时间)那轮储备金快照的零知识证明已经生成,原估计要等到 11 月 3 日。BTC、ETH、USDT、BNB、SOL、USDC、XRP、USD1、RLUSD、ZEC 十大币种,官方称均已获得 100% 足额储备支持,持有这些币的人现在就能在储备证明页面独立验证自己的余额有没有被算进去。
· 补仓进度约 95%(11 月 1 日官方数字,11 月 2 日未再更新)。剩下约 5% 是十大之外的低流动性代币,还在继续买入补足。
· 提币第一阶段的官方账也出了:11 月 1 日 14:00–23:30(北京时间),共处理提现 46.49 亿美元、充值 10.1 亿美元,净流出约 36.4 亿美元,官方称相当于其 1,710 亿美元资产管理规模的 2.1%。
【还没解决的】
· 这份证明只覆盖十大币种。上一轮 10 月 1 日的储备快照覆盖过 55 个币种,其余币种要等 11 月 4 日的新一轮快照,证明还要再计算约 40–50 小时。
· 11 月 3 日会再恢复一批提币网络和资产,但截至北京时间 11 月 3 日凌晨,官方还没公布具体名单和开放时间,任何“内部名单”都别信。
· 第三方按链上钱包追踪的口径里,提币恢复后单日流出超过 60 亿美元(CoinDesk 报道),那是全天链上口径,和上面官方第一阶段窗口的账不是一回事,两个数字别混着喊。
· 还有一件事正在发生:现在广场热门话题排第一位的是“提币诈骗警告”。恢复期最活跃的不只是行情,还有骗子——任何私信你的“客服”“紧急提币通道”都是钓鱼,只认官方公告渠道。
【我的看法】
能验算,比喊话强。但验证的正确用法是真去验一次自己的余额,而不是看别人说“已经通过”。也提醒一句行情:截至北京时间 11 月 3 日凌晨,$BTC 约 77,070 美元、24 小时跌约 1.4%,$BNB 约 699 美元、跌约 1.8%(币安现货真实行情,当日 K 线未收盘)。事件在往回收,市场还没翻篇。
最后问一句:这份能自查的证明出来后,你会真的去验一次自己的余额,还是继续等 11 月 4 日那份覆盖更多币种的快照?
$BTC $BNB
—— 来源:币安官方恢复进展公告 #5(2026-11-02)与币安官方广场帖、crypto.news、CoinDesk;行情来自币安现货公开接口,抓取于北京时间 2026-11-03 01:33,为未收盘数据。事件仍在发展中,状态以官方公告为准。
【新确认的】
· 官方 11 月 2 日恢复进展公告 #5:10 月 31 日 08:00(北京时间)那轮储备金快照的零知识证明已经生成,原估计要等到 11 月 3 日。BTC、ETH、USDT、BNB、SOL、USDC、XRP、USD1、RLUSD、ZEC 十大币种,官方称均已获得 100% 足额储备支持,持有这些币的人现在就能在储备证明页面独立验证自己的余额有没有被算进去。
· 补仓进度约 95%(11 月 1 日官方数字,11 月 2 日未再更新)。剩下约 5% 是十大之外的低流动性代币,还在继续买入补足。
· 提币第一阶段的官方账也出了:11 月 1 日 14:00–23:30(北京时间),共处理提现 46.49 亿美元、充值 10.1 亿美元,净流出约 36.4 亿美元,官方称相当于其 1,710 亿美元资产管理规模的 2.1%。
【还没解决的】
· 这份证明只覆盖十大币种。上一轮 10 月 1 日的储备快照覆盖过 55 个币种,其余币种要等 11 月 4 日的新一轮快照,证明还要再计算约 40–50 小时。
· 11 月 3 日会再恢复一批提币网络和资产,但截至北京时间 11 月 3 日凌晨,官方还没公布具体名单和开放时间,任何“内部名单”都别信。
· 第三方按链上钱包追踪的口径里,提币恢复后单日流出超过 60 亿美元(CoinDesk 报道),那是全天链上口径,和上面官方第一阶段窗口的账不是一回事,两个数字别混着喊。
· 还有一件事正在发生:现在广场热门话题排第一位的是“提币诈骗警告”。恢复期最活跃的不只是行情,还有骗子——任何私信你的“客服”“紧急提币通道”都是钓鱼,只认官方公告渠道。
【我的看法】
能验算,比喊话强。但验证的正确用法是真去验一次自己的余额,而不是看别人说“已经通过”。也提醒一句行情:截至北京时间 11 月 3 日凌晨,$BTC 约 77,070 美元、24 小时跌约 1.4%,$BNB 约 699 美元、跌约 1.8%(币安现货真实行情,当日 K 线未收盘)。事件在往回收,市场还没翻篇。
最后问一句:这份能自查的证明出来后,你会真的去验一次自己的余额,还是继续等 11 月 4 日那份覆盖更多币种的快照?
$BTC $BNB
—— 来源:币安官方恢复进展公告 #5(2026-11-02)与币安官方广场帖、crypto.news、CoinDesk;行情来自币安现货公开接口,抓取于北京时间 2026-11-03 01:33,为未收盘数据。事件仍在发展中,状态以官方公告为准。
1
1.8k

·
--
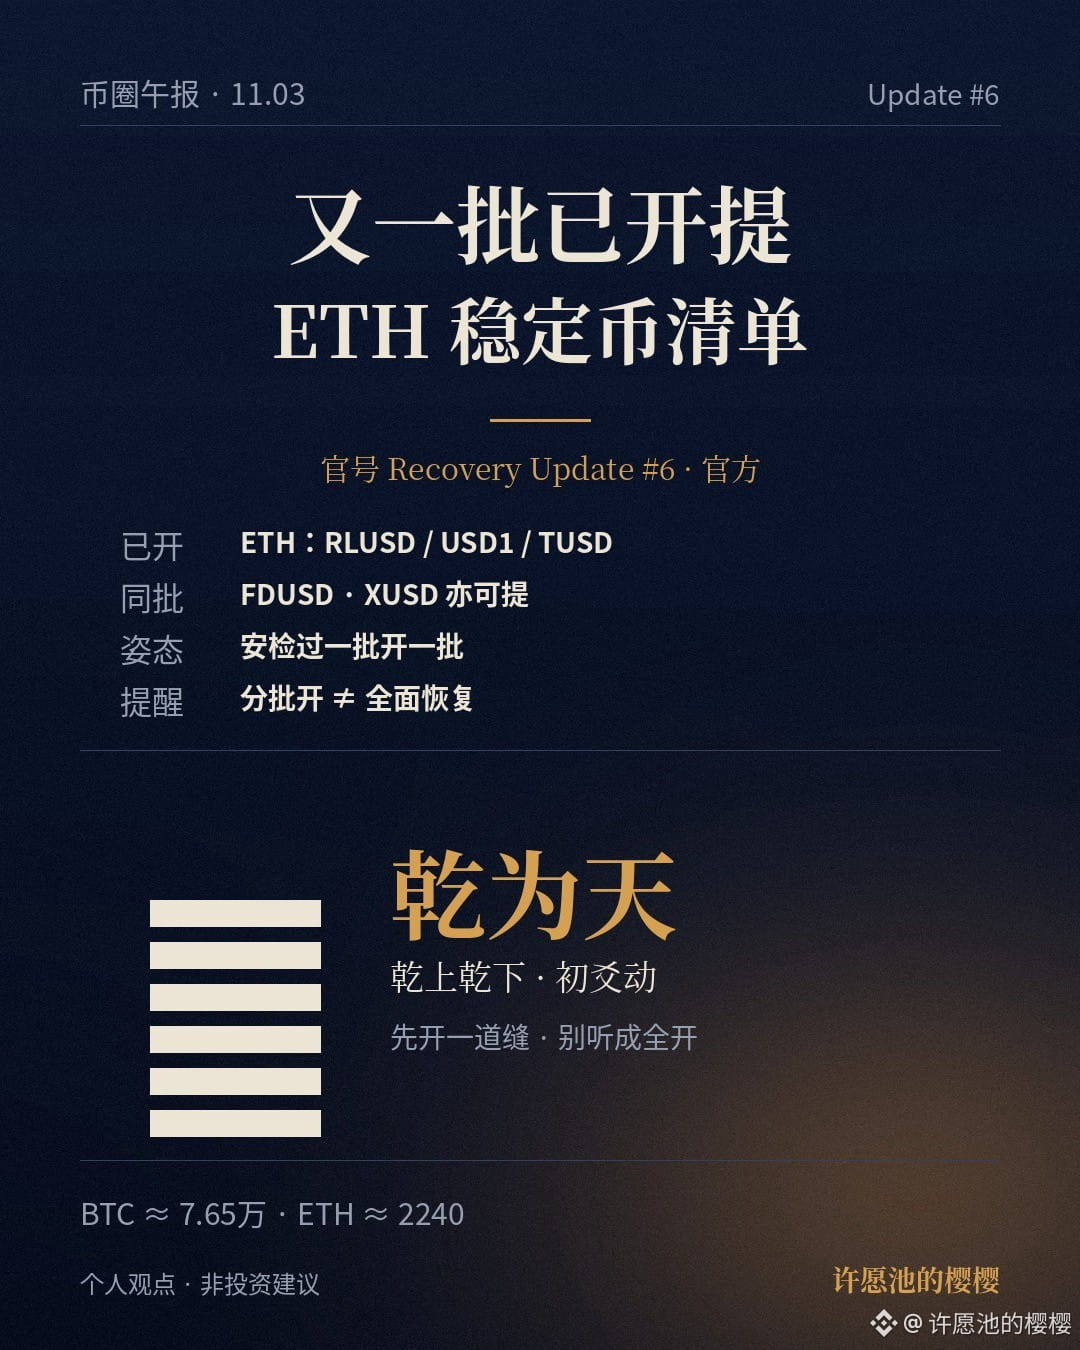
币安官号刚落地 Recovery Update #6(官方),随后又发了 Withdrawal Update:又一批资产开提了。已确认 ETH 网上 RLUSD、USD1、TUSD、FDUSD、XUSD 可以提——别听成「全站提现盖章收工」,官号写的是安检过一批开一批,后面还要分阶段继续放。
今早那篇 Update #5 讲的是 PoR 能自己验、提现「计划渐进」;这会儿是真的又开出一批稳定币提现。充值那边官号说不受影响。排队高峰可能慢一点,提不出去就稍后再试——以你提现页实际能选的网络为准。
大饼现价大约 7.65 万,ETH 2240 附近。
未时起卦乾为天:乾上乾下,初爻动。乾卦人话是「纯阳往前推」,但动在初爻——像开门先开一道缝,别当成整扇门已敞开。我更倾向大概率先看两件事:你提现页 ETH 那几只稳定币能不能选上;下一波官宣还开哪些网络。分批开提 ≠ 全面恢复。
你账户里更急着提哪一只:RLUSD / USD1 / TUSD / FDUSD / XUSD?评论区说说。
关注我看后续。
$BTC $ETH
个人观点,非投资建议
币安官号刚落地 Recovery Update #6(官方),随后又发了 Withdrawal Update:又一批资产开提了。已确认 ETH 网上 RLUSD、USD1、TUSD、FDUSD、XUSD 可以提——别听成「全站提现盖章收工」,官号写的是安检过一批开一批,后面还要分阶段继续放。
今早那篇 Update #5 讲的是 PoR 能自己验、提现「计划渐进」;这会儿是真的又开出一批稳定币提现。充值那边官号说不受影响。排队高峰可能慢一点,提不出去就稍后再试——以你提现页实际能选的网络为准。
大饼现价大约 7.65 万,ETH 2240 附近。
未时起卦乾为天:乾上乾下,初爻动。乾卦人话是「纯阳往前推」,但动在初爻——像开门先开一道缝,别当成整扇门已敞开。我更倾向大概率先看两件事:你提现页 ETH 那几只稳定币能不能选上;下一波官宣还开哪些网络。分批开提 ≠ 全面恢复。
你账户里更急着提哪一只:RLUSD / USD1 / TUSD / FDUSD / XUSD?评论区说说。
关注我看后续。
$BTC $ETH
个人观点,非投资建议
今早那篇 Update #5 讲的是 PoR 能自己验、提现「计划渐进」;这会儿是真的又开出一批稳定币提现。充值那边官号说不受影响。排队高峰可能慢一点,提不出去就稍后再试——以你提现页实际能选的网络为准。
大饼现价大约 7.65 万,ETH 2240 附近。
未时起卦乾为天:乾上乾下,初爻动。乾卦人话是「纯阳往前推」,但动在初爻——像开门先开一道缝,别当成整扇门已敞开。我更倾向大概率先看两件事:你提现页 ETH 那几只稳定币能不能选上;下一波官宣还开哪些网络。分批开提 ≠ 全面恢复。
你账户里更急着提哪一只:RLUSD / USD1 / TUSD / FDUSD / XUSD?评论区说说。
关注我看后续。
$BTC $ETH
个人观点,非投资建议
1
465

·
--
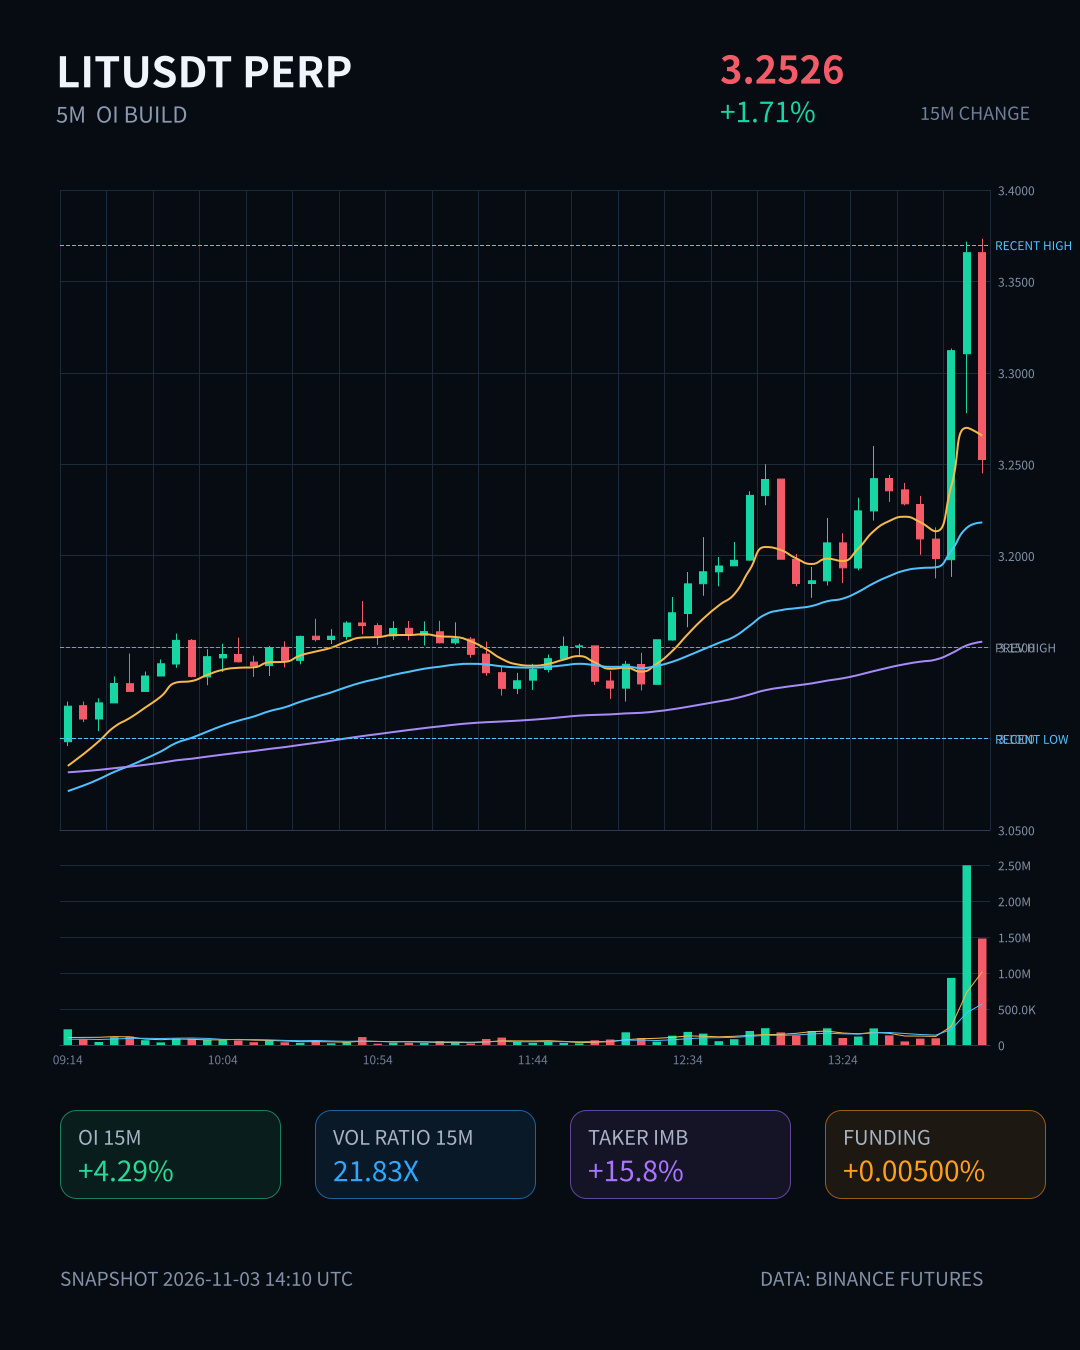
$LIT 这15分钟有点猛,成交量直接干到常态的21倍,价格拉1.71%,OI跟着15m +4.29%、1h +4.25%,名义变化近4M USDT。量价配合、主动买卖比1.38偏买方,这是新多头带着杠杆进来的节奏。
更值得留意的是OI异常分位打到100%,全池排名#1,名义变化#5,而且连续几个周期延续——已经贴近历史极端区间了。24h成交额也才56M,这么点池子塞进这些增量,双向都能放大。
追多的先想清楚:杠杆多头堆到这个位置,一旦主动买盘跟不上,反手就是连环踩踏。做空的话也别急,OI没转向前,硬顶容易被继续挤。等确认。
$LIT 这15分钟有点猛,成交量直接干到常态的21倍,价格拉1.71%,OI跟着15m +4.29%、1h +4.25%,名义变化近4M USDT。量价配合、主动买卖比1.38偏买方,这是新多头带着杠杆进来的节奏。
更值得留意的是OI异常分位打到100%,全池排名#1,名义变化#5,而且连续几个周期延续——已经贴近历史极端区间了。24h成交额也才56M,这么点池子塞进这些增量,双向都能放大。
追多的先想清楚:杠杆多头堆到这个位置,一旦主动买盘跟不上,反手就是连环踩踏。做空的话也别急,OI没转向前,硬顶容易被继续挤。等确认。
更值得留意的是OI异常分位打到100%,全池排名#1,名义变化#5,而且连续几个周期延续——已经贴近历史极端区间了。24h成交额也才56M,这么点池子塞进这些增量,双向都能放大。
追多的先想清楚:杠杆多头堆到这个位置,一旦主动买盘跟不上,反手就是连环踩踏。做空的话也别急,OI没转向前,硬顶容易被继续挤。等确认。
14

·
--
$POL 这波15m放量3.35倍直接跌破20根5m区间下沿,主动成交差-42%,买卖比0.41,空头压得很坚决。但OI 1h反而+1.06%,价格跌+OI升,典型的杠杆空头新进场结构。异常分位99.4%,全池#5,离自身历史极端区间不远了。这种时候最容易出插针反抽,别急着追空。
$POL 这波15m放量3.35倍直接跌破20根5m区间下沿,主动成交差-42%,买卖比0.41,空头压得很坚决。但OI 1h反而+1.06%,价格跌+OI升,典型的杠杆空头新进场结构。异常分位99.4%,全池#5,离自身历史极端区间不远了。这种时候最容易出插针反抽,别急着追空。
2

·
--
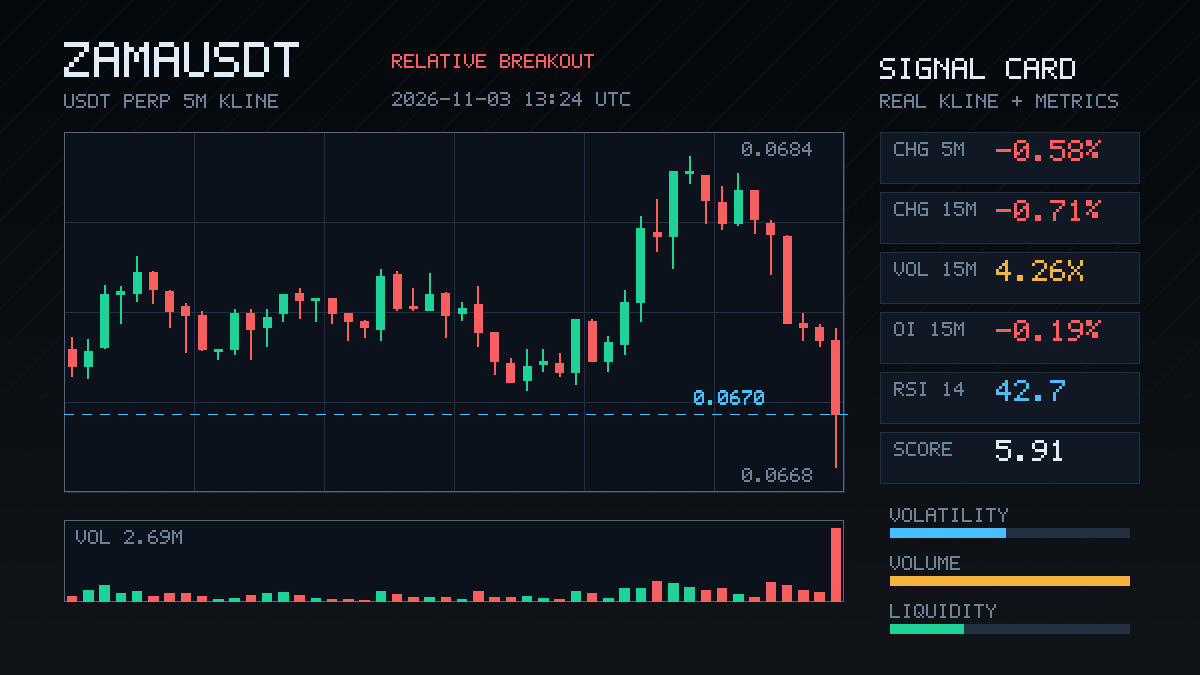
$ZAMA 这波15m放量4.26倍砸下来,价格跌0.71%其实不算大,但主动成交差-30.6%、买卖比0.53,说明砸盘的单子是实打实打出来的。OI 异常分位93.8%、全池#5,同时价格跌+OI降,典型的多头去杠杆,不像新空进场,更像止损踩踏和仓位收缩。收盘价已经跌破近20根5m区间下沿,24h成交额才8.18M,深度薄,这种小币的假突破和真破位往往就一线之间。我暂时不接,等这波去杠杆走完再看有没有企稳信号。
$ZAMA 这波15m放量4.26倍砸下来,价格跌0.71%其实不算大,但主动成交差-30.6%、买卖比0.53,说明砸盘的单子是实打实打出来的。OI 异常分位93.8%、全池#5,同时价格跌+OI降,典型的多头去杠杆,不像新空进场,更像止损踩踏和仓位收缩。收盘价已经跌破近20根5m区间下沿,24h成交额才8.18M,深度薄,这种小币的假突破和真破位往往就一线之间。我暂时不接,等这波去杠杆走完再看有没有企稳信号。
3

·
--
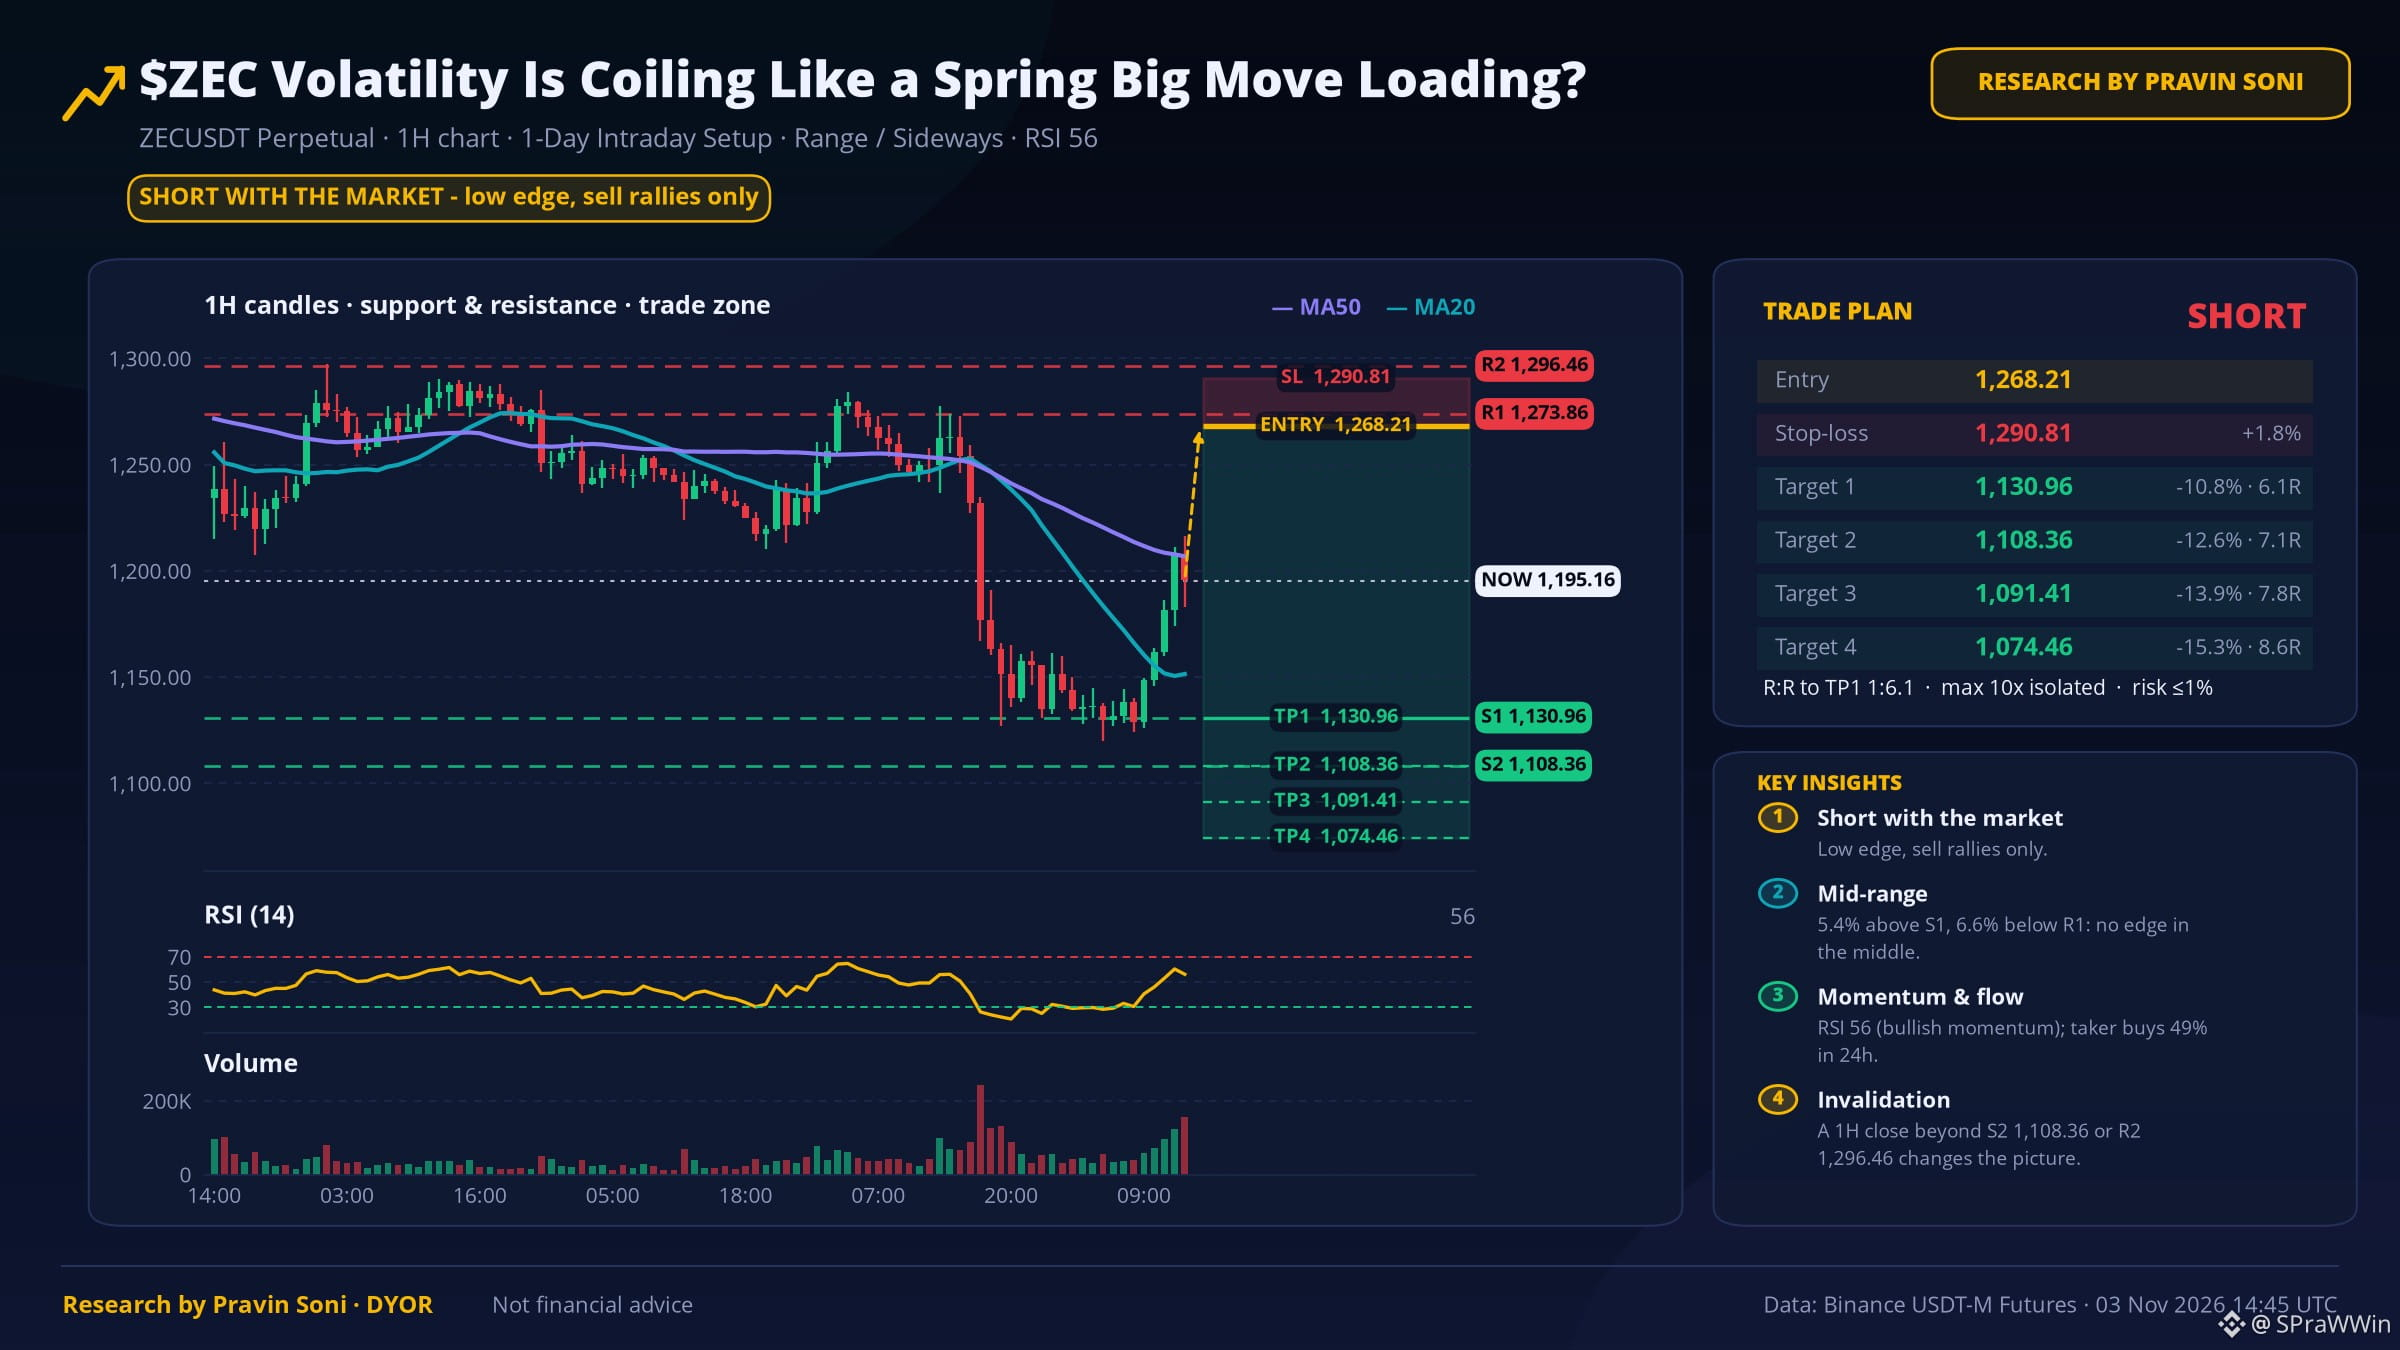
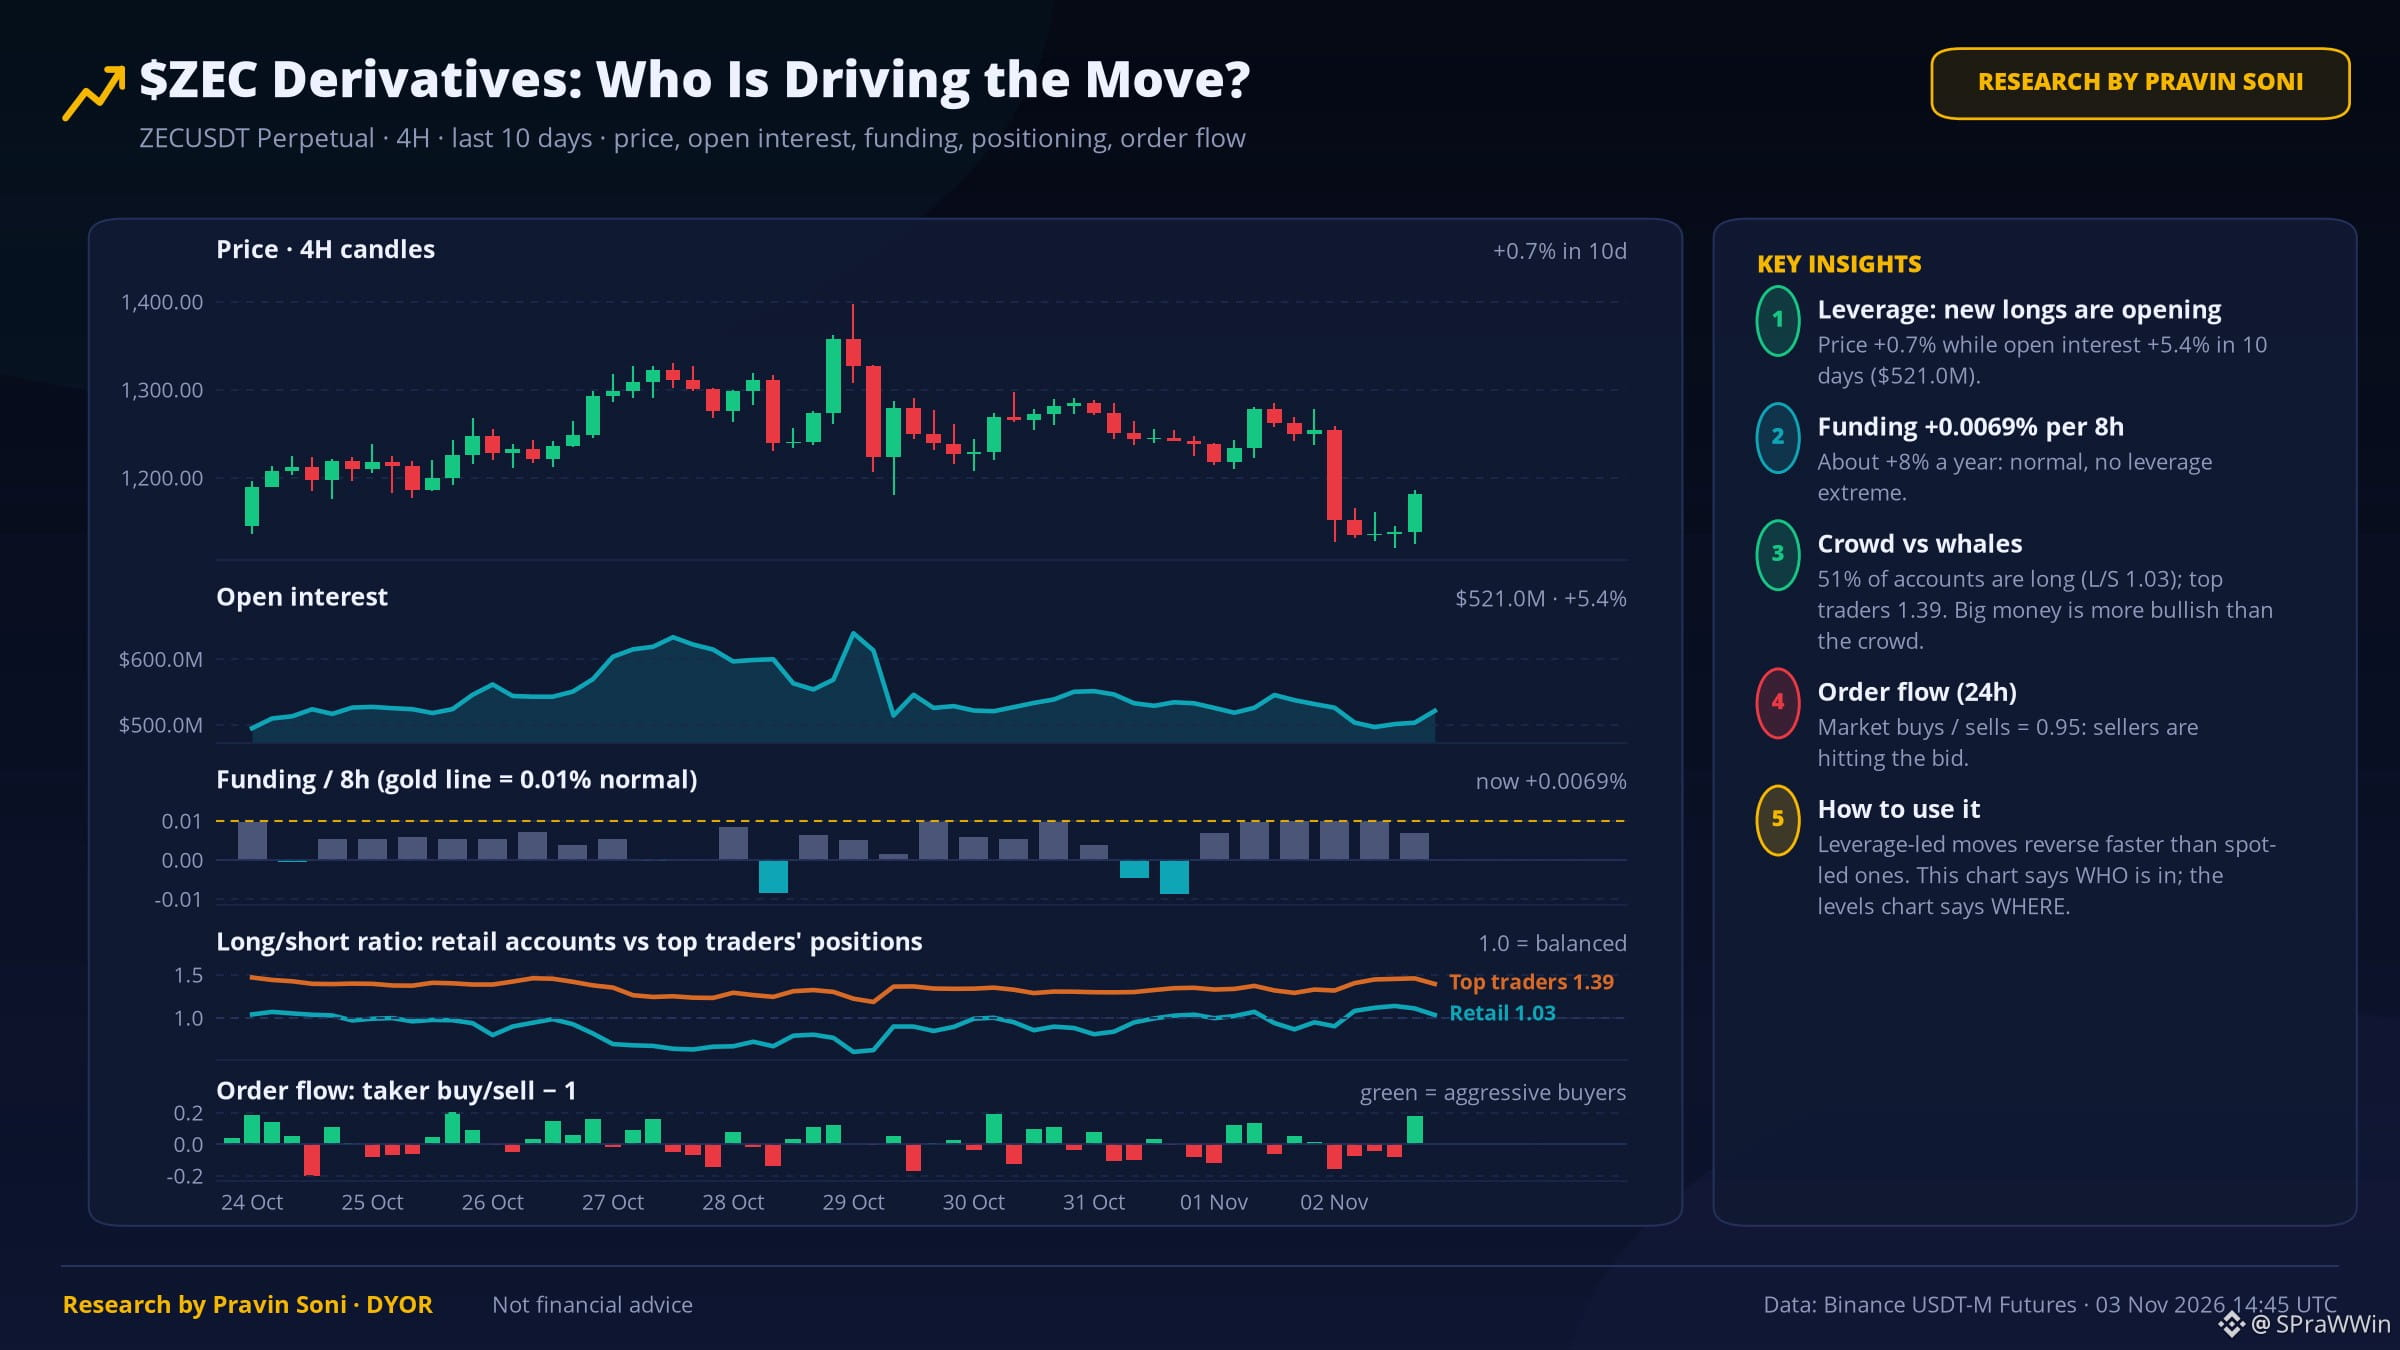
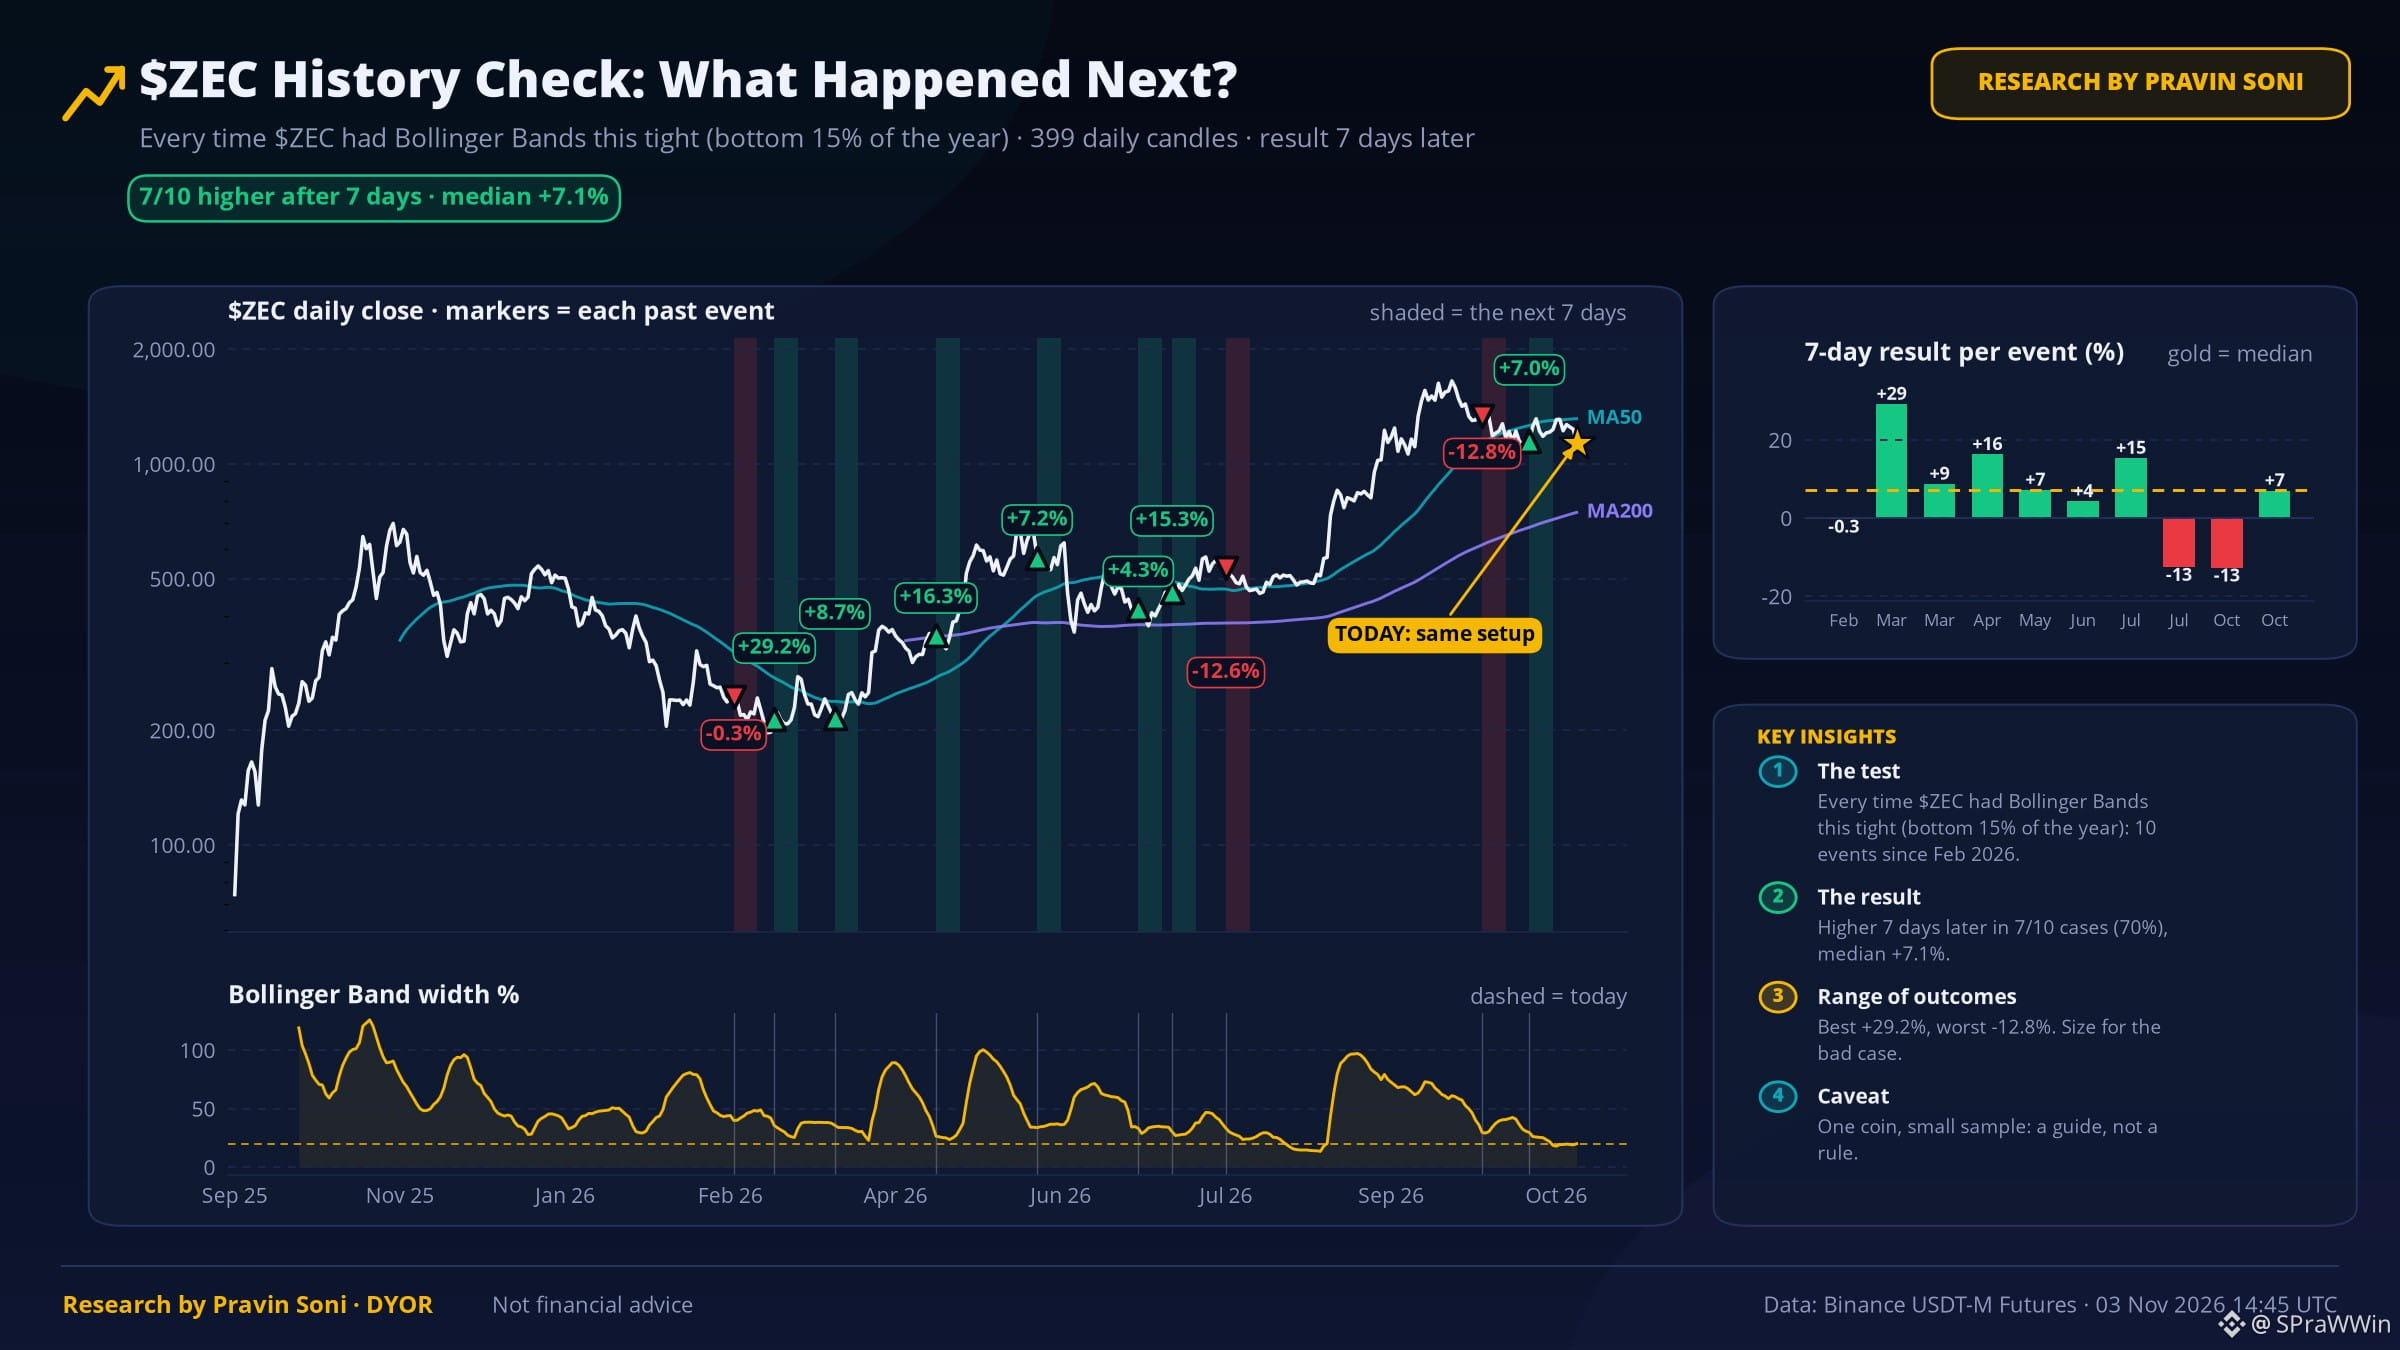
$ZEC Volatility Is Coiling Like a Spring ⚠️ Big Move Loading?
TL;DR: Volatility is coiling; top traders more bullish than the crowd. History leans up (7/10). Price 1,195.73, daily RSI 42.
📊 3 things the data says
1️⃣ Bollinger Bands are the tightest in months (bottom 5% of the past year). Tight ranges usually end with a big move — direction not given.
2️⃣ Top traders' position ratio is 1.34 vs their account ratio 0.89 — big money is leaning long.
3️⃣ Daily volatility ~5.2% is in the bottom 10% of the past year.
📜 History check
The last 10 times $ZEC had Bollinger Bands this tight (bottom 15% of the year), it was higher 7 days later in 7 of 10 cases (median +7.1%). Small sample, so a guide, not a rule.
📏 Expected range (7 days)
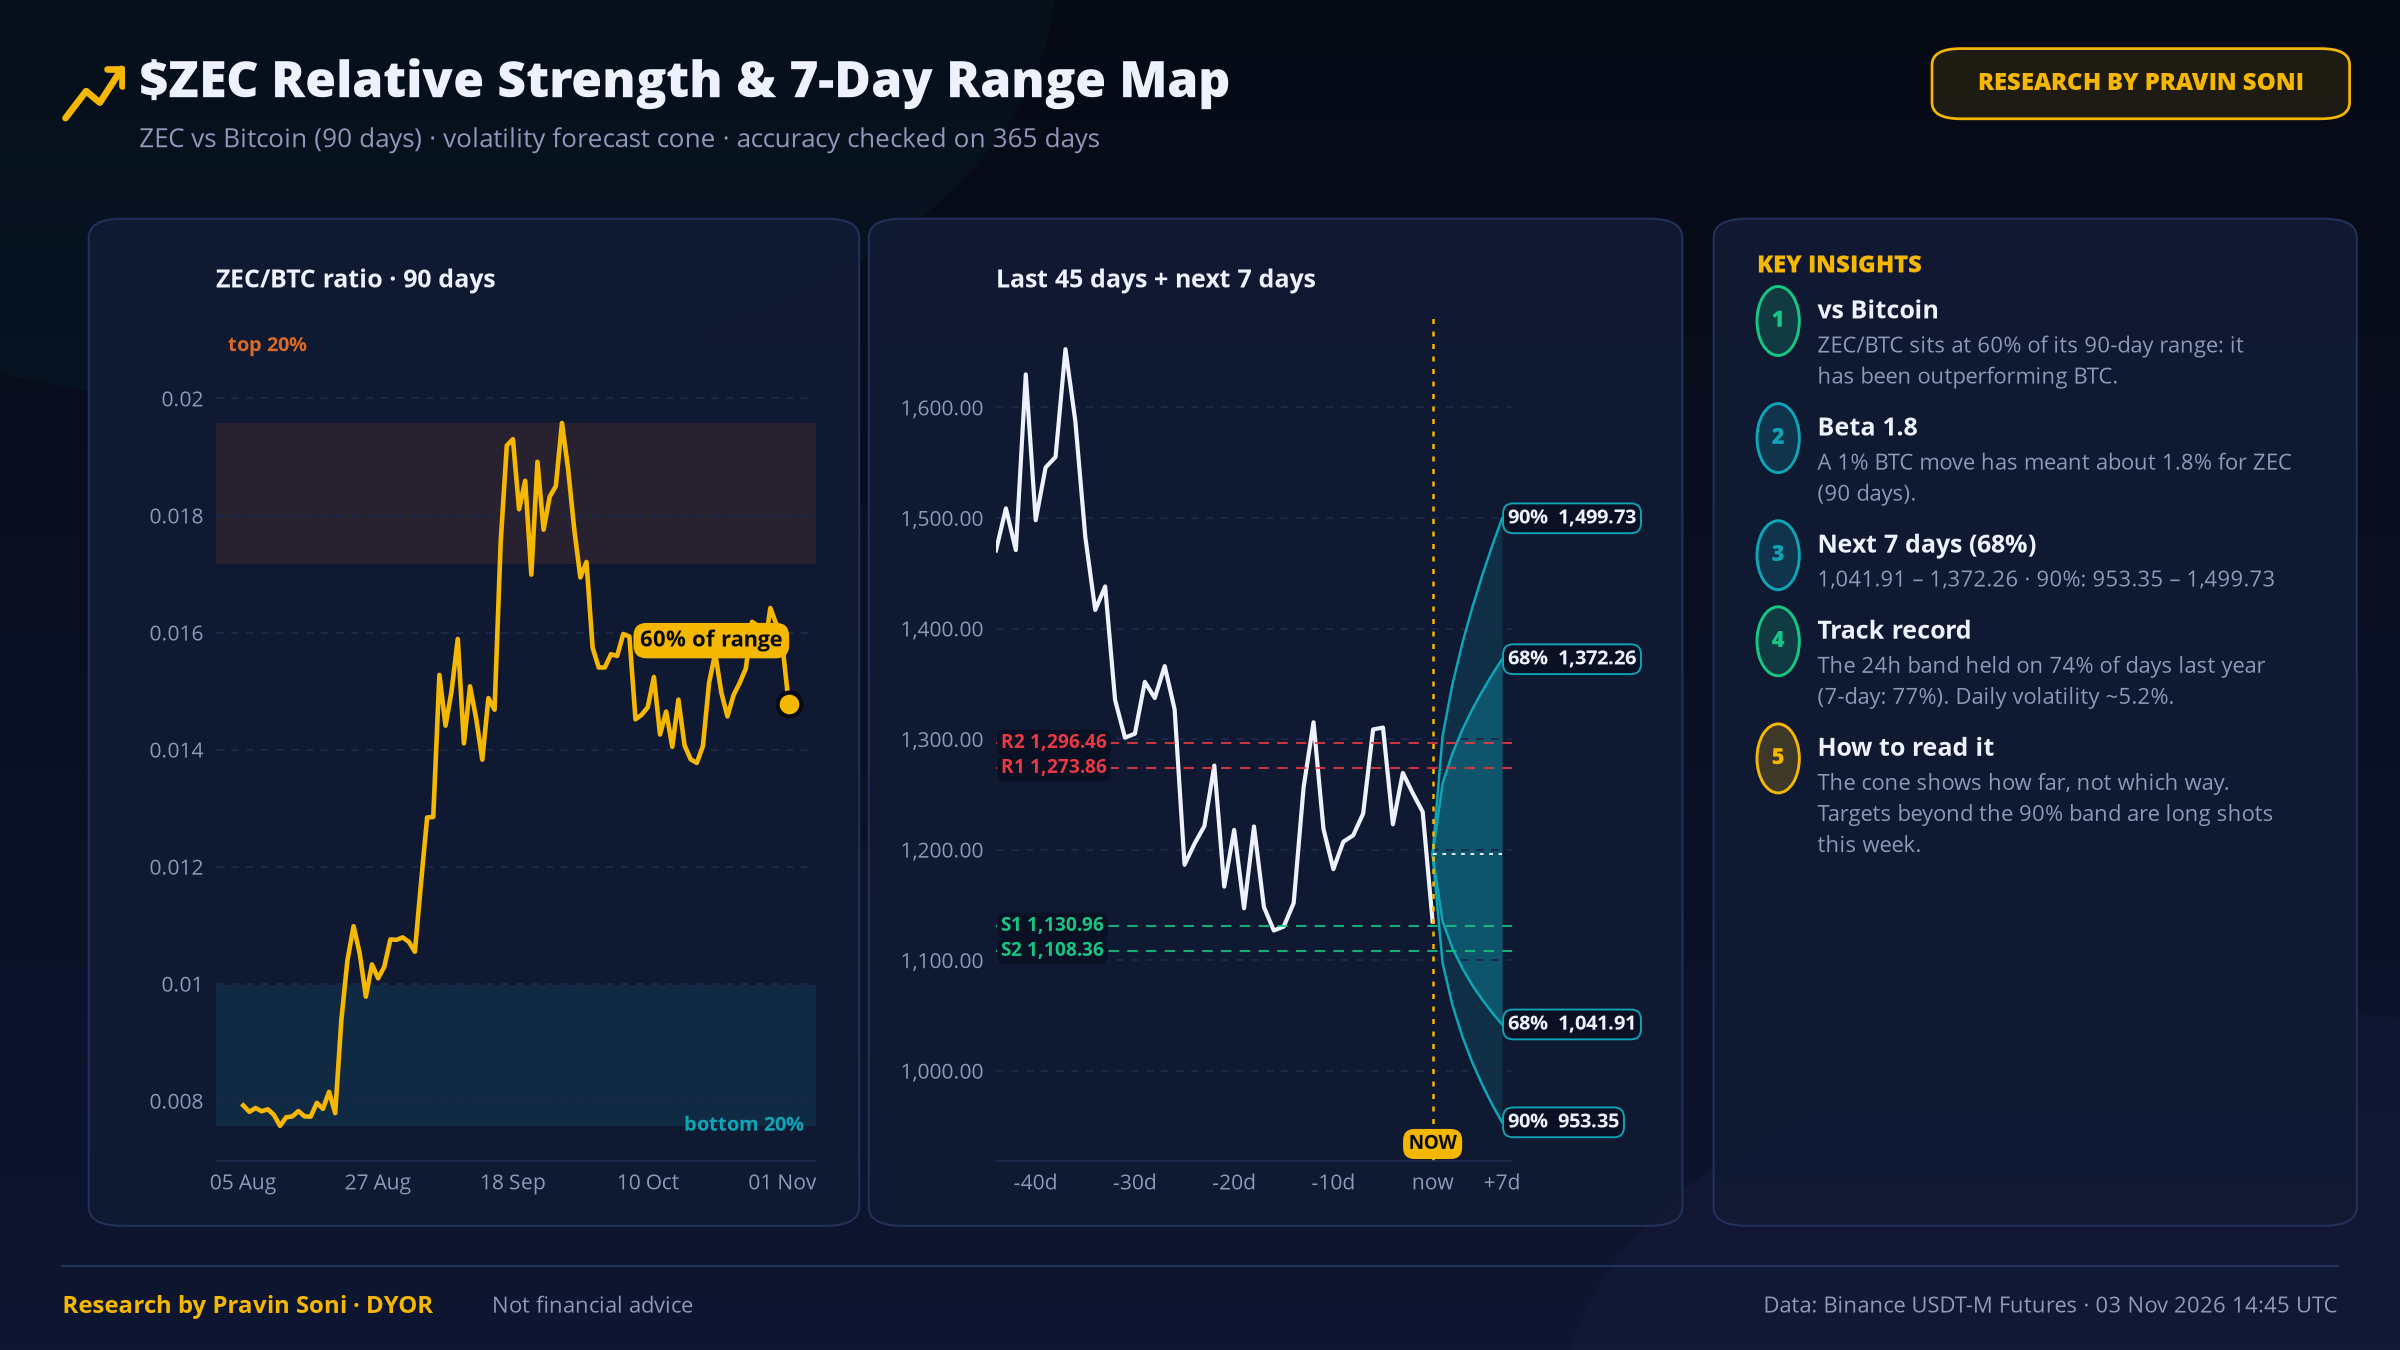
68% band: 1,041.91 – 1,372.26 · 90% band: 953.35 – 1,499.73
This band held on 74% of days last year. It shows how far, not which way.
vs $BTC: ZEC/BTC sits at 60% of its 90-day range, beta 1.8.
🧭 What decides the next move
🟢 Bull case: daily close above 1,348.89 → 1,459.35
🔴 Bear case: daily close below 1,118.80 → 1,048.09
💡 My take: The data leans bullish, but I want a daily close above 1,348.89 before trusting it. Losing 1,118.80 cancels the idea.
📰 Binance, 26h ago: Security Incident | Recovery Update #5: October 31st PoR Snapshot Now Fully Verifiable by Users as ZK Proof Generated (2026-11-02) In Recovery Update …
💬 Which way do you expect the breakout to go?
Not financial advice · Data: Binance Futures
$ZEC #ZEC #Volatility #CryptoAnalysis
⚠️ Research by Pravin Soni - DYOR
$ZEC Volatility Is Coiling Like a Spring ⚠️ Big Move Loading?
TL;DR: Volatility is coiling; top traders more bullish than the crowd. History leans up (7/10). Price 1,195.73, daily RSI 42.
📊 3 things the data says
1️⃣ Bollinger Bands are the tightest in months (bottom 5% of the past year). Tight ranges usually end with a big move — direction not given.
2️⃣ Top traders' position ratio is 1.34 vs their account ratio 0.89 — big money is leaning long.
3️⃣ Daily volatility ~5.2% is in the bottom 10% of the past year.
📜 History check
The last 10 times $ZEC had Bollinger Bands this tight (bottom 15% of the year), it was higher 7 days later in 7 of 10 cases (median +7.1%). Small sample, so a guide, not a rule.
📏 Expected range (7 days)
68% band: 1,041.91 – 1,372.26 · 90% band: 953.35 – 1,499.73
This band held on 74% of days last year. It shows how far, not which way.
vs $BTC : ZEC/BTC sits at 60% of its 90-day range, beta 1.8.
🧭 What decides the next move
🟢 Bull case: daily close above 1,348.89 → 1,459.35
🔴 Bear case: daily close below 1,118.80 → 1,048.09
💡 My take: The data leans bullish, but I want a daily close above 1,348.89 before trusting it. Losing 1,118.80 cancels the idea.
📰 Binance, 26h ago: Security Incident | Recovery Update #5: October 31st PoR Snapshot Now Fully Verifiable by Users as ZK Proof Generated (2026-11-02) In Recovery Update …
💬 Which way do you expect the breakout to go?
Not financial advice · Data: Binance Futures
$ZEC #ZEC #Volatility #CryptoAnalysis
⚠️ Research by Pravin Soni - DYOR
TL;DR: Volatility is coiling; top traders more bullish than the crowd. History leans up (7/10). Price 1,195.73, daily RSI 42.
📊 3 things the data says
1️⃣ Bollinger Bands are the tightest in months (bottom 5% of the past year). Tight ranges usually end with a big move — direction not given.
2️⃣ Top traders' position ratio is 1.34 vs their account ratio 0.89 — big money is leaning long.
3️⃣ Daily volatility ~5.2% is in the bottom 10% of the past year.
📜 History check
The last 10 times $ZEC had Bollinger Bands this tight (bottom 15% of the year), it was higher 7 days later in 7 of 10 cases (median +7.1%). Small sample, so a guide, not a rule.
📏 Expected range (7 days)
68% band: 1,041.91 – 1,372.26 · 90% band: 953.35 – 1,499.73
This band held on 74% of days last year. It shows how far, not which way.
vs $BTC : ZEC/BTC sits at 60% of its 90-day range, beta 1.8.
🧭 What decides the next move
🟢 Bull case: daily close above 1,348.89 → 1,459.35
🔴 Bear case: daily close below 1,118.80 → 1,048.09
💡 My take: The data leans bullish, but I want a daily close above 1,348.89 before trusting it. Losing 1,118.80 cancels the idea.
📰 Binance, 26h ago: Security Incident | Recovery Update #5: October 31st PoR Snapshot Now Fully Verifiable by Users as ZK Proof Generated (2026-11-02) In Recovery Update …
💬 Which way do you expect the breakout to go?
Not financial advice · Data: Binance Futures
$ZEC #ZEC #Volatility #CryptoAnalysis
⚠️ Research by Pravin Soni - DYOR
243

·
--
【现货热度|11/3 20:00】
BTC~77010(−1.1%),ETH~2264(−1.0%),SOL~92.5(−1.7%),BNB~697(−1.2%),XRP~1.257(+0.6%)。恐惧贪婪26(Fear),早热度帖是37,白天掉了11点。早热度帖约76799,现价约77010,白天从高约77315回落到低约76386附近又磨回来一点;近48小时高约78867、低约76386,距82还差约4990。
热币:整板还是偏冷,红的不多。IRYS~+11.6%、成交约270万,偏薄;STRK~+5.2%、成交约350万,偏薄;GRVT早热度帖约+2.3%,现在约+3.3%、成交约320万,偏薄,涨幅略加深;TRX早热度帖约+2.0%,现在约+1.9%、成交约950万,量还真,还挂着;LIT早热度帖约−2.5%,现在约+1.2%、成交约1250万,量还真,翻红了;PUMP~+1.2%、成交约760万。SOPH早热度帖约+0.1%,现在约−4.6%、成交约70万,偏薄,翻绿了;TRUMP早热度帖约−6.7%,现在约−3.4%、成交约790万,跌幅收了一点;OKB早热度帖约−4.0%,现在约−3.0%、成交约760万;MEGA早热度帖约+2.9%,现在约−1.1%、成交约200万,偏薄,翻绿。凉侧:XLITE早热度帖约−18.7%,现在约−20.5%、成交约360万,偏薄,跌幅又深一点;HUMA早热度帖约−11.6%,现在约−15.9%、成交约200万,偏薄,跌幅加深;PONS早热度帖约−13.6%,现在约−13.0%、成交约640万,还在砸;NEAR早热度帖约−9.8%,现在约−6.6%、成交约2700万,量还真,跌幅收了;ZEC早热度帖约−8.0%,现在约−6.0%、成交约7180万,量很真,跌幅略收;CT早热度帖约−10.4%,现在约−5.3%、成交约240万;LSK早热度帖约−11.1%,现在约−4.9%、成交约60万,偏薄,跌幅收了不少。
交易关注事件:币安官方公告列表已出Update#6(11/3):自11/3 04:00(UTC)起再开一批网络/资产提现,按需求优先、安全核查后渐进放开,充值不受影响;正文未给新的提现美元统计,截至11/1约23:30东八那版仍是最新:提现约46.5亿美元、净流出约36.4亿美元。Update#5(11/2)口径不变:10/31 00:00(UTC)PoR的完整zk证明已可核验,下一次快照计划11/4。Farside周一(11/2)完整数已出:BTC合计约净流出3.986亿美元,ETH合计约净流出1.397亿美元;周五(10/30)仍是BTC约−6.432亿、ETH约−1.557亿。周二(11/3)Farside还没有行。Polymarket上12月加息25bp约72.5%,按兵不动约25.5%,跟早热度帖差不多。
$BTC $IRYS $NEAR
【现货热度|11/3 20:00】
BTC~77010(−1.1%),ETH~2264(−1.0%),SOL~92.5(−1.7%),BNB~697(−1.2%),XRP~1.257(+0.6%)。恐惧贪婪26(Fear),早热度帖是37,白天掉了11点。早热度帖约76799,现价约77010,白天从高约77315回落到低约76386附近又磨回来一点;近48小时高约78867、低约76386,距82还差约4990。
热币:整板还是偏冷,红的不多。IRYS~+11.6%、成交约270万,偏薄;STRK~+5.2%、成交约350万,偏薄;GRVT早热度帖约+2.3%,现在约+3.3%、成交约320万,偏薄,涨幅略加深;TRX早热度帖约+2.0%,现在约+1.9%、成交约950万,量还真,还挂着;LIT早热度帖约−2.5%,现在约+1.2%、成交约1250万,量还真,翻红了;PUMP~+1.2%、成交约760万。SOPH早热度帖约+0.1%,现在约−4.6%、成交约70万,偏薄,翻绿了;TRUMP早热度帖约−6.7%,现在约−3.4%、成交约790万,跌幅收了一点;OKB早热度帖约−4.0%,现在约−3.0%、成交约760万;MEGA早热度帖约+2.9%,现在约−1.1%、成交约200万,偏薄,翻绿。凉侧:XLITE早热度帖约−18.7%,现在约−20.5%、成交约360万,偏薄,跌幅又深一点;HUMA早热度帖约−11.6%,现在约−15.9%、成交约200万,偏薄,跌幅加深;PONS早热度帖约−13.6%,现在约−13.0%、成交约640万,还在砸;NEAR早热度帖约−9.8%,现在约−6.6%、成交约2700万,量还真,跌幅收了;ZEC早热度帖约−8.0%,现在约−6.0%、成交约7180万,量很真,跌幅略收;CT早热度帖约−10.4%,现在约−5.3%、成交约240万;LSK早热度帖约−11.1%,现在约−4.9%、成交约60万,偏薄,跌幅收了不少。
交易关注事件:币安官方公告列表已出Update#6(11/3):自11/3 04:00(UTC)起再开一批网络/资产提现,按需求优先、安全核查后渐进放开,充值不受影响;正文未给新的提现美元统计,截至11/1约23:30东八那版仍是最新:提现约46.5亿美元、净流出约36.4亿美元。Update#5(11/2)口径不变:10/31 00:00(UTC)PoR的完整zk证明已可核验,下一次快照计划11/4。Farside周一(11/2)完整数已出:BTC合计约净流出3.986亿美元,ETH合计约净流出1.397亿美元;周五(10/30)仍是BTC约−6.432亿、ETH约−1.557亿。周二(11/3)Farside还没有行。Polymarket上12月加息25bp约72.5%,按兵不动约25.5%,跟早热度帖差不多。
$BTC $IRYS $NEAR
BTC~77010(−1.1%),ETH~2264(−1.0%),SOL~92.5(−1.7%),BNB~697(−1.2%),XRP~1.257(+0.6%)。恐惧贪婪26(Fear),早热度帖是37,白天掉了11点。早热度帖约76799,现价约77010,白天从高约77315回落到低约76386附近又磨回来一点;近48小时高约78867、低约76386,距82还差约4990。
热币:整板还是偏冷,红的不多。IRYS~+11.6%、成交约270万,偏薄;STRK~+5.2%、成交约350万,偏薄;GRVT早热度帖约+2.3%,现在约+3.3%、成交约320万,偏薄,涨幅略加深;TRX早热度帖约+2.0%,现在约+1.9%、成交约950万,量还真,还挂着;LIT早热度帖约−2.5%,现在约+1.2%、成交约1250万,量还真,翻红了;PUMP~+1.2%、成交约760万。SOPH早热度帖约+0.1%,现在约−4.6%、成交约70万,偏薄,翻绿了;TRUMP早热度帖约−6.7%,现在约−3.4%、成交约790万,跌幅收了一点;OKB早热度帖约−4.0%,现在约−3.0%、成交约760万;MEGA早热度帖约+2.9%,现在约−1.1%、成交约200万,偏薄,翻绿。凉侧:XLITE早热度帖约−18.7%,现在约−20.5%、成交约360万,偏薄,跌幅又深一点;HUMA早热度帖约−11.6%,现在约−15.9%、成交约200万,偏薄,跌幅加深;PONS早热度帖约−13.6%,现在约−13.0%、成交约640万,还在砸;NEAR早热度帖约−9.8%,现在约−6.6%、成交约2700万,量还真,跌幅收了;ZEC早热度帖约−8.0%,现在约−6.0%、成交约7180万,量很真,跌幅略收;CT早热度帖约−10.4%,现在约−5.3%、成交约240万;LSK早热度帖约−11.1%,现在约−4.9%、成交约60万,偏薄,跌幅收了不少。
交易关注事件:币安官方公告列表已出Update#6(11/3):自11/3 04:00(UTC)起再开一批网络/资产提现,按需求优先、安全核查后渐进放开,充值不受影响;正文未给新的提现美元统计,截至11/1约23:30东八那版仍是最新:提现约46.5亿美元、净流出约36.4亿美元。Update#5(11/2)口径不变:10/31 00:00(UTC)PoR的完整zk证明已可核验,下一次快照计划11/4。Farside周一(11/2)完整数已出:BTC合计约净流出3.986亿美元,ETH合计约净流出1.397亿美元;周五(10/30)仍是BTC约−6.432亿、ETH约−1.557亿。周二(11/3)Farside还没有行。Polymarket上12月加息25bp约72.5%,按兵不动约25.5%,跟早热度帖差不多。
$BTC $IRYS $NEAR
32

·
--


Binance Argentina Official
·
--
Incidente de seguridad | Actualización de recuperación #5
Estimados Binancians:
En la Actualización de recuperación #3 confirmamos que los activos afectados fueron repuestos con fondos propios de Binance y que todos los BTC, ETH, USDT, BNB, SOL, USDC, XRP, USD1, RLUSD y ZEC están respaldados al 100%. También tomamos una nueva instantánea de Proof of Reserve (PoR) al 2026-10-31 00:00 (UTC) para ofrecer una visión actualizada de los activos, en favor de la transparencia.
La prueba de conocimiento cero completa de esta última instantánea de PoR se completó dentro del plazo estimado. Los usuarios de Binance que tengan alguno de estos diez tokens pueden verificar de forma independiente que sus saldos en Binance están respaldados como mínimo 1:1. Pueden hacerlo con la herramienta de verificación en nuestro sitio de PoR. Consultá las instrucciones en nuestra guía aquí.
Tenemos previsto tomar otra instantánea con cobertura de más tokens el 2026-11-04. Luego generaremos una prueba de conocimiento cero completa actualizada, que estimamos tardará aproximadamente entre 40 y 50 horas por la carga computacional.
Como señalamos en la Actualización de recuperación #4, Binance ya cubrió cerca del 95% del monto afectado. El 5% restante corresponde a tokens no incluidos entre los diez mencionados arriba. Son activos con menor liquidez y requieren más tiempo para conseguirlos a la escala necesaria. Seguimos trabajando con socios de la industria para completar las adquisiciones restantes.
También estamos trabajando para reanudar los retiros en más redes y activos. La próxima etapa está prevista para mañana: será un despliegue progresivo y compartiremos los detalles cuando esté listo.
Nuestro compromiso no cambia: Binance absorberá el impacto financiero de los fondos robados, no nuestros usuarios. Con la prueba generada, la parte respaldada de ese compromiso ya es verificable públicamente.
¡Gracias por su apoyo!
Equipo de Binance
02-11-2026
Preguntas frecuentes sobre la verificación de Proof of Reserve
Binance publica Proof of Reserve (PoR) para que los usuarios no tengan que confiar en nuestra palabra. El público puede informarse sobre PoR y sobre cómo prueba criptográficamente que los activos de los usuarios en Binance están respaldados como mínimo 1:1 aquí.
Los usuarios pueden aprender a verificar en nuestra guía aquí.
Antes de empezar: tenés que iniciar sesión en tu cuenta de Binance y descargar la herramienta de verificación desde el sitio de PoR en tu computadora para ejecutar tu propia verificación.
Recordatorio de seguridad: por tu propia seguridad, accedé únicamente al sitio oficial de Binance. No compartas tus datos de acceso y no uses dispositivos en los que no confíes.
¿Por qué es tan complicado verificar mis activos con PoR?
Entendemos que la verificación de PoR puede parecer técnica. Se basa en criptografía en lugar de un número que te pedimos que creas, y los pasos existen justamente para que no dependas solo de la palabra de Binance. Para facilitarlo, publicamos una guía paso a paso aquí.
¿Por qué necesito descargar los archivos de verificación a mi computadora?
Verificás en tus propios dispositivos para tener la seguridad de que estás ejecutando tus propias comprobaciones en tu propia máquina.
El verificador es de código abierto y cualquiera puede descargarlo y ejecutarlo. Publicamos actualizaciones en un repositorio público de GitHub y el código fue auditado de forma independiente. Esto permite que la comunidad de desarrolladores y el público en general revisen la implementación en favor de la transparencia.
¿Son confiables el PoR y las pruebas de conocimiento cero?
Sí. El Proof of Reserve de Binance usa un sistema de Merkle Tree con zk-SNARK (zero-knowledge succinct non-interactive argument of knowledge).
El Merkle Tree permite que cada usuario verifique de forma independiente que los activos de su propia cuenta están incluidos en la instantánea de reservas.El zk-SNARK prueba, para la instantánea tomada al 2026-10-31 00:00 (UTC), que las reservas están respaldadas como mínimo 1:1, sin revelar el saldo de ningún usuario en particular.
En conjunto, el resultado está probado criptográficamente: confirmás que tus propios activos están cubiertos e incluidos en la instantánea de PoR que publicamos, sin exponer tu saldo ni el de nadie más.
En la Actualización de recuperación #3 confirmamos que los activos afectados fueron repuestos con fondos propios de Binance y que todos los BTC, ETH, USDT, BNB, SOL, USDC, XRP, USD1, RLUSD y ZEC están respaldados al 100%. También tomamos una nueva instantánea de Proof of Reserve (PoR) al 2026-10-31 00:00 (UTC) para ofrecer una visión actualizada de los activos, en favor de la transparencia.
La prueba de conocimiento cero completa de esta última instantánea de PoR se completó dentro del plazo estimado. Los usuarios de Binance que tengan alguno de estos diez tokens pueden verificar de forma independiente que sus saldos en Binance están respaldados como mínimo 1:1. Pueden hacerlo con la herramienta de verificación en nuestro sitio de PoR. Consultá las instrucciones en nuestra guía aquí.
Tenemos previsto tomar otra instantánea con cobertura de más tokens el 2026-11-04. Luego generaremos una prueba de conocimiento cero completa actualizada, que estimamos tardará aproximadamente entre 40 y 50 horas por la carga computacional.
Como señalamos en la Actualización de recuperación #4, Binance ya cubrió cerca del 95% del monto afectado. El 5% restante corresponde a tokens no incluidos entre los diez mencionados arriba. Son activos con menor liquidez y requieren más tiempo para conseguirlos a la escala necesaria. Seguimos trabajando con socios de la industria para completar las adquisiciones restantes.
También estamos trabajando para reanudar los retiros en más redes y activos. La próxima etapa está prevista para mañana: será un despliegue progresivo y compartiremos los detalles cuando esté listo.
Nuestro compromiso no cambia: Binance absorberá el impacto financiero de los fondos robados, no nuestros usuarios. Con la prueba generada, la parte respaldada de ese compromiso ya es verificable públicamente.
¡Gracias por su apoyo!
Equipo de Binance
02-11-2026
Preguntas frecuentes sobre la verificación de Proof of Reserve
Binance publica Proof of Reserve (PoR) para que los usuarios no tengan que confiar en nuestra palabra. El público puede informarse sobre PoR y sobre cómo prueba criptográficamente que los activos de los usuarios en Binance están respaldados como mínimo 1:1 aquí.
Los usuarios pueden aprender a verificar en nuestra guía aquí.
Antes de empezar: tenés que iniciar sesión en tu cuenta de Binance y descargar la herramienta de verificación desde el sitio de PoR en tu computadora para ejecutar tu propia verificación.
Recordatorio de seguridad: por tu propia seguridad, accedé únicamente al sitio oficial de Binance. No compartas tus datos de acceso y no uses dispositivos en los que no confíes.
¿Por qué es tan complicado verificar mis activos con PoR?
Entendemos que la verificación de PoR puede parecer técnica. Se basa en criptografía en lugar de un número que te pedimos que creas, y los pasos existen justamente para que no dependas solo de la palabra de Binance. Para facilitarlo, publicamos una guía paso a paso aquí.
¿Por qué necesito descargar los archivos de verificación a mi computadora?
Verificás en tus propios dispositivos para tener la seguridad de que estás ejecutando tus propias comprobaciones en tu propia máquina.
El verificador es de código abierto y cualquiera puede descargarlo y ejecutarlo. Publicamos actualizaciones en un repositorio público de GitHub y el código fue auditado de forma independiente. Esto permite que la comunidad de desarrolladores y el público en general revisen la implementación en favor de la transparencia.
¿Son confiables el PoR y las pruebas de conocimiento cero?
Sí. El Proof of Reserve de Binance usa un sistema de Merkle Tree con zk-SNARK (zero-knowledge succinct non-interactive argument of knowledge).
El Merkle Tree permite que cada usuario verifique de forma independiente que los activos de su propia cuenta están incluidos en la instantánea de reservas.El zk-SNARK prueba, para la instantánea tomada al 2026-10-31 00:00 (UTC), que las reservas están respaldadas como mínimo 1:1, sin revelar el saldo de ningún usuario en particular.
En conjunto, el resultado está probado criptográficamente: confirmás que tus propios activos están cubiertos e incluidos en la instantánea de PoR que publicamos, sin exponer tu saldo ni el de nadie más.
1
89
·
--
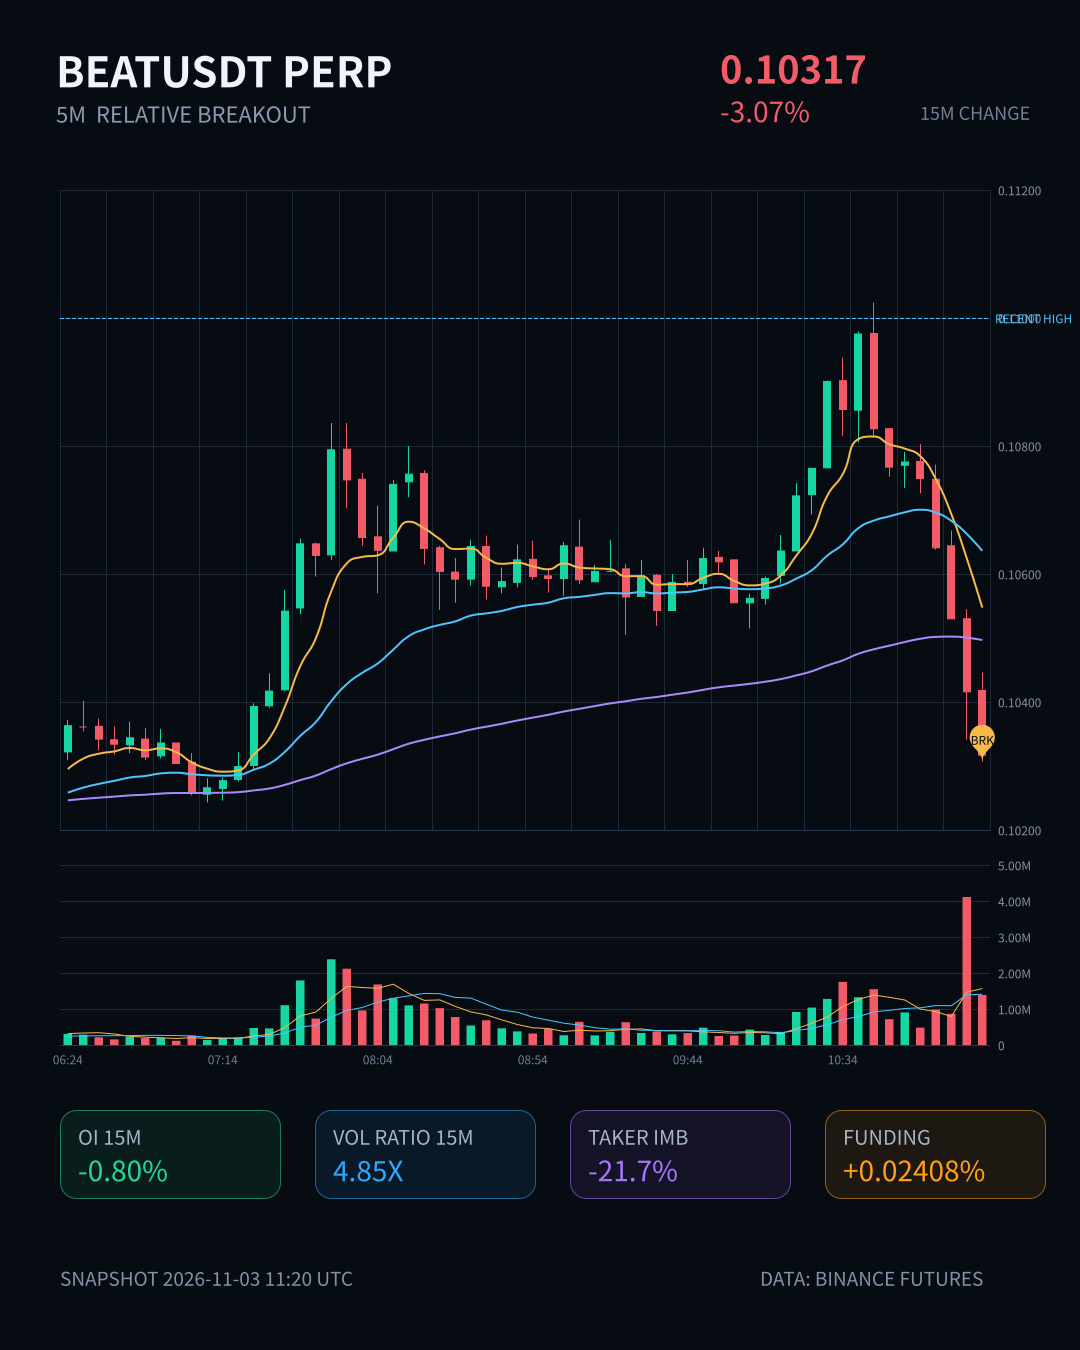
$BEAT 这波15m下跌3.07%,成交量直接放大4.85倍,Z值2.99,主动成交差-21.7%,买卖比0.64——短线上多头被清理得很彻底,止损和去杠杆在同时进行。价格已经跌破近20根5m K线区间下沿,触及近期低点边界,OI 15m -0.80%,名义变化-344K,1h虽然还是+0.67%,但名义也是负的,异常分位98.8%排在全池#5,说明杠杆收缩的节奏还在延续,不是单根K线的噪音。
24h成交额12.12M,深度没问题,这种级别的相对突破通常不是随便插针。价格下跌+OI下降,更偏向多头投降和仓位收缩,而不是新空进场。先看这段15m能不能在低点边界稳住,如果继续放量下探、主动卖压不收敛,那还得等OI真正出清。
$BEAT 这波15m下跌3.07%,成交量直接放大4.85倍,Z值2.99,主动成交差-21.7%,买卖比0.64——短线上多头被清理得很彻底,止损和去杠杆在同时进行。价格已经跌破近20根5m K线区间下沿,触及近期低点边界,OI 15m -0.80%,名义变化-344K,1h虽然还是+0.67%,但名义也是负的,异常分位98.8%排在全池#5,说明杠杆收缩的节奏还在延续,不是单根K线的噪音。
24h成交额12.12M,深度没问题,这种级别的相对突破通常不是随便插针。价格下跌+OI下降,更偏向多头投降和仓位收缩,而不是新空进场。先看这段15m能不能在低点边界稳住,如果继续放量下探、主动卖压不收敛,那还得等OI真正出清。
24h成交额12.12M,深度没问题,这种级别的相对突破通常不是随便插针。价格下跌+OI下降,更偏向多头投降和仓位收缩,而不是新空进场。先看这段15m能不能在低点边界稳住,如果继续放量下探、主动卖压不收敛,那还得等OI真正出清。
1

·
--
$BNB 儲備證明出了,但它只拍到 10/31 那一刻 👀
幣安這兩天的進度:
• 10/31 00:00 UTC 快照的零知識儲備證明已完成:BTC、ETH、USDT、BNB、SOL 等 10 個幣,用戶可以自己上 PoR 頁驗證餘額至少 1:1 有對應
• 第二批提現從今天 12:00(UTC+8)/04:00 UTC 開始,9 條網路一個一個開;以太坊、Solana 上已經有幾十個幣能提,像 LINK、SHIB、BONK、WIF
• 被盜部分已補回約 95%,剩下 5% 是流動性差、比較難買的小幣
我比較在意的是時間差:
快照拍在 10/31,但 11/1 重開提現後,第一天就淨流出 36.4 億美元。所以這份證明說的是「提現潮之前」的狀態,不是現在。
下一張快照 11/4(UTC)拍,會涵蓋更多幣,算證明要 40~50 小時,大概 11/5~11/6 才看得到。
我的看法:前十大幣的人現在比較能放心,真正被卡的是手上是小幣、或要走還沒開的網路的人。如果下一份證明延期,或有幣低於 100%,情緒可能再被打一次。BNB 現在約 699,24 小時 −0.8%。
你的幣現在提得出來了嗎?
來源:幣安 Recovery Update #5、#6、幣安官方 X、The Block、CNBC
非投資建議
$BNB 儲備證明出了,但它只拍到 10/31 那一刻 👀
幣安這兩天的進度:
• 10/31 00:00 UTC 快照的零知識儲備證明已完成:BTC、ETH、USDT、BNB、SOL 等 10 個幣,用戶可以自己上 PoR 頁驗證餘額至少 1:1 有對應
• 第二批提現從今天 12:00(UTC+8)/04:00 UTC 開始,9 條網路一個一個開;以太坊、Solana 上已經有幾十個幣能提,像 LINK、SHIB、BONK、WIF
• 被盜部分已補回約 95%,剩下 5% 是流動性差、比較難買的小幣
我比較在意的是時間差:
快照拍在 10/31,但 11/1 重開提現後,第一天就淨流出 36.4 億美元。所以這份證明說的是「提現潮之前」的狀態,不是現在。
下一張快照 11/4(UTC)拍,會涵蓋更多幣,算證明要 40~50 小時,大概 11/5~11/6 才看得到。
我的看法:前十大幣的人現在比較能放心,真正被卡的是手上是小幣、或要走還沒開的網路的人。如果下一份證明延期,或有幣低於 100%,情緒可能再被打一次。BNB 現在約 699,24 小時 −0.8%。
你的幣現在提得出來了嗎?
來源:幣安 Recovery Update #5、#6、幣安官方 X、The Block、CNBC
非投資建議
幣安這兩天的進度:
• 10/31 00:00 UTC 快照的零知識儲備證明已完成:BTC、ETH、USDT、BNB、SOL 等 10 個幣,用戶可以自己上 PoR 頁驗證餘額至少 1:1 有對應
• 第二批提現從今天 12:00(UTC+8)/04:00 UTC 開始,9 條網路一個一個開;以太坊、Solana 上已經有幾十個幣能提,像 LINK、SHIB、BONK、WIF
• 被盜部分已補回約 95%,剩下 5% 是流動性差、比較難買的小幣
我比較在意的是時間差:
快照拍在 10/31,但 11/1 重開提現後,第一天就淨流出 36.4 億美元。所以這份證明說的是「提現潮之前」的狀態,不是現在。
下一張快照 11/4(UTC)拍,會涵蓋更多幣,算證明要 40~50 小時,大概 11/5~11/6 才看得到。
我的看法:前十大幣的人現在比較能放心,真正被卡的是手上是小幣、或要走還沒開的網路的人。如果下一份證明延期,或有幣低於 100%,情緒可能再被打一次。BNB 現在約 699,24 小時 −0.8%。
你的幣現在提得出來了嗎?
來源:幣安 Recovery Update #5、#6、幣安官方 X、The Block、CNBC
非投資建議
249

·
--
📊 USDT Volume Distribution Snapshot — Nov 3, 2026
The top 10 USDT pairs are capturing 75.8% of all USDT spot volume right now. Here is how trader attention breaks down:
1. USDC/USDT — $1.68B | 31.5% | +0.04%
2. BTC/USDT — $1.11B | 20.8% | -2.13%
3. ETH/USDT — $443M | 8.3% | -1.83%
4. ZEC/USDT — $181M | 3.4% | -10.58%
5. SOL/USDT — $162M | 3.0% | -2.99%
6. USD1/USDT — $133M | 2.5% | +0.01%
7. XRP/USDT — $90M | 1.7% | -0.02%
8. NEAR/USDT — $89M | 1.7% | -8.60%
9. BNB/USDT — $80M | 1.5% | -2.48%
10. U/USDT — $75M | 1.4% | -0.03%
What this tells us:
- Stablecoins dominate — USDC+USD1+U represent ~35% of top-10 volume. Risk-off mode is ON.
- BTC still commands the most real-asset volume at $1.1B despite a -2.13% slide.
- ZEC and NEAR are bleeding both price and trader attention with sharp double-digit drops.
- SOL keeps a loyal crowd at #5 despite the red candle.
The market is cautious today. Stables absorbing capital while majors face sell pressure.
#BTC #Crypto #Binance
📊 USDT Volume Distribution Snapshot — Nov 3, 2026
The top 10 USDT pairs are capturing 75.8% of all USDT spot volume right now. Here is how trader attention breaks down:
1. USDC/USDT — $1.68B | 31.5% | +0.04%
2. BTC/USDT — $1.11B | 20.8% | -2.13%
3. ETH/USDT — $443M | 8.3% | -1.83%
4. ZEC/USDT — $181M | 3.4% | -10.58%
5. SOL/USDT — $162M | 3.0% | -2.99%
6. USD1/USDT — $133M | 2.5% | +0.01%
7. XRP/USDT — $90M | 1.7% | -0.02%
8. NEAR/USDT — $89M | 1.7% | -8.60%
9. BNB/USDT — $80M | 1.5% | -2.48%
10. U/USDT — $75M | 1.4% | -0.03%
What this tells us:
- Stablecoins dominate — USDC+USD1+U represent ~35% of top-10 volume. Risk-off mode is ON.
- BTC still commands the most real-asset volume at $1.1B despite a -2.13% slide.
- ZEC and NEAR are bleeding both price and trader attention with sharp double-digit drops.
- SOL keeps a loyal crowd at #5 despite the red candle.
The market is cautious today. Stables absorbing capital while majors face sell pressure.
#BTC #Crypto #Binance
The top 10 USDT pairs are capturing 75.8% of all USDT spot volume right now. Here is how trader attention breaks down:
1. USDC/USDT — $1.68B | 31.5% | +0.04%
2. BTC/USDT — $1.11B | 20.8% | -2.13%
3. ETH/USDT — $443M | 8.3% | -1.83%
4. ZEC/USDT — $181M | 3.4% | -10.58%
5. SOL/USDT — $162M | 3.0% | -2.99%
6. USD1/USDT — $133M | 2.5% | +0.01%
7. XRP/USDT — $90M | 1.7% | -0.02%
8. NEAR/USDT — $89M | 1.7% | -8.60%
9. BNB/USDT — $80M | 1.5% | -2.48%
10. U/USDT — $75M | 1.4% | -0.03%
What this tells us:
- Stablecoins dominate — USDC+USD1+U represent ~35% of top-10 volume. Risk-off mode is ON.
- BTC still commands the most real-asset volume at $1.1B despite a -2.13% slide.
- ZEC and NEAR are bleeding both price and trader attention with sharp double-digit drops.
- SOL keeps a loyal crowd at #5 despite the red candle.
The market is cautious today. Stables absorbing capital while majors face sell pressure.
#BTC #Crypto #Binance
3
206


·
--
Binance Completes Zero-Knowledge Proof of Reserves After Covering 95% of Record $6.3 Billion Hack Losses<ul><li>Binance has replenished approximately <strong>95%</strong> of the roughly <strong>$6.3 billion</strong> stolen in the Oct. 29 hot-wallet hack using company funds.</li><li>Users holding BTC, ETH, USDT, BNB, SOL, USDC, XRP, USD1, RLUSD and ZEC can now independently verify <strong>1:1</strong> reserve backing via a completed zero-knowledge proof.</li><li>The FBI attributed the attack to North Korea’s TraderTraitor group, the same actors linked to the 2025 Bybit heist.</li><li>The exchange is expanding withdrawal access and plans another full reserve snapshot on Nov. 4.</li></ul><p class="has-drop-cap">Binance has completed a zero-knowledge proof of reserves for ten major assets, allowing customers to independently confirm that their balances remain fully backed after the exchange covered the bulk of losses from the largest cryptocurrency hack on record.</p><p>In its <a href="https://x.com/binance/status/2117237539098521938" target="_blank" rel="noopener">Recovery Update #5</a> published Monday, the exchange said the cryptographic proof for the Oct. 31 snapshot is now available, covering bitcoin, ether, USDT, BNB, SOL, USDC, XRP, USD1, RLUSD and ZEC. <a href="https://www.theblock.co/news/business/2026-11-02-binance-zero-knowledge-proof-of-reserves-snapshot-hack-recovery-432321" target="_blank" rel="noopener">The Block reported</a> that Binance has replenished about <strong>95%</strong> of the impacted assets with its own funds, up from 90% in the prior update, with the remaining 5% consisting of less-liquid tokens still being acquired through market and OTC channels.</p><p>The original breach, which occurred on Oct. 29, drained an estimated <strong>$6.3 billion</strong> from Binance hot wallets across multiple chains. The <a href="https://www.coindesk.com/policy/2026/10/31/fbi-confirms-north-korea-s-role-in-usd6-billion-binance-hack-asks-defi-community-to-block-btc-eth-sol-addresses" target="_blank" rel="noopener">FBI attributed</a> the theft to North Korea’s TraderTraitor hacking group. Binance has repeatedly stated it will absorb the full financial impact using corporate resources, a partial SAFU deployment and its futures insurance fund, rather than customer balances. In an earlier <a href="https://www.binance.com/en/support/announcement/detail/1fdf1f61559c401da0435895ffcccb62" target="_blank" rel="noopener">support announcement</a>, the exchange confirmed it had set aside more than <strong>$6.34 billion</strong> for the recovery.</p><p>“We've completed the latest Proof of Reserves verification, giving users another way to independently check that their assets are backed,” Binance co-CEO Richard Teng <a href="https://www.theblock.co/news/business/2026-11-02-binance-zero-knowledge-proof-of-reserves-snapshot-hack-recovery-432321" target="_blank" rel="noopener">wrote on X</a>. The company plans another reserve snapshot covering additional tokens on Nov. 4, with the corresponding proof expected to take 40 to 50 hours to generate. It is also progressively restoring withdrawals for more networks and assets beginning Tuesday.</p><p>The recovery continues against a backdrop of heightened exchange security concerns. On Monday, Brazil’s Mercado Bitcoin halted deposits and withdrawals after a separate incident drained more than <strong>$40 million</strong> across at least 10 chains, according to <a href="https://www.coindesk.com/business/2026/11/02/brazil-s-mercado-bitcoin-halts-withdrawals-after-usd40-million-drained-across-10-chains" target="_blank" rel="noopener">CoinDesk</a>. Tether froze roughly $4.5 million in related USDT. No link to the Binance attack has been established.</p><p>Binance users can verify their holdings through the exchange’s proof-of-reserves portal. The exchange has said it remains committed to full coverage and transparent reporting as it works through the remaining less-liquid assets and expanded withdrawal access.</p>
Binance Completes Zero-Knowledge Proof of Reserves After Covering 95% of Record $6.3 Billion Hack Losses
<ul><li>Binance has replenished approximately <strong>95%</strong> of the roughly <strong>$6.3 billion</strong> stolen in the Oct. 29 hot-wallet hack using company funds.</li><li>Users holding BTC, ETH, USDT, BNB, SOL, USDC, XRP, USD1, RLUSD and ZEC can now independently verify <strong>1:1</strong> reserve backing via a completed zero-knowledge proof.</li><li>The FBI attributed the attack to North Korea’s TraderTraitor group, the same actors linked to the 2025 Bybit heist.</li><li>The exchange is expanding withdrawal access and plans another full reserve snapshot on Nov. 4.</li></ul><p class="has-drop-cap">Binance has completed a zero-knowledge proof of reserves for ten major assets, allowing customers to independently confirm that their balances remain fully backed after the exchange covered the bulk of losses from the largest cryptocurrency hack on record.</p><p>In its <a href="https://x.com/binance/status/2117237539098521938" target="_blank" rel="noopener">Recovery Update #5</a> published Monday, the exchange said the cryptographic proof for the Oct. 31 snapshot is now available, covering bitcoin, ether, USDT, BNB, SOL, USDC, XRP, USD1, RLUSD and ZEC. <a href="https://www.theblock.co/news/business/2026-11-02-binance-zero-knowledge-proof-of-reserves-snapshot-hack-recovery-432321" target="_blank" rel="noopener">The Block reported</a> that Binance has replenished about <strong>95%</strong> of the impacted assets with its own funds, up from 90% in the prior update, with the remaining 5% consisting of less-liquid tokens still being acquired through market and OTC channels.</p><p>The original breach, which occurred on Oct. 29, drained an estimated <strong>$6.3 billion</strong> from Binance hot wallets across multiple chains. The <a href="https://www.coindesk.com/policy/2026/10/31/fbi-confirms-north-korea-s-role-in-usd6-billion-binance-hack-asks-defi-community-to-block-btc-eth-sol-addresses" target="_blank" rel="noopener">FBI attributed</a> the theft to North Korea’s TraderTraitor hacking group. Binance has repeatedly stated it will absorb the full financial impact using corporate resources, a partial SAFU deployment and its futures insurance fund, rather than customer balances. In an earlier <a href="https://www.binance.com/en/support/announcement/detail/1fdf1f61559c401da0435895ffcccb62" target="_blank" rel="noopener">support announcement</a>, the exchange confirmed it had set aside more than <strong>$6.34 billion</strong> for the recovery.</p><p>“We've completed the latest Proof of Reserves verification, giving users another way to independently check that their assets are backed,” Binance co-CEO Richard Teng <a href="https://www.theblock.co/news/business/2026-11-02-binance-zero-knowledge-proof-of-reserves-snapshot-hack-recovery-432321" target="_blank" rel="noopener">wrote on X</a>. The company plans another reserve snapshot covering additional tokens on Nov. 4, with the corresponding proof expected to take 40 to 50 hours to generate. It is also progressively restoring withdrawals for more networks and assets beginning Tuesday.</p><p>The recovery continues against a backdrop of heightened exchange security concerns. On Monday, Brazil’s Mercado Bitcoin halted deposits and withdrawals after a separate incident drained more than <strong>$40 million</strong> across at least 10 chains, according to <a href="https://www.coindesk.com/business/2026/11/02/brazil-s-mercado-bitcoin-halts-withdrawals-after-usd40-million-drained-across-10-chains" target="_blank" rel="noopener">CoinDesk</a>. Tether froze roughly $4.5 million in related USDT. No link to the Binance attack has been established.</p><p>Binance users can verify their holdings through the exchange’s proof-of-reserves portal. The exchange has said it remains committed to full coverage and transparent reporting as it works through the remaining less-liquid assets and expanded withdrawal access.</p>
228

·
--
币安这个:Security Incident | Recovery Update #5: October 31st PoR Snapshot Now Fully Verifiable by Users as ZK Proof Generated (2026-11-02)
X 上 X@binancezh 是这么说的:安全事件恢复进展#5:10月31日储备金证明快照的零知识证明已生成,用户现可自行独立验证;提现仍分阶段恢复,谨防冒充币安索要加速提现费用的诈骗
我的看法:值不值得上,我先算账——奖池除以预估参与人数,再看门槛,算下来不划算的直接跳过。想参与的去原文把细则核对一眼再动手。
$ZK
#币安公告
$BNB
币安这个:Security Incident | Recovery Update #5: October 31st PoR Snapshot Now Fully Verifiable by Users as ZK Proof Generated (2026-11-02)
X 上 X@binancezh 是这么说的:安全事件恢复进展#5:10月31日储备金证明快照的零知识证明已生成,用户现可自行独立验证;提现仍分阶段恢复,谨防冒充币安索要加速提现费用的诈骗
我的看法:值不值得上,我先算账——奖池除以预估参与人数,再看门槛,算下来不划算的直接跳过。想参与的去原文把细则核对一眼再动手。
$ZK
#币安公告
$BNB
X 上 X@binancezh 是这么说的:安全事件恢复进展#5:10月31日储备金证明快照的零知识证明已生成,用户现可自行独立验证;提现仍分阶段恢复,谨防冒充币安索要加速提现费用的诈骗
我的看法:值不值得上,我先算账——奖池除以预估参与人数,再看门槛,算下来不划算的直接跳过。想参与的去原文把细则核对一眼再动手。
$ZK
#币安公告
$BNB
238

·
--
致新世界新人类~“表态不是证明”
币安称已用自有资金覆盖约63亿美元被盗资产;CZ凌晨称,本次赔付「未借款、未卖资产、未融资」,全部来自资产负债表;资金已100%划拨,仅剩约5%需换成部分小币种(均为官方表态,待核实)。
话说得很满。能不能站住,要看另一份东西。
那份东西叫储备证明。币安发布Recovery Update #5:10月31日储备证明(PoR)快照可由用户自行验证。何一称该快照的零知识证明已生成,覆盖BTC、ETH、USDT、BNB、SOL、USDC、XRP、USD1、RLUSD、ZEC十个币种。
这是进步。表态由交易所说,证明可以由用户验。
但证明有边界。PoR证明的是某一时点资产能否覆盖用户负债,不是一份完整审计;零知识证明解决的是隐私与可验证,不替代会计结论。
何一同时说「币安没有资金缺口」,仍需把部分稳定币和BTC换成几个山寨币(待核实)。这句话本身提示了一件事:缺的可能不是总额,而是币种结构。
总额够,不等于每一种币都够。
她回应土耳其用户时也说明,DefiLlama的储备按PoR地址乘以当日币价折成美元,降幅里含有币价因素(拆分待核实)。所以该看的不是美元数字,而是BTC、USDT等储备的数量变化。
美元计价会随行情摇晃,币的数量不会。
「无资金缺口」是事实还是表态,取决于三件事能否互相印证:数量口径的储备变化、可验证的PoR快照、后续兑换完成的披露。三者对上,它是事实;对不上,它只是一句话。
以上仅为信息与观点分享,不构成投资建议。
一言既出待凭验,
快照能查数要真。
莫将美价当存量,
币数对齐始服人。
—— 明道
致新世界新人类~“表态不是证明”
币安称已用自有资金覆盖约63亿美元被盗资产;CZ凌晨称,本次赔付「未借款、未卖资产、未融资」,全部来自资产负债表;资金已100%划拨,仅剩约5%需换成部分小币种(均为官方表态,待核实)。
话说得很满。能不能站住,要看另一份东西。
那份东西叫储备证明。币安发布Recovery Update #5:10月31日储备证明(PoR)快照可由用户自行验证。何一称该快照的零知识证明已生成,覆盖BTC、ETH、USDT、BNB、SOL、USDC、XRP、USD1、RLUSD、ZEC十个币种。
这是进步。表态由交易所说,证明可以由用户验。
但证明有边界。PoR证明的是某一时点资产能否覆盖用户负债,不是一份完整审计;零知识证明解决的是隐私与可验证,不替代会计结论。
何一同时说「币安没有资金缺口」,仍需把部分稳定币和BTC换成几个山寨币(待核实)。这句话本身提示了一件事:缺的可能不是总额,而是币种结构。
总额够,不等于每一种币都够。
她回应土耳其用户时也说明,DefiLlama的储备按PoR地址乘以当日币价折成美元,降幅里含有币价因素(拆分待核实)。所以该看的不是美元数字,而是BTC、USDT等储备的数量变化。
美元计价会随行情摇晃,币的数量不会。
「无资金缺口」是事实还是表态,取决于三件事能否互相印证:数量口径的储备变化、可验证的PoR快照、后续兑换完成的披露。三者对上,它是事实;对不上,它只是一句话。
以上仅为信息与观点分享,不构成投资建议。
一言既出待凭验,
快照能查数要真。
莫将美价当存量,
币数对齐始服人。
—— 明道
币安称已用自有资金覆盖约63亿美元被盗资产;CZ凌晨称,本次赔付「未借款、未卖资产、未融资」,全部来自资产负债表;资金已100%划拨,仅剩约5%需换成部分小币种(均为官方表态,待核实)。
话说得很满。能不能站住,要看另一份东西。
那份东西叫储备证明。币安发布Recovery Update #5:10月31日储备证明(PoR)快照可由用户自行验证。何一称该快照的零知识证明已生成,覆盖BTC、ETH、USDT、BNB、SOL、USDC、XRP、USD1、RLUSD、ZEC十个币种。
这是进步。表态由交易所说,证明可以由用户验。
但证明有边界。PoR证明的是某一时点资产能否覆盖用户负债,不是一份完整审计;零知识证明解决的是隐私与可验证,不替代会计结论。
何一同时说「币安没有资金缺口」,仍需把部分稳定币和BTC换成几个山寨币(待核实)。这句话本身提示了一件事:缺的可能不是总额,而是币种结构。
总额够,不等于每一种币都够。
她回应土耳其用户时也说明,DefiLlama的储备按PoR地址乘以当日币价折成美元,降幅里含有币价因素(拆分待核实)。所以该看的不是美元数字,而是BTC、USDT等储备的数量变化。
美元计价会随行情摇晃,币的数量不会。
「无资金缺口」是事实还是表态,取决于三件事能否互相印证:数量口径的储备变化、可验证的PoR快照、后续兑换完成的披露。三者对上,它是事实;对不上,它只是一句话。
以上仅为信息与观点分享,不构成投资建议。
一言既出待凭验,
快照能查数要真。
莫将美价当存量,
币数对齐始服人。
—— 明道
350
Войдите, чтобы посмотреть больше материала
Присоединяйтесь к пользователям криптовалют по всему миру на Binance Square
⚡️ Получайте новейшую и полезную информацию о криптоактивах.
💬 Нам доверяет крупнейшая в мире криптобиржа.
👍 Получите достоверные аналитические данные от верифицированных создателей контента.
Эл. почта/номер телефона
В тренде
1
#BinanceIncidentReport
Просмотров: 5,373
245 обсуждают
2
#BinanceReopensWithdrawalsForMoreAssets
Просмотров: 99,107
1,540 обсуждают
3
#BinanceHourlyDepositsExceedWithdrawals
Просмотров: 45,794
669 обсуждают
4
#USMidtermElections
Просмотров: 825,486
4,443 обсуждают
5
#AnthropicIPOPricedDownasInvestorsEye$1.5T
Просмотров: 1,544
39 обсуждают
6
#USOctoberNFP-AreRateCutsStillPossible
Просмотров: 151,666
1,198 обсуждают
7
#AppleReportsMixedResults
Просмотров: 50,471
936 обсуждают
8
#PalantirSlides3PercentOn$2BRevenue
Просмотров: 3,270
40 обсуждают
9
#FrenchAssemblyRejectsTwoCryptoExitTaxProposals
Просмотров: 6,987
160 обсуждают
10
#Nasdaq100EntersCorrection
Просмотров: 11,259
169 обсуждают