
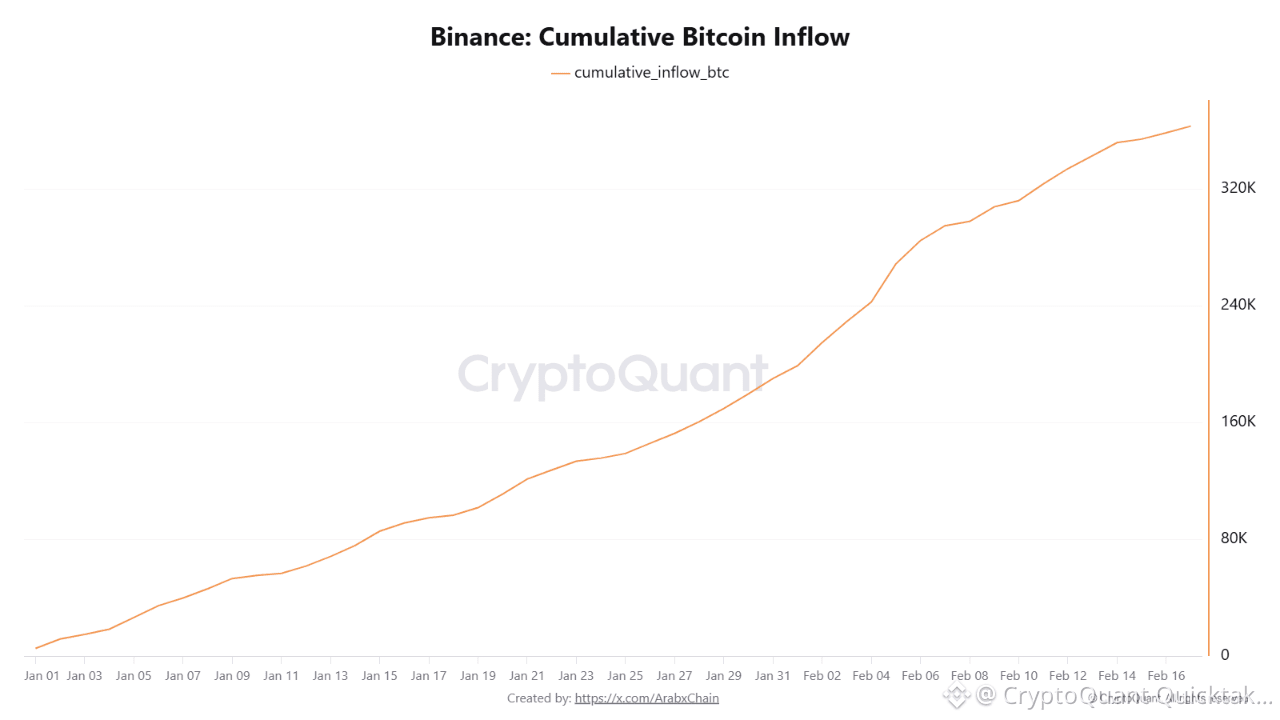
Binance's cumulative Bitcoin inflow data paints a clear picture of the volume of inflows into the platform since the beginning of 2026. The cumulative inflow has reached approximately 363,328 BTC since January 1, a figure that reflects high activity over a relatively short period of just seven weeks.
The cumulative curve follows a consistent upward trajectory, indicating that the inflows were not the result of a single exceptional event, but rather occurred in successive waves of deposits. The pace accelerated noticeably during late January and early February, with the curve rising more sharply, suggesting an increase in transfers from private wallets to the exchange.
Significant inflows to exchanges are typically interpreted as a sign of readiness to sell or to use Bitcoin for spot trading or derivatives. With inflows since the beginning of 2026 exceeding 363,000 BTC, this represents a potential supply increase that could impact market equilibrium, especially if it coincides with weak spot demand.
Conversely, increased inflows do not necessarily indicate immediate selling pressure. Some of these movements may be related to institutional repositioning, the use of Bitcoin as collateral in derivatives contracts, or the exploitation of price spreads between exchanges. Therefore, this indicator should be interpreted alongside other metrics such as net flows, spot trading volume, and open interest in derivatives.
The surge in inflows to Binance since the beginning of 2026 reflects an active and potentially volatile market environment, with growing amounts of Bitcoin available for trading. If this trend continues without clear absorption on the demand side, it could increase the likelihood of volatility, while a decline may signal a return to accumulation and a reduction in the supply available for sale.
Written by Arab Chain
