
Humaira Naseem
3 Publicações

Humaira Naseem
Denunciar
Bloquear Utilizador
Follow us for daily updates and analysis 🌹
1 A seguir
0 Seguidores
1 Gostaram
Publicações
·
--
$BTC 🚀 Previsão de Futuro
Curto Prazo (1–4 Semanas)
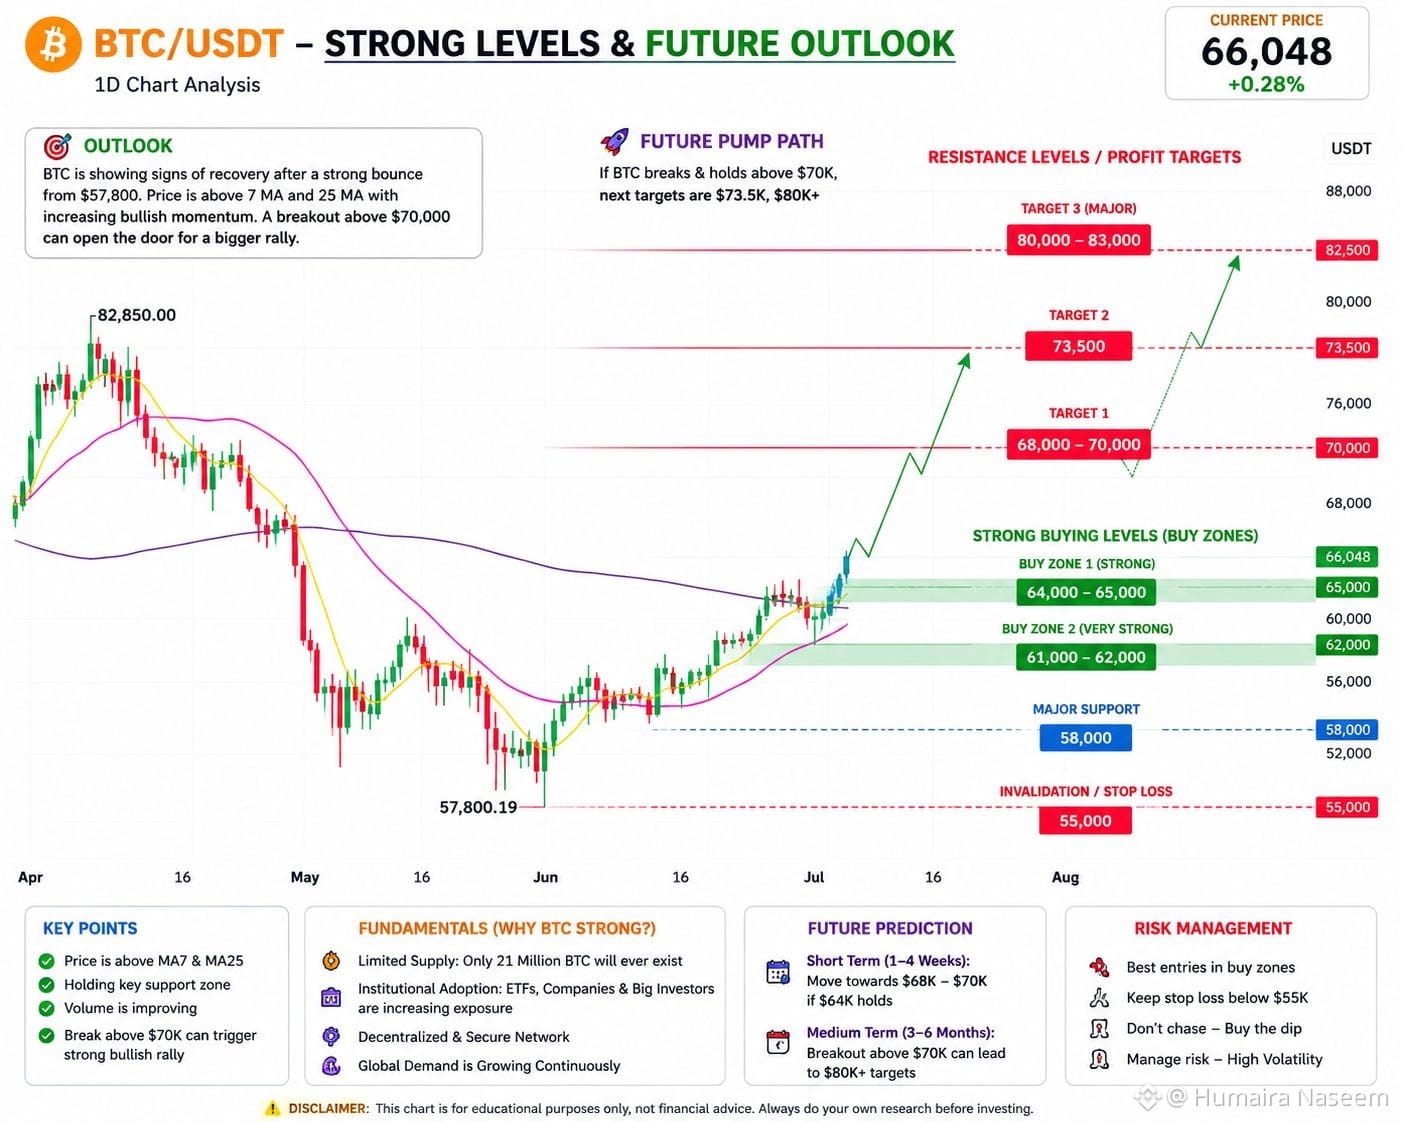
Se o Bitcoin se mantiver acima de US$ 64K, ele poderá tentar uma alta em direção a US$ 68K–US$ 70K. Uma ruptura acima de US$ 70K aumentaria a probabilidade de testar níveis de resistência mais altos. �
Investopedia +1
Médio Prazo (3–6 Meses)
Se a demanda institucional continuar saudável e os fluxos dos ETFs melhorarem, o Bitcoin poderá voltar a testar a faixa de US$ 80K+. Por outro lado, uma demanda mais fraca por ETFs ou condições macroeconômicas desfavoráveis podem levar a outra correção antes de uma alta sustentada
📊 BTC/USDT – Análise Técnica Curta (Gráfico de 1D)
O Bitcoin está sendo negociado atualmente por volta de US$ 66.000 após se recuperar da mínima de US$ 57.800. No seu gráfico diário, o BTC está acima das médias móveis de 7 dias e de 25 dias, mostrando um momentum de curto prazo melhorando. No entanto, ainda está abaixo da média móvel de 99 dias (~US$ 70.000), tornando essa região uma grande resistência que os touros precisam recuperar. Um fechamento diário acima da MM de 99 dias fortaleceria o cenário altista. Com base no gráfico, a estrutura geral está melhorando, mas ainda é necessária confirmação. (Esta é uma análise técnica, não uma garantia.)
💎 Fundamentos do Bitcoin
🏦 A adoção institucional continua sendo uma das maiores forças de longo prazo do Bitcoin, com grandes empresas financeiras e ETFs de Bitcoin à vista ampliando o acesso ao público. �
Kiplinger +1
📉 Oferta limitada: Apenas 21 milhões de BTC existirão, tornando o Bitcoin escasso por design.
🔒 Rede descentralizada: O Bitcoin é garantido por uma das maiores redes distribuídas de computação do mundo.
🌍 A adoção global continua se expandindo entre investidores, empresas e alguns governos, embora regulação e condições macroeconômicas ainda influenciem fortemente o preço. �
Wikipedia +1
⭐ Visão Geral
Tendência: Moderadamente Altista
Risco: Médio
Estratégia: Acumular perto dos níveis de suporte em vez de perseguir grandes velas verdes.
Avaliação geral: 8,8/10
{spot}(BTCUSDT)
$BTC 🚀 Previsão de Futuro
Curto Prazo (1–4 Semanas)
Se o Bitcoin se mantiver acima de US$ 64K, ele poderá tentar uma alta em direção a US$ 68K–US$ 70K. Uma ruptura acima de US$ 70K aumentaria a probabilidade de testar níveis de resistência mais altos. �
Investopedia +1
Médio Prazo (3–6 Meses)
Se a demanda institucional continuar saudável e os fluxos dos ETFs melhorarem, o Bitcoin poderá voltar a testar a faixa de US$ 80K+. Por outro lado, uma demanda mais fraca por ETFs ou condições macroeconômicas desfavoráveis podem levar a outra correção antes de uma alta sustentada
📊 BTC/USDT – Análise Técnica Curta (Gráfico de 1D)
O Bitcoin está sendo negociado atualmente por volta de US$ 66.000 após se recuperar da mínima de US$ 57.800. No seu gráfico diário, o BTC está acima das médias móveis de 7 dias e de 25 dias, mostrando um momentum de curto prazo melhorando. No entanto, ainda está abaixo da média móvel de 99 dias (~US$ 70.000), tornando essa região uma grande resistência que os touros precisam recuperar. Um fechamento diário acima da MM de 99 dias fortaleceria o cenário altista. Com base no gráfico, a estrutura geral está melhorando, mas ainda é necessária confirmação. (Esta é uma análise técnica, não uma garantia.)
💎 Fundamentos do Bitcoin
🏦 A adoção institucional continua sendo uma das maiores forças de longo prazo do Bitcoin, com grandes empresas financeiras e ETFs de Bitcoin à vista ampliando o acesso ao público. �
Kiplinger +1
📉 Oferta limitada: Apenas 21 milhões de BTC existirão, tornando o Bitcoin escasso por design.
🔒 Rede descentralizada: O Bitcoin é garantido por uma das maiores redes distribuídas de computação do mundo.
🌍 A adoção global continua se expandindo entre investidores, empresas e alguns governos, embora regulação e condições macroeconômicas ainda influenciem fortemente o preço. �
Wikipedia +1
⭐ Visão Geral
Tendência: Moderadamente Altista
Risco: Médio
Estratégia: Acumular perto dos níveis de suporte em vez de perseguir grandes velas verdes.
Avaliação geral: 8,8/10
Curto Prazo (1–4 Semanas)
Se o Bitcoin se mantiver acima de US$ 64K, ele poderá tentar uma alta em direção a US$ 68K–US$ 70K. Uma ruptura acima de US$ 70K aumentaria a probabilidade de testar níveis de resistência mais altos. �
Investopedia +1
Médio Prazo (3–6 Meses)
Se a demanda institucional continuar saudável e os fluxos dos ETFs melhorarem, o Bitcoin poderá voltar a testar a faixa de US$ 80K+. Por outro lado, uma demanda mais fraca por ETFs ou condições macroeconômicas desfavoráveis podem levar a outra correção antes de uma alta sustentada
📊 BTC/USDT – Análise Técnica Curta (Gráfico de 1D)
O Bitcoin está sendo negociado atualmente por volta de US$ 66.000 após se recuperar da mínima de US$ 57.800. No seu gráfico diário, o BTC está acima das médias móveis de 7 dias e de 25 dias, mostrando um momentum de curto prazo melhorando. No entanto, ainda está abaixo da média móvel de 99 dias (~US$ 70.000), tornando essa região uma grande resistência que os touros precisam recuperar. Um fechamento diário acima da MM de 99 dias fortaleceria o cenário altista. Com base no gráfico, a estrutura geral está melhorando, mas ainda é necessária confirmação. (Esta é uma análise técnica, não uma garantia.)
💎 Fundamentos do Bitcoin
🏦 A adoção institucional continua sendo uma das maiores forças de longo prazo do Bitcoin, com grandes empresas financeiras e ETFs de Bitcoin à vista ampliando o acesso ao público. �
Kiplinger +1
📉 Oferta limitada: Apenas 21 milhões de BTC existirão, tornando o Bitcoin escasso por design.
🔒 Rede descentralizada: O Bitcoin é garantido por uma das maiores redes distribuídas de computação do mundo.
🌍 A adoção global continua se expandindo entre investidores, empresas e alguns governos, embora regulação e condições macroeconômicas ainda influenciem fortemente o preço. �
Wikipedia +1
⭐ Visão Geral
Tendência: Moderadamente Altista
Risco: Médio
Estratégia: Acumular perto dos níveis de suporte em vez de perseguir grandes velas verdes.
Avaliação geral: 8,8/10
67
·
--
Em Alta
$EPIC 🚀 O EPIC Coin está pronto para seu próximo grande movimento? Não compre antes de ler isto!
EPIC/USDT – Análise Técnica Curta (Gráfico de 1D)
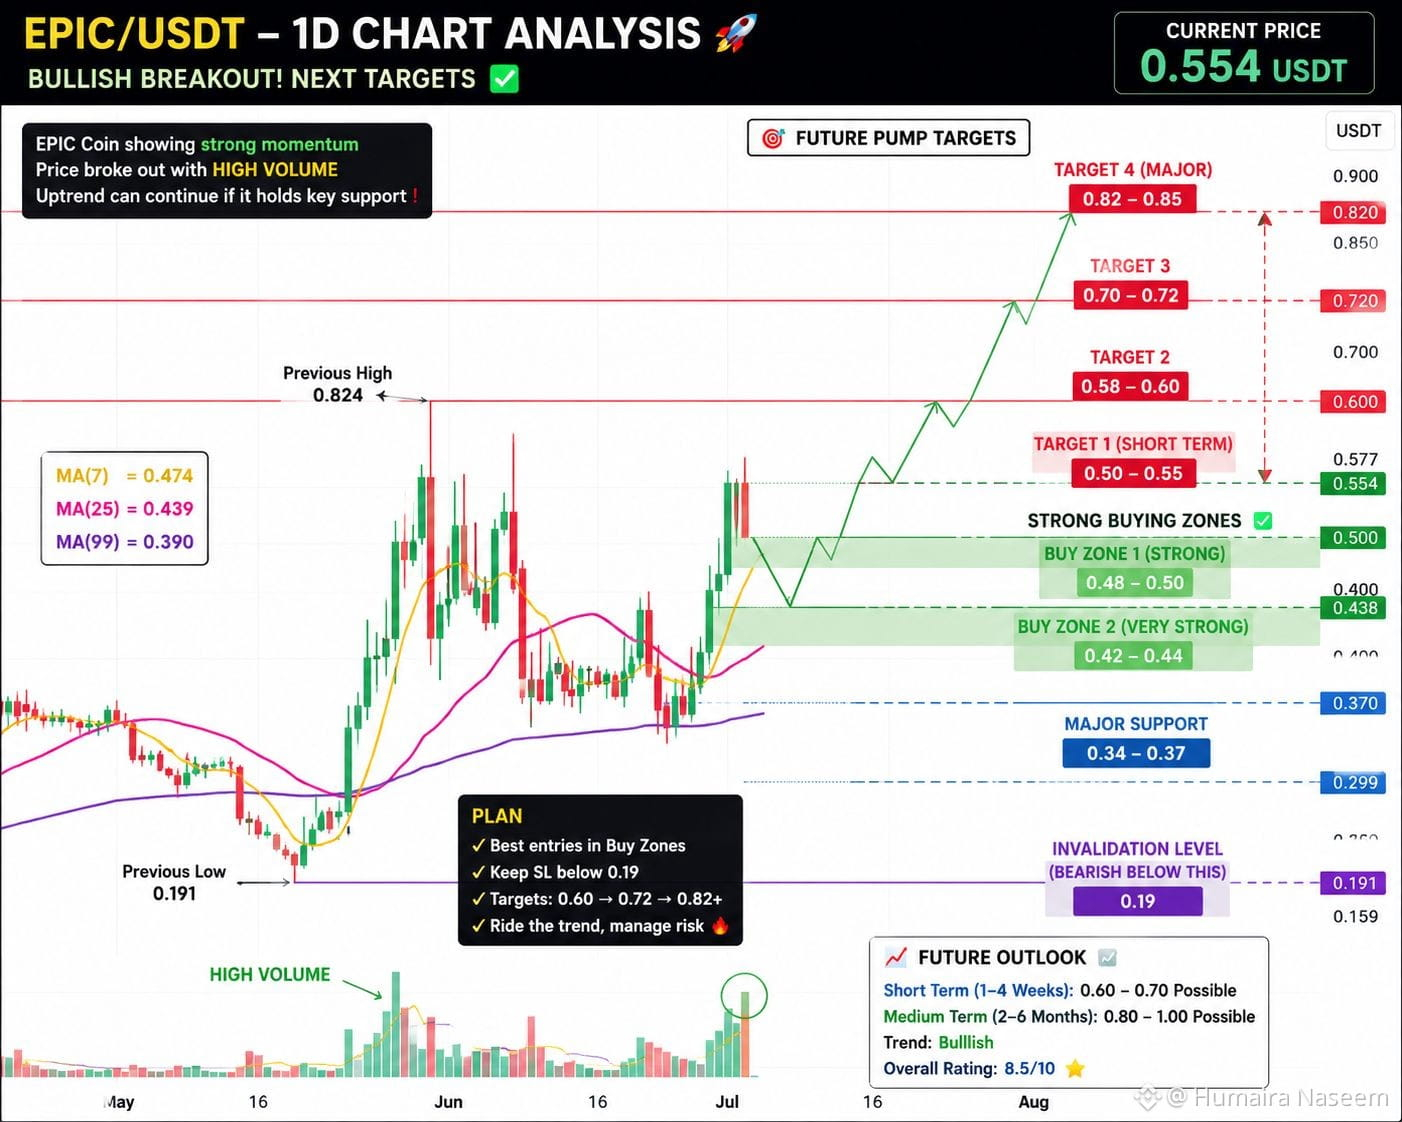
O EPIC mostrou um forte rompimento em alta, ganhando quase 20% em um único dia com aumento do volume de negociações. O preço está acima das médias móveis de 7 dias, 25 dias e 99 dias, o que é um sinal positivo e sugere que os compradores estão no controle.
No entanto, após uma alta forte, uma pequena correção no curto prazo é normal antes do próximo movimento para cima. Perseguir o preço atual pode ser arriscado.
📊 Níveis-Chave
🟢 Zona de Compra Forte 1:
US$ 0,48 – US$ 0,50
Melhor área se o preço testar novamente o suporte.
🟢 Zona de Compra Forte 2:
US$ 0,42 – US$ 0,44
Suporte forte próximo à média móvel de 25 dias.
🔴 Níveis de Resistência:
US$ 0,58 – US$ 0,60
US$ 0,70 – US$ 0,72
US$ 0,82 (Resistência Principal)
🎯 Previsão Futura
Curto Prazo (1–4 semanas):
Se o EPIC sustentar acima de US$ 0,50, ele pode testar US$ 0,60–US$ 0,70.
Médio Prazo (2–6 meses):
Se o Bitcoin continuar em alta e o volume de compras permanecer forte, o EPIC pode voltar para US$ 0,80–US$ 1,00.
Se o mercado enfraquecer, uma correção em direção a US$ 0,48 ou US$ 0,44 é possível antes de outro rali.
⭐ Visão Geral
Tendência: Em alta
Risco: Médio–Alto (moeda volátil)
Estratégia: Espere por uma correção nas zonas de compra em vez de comprar por FOMO após um grande candle verde.
Avaliação Geral: 8,5/10 (Em alta com gestão de risco saudável)
#dailyanalysis #Epic #Market_Update #pumpingsoon
{spot}(EPICUSDT)
$EPIC 🚀 O EPIC Coin está pronto para seu próximo grande movimento? Não compre antes de ler isto!
EPIC/USDT – Análise Técnica Curta (Gráfico de 1D)
O EPIC mostrou um forte rompimento em alta, ganhando quase 20% em um único dia com aumento do volume de negociações. O preço está acima das médias móveis de 7 dias, 25 dias e 99 dias, o que é um sinal positivo e sugere que os compradores estão no controle.
No entanto, após uma alta forte, uma pequena correção no curto prazo é normal antes do próximo movimento para cima. Perseguir o preço atual pode ser arriscado.
📊 Níveis-Chave
🟢 Zona de Compra Forte 1:
US$ 0,48 – US$ 0,50
Melhor área se o preço testar novamente o suporte.
🟢 Zona de Compra Forte 2:
US$ 0,42 – US$ 0,44
Suporte forte próximo à média móvel de 25 dias.
🔴 Níveis de Resistência:
US$ 0,58 – US$ 0,60
US$ 0,70 – US$ 0,72
US$ 0,82 (Resistência Principal)
🎯 Previsão Futura
Curto Prazo (1–4 semanas):
Se o EPIC sustentar acima de US$ 0,50, ele pode testar US$ 0,60–US$ 0,70.
Médio Prazo (2–6 meses):
Se o Bitcoin continuar em alta e o volume de compras permanecer forte, o EPIC pode voltar para US$ 0,80–US$ 1,00.
Se o mercado enfraquecer, uma correção em direção a US$ 0,48 ou US$ 0,44 é possível antes de outro rali.
⭐ Visão Geral
Tendência: Em alta
Risco: Médio–Alto (moeda volátil)
Estratégia: Espere por uma correção nas zonas de compra em vez de comprar por FOMO após um grande candle verde.
Avaliação Geral: 8,5/10 (Em alta com gestão de risco saudável)
#dailyanalysis #Epic #Market_Update #pumpingsoon
EPIC/USDT – Análise Técnica Curta (Gráfico de 1D)
O EPIC mostrou um forte rompimento em alta, ganhando quase 20% em um único dia com aumento do volume de negociações. O preço está acima das médias móveis de 7 dias, 25 dias e 99 dias, o que é um sinal positivo e sugere que os compradores estão no controle.
No entanto, após uma alta forte, uma pequena correção no curto prazo é normal antes do próximo movimento para cima. Perseguir o preço atual pode ser arriscado.
📊 Níveis-Chave
🟢 Zona de Compra Forte 1:
US$ 0,48 – US$ 0,50
Melhor área se o preço testar novamente o suporte.
🟢 Zona de Compra Forte 2:
US$ 0,42 – US$ 0,44
Suporte forte próximo à média móvel de 25 dias.
🔴 Níveis de Resistência:
US$ 0,58 – US$ 0,60
US$ 0,70 – US$ 0,72
US$ 0,82 (Resistência Principal)
🎯 Previsão Futura
Curto Prazo (1–4 semanas):
Se o EPIC sustentar acima de US$ 0,50, ele pode testar US$ 0,60–US$ 0,70.
Médio Prazo (2–6 meses):
Se o Bitcoin continuar em alta e o volume de compras permanecer forte, o EPIC pode voltar para US$ 0,80–US$ 1,00.
Se o mercado enfraquecer, uma correção em direção a US$ 0,48 ou US$ 0,44 é possível antes de outro rali.
⭐ Visão Geral
Tendência: Em alta
Risco: Médio–Alto (moeda volátil)
Estratégia: Espere por uma correção nas zonas de compra em vez de comprar por FOMO após um grande candle verde.
Avaliação Geral: 8,5/10 (Em alta com gestão de risco saudável)
#dailyanalysis #Epic #Market_Update #pumpingsoon
1
93
·
--
$NIGHT
Análise Curta da Moeda
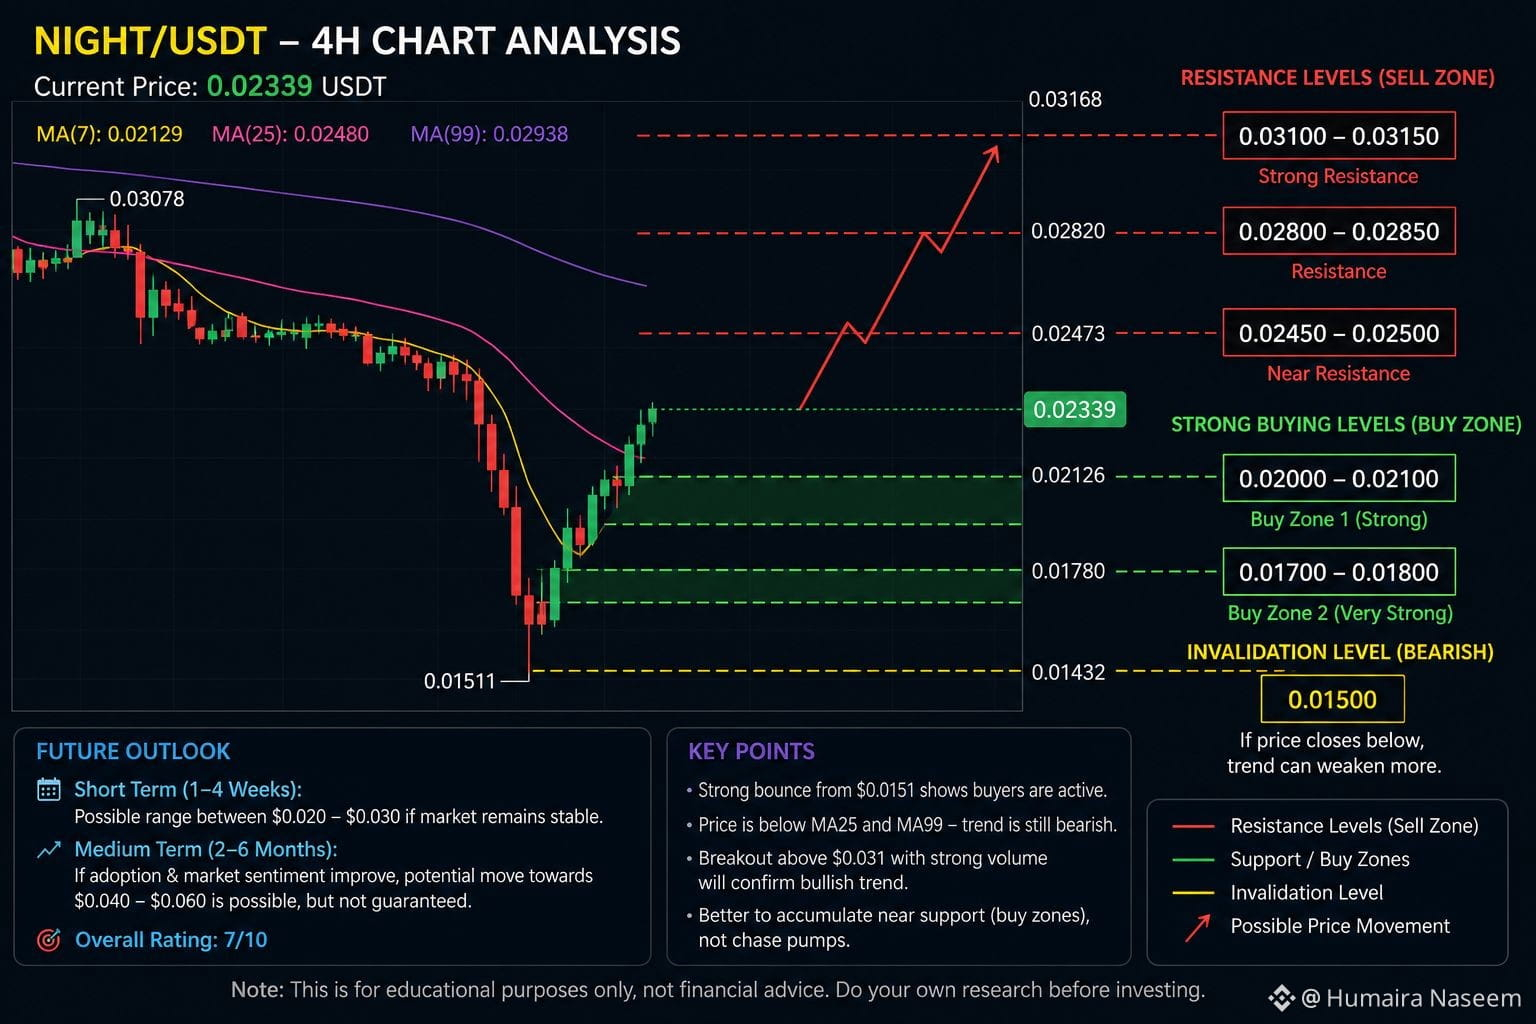
O preço recentemente caiu de cerca de US$ 0,0307 para US$ 0,0151 e depois fez uma forte recuperação.
Atualmente, ele está sendo negociado por volta de US$ 0,0234, mas ainda está abaixo da média móvel de 25 (25 MA) e da de 99 (99 MA), o que significa que a tendência maior ainda é de baixa.
A recuperação a partir de US$ 0,0151 mostra que compradores estão ativos, mas a moeda precisa romper a resistência para confirmar uma alta mais forte.
Midnight é um projeto de blockchain focado em privacidade usando tecnologia de zero-knowledge (provas de conhecimento zero), mas como muitos projetos cripto novos, permanece altamente volátil. �
Midnight Network +1
Níveis de Compra Fortes
🟢 Zona de Compra 1 (Forte):
US$ 0,0200 – US$ 0,0210
Bom se o preço recuar e segurar essa área.
🟢 Zona de Compra 2 (Muito Forte):
US$ 0,0170 – US$ 0,0180
Forte suporte histórico.
🔴 Invalidação:
Se o preço fechar abaixo de US$ 0,0150, a tendência pode ficar bem mais fraca.
Níveis de Resistência
US$ 0,0248
US$ 0,0280
US$ 0,0305 – US$ 0,0310
Uma ruptura acima de US$ 0,031 com volume forte seria um sinal de alta.
Previsão para o Futuro
Curto prazo (1–4 semanas): Possível faixa entre US$ 0,020 e US$ 0,030 se o mercado cripto permanecer estável.
Médio prazo (2–6 meses): Se a adoção e o sentimento do mercado melhorarem, um movimento em direção a US$ 0,04–US$ 0,06 é possível, mas não é garantido, pois este é um token de alto risco e alta volatilidade. �
CoinGecko +1
Avaliação Geral: 7/10
✅ Boas bases do projeto.
⚠️ Alta volatilidade.
💰 Melhor acumular perto dos níveis de suporte do que correr atrás de bombas.
#night #future #Bullrun #nextmove #pump #gainer
{spot}(NIGHTUSDT)
$NIGHT
Análise Curta da Moeda
O preço recentemente caiu de cerca de US$ 0,0307 para US$ 0,0151 e depois fez uma forte recuperação.
Atualmente, ele está sendo negociado por volta de US$ 0,0234, mas ainda está abaixo da média móvel de 25 (25 MA) e da de 99 (99 MA), o que significa que a tendência maior ainda é de baixa.
A recuperação a partir de US$ 0,0151 mostra que compradores estão ativos, mas a moeda precisa romper a resistência para confirmar uma alta mais forte.
Midnight é um projeto de blockchain focado em privacidade usando tecnologia de zero-knowledge (provas de conhecimento zero), mas como muitos projetos cripto novos, permanece altamente volátil. �
Midnight Network +1
Níveis de Compra Fortes
🟢 Zona de Compra 1 (Forte):
US$ 0,0200 – US$ 0,0210
Bom se o preço recuar e segurar essa área.
🟢 Zona de Compra 2 (Muito Forte):
US$ 0,0170 – US$ 0,0180
Forte suporte histórico.
🔴 Invalidação:
Se o preço fechar abaixo de US$ 0,0150, a tendência pode ficar bem mais fraca.
Níveis de Resistência
US$ 0,0248
US$ 0,0280
US$ 0,0305 – US$ 0,0310
Uma ruptura acima de US$ 0,031 com volume forte seria um sinal de alta.
Previsão para o Futuro
Curto prazo (1–4 semanas): Possível faixa entre US$ 0,020 e US$ 0,030 se o mercado cripto permanecer estável.
Médio prazo (2–6 meses): Se a adoção e o sentimento do mercado melhorarem, um movimento em direção a US$ 0,04–US$ 0,06 é possível, mas não é garantido, pois este é um token de alto risco e alta volatilidade. �
CoinGecko +1
Avaliação Geral: 7/10
✅ Boas bases do projeto.
⚠️ Alta volatilidade.
💰 Melhor acumular perto dos níveis de suporte do que correr atrás de bombas.
#night #future #Bullrun #nextmove #pump #gainer
Análise Curta da Moeda
O preço recentemente caiu de cerca de US$ 0,0307 para US$ 0,0151 e depois fez uma forte recuperação.
Atualmente, ele está sendo negociado por volta de US$ 0,0234, mas ainda está abaixo da média móvel de 25 (25 MA) e da de 99 (99 MA), o que significa que a tendência maior ainda é de baixa.
A recuperação a partir de US$ 0,0151 mostra que compradores estão ativos, mas a moeda precisa romper a resistência para confirmar uma alta mais forte.
Midnight é um projeto de blockchain focado em privacidade usando tecnologia de zero-knowledge (provas de conhecimento zero), mas como muitos projetos cripto novos, permanece altamente volátil. �
Midnight Network +1
Níveis de Compra Fortes
🟢 Zona de Compra 1 (Forte):
US$ 0,0200 – US$ 0,0210
Bom se o preço recuar e segurar essa área.
🟢 Zona de Compra 2 (Muito Forte):
US$ 0,0170 – US$ 0,0180
Forte suporte histórico.
🔴 Invalidação:
Se o preço fechar abaixo de US$ 0,0150, a tendência pode ficar bem mais fraca.
Níveis de Resistência
US$ 0,0248
US$ 0,0280
US$ 0,0305 – US$ 0,0310
Uma ruptura acima de US$ 0,031 com volume forte seria um sinal de alta.
Previsão para o Futuro
Curto prazo (1–4 semanas): Possível faixa entre US$ 0,020 e US$ 0,030 se o mercado cripto permanecer estável.
Médio prazo (2–6 meses): Se a adoção e o sentimento do mercado melhorarem, um movimento em direção a US$ 0,04–US$ 0,06 é possível, mas não é garantido, pois este é um token de alto risco e alta volatilidade. �
CoinGecko +1
Avaliação Geral: 7/10
✅ Boas bases do projeto.
⚠️ Alta volatilidade.
💰 Melhor acumular perto dos níveis de suporte do que correr atrás de bombas.
#night #future #Bullrun #nextmove #pump #gainer
99
Inicia sessão para explorar mais conteúdos
Junta-te a utilizadores de criptomoedas de todo o mundo na Binance Square
⚡️ Obtém informações úteis e recentes sobre criptomoedas.
💬 Com a confiança da maior exchange de criptomoedas do mundo.
👍 Descobre perspetivas reais de criadores verificados.
E-mail/Número de telefone
Tópicos em Tendência
CryptoLiquidations$674MIn24H
59 visualizações
12 a discutir
📉 ALERTA DE LIQUIDAÇÃO NO MERCADO: US$ 674M apagados em 24 horas
Dados da CoinGlass revelam uma volatilidade massiva nas últimas 24 horas, disparando US$ 674 milhões em liquidações forçadas em principais exchanges (Binance, Bybit, OKX).
📍 Detalhamento dos números:
Volume total liquidado: US$ 674,00 milhões
Liquidações de short: US$ 381,00 milhões (56,5% do total)
Liquidações de long: US$ 292,00 milhões (43,5% do total)
💡 Principais conclusões para traders:
Pressão do Short Squeeze: A forte concentração em liquidações de short (US$ 381M) sinaliza picos agressivos para cima varrendo bears alavancados antes da estabilização do preço.
Volatilidade de dois lados: Com traders de long também perdendo US$ 292M, o mercado sofreu caça a stops severa e pavios de liquidação em ambas as direções.
Ordens de mercado em cascata: Alta alavancagem em $BTC e$ETH acionou vendas automáticas forçadas no mercado, criando volatilidade rápida em efeito dominó.
💬 Debate do mercado:
Esse efeito em cascata de liquidações foi a descarga final de alavancagem antes de uma continuação de rompimento, ou estamos caminhando para uma queda mais profunda? Deixe sua opinião abaixo! 👇
Clique aqui para ver o gráfico 👇️
$XRP #CPIwatch #CryptoLiquidations$674MIn24H #RevolutConfirmsFakeGovEmailDataBreach #CanadaOSFISaysTokenizedDepositsEqualTraditionalDeposits #NvidiaInTalksToInvestUpTo$10BInAnthropicIPO
KimHotbae
·0 gostos
·41 visualizações
RevolutConfirmsFakeGovEmailDataBreach
3,280 visualizações
136 a discutir
CanadaOSFISaysTokenizedDepositsEqualTraditionalDeposits
417 visualizações
28 a discutir