

TraderSkills
7 Publicações

TraderSkills
Denunciar
Bloquear Utilizador
8 A seguir
14 Seguidores
3 Gostaram
Publicações
·
--
Siga-me para gráficos diários de cripto, atualizações de mercado e setups de trading. 📈🔥
$BNB
{spot}(BNBUSDT)
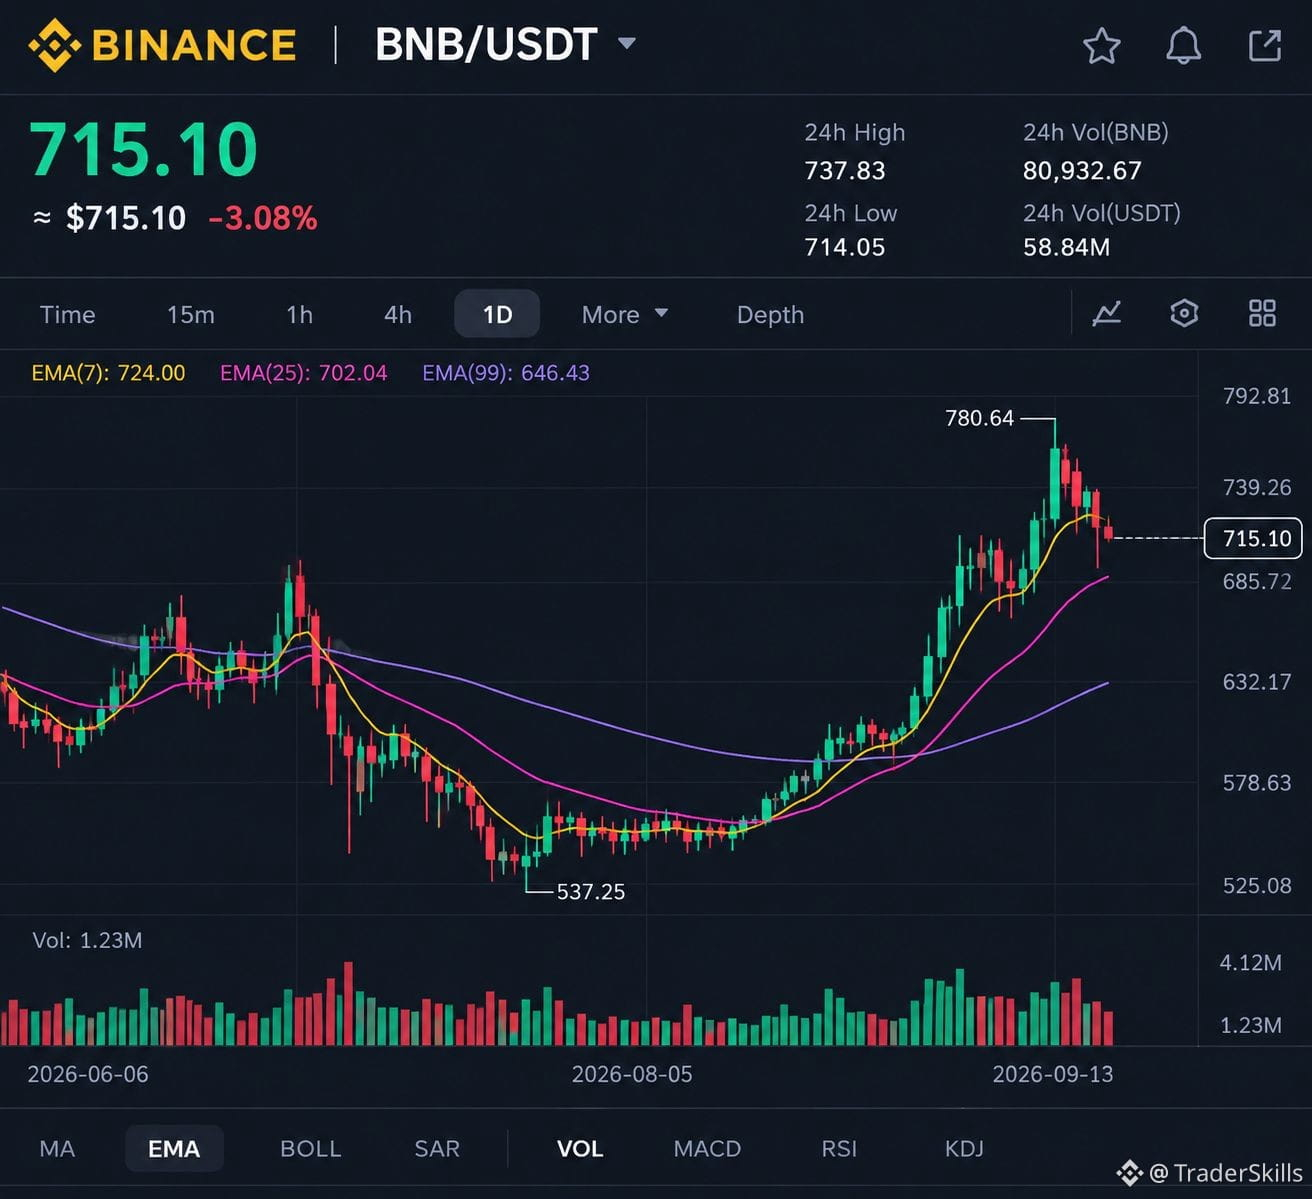
BNB/USDT :
1. Preço atual: 715.10 USDT.
2. O BNB está em queda de cerca de 3.08% nas últimas 24 horas.
3. O gráfico diário mostra uma forte tendência geral de alta.
4. EMA 7: 724 USDT — resistência de curto prazo.
5. EMA 25: 702.04 USDT — suporte-chave.
6. EMA 99: 646.43 USDT — suporte importante da tendência.
7. A resistência imediata está por volta de 737–740 USDT.
8. Uma alta acima de 740 pode mirar 750–780 USDT.
9. Uma queda abaixo de 700 pode trazer mais pressão vendedora.
10. Perspectiva: Alta acima de 700, mas observe a ruptura com atenção.
#SECReceivesGrayscaleLitecoinTrustETFFiling
Siga-me para gráficos diários de cripto, atualizações de mercado e setups de trading. 📈🔥
$BNB
BNB/USDT :
1. Preço atual: 715.10 USDT.
2. O BNB está em queda de cerca de 3.08% nas últimas 24 horas.
3. O gráfico diário mostra uma forte tendência geral de alta.
4. EMA 7: 724 USDT — resistência de curto prazo.
5. EMA 25: 702.04 USDT — suporte-chave.
6. EMA 99: 646.43 USDT — suporte importante da tendência.
7. A resistência imediata está por volta de 737–740 USDT.
8. Uma alta acima de 740 pode mirar 750–780 USDT.
9. Uma queda abaixo de 700 pode trazer mais pressão vendedora.
10. Perspectiva: Alta acima de 700, mas observe a ruptura com atenção.
#SECReceivesGrayscaleLitecoinTrustETFFiling
$BNB
BNB/USDT :
1. Preço atual: 715.10 USDT.
2. O BNB está em queda de cerca de 3.08% nas últimas 24 horas.
3. O gráfico diário mostra uma forte tendência geral de alta.
4. EMA 7: 724 USDT — resistência de curto prazo.
5. EMA 25: 702.04 USDT — suporte-chave.
6. EMA 99: 646.43 USDT — suporte importante da tendência.
7. A resistência imediata está por volta de 737–740 USDT.
8. Uma alta acima de 740 pode mirar 750–780 USDT.
9. Uma queda abaixo de 700 pode trazer mais pressão vendedora.
10. Perspectiva: Alta acima de 700, mas observe a ruptura com atenção.
#SECReceivesGrayscaleLitecoinTrustETFFiling
61
·
--
$ETH
{spot}(ETHUSDT)
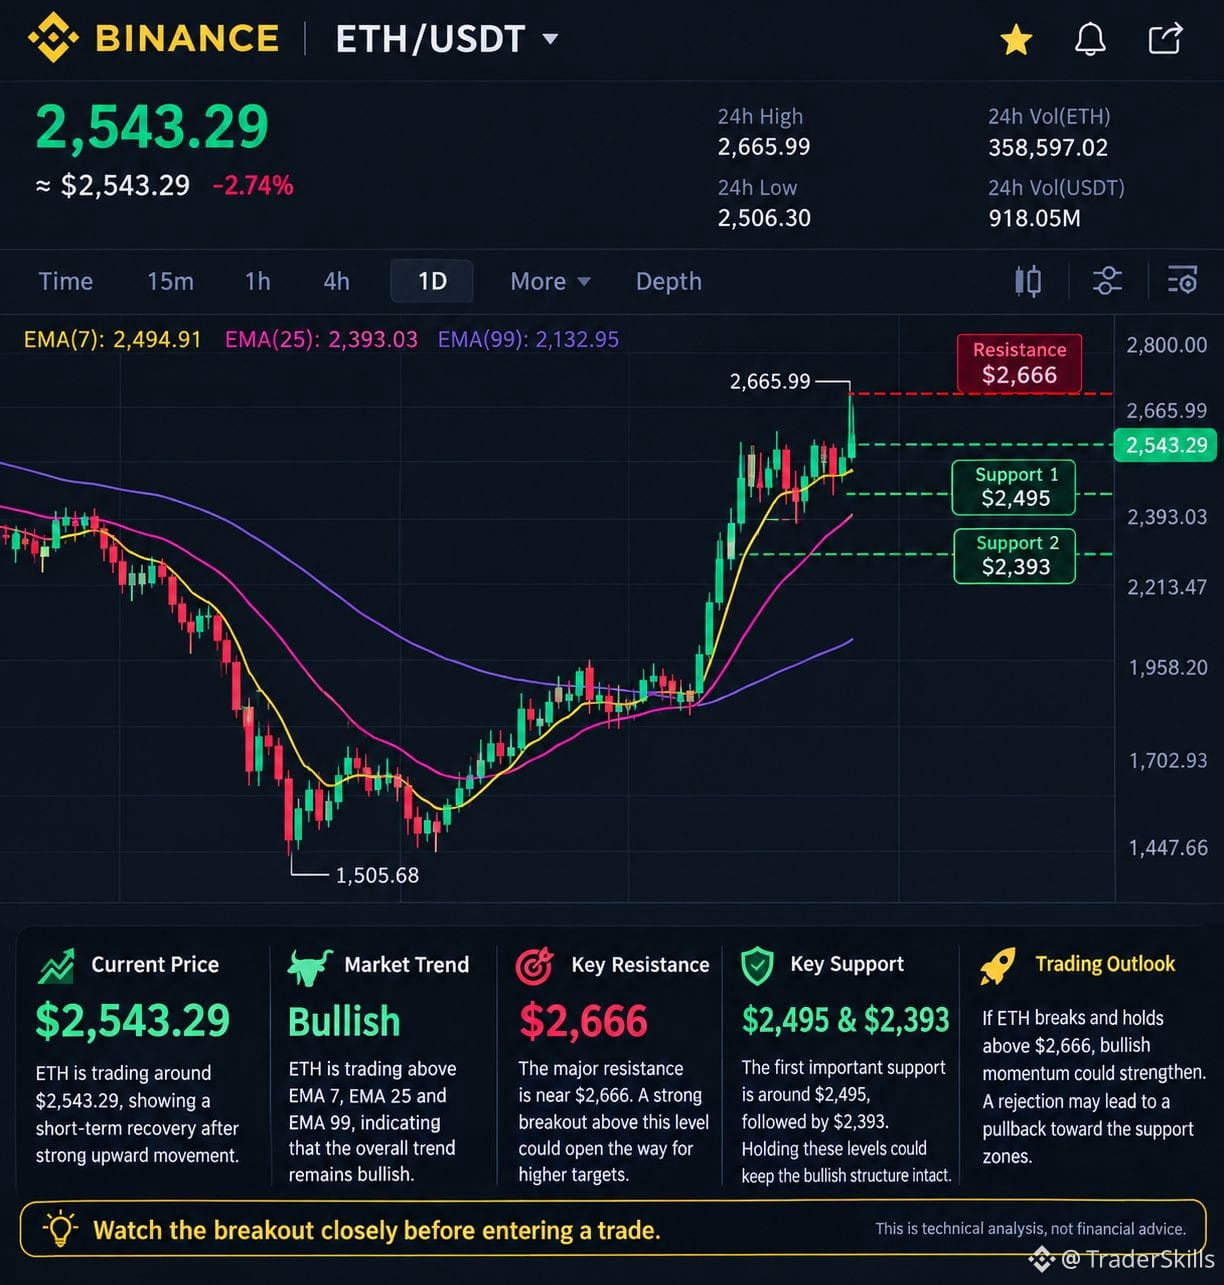
O ETH está sendo negociado a cerca de US$ 2.543,29.
📈 Tendência do Mercado
O Ethereum continua em alta no gráfico diário, com o preço acima dos principais níveis da EMA.
🎯 Resistência Principal
US$ 2.666 é o nível de resistência mais importante. Uma forte ruptura acima desta zona pode sinalizar mais alta.
🛡️ Suporte Principal
Níveis importantes de suporte ficam por volta de US$ 2.495 e US$ 2.393.
🔥 Perspectiva de Negociação
Se o ETH romper e se mantiver acima de US$ 2.666, o impulso comprador poderá se fortalecer. Uma rejeição pode levar a um recuo em direção às zonas de suporte.
Observe a ruptura de perto antes de entrar em uma negociação.
$ETH
O ETH está sendo negociado a cerca de US$ 2.543,29.
📈 Tendência do Mercado
O Ethereum continua em alta no gráfico diário, com o preço acima dos principais níveis da EMA.
🎯 Resistência Principal
US$ 2.666 é o nível de resistência mais importante. Uma forte ruptura acima desta zona pode sinalizar mais alta.
🛡️ Suporte Principal
Níveis importantes de suporte ficam por volta de US$ 2.495 e US$ 2.393.
🔥 Perspectiva de Negociação
Se o ETH romper e se mantiver acima de US$ 2.666, o impulso comprador poderá se fortalecer. Uma rejeição pode levar a um recuo em direção às zonas de suporte.
Observe a ruptura de perto antes de entrar em uma negociação.
O ETH está sendo negociado a cerca de US$ 2.543,29.
📈 Tendência do Mercado
O Ethereum continua em alta no gráfico diário, com o preço acima dos principais níveis da EMA.
🎯 Resistência Principal
US$ 2.666 é o nível de resistência mais importante. Uma forte ruptura acima desta zona pode sinalizar mais alta.
🛡️ Suporte Principal
Níveis importantes de suporte ficam por volta de US$ 2.495 e US$ 2.393.
🔥 Perspectiva de Negociação
Se o ETH romper e se mantiver acima de US$ 2.666, o impulso comprador poderá se fortalecer. Uma rejeição pode levar a um recuo em direção às zonas de suporte.
Observe a ruptura de perto antes de entrar em uma negociação.
53
·
--
$BTC
{spot}(BTCUSDT)
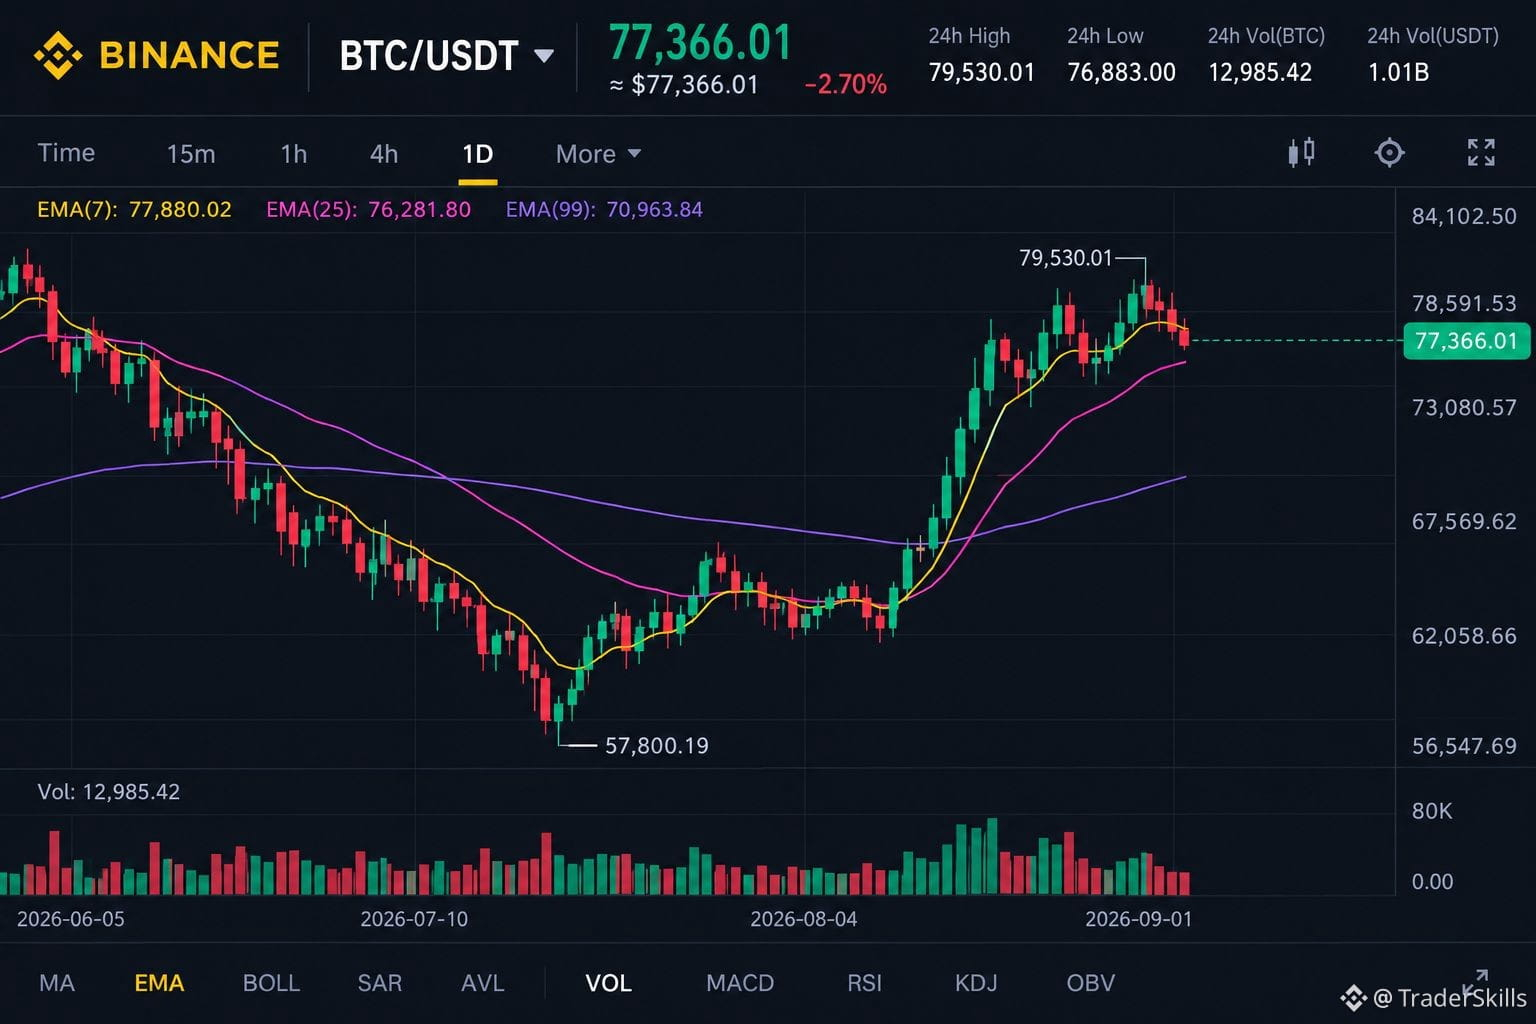
BTC/USDT
O Bitcoin está sendo negociado por volta de US$ 77.366, mostrando uma queda diária de 2,70%.
Tendência de Curto Prazo: O BTC está ligeiramente abaixo da EMA(7) em US$ 77.880, indicando fraqueza no curto prazo.
A EMA(25) próxima de US$ 76.282 é um nível importante de suporte a observar.
Suporte Principal: A faixa de US$ 73.080–US$ 76.280 pode oferecer um interesse maior de compra caso a retração continue.
Suporte de Longo Prazo: A EMA(99 em US$ 70.964) permanece bem abaixo do preço, mantendo a tendência geral relativamente forte.
Resistência: O BTC enfrenta resistência imediata em torno de US$ 78.600, seguida da máxima recente em US$ 79.530.
Rompimento de Alta: Um movimento forte acima de US$ 79.530 pode abrir caminho para a região de US$ 82.850.
Risco de Baixa: Uma quebra decisiva abaixo de US$ 76.282 pode aumentar a pressão de venda em direção a US$ 73.080.
Estrutura de Mercado: O gráfico mostra uma alta anterior poderosa, seguida por consolidação e uma retração.
Trading View: O BTC continua cautelosamente em alta acima de US$ 76.282, mas os traders devem aguardar confirmação antes de assumir uma posição relevante.
$BTC
BTC/USDT
O Bitcoin está sendo negociado por volta de US$ 77.366, mostrando uma queda diária de 2,70%.
Tendência de Curto Prazo: O BTC está ligeiramente abaixo da EMA(7) em US$ 77.880, indicando fraqueza no curto prazo.
A EMA(25) próxima de US$ 76.282 é um nível importante de suporte a observar.
Suporte Principal: A faixa de US$ 73.080–US$ 76.280 pode oferecer um interesse maior de compra caso a retração continue.
Suporte de Longo Prazo: A EMA(99 em US$ 70.964) permanece bem abaixo do preço, mantendo a tendência geral relativamente forte.
Resistência: O BTC enfrenta resistência imediata em torno de US$ 78.600, seguida da máxima recente em US$ 79.530.
Rompimento de Alta: Um movimento forte acima de US$ 79.530 pode abrir caminho para a região de US$ 82.850.
Risco de Baixa: Uma quebra decisiva abaixo de US$ 76.282 pode aumentar a pressão de venda em direção a US$ 73.080.
Estrutura de Mercado: O gráfico mostra uma alta anterior poderosa, seguida por consolidação e uma retração.
Trading View: O BTC continua cautelosamente em alta acima de US$ 76.282, mas os traders devem aguardar confirmação antes de assumir uma posição relevante.
BTC/USDT
O Bitcoin está sendo negociado por volta de US$ 77.366, mostrando uma queda diária de 2,70%.
Tendência de Curto Prazo: O BTC está ligeiramente abaixo da EMA(7) em US$ 77.880, indicando fraqueza no curto prazo.
A EMA(25) próxima de US$ 76.282 é um nível importante de suporte a observar.
Suporte Principal: A faixa de US$ 73.080–US$ 76.280 pode oferecer um interesse maior de compra caso a retração continue.
Suporte de Longo Prazo: A EMA(99 em US$ 70.964) permanece bem abaixo do preço, mantendo a tendência geral relativamente forte.
Resistência: O BTC enfrenta resistência imediata em torno de US$ 78.600, seguida da máxima recente em US$ 79.530.
Rompimento de Alta: Um movimento forte acima de US$ 79.530 pode abrir caminho para a região de US$ 82.850.
Risco de Baixa: Uma quebra decisiva abaixo de US$ 76.282 pode aumentar a pressão de venda em direção a US$ 73.080.
Estrutura de Mercado: O gráfico mostra uma alta anterior poderosa, seguida por consolidação e uma retração.
Trading View: O BTC continua cautelosamente em alta acima de US$ 76.282, mas os traders devem aguardar confirmação antes de assumir uma posição relevante.
1
3
2.7k
·
--
$ZEC (me siga)
{spot}(ZECUSDT)
🚀 Momento de Alta ZEC/USDT
A Zcash (ZEC) está mostrando forte momento de alta, negociando por volta de US$ 1.143,30, com um impressionante ganho de +8,18% nas últimas 24 horas. O gráfico diário mostra o preço sustentando acima da EMA(7) em US$ 1.126,54, enquanto as EMAs(25) e(99) permanecem bem mais baixas, apoiando a tendência de alta mais ampla.
📈 Níveis-Chave
Preço Atual: US$ 1.143,30
Máxima 24H: US$ 1.217,77
Mínima 24H: US$ 1.054,48
Resistência: US$ 1.217–US$ 1.296
Suporte de Curto Prazo: Por volta de US$ 1.125
Suporte Principal: Por volta de US$ 940
EMA(7): US$ 1.126,54
EMA(25): US$ 940,03
EMA(99): US$ 658,46
🔥 Perspectiva de Trading
Uma ruptura acima de US$ 1.218 pode abrir caminho para US$ 1.250–US$ 1.296.
Se a ZEC se mantiver acima de US$ 1.125, o momento de alta pode continuar intacto.
Uma queda abaixo de US$ 1.125 pode provocar um recuo mais profundo em direção a zonas de suporte mais baixas.
Use sempre stop-loss e gerencie o risco — os preços das criptos podem se mover rapidamente em qualquer direção.
#CPIWatch
#BNBTops730USDT
#BitcoinOpenInterestShareRisesTo42.1%
$ZEC (me siga)
🚀 Momento de Alta ZEC/USDT
A Zcash (ZEC) está mostrando forte momento de alta, negociando por volta de US$ 1.143,30, com um impressionante ganho de +8,18% nas últimas 24 horas. O gráfico diário mostra o preço sustentando acima da EMA(7) em US$ 1.126,54, enquanto as EMAs(25) e(99) permanecem bem mais baixas, apoiando a tendência de alta mais ampla.
📈 Níveis-Chave
Preço Atual: US$ 1.143,30
Máxima 24H: US$ 1.217,77
Mínima 24H: US$ 1.054,48
Resistência: US$ 1.217–US$ 1.296
Suporte de Curto Prazo: Por volta de US$ 1.125
Suporte Principal: Por volta de US$ 940
EMA(7): US$ 1.126,54
EMA(25): US$ 940,03
EMA(99): US$ 658,46
🔥 Perspectiva de Trading
Uma ruptura acima de US$ 1.218 pode abrir caminho para US$ 1.250–US$ 1.296.
Se a ZEC se mantiver acima de US$ 1.125, o momento de alta pode continuar intacto.
Uma queda abaixo de US$ 1.125 pode provocar um recuo mais profundo em direção a zonas de suporte mais baixas.
Use sempre stop-loss e gerencie o risco — os preços das criptos podem se mover rapidamente em qualquer direção.
#CPIWatch
#BNBTops730USDT
#BitcoinOpenInterestShareRisesTo42.1%
🚀 Momento de Alta ZEC/USDT
A Zcash (ZEC) está mostrando forte momento de alta, negociando por volta de US$ 1.143,30, com um impressionante ganho de +8,18% nas últimas 24 horas. O gráfico diário mostra o preço sustentando acima da EMA(7) em US$ 1.126,54, enquanto as EMAs(25) e(99) permanecem bem mais baixas, apoiando a tendência de alta mais ampla.
📈 Níveis-Chave
Preço Atual: US$ 1.143,30
Máxima 24H: US$ 1.217,77
Mínima 24H: US$ 1.054,48
Resistência: US$ 1.217–US$ 1.296
Suporte de Curto Prazo: Por volta de US$ 1.125
Suporte Principal: Por volta de US$ 940
EMA(7): US$ 1.126,54
EMA(25): US$ 940,03
EMA(99): US$ 658,46
🔥 Perspectiva de Trading
Uma ruptura acima de US$ 1.218 pode abrir caminho para US$ 1.250–US$ 1.296.
Se a ZEC se mantiver acima de US$ 1.125, o momento de alta pode continuar intacto.
Uma queda abaixo de US$ 1.125 pode provocar um recuo mais profundo em direção a zonas de suporte mais baixas.
Use sempre stop-loss e gerencie o risco — os preços das criptos podem se mover rapidamente em qualquer direção.
#CPIWatch
#BNBTops730USDT
#BitcoinOpenInterestShareRisesTo42.1%

130
·
--
$ETH (siga-me)
{spot}(ETHUSDT)
Análise ETH/USDT — 11 de setembro de 2026
📈 Situação atual do mercado
Ethereum (ETH/USDT) está sendo negociado por volta de US$ 2.613,31, mostrando um forte ganho de 7,23% nas últimas 24 horas. O gráfico diário indica forte momento de compra.
🔥 Tendência de alta
O ETH está acima da EMA 7 em US$ 2.503, o que sustenta a tendência de alta no curto prazo. A EMA 25 em US$ 2.387,96 também está atuando como um suporte importante no médio prazo.
🛡️ Suporte-chave
O nível de suporte mais importante está por volta de US$ 2.500. Se o ETH permanecer acima desse nível, a estrutura de alta poderá continuar.
🚀 Resistência-chave
A resistência imediata está perto de US$ 2.665,99. Uma ruptura confirmada acima de US$ 2.665 pode abrir caminho para US$ 2.724.
⚠️ Risco de correção
Se o ETH não conseguir romper a resistência e cair abaixo de US$ 2.500, poderá ocorrer um recuo na direção de US$ 2.388.
🎯 Visão final
No geral, ETH/USDT continua em alta acima de US$ 2.500. Os traders devem observar de perto a zona de resistência de US$ 2.665–US$ 2.724 para o próximo grande movimento de preço.
Esta análise é apenas para fins educacionais e não constitui aconselhamento financeiro.
$ETH (siga-me)
Análise ETH/USDT — 11 de setembro de 2026
📈 Situação atual do mercado
Ethereum (ETH/USDT) está sendo negociado por volta de US$ 2.613,31, mostrando um forte ganho de 7,23% nas últimas 24 horas. O gráfico diário indica forte momento de compra.
🔥 Tendência de alta
O ETH está acima da EMA 7 em US$ 2.503, o que sustenta a tendência de alta no curto prazo. A EMA 25 em US$ 2.387,96 também está atuando como um suporte importante no médio prazo.
🛡️ Suporte-chave
O nível de suporte mais importante está por volta de US$ 2.500. Se o ETH permanecer acima desse nível, a estrutura de alta poderá continuar.
🚀 Resistência-chave
A resistência imediata está perto de US$ 2.665,99. Uma ruptura confirmada acima de US$ 2.665 pode abrir caminho para US$ 2.724.
⚠️ Risco de correção
Se o ETH não conseguir romper a resistência e cair abaixo de US$ 2.500, poderá ocorrer um recuo na direção de US$ 2.388.
🎯 Visão final
No geral, ETH/USDT continua em alta acima de US$ 2.500. Os traders devem observar de perto a zona de resistência de US$ 2.665–US$ 2.724 para o próximo grande movimento de preço.
Esta análise é apenas para fins educacionais e não constitui aconselhamento financeiro.
Análise ETH/USDT — 11 de setembro de 2026
📈 Situação atual do mercado
Ethereum (ETH/USDT) está sendo negociado por volta de US$ 2.613,31, mostrando um forte ganho de 7,23% nas últimas 24 horas. O gráfico diário indica forte momento de compra.
🔥 Tendência de alta
O ETH está acima da EMA 7 em US$ 2.503, o que sustenta a tendência de alta no curto prazo. A EMA 25 em US$ 2.387,96 também está atuando como um suporte importante no médio prazo.
🛡️ Suporte-chave
O nível de suporte mais importante está por volta de US$ 2.500. Se o ETH permanecer acima desse nível, a estrutura de alta poderá continuar.
🚀 Resistência-chave
A resistência imediata está perto de US$ 2.665,99. Uma ruptura confirmada acima de US$ 2.665 pode abrir caminho para US$ 2.724.
⚠️ Risco de correção
Se o ETH não conseguir romper a resistência e cair abaixo de US$ 2.500, poderá ocorrer um recuo na direção de US$ 2.388.
🎯 Visão final
No geral, ETH/USDT continua em alta acima de US$ 2.500. Os traders devem observar de perto a zona de resistência de US$ 2.665–US$ 2.724 para o próximo grande movimento de preço.
Esta análise é apenas para fins educacionais e não constitui aconselhamento financeiro.

74
·
--
$BNB
{spot}(BNBUSDT)
🚀 PREVISÃO DE PREÇO BNB/USDT
📅 11 de setembro de 2026
1️⃣ Configuração Atual do Mercado
A BNB está sendo negociada perto de US$ 714,88, mostrando uma retração saudável após uma forte alta em sequência.
2️⃣ 📈 Perspectiva da Tendência
A estrutura geral continua otimista enquanto a BNB permanecer acima da importante zona de suporte de US$ 697–US$ 700.
3️⃣ 🔥 Resistência Principal
O primeiro grande obstáculo é a faixa de US$ 723–US$ 730. Os touros precisam romper essa zona com forte momentum.
4️⃣ 🎯 Primeiro Objetivo de Alta
Uma quebra confirmada acima de US$ 730 pode levar a BNB em direção a US$ 760–US$ 780.
5️⃣ 🚀 Objetivo Principal
Se a BNB romper a máxima anterior perto de US$ 780,64, o próximo alvo psicológico pode ser US$ 800+.
6️⃣ 🛡️ Suporte Importante
O nível de US$ 700 é crucial. Manter essa área pode dar aos compradores outra oportunidade de avançar mais.
7️⃣ ⚠️ Cenário de Baixa
Uma quebra decisiva abaixo de US$ 685 pode aumentar a pressão de venda e abrir caminho para US$ 640.
8️⃣ 💎 Estratégia de Negociação
Em vez de correr atrás de uma alta repentina, os traders podem observar uma quebra confirmada ou um forte repique a partir do suporte.
9️⃣ 👀 O que Observar
O próximo movimento da BNB também vai depender do Bitcoin, do volume negociado e do sentimento geral do mercado cripto.
🔟 🏆 Previsão Final
A BNB parece cautelosamente otimista acima de US$ 700. Uma quebra acima de US$ 730 pode mirar US$ 760–US$ 780, enquanto perder US$ 685 enfraqueceria o cenário otimista.
📊 NÍVEIS-CHAVE
Resistência: US$ 723–US$ 730
Alvo 1: US$ 760
Alvo 2: US$ 780
Alvo Principal: US$ 800+
Suporte: US$ 700 / US$ 685 / US$ 640
⚠️ Aviso Legal: Esta é uma análise técnica apenas para fins educacionais, não é aconselhamento financeiro. Os mercados de cripto são altamente voláteis.
#CPIWatch
#BitcoinGoldenCrossConfirms
#Top7AssetsHold92.1%OfCryptoTop100
#CryptoSectorsFallSecondDay
$BNB
🚀 PREVISÃO DE PREÇO BNB/USDT
📅 11 de setembro de 2026
1️⃣ Configuração Atual do Mercado
A BNB está sendo negociada perto de US$ 714,88, mostrando uma retração saudável após uma forte alta em sequência.
2️⃣ 📈 Perspectiva da Tendência
A estrutura geral continua otimista enquanto a BNB permanecer acima da importante zona de suporte de US$ 697–US$ 700.
3️⃣ 🔥 Resistência Principal
O primeiro grande obstáculo é a faixa de US$ 723–US$ 730. Os touros precisam romper essa zona com forte momentum.
4️⃣ 🎯 Primeiro Objetivo de Alta
Uma quebra confirmada acima de US$ 730 pode levar a BNB em direção a US$ 760–US$ 780.
5️⃣ 🚀 Objetivo Principal
Se a BNB romper a máxima anterior perto de US$ 780,64, o próximo alvo psicológico pode ser US$ 800+.
6️⃣ 🛡️ Suporte Importante
O nível de US$ 700 é crucial. Manter essa área pode dar aos compradores outra oportunidade de avançar mais.
7️⃣ ⚠️ Cenário de Baixa
Uma quebra decisiva abaixo de US$ 685 pode aumentar a pressão de venda e abrir caminho para US$ 640.
8️⃣ 💎 Estratégia de Negociação
Em vez de correr atrás de uma alta repentina, os traders podem observar uma quebra confirmada ou um forte repique a partir do suporte.
9️⃣ 👀 O que Observar
O próximo movimento da BNB também vai depender do Bitcoin, do volume negociado e do sentimento geral do mercado cripto.
🔟 🏆 Previsão Final
A BNB parece cautelosamente otimista acima de US$ 700. Uma quebra acima de US$ 730 pode mirar US$ 760–US$ 780, enquanto perder US$ 685 enfraqueceria o cenário otimista.
📊 NÍVEIS-CHAVE
Resistência: US$ 723–US$ 730
Alvo 1: US$ 760
Alvo 2: US$ 780
Alvo Principal: US$ 800+
Suporte: US$ 700 / US$ 685 / US$ 640
⚠️ Aviso Legal: Esta é uma análise técnica apenas para fins educacionais, não é aconselhamento financeiro. Os mercados de cripto são altamente voláteis.
#CPIWatch
#BitcoinGoldenCrossConfirms
#Top7AssetsHold92.1%OfCryptoTop100
#CryptoSectorsFallSecondDay
🚀 PREVISÃO DE PREÇO BNB/USDT
📅 11 de setembro de 2026
1️⃣ Configuração Atual do Mercado
A BNB está sendo negociada perto de US$ 714,88, mostrando uma retração saudável após uma forte alta em sequência.
2️⃣ 📈 Perspectiva da Tendência
A estrutura geral continua otimista enquanto a BNB permanecer acima da importante zona de suporte de US$ 697–US$ 700.
3️⃣ 🔥 Resistência Principal
O primeiro grande obstáculo é a faixa de US$ 723–US$ 730. Os touros precisam romper essa zona com forte momentum.
4️⃣ 🎯 Primeiro Objetivo de Alta
Uma quebra confirmada acima de US$ 730 pode levar a BNB em direção a US$ 760–US$ 780.
5️⃣ 🚀 Objetivo Principal
Se a BNB romper a máxima anterior perto de US$ 780,64, o próximo alvo psicológico pode ser US$ 800+.
6️⃣ 🛡️ Suporte Importante
O nível de US$ 700 é crucial. Manter essa área pode dar aos compradores outra oportunidade de avançar mais.
7️⃣ ⚠️ Cenário de Baixa
Uma quebra decisiva abaixo de US$ 685 pode aumentar a pressão de venda e abrir caminho para US$ 640.
8️⃣ 💎 Estratégia de Negociação
Em vez de correr atrás de uma alta repentina, os traders podem observar uma quebra confirmada ou um forte repique a partir do suporte.
9️⃣ 👀 O que Observar
O próximo movimento da BNB também vai depender do Bitcoin, do volume negociado e do sentimento geral do mercado cripto.
🔟 🏆 Previsão Final
A BNB parece cautelosamente otimista acima de US$ 700. Uma quebra acima de US$ 730 pode mirar US$ 760–US$ 780, enquanto perder US$ 685 enfraqueceria o cenário otimista.
📊 NÍVEIS-CHAVE
Resistência: US$ 723–US$ 730
Alvo 1: US$ 760
Alvo 2: US$ 780
Alvo Principal: US$ 800+
Suporte: US$ 700 / US$ 685 / US$ 640
⚠️ Aviso Legal: Esta é uma análise técnica apenas para fins educacionais, não é aconselhamento financeiro. Os mercados de cripto são altamente voláteis.
#CPIWatch
#BitcoinGoldenCrossConfirms
#Top7AssetsHold92.1%OfCryptoTop100
#CryptoSectorsFallSecondDay

100
·
--
$BTC
{spot}(BTCUSDT)
Análise do Bitcoin (BTC) — 11 de setembro de 2026
O Bitcoin (BTC) está atualmente sendo negociado por volta da faixa de US$ 77K–US$ 78K, e os traders estão de olho no próximo grande movimento.
📌 Suporte-chave: US$ 76.000
📌 Resistência-chave: US$ 80.000
🎯 Próximo objetivo: US$ 83.000–US$ 84.000
Se o BTC se mantiver acima de US$ 76K e o volume de compra aumentar, um movimento em direção a US$ 80K e possivelmente níveis mais altos pode se tornar possível. Uma confirmação de rompimento acima de US$ 80K pode fortalecer o momentum altista.
Porém, se o BTC romper abaixo de US$ 76K com forte pressão de venda, os traders devem permanecer cautelosos e esperar por um novo setup.
Abordagem de negociação: Não corra atrás de repiques repentinos. Espere por confirmação, use stop-loss, gerencie o tamanho da sua posição e evite alavancagem excessiva.
🔥 O BTC continua sendo um dos ativos mais importantes para acompanhar hoje.
⚠️ Esta é uma análise de mercado apenas para fins educacionais, não é aconselhamento financeiro garantido. Sempre gerencie seu próprio risco antes de negociar.
#CPIWatch
#CryptoSectorsFallSecondDay #BitcoinGoldenCrossConfirms #AppleRises3.56%AfterIPhoneDuoLaunch
$BTC
Análise do Bitcoin (BTC) — 11 de setembro de 2026
O Bitcoin (BTC) está atualmente sendo negociado por volta da faixa de US$ 77K–US$ 78K, e os traders estão de olho no próximo grande movimento.
📌 Suporte-chave: US$ 76.000
📌 Resistência-chave: US$ 80.000
🎯 Próximo objetivo: US$ 83.000–US$ 84.000
Se o BTC se mantiver acima de US$ 76K e o volume de compra aumentar, um movimento em direção a US$ 80K e possivelmente níveis mais altos pode se tornar possível. Uma confirmação de rompimento acima de US$ 80K pode fortalecer o momentum altista.
Porém, se o BTC romper abaixo de US$ 76K com forte pressão de venda, os traders devem permanecer cautelosos e esperar por um novo setup.
Abordagem de negociação: Não corra atrás de repiques repentinos. Espere por confirmação, use stop-loss, gerencie o tamanho da sua posição e evite alavancagem excessiva.
🔥 O BTC continua sendo um dos ativos mais importantes para acompanhar hoje.
⚠️ Esta é uma análise de mercado apenas para fins educacionais, não é aconselhamento financeiro garantido. Sempre gerencie seu próprio risco antes de negociar.
#CPIWatch
#CryptoSectorsFallSecondDay #BitcoinGoldenCrossConfirms #AppleRises3.56%AfterIPhoneDuoLaunch
Análise do Bitcoin (BTC) — 11 de setembro de 2026
O Bitcoin (BTC) está atualmente sendo negociado por volta da faixa de US$ 77K–US$ 78K, e os traders estão de olho no próximo grande movimento.
📌 Suporte-chave: US$ 76.000
📌 Resistência-chave: US$ 80.000
🎯 Próximo objetivo: US$ 83.000–US$ 84.000
Se o BTC se mantiver acima de US$ 76K e o volume de compra aumentar, um movimento em direção a US$ 80K e possivelmente níveis mais altos pode se tornar possível. Uma confirmação de rompimento acima de US$ 80K pode fortalecer o momentum altista.
Porém, se o BTC romper abaixo de US$ 76K com forte pressão de venda, os traders devem permanecer cautelosos e esperar por um novo setup.
Abordagem de negociação: Não corra atrás de repiques repentinos. Espere por confirmação, use stop-loss, gerencie o tamanho da sua posição e evite alavancagem excessiva.
🔥 O BTC continua sendo um dos ativos mais importantes para acompanhar hoje.
⚠️ Esta é uma análise de mercado apenas para fins educacionais, não é aconselhamento financeiro garantido. Sempre gerencie seu próprio risco antes de negociar.
#CPIWatch
#CryptoSectorsFallSecondDay #BitcoinGoldenCrossConfirms #AppleRises3.56%AfterIPhoneDuoLaunch

105
Inicia sessão para explorar mais conteúdos
Junta-te a utilizadores de criptomoedas de todo o mundo na Binance Square
⚡️ Obtém informações úteis e recentes sobre criptomoedas.
💬 Com a confiança da maior exchange de criptomoedas do mundo.
👍 Descobre perspetivas reais de criadores verificados.
E-mail/Número de telefone
Tópicos em Tendência
BinancePick
3.1M visualizações
153,340 a discutir
Participe da #TemporadaDeResultados: preveja resultados no Binance Pick e compartilhe sua opinião no Binance Square!
Binance Square Official
·413 gostos
·343.5k visualizações
EarningsSeason
5.3M visualizações
26,070 a discutir
AnthropicTTMRevenueGrewAbout1200%
36,046 visualizações
446 a discutir