
mOST_1398
20 Publicações

mOST_1398
Denunciar
Bloquear Utilizador
Aberto ao trading
Trader Ocasional
4 ano(s)
11 A seguir
39 Seguidores
25 Gostaram
Publicações
Portfólio
·
--
BStocks 101: Como explorar ações dos EUA na Binance – Guia para iniciantesPara muitas pessoas, investir em ações dos EUA pode parecer complicado, especialmente se elas forem novas nos mercados financeiros tradicionais. Se você já usa a Binance para cripto, talvez também tenha interesse em aprender sobre Stocks e BStocks como outra parte da sua jornada de investimentos.
Então, o que os iniciantes devem saber?
1. Entenda no que você está investindo
Antes de explorar qualquer ação, reserve um tempo para entender a empresa, seu modelo de negócios, o setor, o desempenho financeiro e os fatores que podem afetar o preço dela. Uma empresa popular não é automaticamente um investimento adequado para todos.
BStocks 101: Como explorar ações dos EUA na Binance – Guia para iniciantes
Para muitas pessoas, investir em ações dos EUA pode parecer complicado, especialmente se elas forem novas nos mercados financeiros tradicionais. Se você já usa a Binance para cripto, talvez também tenha interesse em aprender sobre Stocks e BStocks como outra parte da sua jornada de investimentos.
Então, o que os iniciantes devem saber?
1. Entenda no que você está investindo
Antes de explorar qualquer ação, reserve um tempo para entender a empresa, seu modelo de negócios, o setor, o desempenho financeiro e os fatores que podem afetar o preço dela. Uma empresa popular não é automaticamente um investimento adequado para todos.
Então, o que os iniciantes devem saber?
1. Entenda no que você está investindo
Antes de explorar qualquer ação, reserve um tempo para entender a empresa, seu modelo de negócios, o setor, o desempenho financeiro e os fatores que podem afetar o preço dela. Uma empresa popular não é automaticamente um investimento adequado para todos.
62
·
--
Como Iniciantes Podem Construir Riqueza com Ações dos EUA? Um Guia Simples para ComeçarMuitas pessoas querem construir uma fonte adicional de renda, mas talvez não saibam por onde começar. Ações dos EUA podem ser uma opção para explorar, especialmente para pessoas que desejam aprender sobre investimentos e, potencialmente, construir riqueza no longo prazo.
Para iniciantes, a coisa mais importante é não tentar ganhar dinheiro rapidamente. É entender como o mercado de ações funciona, escolher uma abordagem que combine com seus objetivos e gerenciar o risco com cuidado.
1. O que significa “ganhar dinheiro com ações” (Stocks)?
Em geral, existem duas formas pelas quais os investidores podem potencialmente se beneficiar de ações:
Como Iniciantes Podem Construir Riqueza com Ações dos EUA? Um Guia Simples para Começar
Muitas pessoas querem construir uma fonte adicional de renda, mas talvez não saibam por onde começar. Ações dos EUA podem ser uma opção para explorar, especialmente para pessoas que desejam aprender sobre investimentos e, potencialmente, construir riqueza no longo prazo.
Para iniciantes, a coisa mais importante é não tentar ganhar dinheiro rapidamente. É entender como o mercado de ações funciona, escolher uma abordagem que combine com seus objetivos e gerenciar o risco com cuidado.
1. O que significa “ganhar dinheiro com ações” (Stocks)?
Em geral, existem duas formas pelas quais os investidores podem potencialmente se beneficiar de ações:
Para iniciantes, a coisa mais importante é não tentar ganhar dinheiro rapidamente. É entender como o mercado de ações funciona, escolher uma abordagem que combine com seus objetivos e gerenciar o risco com cuidado.
1. O que significa “ganhar dinheiro com ações” (Stocks)?
Em geral, existem duas formas pelas quais os investidores podem potencialmente se beneficiar de ações:
92
·
--
Artigo
Ver tradução
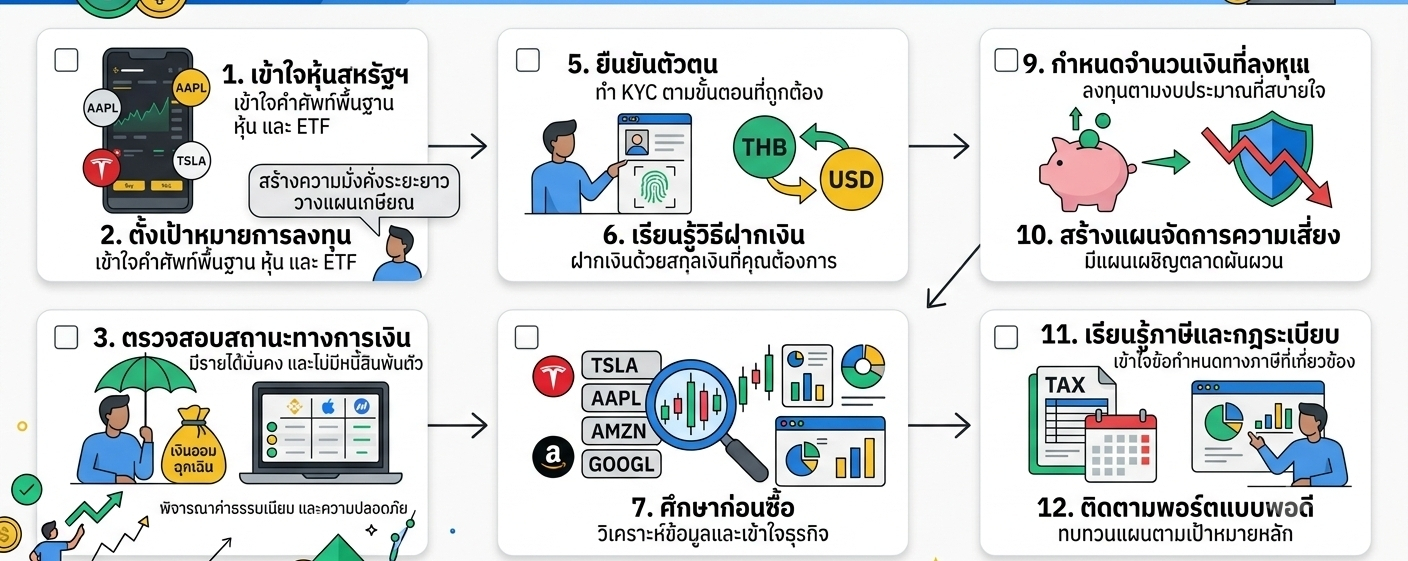
How to Start Investing in US Stocks: A Beginner’s ChecklistHow to Start Investing in US Stocks: A Beginner’s Checklist
Investing in US stocks can be an interesting way to participate in the global economy and build long-term wealth. The US stock market includes many well-known companies across technology, healthcare, finance, consumer goods, energy, and other industries.
However, getting started should not be about simply buying a popular stock. Beginners should first understand how the market works, choose a suitable investment platform, manage risk, and create a clear investment plan.
This beginner’s checklist will walk you through the essential steps before making your first US stock investment.
1. Understand What US Stocks Are
US stocks represent ownership in companies listed on US stock exchanges, such as the New York Stock Exchange (NYSE) and Nasdaq.
When you buy shares of a company, you become a shareholder. Your investment may increase or decrease in value depending on the company’s performance, market conditions, investor expectations, and other factors.
US stocks include individual companies as well as Exchange-Traded Funds (ETFs), which hold a collection of different investments.
Before investing, learn some basic terms:
Stock: A share of ownership in a company.
ETF: A fund that holds a basket of assets and trades like a stock.
Ticker symbol: A short symbol used to identify a stock.
Market price: The current price at which a stock trades.
Dividend: A payment that some companies make to shareholders.
Capital gain: The profit that may occur when an investment is sold for more than its purchase price.
Understanding these terms will make the investment process much easier.
2. Set Your Investment Goal
Before opening a brokerage account, ask yourself why you want to invest.
Your goal might be:
Building long-term wealth
Saving for retirement
Creating an additional source of potential income
Learning about financial markets
Building a diversified investment portfolio
Your investment goal can influence how much risk you are willing and able to take.
For example, someone investing for a long-term goal may have a different approach from someone who needs the money within a few months.
A clear goal can also help prevent emotional decisions when the market becomes volatile.
3. Check Your Financial Situation
Investing should generally come after taking care of essential financial needs.
Before investing, consider whether you have:
A stable source of income
Emergency savings
Manageable debt
Money available for long-term investment
A budget that allows you to invest consistently
Never invest money that you may urgently need for rent, food, medical expenses, or other essential costs.
The stock market can rise and fall, and there is no guarantee that you will receive your original investment back.
4. Choose a Suitable Investment Platform
To buy US stocks, you normally need an investment platform or brokerage account that provides access to US markets.
When comparing platforms, check important factors such as:
Whether residents of your country are eligible
Available US stocks and ETFs
Trading fees and other charges
Currency conversion costs
Deposit and withdrawal methods
Account security
Identity verification requirements
Customer support
Tax documentation
Do not choose a platform simply because it has low trading fees. Consider the complete cost structure and whether the service is legally and practically available to you.
Always use the official website or application when opening an account and carefully verify the company before depositing money.
5. Complete Identity Verification
Most regulated financial platforms require identity verification before you can invest.
You may be asked to provide information such as:
Full name
Date of birth
Residential address
Government-issued identification
Tax information
Source-of-funds information
Make sure the information you provide is accurate and consistent with your official documents.
Never share your password, authentication codes, or private security information with another person.
6. Learn How to Fund Your Account
After your account is approved, you need to deposit money before purchasing investments.
Depending on your location and platform, funding may involve your local currency or US dollars.
Pay attention to:
Deposit fees
Currency exchange rates
Bank transfer fees
Minimum deposit requirements
Processing times
Withdrawal fees
Currency movements can also affect your investment results. If your income is in a currency other than USD, changes in the exchange rate may increase or reduce your overall return when measured in your home currency.
7. Research Before Buying
One of the most important rules for beginners is simple: understand what you are buying.
Before purchasing an individual stock, research the company and consider factors such as:
What products or services does the company provide?
How does the company make money?
Is revenue growing?
Is the company profitable?
How much debt does it have?
What are its major risks?
Who are its competitors?
Is the current valuation reasonable relative to your expectations?
Do not invest simply because a stock is trending on social media or because someone says that its price will definitely rise.
There are no guaranteed returns in the stock market.
8. Understand Diversification
Putting all your money into one company can expose you to significant company-specific risk.
Diversification means spreading investments across different companies, industries, or assets.
For beginners, diversified ETFs can be one way to gain exposure to a broad group of companies rather than relying entirely on the performance of a single stock.
However, diversification does not eliminate risk. Broad markets can still decline during periods of economic or financial stress.
9. Decide How Much to Invest
You do not need a large amount of money to begin learning about investing, depending on the platform and available investment products.
Consider starting with an amount that fits comfortably within your budget.
Some investors use a regular investment approach, putting a fixed amount into investments at regular intervals. This can help create consistency and reduce the temptation to make decisions based entirely on short-term market movements.
The important point is to choose an amount and frequency that you can maintain without putting your essential finances under pressure.
10. Create a Risk Management Plan
Risk management is an essential part of investing.
Before buying an investment, understand how much you could potentially lose.
Avoid using borrowed money to invest unless you fully understand the risks and costs involved. Leveraged products can magnify both gains and losses.
Also be careful with emotional decisions. When prices fall sharply, beginners may panic and sell. When prices rise rapidly, they may feel pressure to buy because of fear of missing out.
Having a written investment plan can help you stay focused on your long-term objectives.
11. Learn About Taxes and Regulations
Investing internationally can involve tax and regulatory considerations.
Depending on your country of residence and the type of investment, you may need to understand:
Tax on investment profits
Dividend withholding tax
Reporting requirements
Currency-related considerations
US tax forms or documentation
Local investment regulations
Tax rules can be complicated and may change. If you are unsure about your responsibilities, consider consulting a qualified tax professional or financial adviser familiar with cross-border investments.
12. Monitor Your Portfolio — But Don’t Obsess Over It
After making your first investment, continue learning.
Review your portfolio periodically and check whether your investments still match your goals and risk tolerance.
You do not necessarily need to watch stock prices every minute.
A long-term investor may benefit more from understanding company fundamentals, economic developments, portfolio allocation, and personal financial goals than from reacting to every short-term price movement.
Beginner’s Final Checklist
Before making your first US stock investment, make sure you can answer “yes” to these questions:
☐ I understand the basic principles of stock investing.
☐ I have a clear investment goal.
☐ I have considered my financial situation and emergency savings.
☐ I have selected a suitable and legitimate investment platform.
☐ I understand the platform’s fees.
☐ I have completed the required identity verification.
☐ I understand how deposits, withdrawals, and currency conversion work.
☐ I have researched the investment before buying it.
☐ I understand the risks of losing money.
☐ I have considered diversification.
☐ I understand the relevant tax and regulatory requirements.
☐ I have a plan for how much and how often I will invest.
Conclusion
Starting to invest in US stocks does not require knowing everything about the market on day one. The most important first step is building a strong foundation.
Learn the basics, understand your financial situation, choose an appropriate investment platform, research before buying, diversify when appropriate, and manage risk carefully.
Most importantly, remember that investing is different from gambling or trying to predict the market every day. A disciplined approach focuses on understanding investments and making decisions that fit your own financial goals, time horizon, and risk tolerance.
Use this checklist as a starting point for your investment journey, and continue learning as your experience grows.
How to Start Investing in US Stocks: A Beginner’s Checklist
How to Start Investing in US Stocks: A Beginner’s Checklist
Investing in US stocks can be an interesting way to participate in the global economy and build long-term wealth. The US stock market includes many well-known companies across technology, healthcare, finance, consumer goods, energy, and other industries.
However, getting started should not be about simply buying a popular stock. Beginners should first understand how the market works, choose a suitable investment platform, manage risk, and create a clear investment plan.
This beginner’s checklist will walk you through the essential steps before making your first US stock investment.
1. Understand What US Stocks Are
US stocks represent ownership in companies listed on US stock exchanges, such as the New York Stock Exchange (NYSE) and Nasdaq.
When you buy shares of a company, you become a shareholder. Your investment may increase or decrease in value depending on the company’s performance, market conditions, investor expectations, and other factors.
US stocks include individual companies as well as Exchange-Traded Funds (ETFs), which hold a collection of different investments.
Before investing, learn some basic terms:
Stock: A share of ownership in a company.
ETF: A fund that holds a basket of assets and trades like a stock.
Ticker symbol: A short symbol used to identify a stock.
Market price: The current price at which a stock trades.
Dividend: A payment that some companies make to shareholders.
Capital gain: The profit that may occur when an investment is sold for more than its purchase price.
Understanding these terms will make the investment process much easier.
2. Set Your Investment Goal
Before opening a brokerage account, ask yourself why you want to invest.
Your goal might be:
Building long-term wealth
Saving for retirement
Creating an additional source of potential income
Learning about financial markets
Building a diversified investment portfolio
Your investment goal can influence how much risk you are willing and able to take.
For example, someone investing for a long-term goal may have a different approach from someone who needs the money within a few months.
A clear goal can also help prevent emotional decisions when the market becomes volatile.
3. Check Your Financial Situation
Investing should generally come after taking care of essential financial needs.
Before investing, consider whether you have:
A stable source of income
Emergency savings
Manageable debt
Money available for long-term investment
A budget that allows you to invest consistently
Never invest money that you may urgently need for rent, food, medical expenses, or other essential costs.
The stock market can rise and fall, and there is no guarantee that you will receive your original investment back.
4. Choose a Suitable Investment Platform
To buy US stocks, you normally need an investment platform or brokerage account that provides access to US markets.
When comparing platforms, check important factors such as:
Whether residents of your country are eligible
Available US stocks and ETFs
Trading fees and other charges
Currency conversion costs
Deposit and withdrawal methods
Account security
Identity verification requirements
Customer support
Tax documentation
Do not choose a platform simply because it has low trading fees. Consider the complete cost structure and whether the service is legally and practically available to you.
Always use the official website or application when opening an account and carefully verify the company before depositing money.
5. Complete Identity Verification
Most regulated financial platforms require identity verification before you can invest.
You may be asked to provide information such as:
Full name
Date of birth
Residential address
Government-issued identification
Tax information
Source-of-funds information
Make sure the information you provide is accurate and consistent with your official documents.
Never share your password, authentication codes, or private security information with another person.
6. Learn How to Fund Your Account
After your account is approved, you need to deposit money before purchasing investments.
Depending on your location and platform, funding may involve your local currency or US dollars.
Pay attention to:
Deposit fees
Currency exchange rates
Bank transfer fees
Minimum deposit requirements
Processing times
Withdrawal fees
Currency movements can also affect your investment results. If your income is in a currency other than USD, changes in the exchange rate may increase or reduce your overall return when measured in your home currency.
7. Research Before Buying
One of the most important rules for beginners is simple: understand what you are buying.
Before purchasing an individual stock, research the company and consider factors such as:
What products or services does the company provide?
How does the company make money?
Is revenue growing?
Is the company profitable?
How much debt does it have?
What are its major risks?
Who are its competitors?
Is the current valuation reasonable relative to your expectations?
Do not invest simply because a stock is trending on social media or because someone says that its price will definitely rise.
There are no guaranteed returns in the stock market.
8. Understand Diversification
Putting all your money into one company can expose you to significant company-specific risk.
Diversification means spreading investments across different companies, industries, or assets.
For beginners, diversified ETFs can be one way to gain exposure to a broad group of companies rather than relying entirely on the performance of a single stock.
However, diversification does not eliminate risk. Broad markets can still decline during periods of economic or financial stress.
9. Decide How Much to Invest
You do not need a large amount of money to begin learning about investing, depending on the platform and available investment products.
Consider starting with an amount that fits comfortably within your budget.
Some investors use a regular investment approach, putting a fixed amount into investments at regular intervals. This can help create consistency and reduce the temptation to make decisions based entirely on short-term market movements.
The important point is to choose an amount and frequency that you can maintain without putting your essential finances under pressure.
10. Create a Risk Management Plan
Risk management is an essential part of investing.
Before buying an investment, understand how much you could potentially lose.
Avoid using borrowed money to invest unless you fully understand the risks and costs involved. Leveraged products can magnify both gains and losses.
Also be careful with emotional decisions. When prices fall sharply, beginners may panic and sell. When prices rise rapidly, they may feel pressure to buy because of fear of missing out.
Having a written investment plan can help you stay focused on your long-term objectives.
11. Learn About Taxes and Regulations
Investing internationally can involve tax and regulatory considerations.
Depending on your country of residence and the type of investment, you may need to understand:
Tax on investment profits
Dividend withholding tax
Reporting requirements
Currency-related considerations
US tax forms or documentation
Local investment regulations
Tax rules can be complicated and may change. If you are unsure about your responsibilities, consider consulting a qualified tax professional or financial adviser familiar with cross-border investments.
12. Monitor Your Portfolio — But Don’t Obsess Over It
After making your first investment, continue learning.
Review your portfolio periodically and check whether your investments still match your goals and risk tolerance.
You do not necessarily need to watch stock prices every minute.
A long-term investor may benefit more from understanding company fundamentals, economic developments, portfolio allocation, and personal financial goals than from reacting to every short-term price movement.
Beginner’s Final Checklist
Before making your first US stock investment, make sure you can answer “yes” to these questions:
☐ I understand the basic principles of stock investing.
☐ I have a clear investment goal.
☐ I have considered my financial situation and emergency savings.
☐ I have selected a suitable and legitimate investment platform.
☐ I understand the platform’s fees.
☐ I have completed the required identity verification.
☐ I understand how deposits, withdrawals, and currency conversion work.
☐ I have researched the investment before buying it.
☐ I understand the risks of losing money.
☐ I have considered diversification.
☐ I understand the relevant tax and regulatory requirements.
☐ I have a plan for how much and how often I will invest.
Conclusion
Starting to invest in US stocks does not require knowing everything about the market on day one. The most important first step is building a strong foundation.
Learn the basics, understand your financial situation, choose an appropriate investment platform, research before buying, diversify when appropriate, and manage risk carefully.
Most importantly, remember that investing is different from gambling or trying to predict the market every day. A disciplined approach focuses on understanding investments and making decisions that fit your own financial goals, time horizon, and risk tolerance.
Use this checklist as a starting point for your investment journey, and continue learning as your experience grows.
Investing in US stocks can be an interesting way to participate in the global economy and build long-term wealth. The US stock market includes many well-known companies across technology, healthcare, finance, consumer goods, energy, and other industries.
However, getting started should not be about simply buying a popular stock. Beginners should first understand how the market works, choose a suitable investment platform, manage risk, and create a clear investment plan.
This beginner’s checklist will walk you through the essential steps before making your first US stock investment.
1. Understand What US Stocks Are
US stocks represent ownership in companies listed on US stock exchanges, such as the New York Stock Exchange (NYSE) and Nasdaq.
When you buy shares of a company, you become a shareholder. Your investment may increase or decrease in value depending on the company’s performance, market conditions, investor expectations, and other factors.
US stocks include individual companies as well as Exchange-Traded Funds (ETFs), which hold a collection of different investments.
Before investing, learn some basic terms:
Stock: A share of ownership in a company.
ETF: A fund that holds a basket of assets and trades like a stock.
Ticker symbol: A short symbol used to identify a stock.
Market price: The current price at which a stock trades.
Dividend: A payment that some companies make to shareholders.
Capital gain: The profit that may occur when an investment is sold for more than its purchase price.
Understanding these terms will make the investment process much easier.
2. Set Your Investment Goal
Before opening a brokerage account, ask yourself why you want to invest.
Your goal might be:
Building long-term wealth
Saving for retirement
Creating an additional source of potential income
Learning about financial markets
Building a diversified investment portfolio
Your investment goal can influence how much risk you are willing and able to take.
For example, someone investing for a long-term goal may have a different approach from someone who needs the money within a few months.
A clear goal can also help prevent emotional decisions when the market becomes volatile.
3. Check Your Financial Situation
Investing should generally come after taking care of essential financial needs.
Before investing, consider whether you have:
A stable source of income
Emergency savings
Manageable debt
Money available for long-term investment
A budget that allows you to invest consistently
Never invest money that you may urgently need for rent, food, medical expenses, or other essential costs.
The stock market can rise and fall, and there is no guarantee that you will receive your original investment back.
4. Choose a Suitable Investment Platform
To buy US stocks, you normally need an investment platform or brokerage account that provides access to US markets.
When comparing platforms, check important factors such as:
Whether residents of your country are eligible
Available US stocks and ETFs
Trading fees and other charges
Currency conversion costs
Deposit and withdrawal methods
Account security
Identity verification requirements
Customer support
Tax documentation
Do not choose a platform simply because it has low trading fees. Consider the complete cost structure and whether the service is legally and practically available to you.
Always use the official website or application when opening an account and carefully verify the company before depositing money.
5. Complete Identity Verification
Most regulated financial platforms require identity verification before you can invest.
You may be asked to provide information such as:
Full name
Date of birth
Residential address
Government-issued identification
Tax information
Source-of-funds information
Make sure the information you provide is accurate and consistent with your official documents.
Never share your password, authentication codes, or private security information with another person.
6. Learn How to Fund Your Account
After your account is approved, you need to deposit money before purchasing investments.
Depending on your location and platform, funding may involve your local currency or US dollars.
Pay attention to:
Deposit fees
Currency exchange rates
Bank transfer fees
Minimum deposit requirements
Processing times
Withdrawal fees
Currency movements can also affect your investment results. If your income is in a currency other than USD, changes in the exchange rate may increase or reduce your overall return when measured in your home currency.
7. Research Before Buying
One of the most important rules for beginners is simple: understand what you are buying.
Before purchasing an individual stock, research the company and consider factors such as:
What products or services does the company provide?
How does the company make money?
Is revenue growing?
Is the company profitable?
How much debt does it have?
What are its major risks?
Who are its competitors?
Is the current valuation reasonable relative to your expectations?
Do not invest simply because a stock is trending on social media or because someone says that its price will definitely rise.
There are no guaranteed returns in the stock market.
8. Understand Diversification
Putting all your money into one company can expose you to significant company-specific risk.
Diversification means spreading investments across different companies, industries, or assets.
For beginners, diversified ETFs can be one way to gain exposure to a broad group of companies rather than relying entirely on the performance of a single stock.
However, diversification does not eliminate risk. Broad markets can still decline during periods of economic or financial stress.
9. Decide How Much to Invest
You do not need a large amount of money to begin learning about investing, depending on the platform and available investment products.
Consider starting with an amount that fits comfortably within your budget.
Some investors use a regular investment approach, putting a fixed amount into investments at regular intervals. This can help create consistency and reduce the temptation to make decisions based entirely on short-term market movements.
The important point is to choose an amount and frequency that you can maintain without putting your essential finances under pressure.
10. Create a Risk Management Plan
Risk management is an essential part of investing.
Before buying an investment, understand how much you could potentially lose.
Avoid using borrowed money to invest unless you fully understand the risks and costs involved. Leveraged products can magnify both gains and losses.
Also be careful with emotional decisions. When prices fall sharply, beginners may panic and sell. When prices rise rapidly, they may feel pressure to buy because of fear of missing out.
Having a written investment plan can help you stay focused on your long-term objectives.
11. Learn About Taxes and Regulations
Investing internationally can involve tax and regulatory considerations.
Depending on your country of residence and the type of investment, you may need to understand:
Tax on investment profits
Dividend withholding tax
Reporting requirements
Currency-related considerations
US tax forms or documentation
Local investment regulations
Tax rules can be complicated and may change. If you are unsure about your responsibilities, consider consulting a qualified tax professional or financial adviser familiar with cross-border investments.
12. Monitor Your Portfolio — But Don’t Obsess Over It
After making your first investment, continue learning.
Review your portfolio periodically and check whether your investments still match your goals and risk tolerance.
You do not necessarily need to watch stock prices every minute.
A long-term investor may benefit more from understanding company fundamentals, economic developments, portfolio allocation, and personal financial goals than from reacting to every short-term price movement.
Beginner’s Final Checklist
Before making your first US stock investment, make sure you can answer “yes” to these questions:
☐ I understand the basic principles of stock investing.
☐ I have a clear investment goal.
☐ I have considered my financial situation and emergency savings.
☐ I have selected a suitable and legitimate investment platform.
☐ I understand the platform’s fees.
☐ I have completed the required identity verification.
☐ I understand how deposits, withdrawals, and currency conversion work.
☐ I have researched the investment before buying it.
☐ I understand the risks of losing money.
☐ I have considered diversification.
☐ I understand the relevant tax and regulatory requirements.
☐ I have a plan for how much and how often I will invest.
Conclusion
Starting to invest in US stocks does not require knowing everything about the market on day one. The most important first step is building a strong foundation.
Learn the basics, understand your financial situation, choose an appropriate investment platform, research before buying, diversify when appropriate, and manage risk carefully.
Most importantly, remember that investing is different from gambling or trying to predict the market every day. A disciplined approach focuses on understanding investments and making decisions that fit your own financial goals, time horizon, and risk tolerance.
Use this checklist as a starting point for your investment journey, and continue learning as your experience grows.
27
·
--
Ver tradução
BStocks 101: How to Access and Explore US Stocks Through BinanceBStocks 101: How to Access and Explore US Stocks Through Binance
Introduction
The US stock market is one of the most well-known and widely followed financial markets in the world. Many leading global companies, such as Apple, Microsoft, Amazon, and Tesla, are listed on US stock exchanges and attract investors from different countries.
For people who are already familiar with Binance and cryptocurrency trading, exploring stock-related products through the platform can be an interesting way to learn more about traditional financial markets. BStocks 101 is designed as a simple introduction for beginners who want to understand how to access and explore US stock-related products through Binance.
However, it is important to understand exactly what product is being offered. A stock-related product on a cryptocurrency platform may not be the same as directly owning shares through a traditional stockbroker. Depending on the product, it may represent a tokenized asset, a derivative, or another financial product linked to the price of a stock.
1. What Is BStocks?
BStocks can refer to stock-related products or services available through Binance. These products may allow users to gain exposure to the price movements of selected US stocks without necessarily purchasing traditional shares through a conventional brokerage account.
Before using any stock-related product, users should carefully check the product description, issuer, trading conditions, fees, and available services.
It is also important to understand the difference between owning an actual stock and holding a token or financial product that tracks the price of a stock. These products may have different rights, fees, risks, and conditions.
Availability can also depend on the user's country or region because financial products are subject to local regulations and restrictions.
2. Getting Started
Before exploring US stock-related products on Binance, users should make sure their account is properly set up.
First, create or log in to a Binance account and complete the required identity verification process. Users should also make sure that the relevant service is legally and officially available in their location.
It is recommended to keep the Binance application updated to the latest version and activate strong account-security features, such as two-factor authentication (2FA).
Users should never share their password, verification codes, private keys, or other sensitive account information with anyone.
3. How to Access and Explore US Stocks
The exact menu names and available features may vary depending on the user's location, account type, and Binance application version. In general, the process can be approached as follows:
Step 1: Open the Binance application and log in to your account.
Step 2: Go to the relevant market, trading, or investment section available on your account.
Step 3: Use the search function to look for the stock or stock-related product you are interested in. For example, users may search for well-known stock symbols such as AAPL, MSFT, or TSLA if those products are available.
Step 4: Select the relevant product and review its information carefully.
Step 5: Check the product type. Make sure you understand whether it represents an actual stock, a tokenized stock, a derivative, or another type of financial product.
Never assume that a product with the name of a US company automatically means that you own the underlying shares.
4. What Information Should You Check?
Before considering any investment, users should examine several important pieces of information.
Current Price: Check the current price and how much it has changed over different periods.
Price Chart: Review the historical price chart to understand previous price movements. Different timeframes can help users observe short-term and long-term trends.
Market Capitalization: Market capitalization provides an indication of the overall size of a company.
Trading Volume: Trading volume shows how actively an asset is being traded and can provide additional market information.
Company Information: Learn what the company does, how it generates revenue, its financial performance, and the major risks associated with its business.
Charts can be useful for analysis, but historical price movements do not guarantee future performance.
5. Fees and Risks
Before making a transaction, users should carefully review all applicable fees and conditions. These may include trading fees, conversion fees, withdrawal fees, spreads, or other charges depending on the product.
Users should also understand the risks associated with market volatility. Stock prices can move significantly because of company earnings, economic conditions, interest rates, market sentiment, and major news events.
If a product involves leverage or derivatives, the potential risks can be significantly higher. Users should understand how the product works before using it and should never invest money that they cannot afford to lose.
6. Start With Education
For beginners, the best starting point is education. Learn the basics of stock markets, company financial statements, valuation, technical analysis, and risk management before making real investments.
It can also be useful to create a watchlist and observe selected stocks without immediately investing money. This allows beginners to understand how prices react to company news and market conditions.
Investors should separate investment money from essential living expenses and avoid making decisions based only on social-media recommendations, short-term price movements, or fear of missing out (FOMO).
Conclusion
BStocks 101 provides a starting point for anyone interested in exploring US stock-related products through Binance. The most important step is not simply learning how to find a stock, but understanding what product you are actually buying, how it works, what fees apply, and what risks are involved.
Before making any investment, always check the latest information from official sources and carefully consider your own financial situation and risk tolerance.
Learn first. Check the product. Understand the risks. Then make your own decision.
BStocks 101: How to Access and Explore US Stocks Through Binance
BStocks 101: How to Access and Explore US Stocks Through Binance
Introduction
The US stock market is one of the most well-known and widely followed financial markets in the world. Many leading global companies, such as Apple, Microsoft, Amazon, and Tesla, are listed on US stock exchanges and attract investors from different countries.
For people who are already familiar with Binance and cryptocurrency trading, exploring stock-related products through the platform can be an interesting way to learn more about traditional financial markets. BStocks 101 is designed as a simple introduction for beginners who want to understand how to access and explore US stock-related products through Binance.
However, it is important to understand exactly what product is being offered. A stock-related product on a cryptocurrency platform may not be the same as directly owning shares through a traditional stockbroker. Depending on the product, it may represent a tokenized asset, a derivative, or another financial product linked to the price of a stock.
1. What Is BStocks?
BStocks can refer to stock-related products or services available through Binance. These products may allow users to gain exposure to the price movements of selected US stocks without necessarily purchasing traditional shares through a conventional brokerage account.
Before using any stock-related product, users should carefully check the product description, issuer, trading conditions, fees, and available services.
It is also important to understand the difference between owning an actual stock and holding a token or financial product that tracks the price of a stock. These products may have different rights, fees, risks, and conditions.
Availability can also depend on the user's country or region because financial products are subject to local regulations and restrictions.
2. Getting Started
Before exploring US stock-related products on Binance, users should make sure their account is properly set up.
First, create or log in to a Binance account and complete the required identity verification process. Users should also make sure that the relevant service is legally and officially available in their location.
It is recommended to keep the Binance application updated to the latest version and activate strong account-security features, such as two-factor authentication (2FA).
Users should never share their password, verification codes, private keys, or other sensitive account information with anyone.
3. How to Access and Explore US Stocks
The exact menu names and available features may vary depending on the user's location, account type, and Binance application version. In general, the process can be approached as follows:
Step 1: Open the Binance application and log in to your account.
Step 2: Go to the relevant market, trading, or investment section available on your account.
Step 3: Use the search function to look for the stock or stock-related product you are interested in. For example, users may search for well-known stock symbols such as AAPL, MSFT, or TSLA if those products are available.
Step 4: Select the relevant product and review its information carefully.
Step 5: Check the product type. Make sure you understand whether it represents an actual stock, a tokenized stock, a derivative, or another type of financial product.
Never assume that a product with the name of a US company automatically means that you own the underlying shares.
4. What Information Should You Check?
Before considering any investment, users should examine several important pieces of information.
Current Price: Check the current price and how much it has changed over different periods.
Price Chart: Review the historical price chart to understand previous price movements. Different timeframes can help users observe short-term and long-term trends.
Market Capitalization: Market capitalization provides an indication of the overall size of a company.
Trading Volume: Trading volume shows how actively an asset is being traded and can provide additional market information.
Company Information: Learn what the company does, how it generates revenue, its financial performance, and the major risks associated with its business.
Charts can be useful for analysis, but historical price movements do not guarantee future performance.
5. Fees and Risks
Before making a transaction, users should carefully review all applicable fees and conditions. These may include trading fees, conversion fees, withdrawal fees, spreads, or other charges depending on the product.
Users should also understand the risks associated with market volatility. Stock prices can move significantly because of company earnings, economic conditions, interest rates, market sentiment, and major news events.
If a product involves leverage or derivatives, the potential risks can be significantly higher. Users should understand how the product works before using it and should never invest money that they cannot afford to lose.
6. Start With Education
For beginners, the best starting point is education. Learn the basics of stock markets, company financial statements, valuation, technical analysis, and risk management before making real investments.
It can also be useful to create a watchlist and observe selected stocks without immediately investing money. This allows beginners to understand how prices react to company news and market conditions.
Investors should separate investment money from essential living expenses and avoid making decisions based only on social-media recommendations, short-term price movements, or fear of missing out (FOMO).
Conclusion
BStocks 101 provides a starting point for anyone interested in exploring US stock-related products through Binance. The most important step is not simply learning how to find a stock, but understanding what product you are actually buying, how it works, what fees apply, and what risks are involved.
Before making any investment, always check the latest information from official sources and carefully consider your own financial situation and risk tolerance.
Learn first. Check the product. Understand the risks. Then make your own decision.
Introduction
The US stock market is one of the most well-known and widely followed financial markets in the world. Many leading global companies, such as Apple, Microsoft, Amazon, and Tesla, are listed on US stock exchanges and attract investors from different countries.
For people who are already familiar with Binance and cryptocurrency trading, exploring stock-related products through the platform can be an interesting way to learn more about traditional financial markets. BStocks 101 is designed as a simple introduction for beginners who want to understand how to access and explore US stock-related products through Binance.
However, it is important to understand exactly what product is being offered. A stock-related product on a cryptocurrency platform may not be the same as directly owning shares through a traditional stockbroker. Depending on the product, it may represent a tokenized asset, a derivative, or another financial product linked to the price of a stock.
1. What Is BStocks?
BStocks can refer to stock-related products or services available through Binance. These products may allow users to gain exposure to the price movements of selected US stocks without necessarily purchasing traditional shares through a conventional brokerage account.
Before using any stock-related product, users should carefully check the product description, issuer, trading conditions, fees, and available services.
It is also important to understand the difference between owning an actual stock and holding a token or financial product that tracks the price of a stock. These products may have different rights, fees, risks, and conditions.
Availability can also depend on the user's country or region because financial products are subject to local regulations and restrictions.
2. Getting Started
Before exploring US stock-related products on Binance, users should make sure their account is properly set up.
First, create or log in to a Binance account and complete the required identity verification process. Users should also make sure that the relevant service is legally and officially available in their location.
It is recommended to keep the Binance application updated to the latest version and activate strong account-security features, such as two-factor authentication (2FA).
Users should never share their password, verification codes, private keys, or other sensitive account information with anyone.
3. How to Access and Explore US Stocks
The exact menu names and available features may vary depending on the user's location, account type, and Binance application version. In general, the process can be approached as follows:
Step 1: Open the Binance application and log in to your account.
Step 2: Go to the relevant market, trading, or investment section available on your account.
Step 3: Use the search function to look for the stock or stock-related product you are interested in. For example, users may search for well-known stock symbols such as AAPL, MSFT, or TSLA if those products are available.
Step 4: Select the relevant product and review its information carefully.
Step 5: Check the product type. Make sure you understand whether it represents an actual stock, a tokenized stock, a derivative, or another type of financial product.
Never assume that a product with the name of a US company automatically means that you own the underlying shares.
4. What Information Should You Check?
Before considering any investment, users should examine several important pieces of information.
Current Price: Check the current price and how much it has changed over different periods.
Price Chart: Review the historical price chart to understand previous price movements. Different timeframes can help users observe short-term and long-term trends.
Market Capitalization: Market capitalization provides an indication of the overall size of a company.
Trading Volume: Trading volume shows how actively an asset is being traded and can provide additional market information.
Company Information: Learn what the company does, how it generates revenue, its financial performance, and the major risks associated with its business.
Charts can be useful for analysis, but historical price movements do not guarantee future performance.
5. Fees and Risks
Before making a transaction, users should carefully review all applicable fees and conditions. These may include trading fees, conversion fees, withdrawal fees, spreads, or other charges depending on the product.
Users should also understand the risks associated with market volatility. Stock prices can move significantly because of company earnings, economic conditions, interest rates, market sentiment, and major news events.
If a product involves leverage or derivatives, the potential risks can be significantly higher. Users should understand how the product works before using it and should never invest money that they cannot afford to lose.
6. Start With Education
For beginners, the best starting point is education. Learn the basics of stock markets, company financial statements, valuation, technical analysis, and risk management before making real investments.
It can also be useful to create a watchlist and observe selected stocks without immediately investing money. This allows beginners to understand how prices react to company news and market conditions.
Investors should separate investment money from essential living expenses and avoid making decisions based only on social-media recommendations, short-term price movements, or fear of missing out (FOMO).
Conclusion
BStocks 101 provides a starting point for anyone interested in exploring US stock-related products through Binance. The most important step is not simply learning how to find a stock, but understanding what product you are actually buying, how it works, what fees apply, and what risks are involved.
Before making any investment, always check the latest information from official sources and carefully consider your own financial situation and risk tolerance.
Learn first. Check the product. Understand the risks. Then make your own decision.
43
·
--
Ver tradução
🇺🇸 *FED WATCH*
The Fed just raised rates.
Markets now see more than a 50% chance they raise them AGAIN in October.
Goldman Sachs agrees.
🇺🇸 *FED WATCH*
The Fed just raised rates.
Markets now see more than a 50% chance they raise them AGAIN in October.
Goldman Sachs agrees.
The Fed just raised rates.
Markets now see more than a 50% chance they raise them AGAIN in October.
Goldman Sachs agrees.

51
·
--
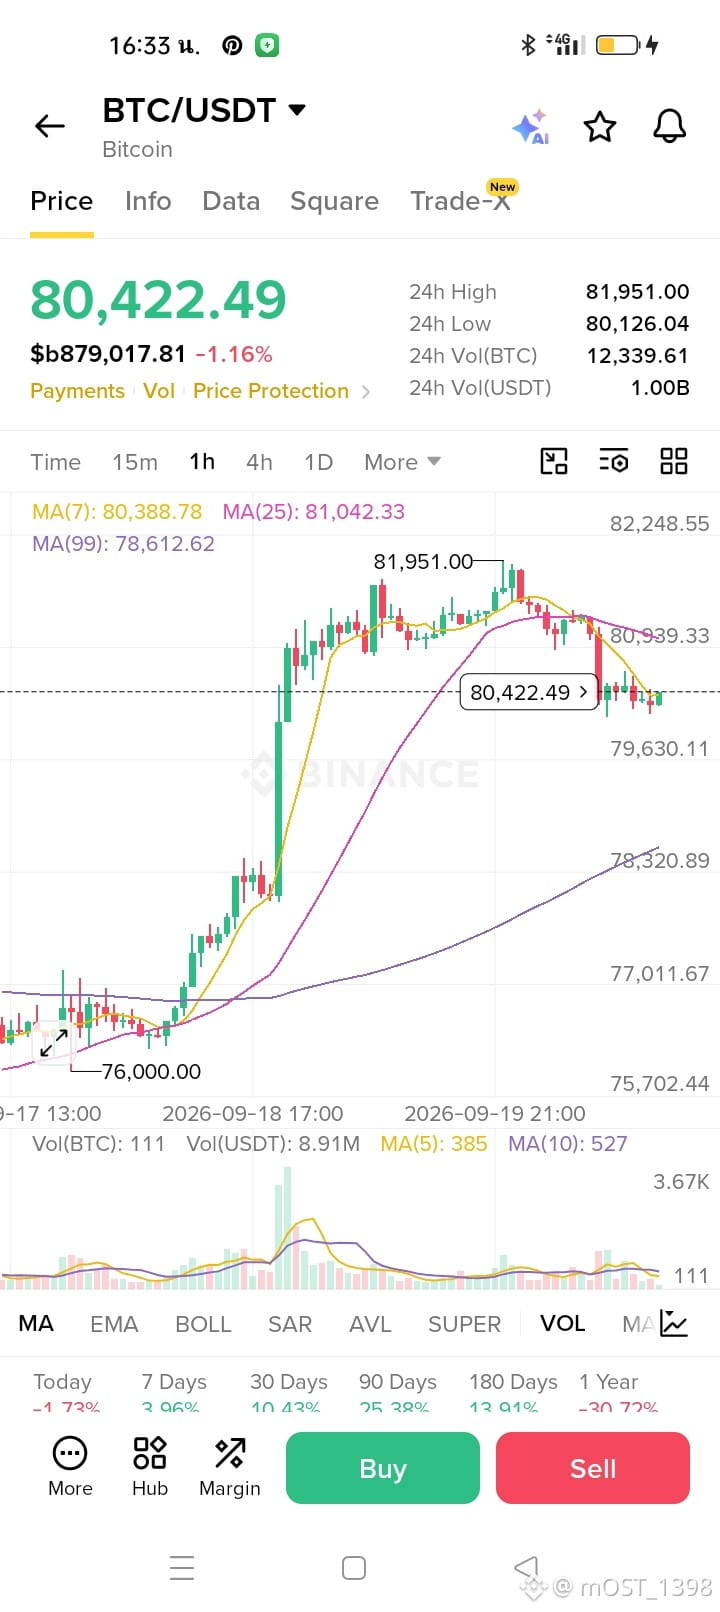
💰🚨 Bitcoin manteve-se firme e disparou apesar de 4–5 grandes manchetes bearish atingirem o mercado.
Mas se um catalisador bearish maior surgir, a força atual pode não se sustentar.
O $BTC também parece sobrecomprado em alguns timeframes, enquanto uma alavancagem relevante para baixo foi construída; se começar a ser desfeita, o movimento pode ser brusco.
Diante disso, estamos atualmente vendidos em swing em BTC, ETH, SOL e BNB.
💰🚨 Bitcoin manteve-se firme e disparou apesar de 4–5 grandes manchetes bearish atingirem o mercado.
Mas se um catalisador bearish maior surgir, a força atual pode não se sustentar.
O $BTC também parece sobrecomprado em alguns timeframes, enquanto uma alavancagem relevante para baixo foi construída; se começar a ser desfeita, o movimento pode ser brusco.
Diante disso, estamos atualmente vendidos em swing em BTC, ETH, SOL e BNB.
Mas se um catalisador bearish maior surgir, a força atual pode não se sustentar.
O $BTC também parece sobrecomprado em alguns timeframes, enquanto uma alavancagem relevante para baixo foi construída; se começar a ser desfeita, o movimento pode ser brusco.
Diante disso, estamos atualmente vendidos em swing em BTC, ETH, SOL e BNB.
55
·
--
Ver tradução
*TRADE ALERT – $ETH/USDT*
*Position:* Long(Buy)
*Leverage:* 50x
*Entry Zone:*
$2397 – $2350
*Targets:*
$2445
$2486
$2545
*Stop Loss:*
$2310
⚠️ Stay disciplined, manage risk, and consider booking partial profits along the way.
*TRADE ALERT – $ETH/USDT*
*Position:* Long(Buy)
*Leverage:* 50x
*Entry Zone:*
$2397 – $2350
*Targets:*
$2445
$2486
$2545
*Stop Loss:*
$2310
⚠️ Stay disciplined, manage risk, and consider booking partial profits along the way.
*Position:* Long(Buy)
*Leverage:* 50x
*Entry Zone:*
$2397 – $2350
*Targets:*
$2445
$2486
$2545
*Stop Loss:*
$2310
⚠️ Stay disciplined, manage risk, and consider booking partial profits along the way.
71
·
--
Ver tradução
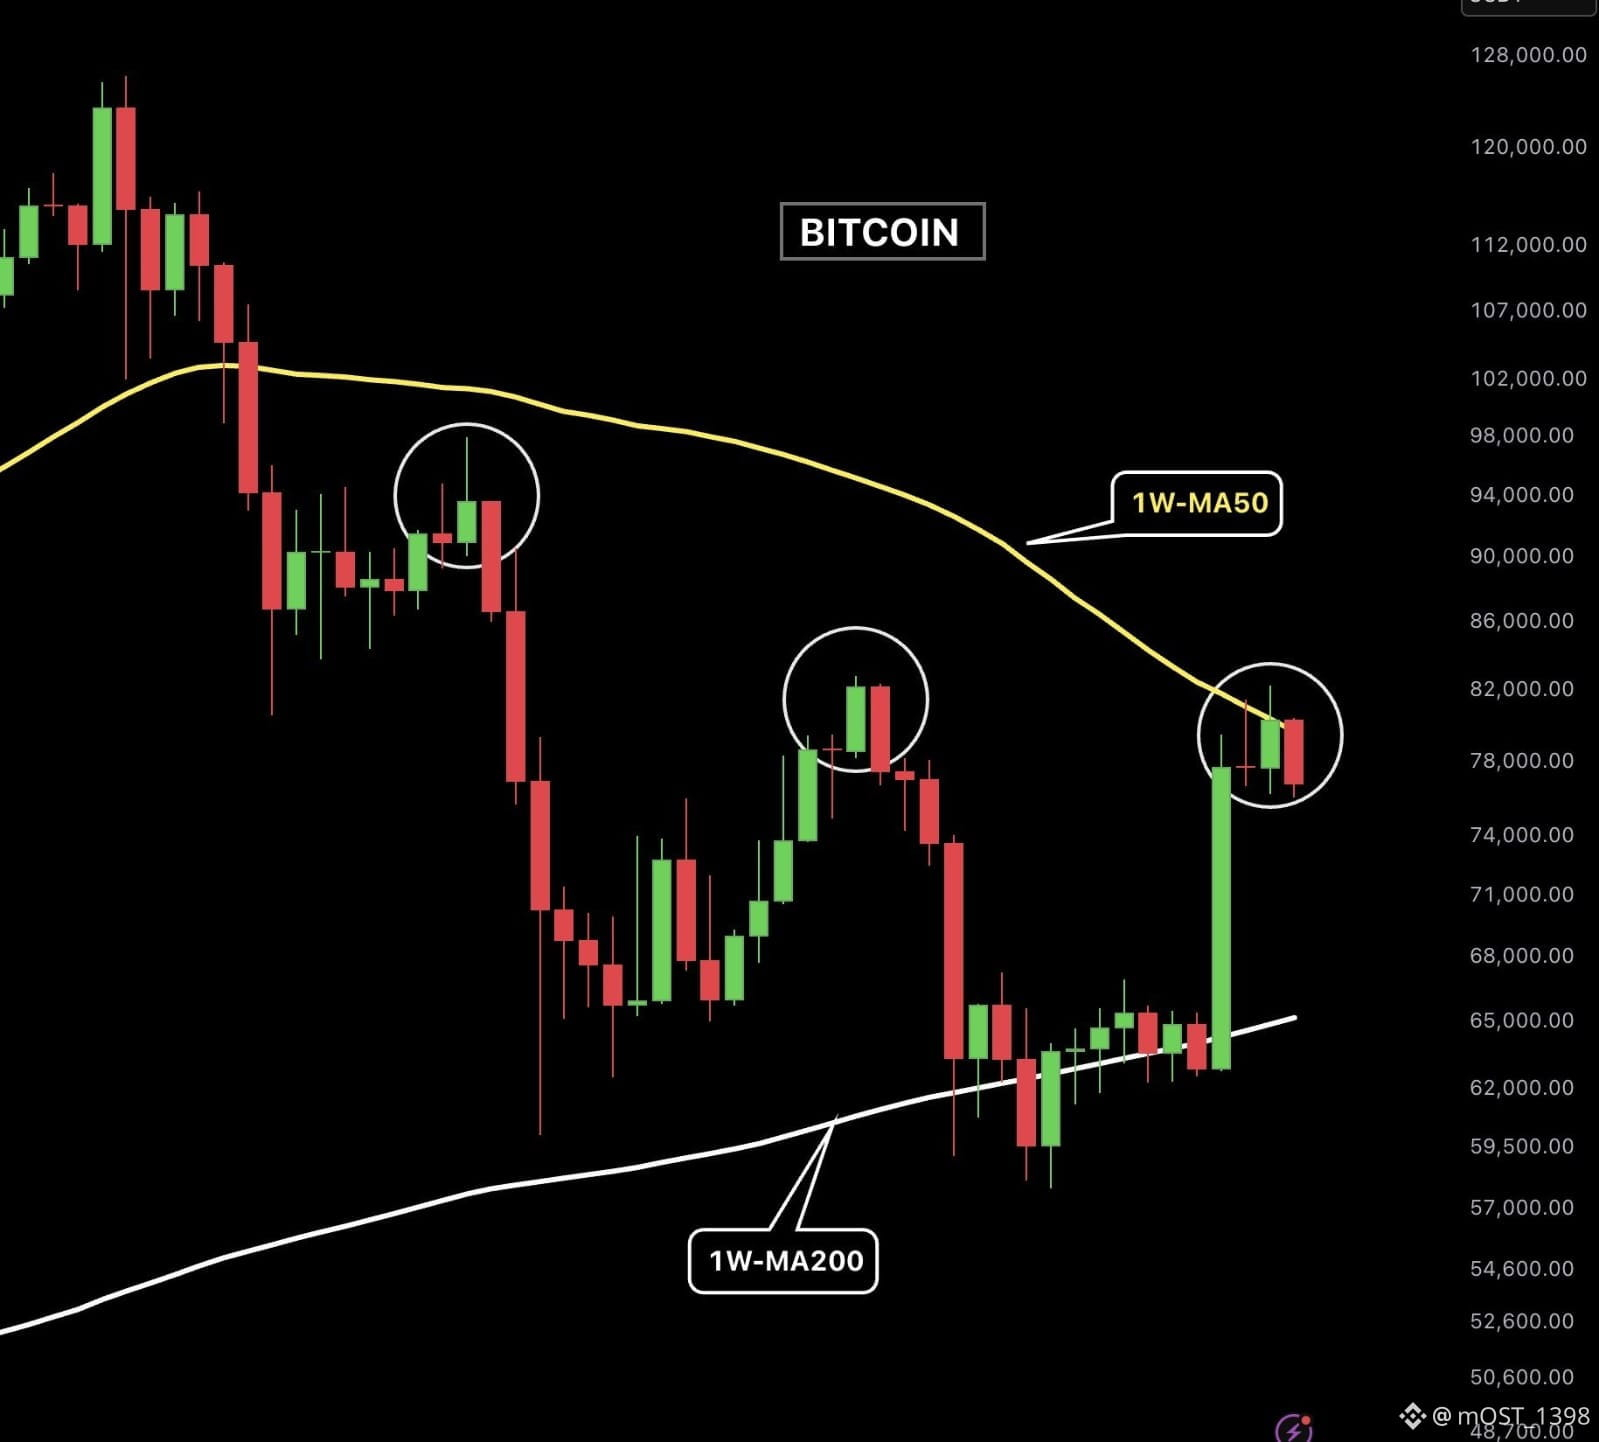
This is not looking good boys.
Bitcoin got rejected from the 50W MA. We need to close the weekly candle back above it to confirm $57K was the bottom and the real bull market has started.
What's concerning is that the last two times Bitcoin got rejected here, a major crash followed.
If $BTC closes below the 50W MA, $75,500 is the next support. If that breaks, the next major level to watch is the 200W MA, currently around $65K.
This is not looking good boys.
Bitcoin got rejected from the 50W MA. We need to close the weekly candle back above it to confirm $57K was the bottom and the real bull market has started.
What's concerning is that the last two times Bitcoin got rejected here, a major crash followed.
If $BTC closes below the 50W MA, $75,500 is the next support. If that breaks, the next major level to watch is the 200W MA, currently around $65K.
Bitcoin got rejected from the 50W MA. We need to close the weekly candle back above it to confirm $57K was the bottom and the real bull market has started.
What's concerning is that the last two times Bitcoin got rejected here, a major crash followed.
If $BTC closes below the 50W MA, $75,500 is the next support. If that breaks, the next major level to watch is the 200W MA, currently around $65K.
66
·
--
Ver tradução
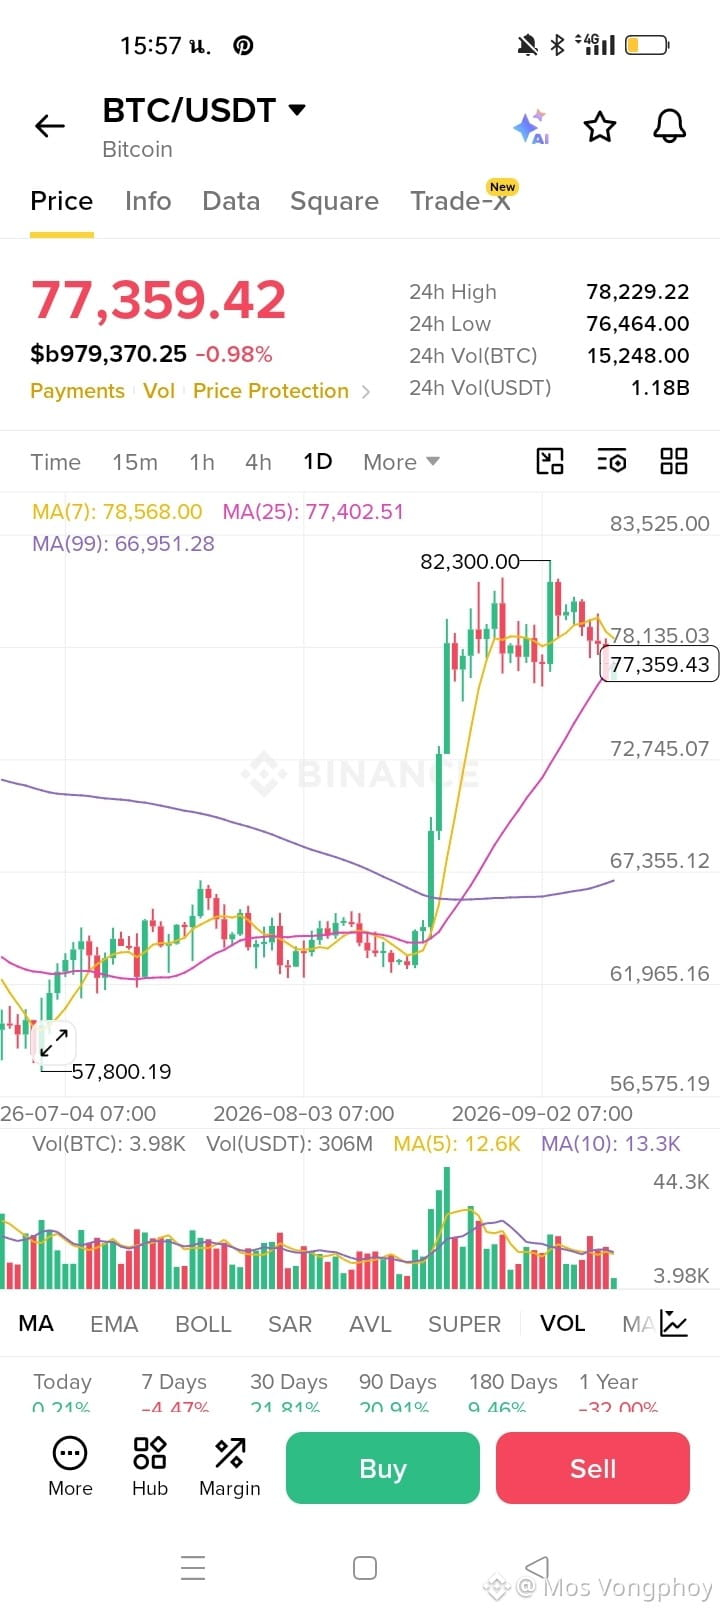
Spot BTC Insights 2026-09-11 08:00 UTC
TLDR
1. BTC faces downward pressure around $77.2K driven by surging Treasury yields and $282M in tactical ETF outflows.
Key Drivers
1. - **Macroeconomic pressure (High)**: Surging 30-year US Treasury yields to 5.37% and high PPI data (5.4%) are driving investors toward risk-free assets, pressuring prices downward.
- **Institutional de-risking (High)**: Spot ETFs saw $282.7M in daily net outflows, signaling tactical institutional shifts ahead of key inflation data.
- **Corporate accumulation (Medium)**: Continued corporate purchases and expanded institutional access via Asian liquidity pools provide underlying structural support.
Risk Assessment
1. - **Inflation data volatility (High)**: The upcoming US CPI release and rising oil prices from geopolitical tensions could cement higher interest rates, triggering further drawdowns.
- **Technical vulnerability (Medium)**: A recent sharp drop to $76.8K on massive volume (634M USDT) highlights fragile support, despite a short-term RSI bounce from oversold levels.
- **Security concerns (Low)**: Decreasing costs for quantum computing attacks introduce long-term theoretical vulnerabilities.
Macro headwinds and ETF outflows create a precarious environment ahead of the CPI print.
Install Binance app to catch the latest BTC insights at https://app.binance.com/uni-qr/token-ai-report?token=BTC&symbol=BTCUSDT&product=spot&reportAt=1789113600000"eToken=USDT&utm_term=BTC&ref=514701768&utm_source=Brm8cLnPPfw7BoYTCqg55k&utm_medium=spot_insight®isterChannel=trading_insight
Spot BTC Insights 2026-09-11 08:00 UTC
TLDR
1. BTC faces downward pressure around $77.2K driven by surging Treasury yields and $282M in tactical ETF outflows.
Key Drivers
1. - **Macroeconomic pressure (High)**: Surging 30-year US Treasury yields to 5.37% and high PPI data (5.4%) are driving investors toward risk-free assets, pressuring prices downward.
- **Institutional de-risking (High)**: Spot ETFs saw $282.7M in daily net outflows, signaling tactical institutional shifts ahead of key inflation data.
- **Corporate accumulation (Medium)**: Continued corporate purchases and expanded institutional access via Asian liquidity pools provide underlying structural support.
Risk Assessment
1. - **Inflation data volatility (High)**: The upcoming US CPI release and rising oil prices from geopolitical tensions could cement higher interest rates, triggering further drawdowns.
- **Technical vulnerability (Medium)**: A recent sharp drop to $76.8K on massive volume (634M USDT) highlights fragile support, despite a short-term RSI bounce from oversold levels.
- **Security concerns (Low)**: Decreasing costs for quantum computing attacks introduce long-term theoretical vulnerabilities.
Macro headwinds and ETF outflows create a precarious environment ahead of the CPI print.
Install Binance app to catch the latest BTC insights at https://app.binance.com/uni-qr/token-ai-report?token=BTC&symbol=BTCUSDT&product=spot&reportAt=1789113600000"eToken=USDT&utm_term=BTC&ref=514701768&utm_source=Brm8cLnPPfw7BoYTCqg55k&utm_medium=spot_insight®isterChannel=trading_insight
TLDR
1. BTC faces downward pressure around $77.2K driven by surging Treasury yields and $282M in tactical ETF outflows.
Key Drivers
1. - **Macroeconomic pressure (High)**: Surging 30-year US Treasury yields to 5.37% and high PPI data (5.4%) are driving investors toward risk-free assets, pressuring prices downward.
- **Institutional de-risking (High)**: Spot ETFs saw $282.7M in daily net outflows, signaling tactical institutional shifts ahead of key inflation data.
- **Corporate accumulation (Medium)**: Continued corporate purchases and expanded institutional access via Asian liquidity pools provide underlying structural support.
Risk Assessment
1. - **Inflation data volatility (High)**: The upcoming US CPI release and rising oil prices from geopolitical tensions could cement higher interest rates, triggering further drawdowns.
- **Technical vulnerability (Medium)**: A recent sharp drop to $76.8K on massive volume (634M USDT) highlights fragile support, despite a short-term RSI bounce from oversold levels.
- **Security concerns (Low)**: Decreasing costs for quantum computing attacks introduce long-term theoretical vulnerabilities.
Macro headwinds and ETF outflows create a precarious environment ahead of the CPI print.
Install Binance app to catch the latest BTC insights at https://app.binance.com/uni-qr/token-ai-report?token=BTC&symbol=BTCUSDT&product=spot&reportAt=1789113600000"eToken=USDT&utm_term=BTC&ref=514701768&utm_source=Brm8cLnPPfw7BoYTCqg55k&utm_medium=spot_insight®isterChannel=trading_insight
67
·
--
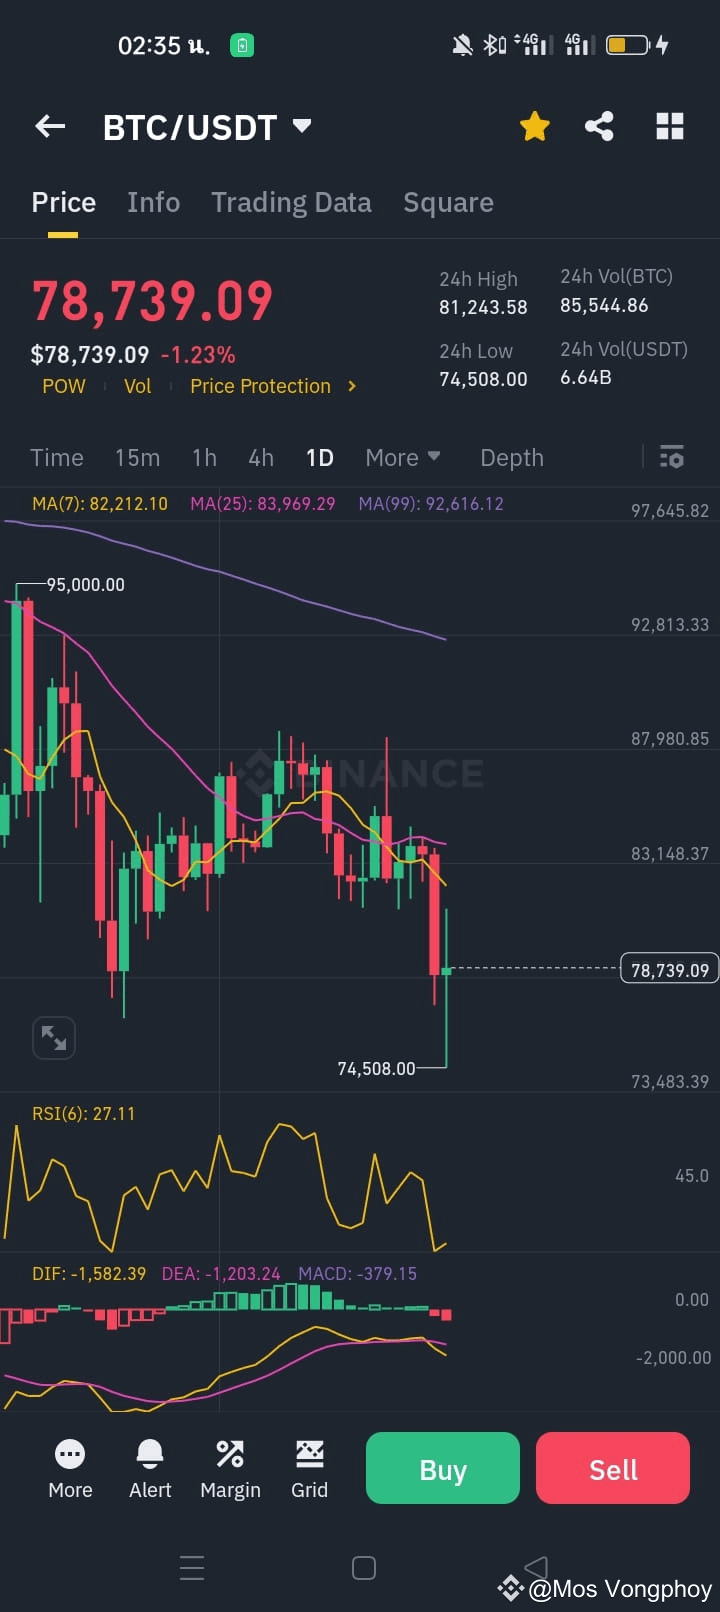
Do gráfico diário BTC/USDT que você forneceu:
O preço atual está em torno de 78.739 USDT, com uma queda de -1,23%
Recentemente, caiu para uma mínima de 74.508 USDT antes de um pequeno rebound
O RSI está em 27,11, na zona de sobre-venda (um rebound de curto prazo é possível, mas ainda não há sinal claro de reversão)
O MACD é negativo e o DIF está abaixo do DEA, indicando que a tendência de baixa ainda está em andamento
O preço está abaixo de todas as médias móveis chave (MA7, MA25, MA99), o que confirma uma perspectiva de baixa
Conclusão para amanhã:
Há uma chance de que o preço possa cair ainda mais, especialmente se romper o nível de suporte de 74.500.
No entanto, devido ao baixo RSI, um salto de curto prazo também pode ocorrer.
Do gráfico diário BTC/USDT que você forneceu:
O preço atual está em torno de 78.739 USDT, com uma queda de -1,23%
Recentemente, caiu para uma mínima de 74.508 USDT antes de um pequeno rebound
O RSI está em 27,11, na zona de sobre-venda (um rebound de curto prazo é possível, mas ainda não há sinal claro de reversão)
O MACD é negativo e o DIF está abaixo do DEA, indicando que a tendência de baixa ainda está em andamento
O preço está abaixo de todas as médias móveis chave (MA7, MA25, MA99), o que confirma uma perspectiva de baixa
Conclusão para amanhã:
Há uma chance de que o preço possa cair ainda mais, especialmente se romper o nível de suporte de 74.500.
No entanto, devido ao baixo RSI, um salto de curto prazo também pode ocorrer.
O preço atual está em torno de 78.739 USDT, com uma queda de -1,23%
Recentemente, caiu para uma mínima de 74.508 USDT antes de um pequeno rebound
O RSI está em 27,11, na zona de sobre-venda (um rebound de curto prazo é possível, mas ainda não há sinal claro de reversão)
O MACD é negativo e o DIF está abaixo do DEA, indicando que a tendência de baixa ainda está em andamento
O preço está abaixo de todas as médias móveis chave (MA7, MA25, MA99), o que confirma uma perspectiva de baixa
Conclusão para amanhã:
Há uma chance de que o preço possa cair ainda mais, especialmente se romper o nível de suporte de 74.500.
No entanto, devido ao baixo RSI, um salto de curto prazo também pode ocorrer.
4
·
--
$BTC Do gráfico diário BTC/USDT que você forneceu:
O preço atual está em torno de 78.739 USDT, em queda de -1,23%
Recentemente caiu para um mínimo de 74.508 USDT antes de uma pequena recuperação
O RSI está em 27,11, na zona de sobrevenda (um rebound de curto prazo é possível, mas ainda não há um sinal claro de reversão)
O MACD é negativo e o DIF está abaixo do DEA, indicando que a tendência de baixa ainda está em andamento
O preço está abaixo de todas as médias móveis chave (MA7, MA25, MA99), o que confirma uma perspectiva de baixa
Conclusão para amanhã:
Há uma chance de que o preço possa cair ainda mais, especialmente se romper abaixo do nível de suporte de 74.500.
No entanto, devido ao baixo RSI, um bounce de curto prazo também pode ocorrer.
$BTC Do gráfico diário BTC/USDT que você forneceu:
O preço atual está em torno de 78.739 USDT, em queda de -1,23%
Recentemente caiu para um mínimo de 74.508 USDT antes de uma pequena recuperação
O RSI está em 27,11, na zona de sobrevenda (um rebound de curto prazo é possível, mas ainda não há um sinal claro de reversão)
O MACD é negativo e o DIF está abaixo do DEA, indicando que a tendência de baixa ainda está em andamento
O preço está abaixo de todas as médias móveis chave (MA7, MA25, MA99), o que confirma uma perspectiva de baixa
Conclusão para amanhã:
Há uma chance de que o preço possa cair ainda mais, especialmente se romper abaixo do nível de suporte de 74.500.
No entanto, devido ao baixo RSI, um bounce de curto prazo também pode ocorrer.
O preço atual está em torno de 78.739 USDT, em queda de -1,23%
Recentemente caiu para um mínimo de 74.508 USDT antes de uma pequena recuperação
O RSI está em 27,11, na zona de sobrevenda (um rebound de curto prazo é possível, mas ainda não há um sinal claro de reversão)
O MACD é negativo e o DIF está abaixo do DEA, indicando que a tendência de baixa ainda está em andamento
O preço está abaixo de todas as médias móveis chave (MA7, MA25, MA99), o que confirma uma perspectiva de baixa
Conclusão para amanhã:
Há uma chance de que o preço possa cair ainda mais, especialmente se romper abaixo do nível de suporte de 74.500.
No entanto, devido ao baixo RSI, um bounce de curto prazo também pode ocorrer.
3
·
--
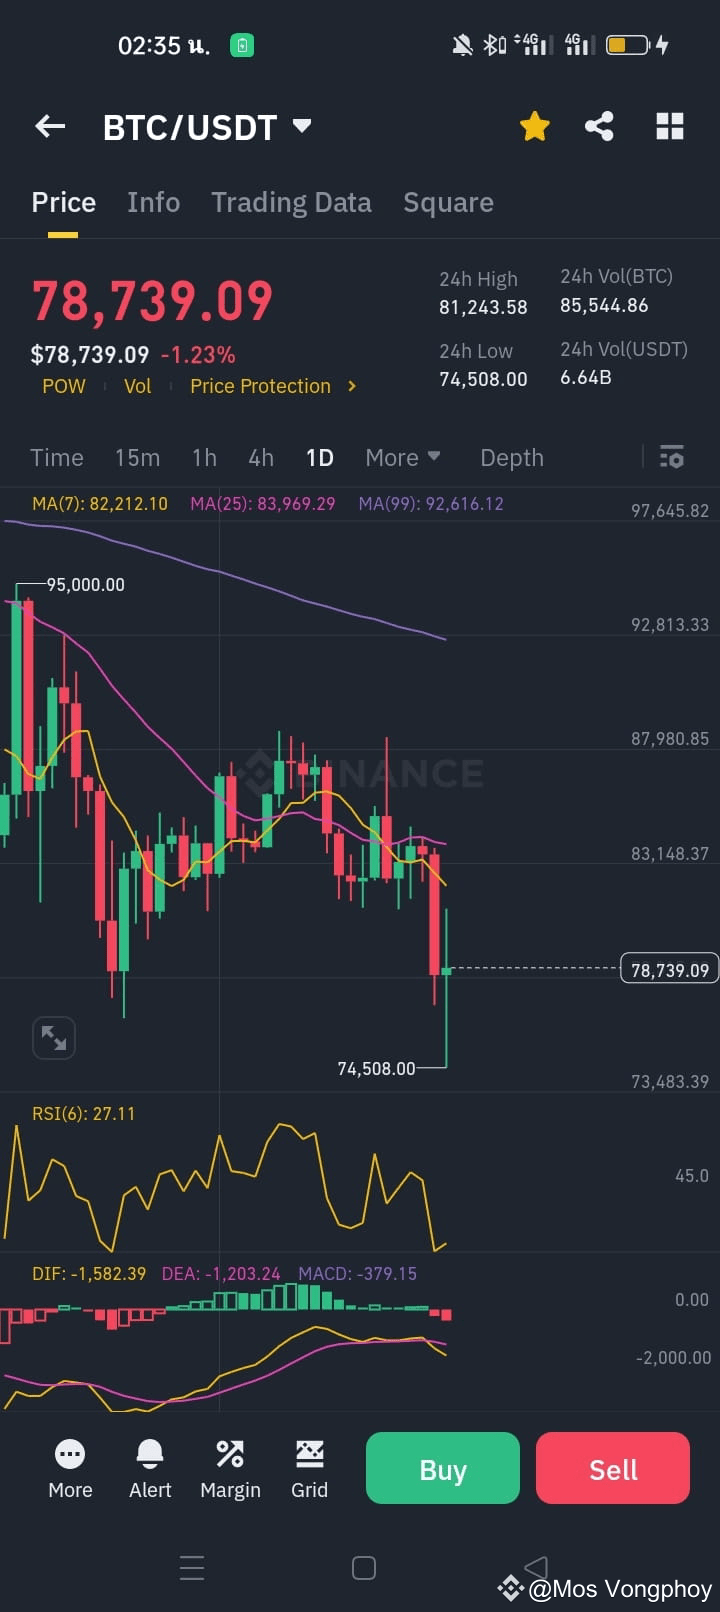
#BTCBelow80K A partir do gráfico diário BTC/USDT que você forneceu:
O preço atual está em torno de 78.739 USDT, com uma queda de -1,23%
Recentemente caiu para um mínimo de 74.508 USDT antes de um pequeno rebote
O RSI está em 27,11, na zona de sobrevenda (um rebote de curto prazo é possível, mas ainda não há um sinal claro de reversão)
O MACD é negativo e o DIF está abaixo do DEA, indicando que a tendência de baixa ainda está em andamento
O preço está abaixo de todas as médias móveis chave (MA7, MA25, MA99), o que confirma uma perspectiva de baixa
Conclusão para amanhã:
Há uma chance de que o preço possa cair ainda mais, especialmente se romper abaixo do nível de suporte de 74.500.
No entanto, devido ao baixo RSI, um pequeno impulso de curto prazo também pode ocorrer.
#BTCBelow80K A partir do gráfico diário BTC/USDT que você forneceu:
O preço atual está em torno de 78.739 USDT, com uma queda de -1,23%
Recentemente caiu para um mínimo de 74.508 USDT antes de um pequeno rebote
O RSI está em 27,11, na zona de sobrevenda (um rebote de curto prazo é possível, mas ainda não há um sinal claro de reversão)
O MACD é negativo e o DIF está abaixo do DEA, indicando que a tendência de baixa ainda está em andamento
O preço está abaixo de todas as médias móveis chave (MA7, MA25, MA99), o que confirma uma perspectiva de baixa
Conclusão para amanhã:
Há uma chance de que o preço possa cair ainda mais, especialmente se romper abaixo do nível de suporte de 74.500.
No entanto, devido ao baixo RSI, um pequeno impulso de curto prazo também pode ocorrer.
O preço atual está em torno de 78.739 USDT, com uma queda de -1,23%
Recentemente caiu para um mínimo de 74.508 USDT antes de um pequeno rebote
O RSI está em 27,11, na zona de sobrevenda (um rebote de curto prazo é possível, mas ainda não há um sinal claro de reversão)
O MACD é negativo e o DIF está abaixo do DEA, indicando que a tendência de baixa ainda está em andamento
O preço está abaixo de todas as médias móveis chave (MA7, MA25, MA99), o que confirma uma perspectiva de baixa
Conclusão para amanhã:
Há uma chance de que o preço possa cair ainda mais, especialmente se romper abaixo do nível de suporte de 74.500.
No entanto, devido ao baixo RSI, um pequeno impulso de curto prazo também pode ocorrer.
2
·
--
#BTCBelow80K A partir do gráfico diário BTC/USDT que você forneceu:
O preço atual está em torno de 78.739 USDT, com queda de -1,23%
Recentemente caiu para um mínimo de 74.508 USDT antes de uma pequena recuperação
O RSI está em 27,11, na zona de sobrevenda (uma recuperação a curto prazo é possível, mas ainda não há um sinal claro de reversão)
O MACD está negativo e o DIF está abaixo do DEA, indicando que a tendência de baixa ainda está em andamento
O preço está abaixo de todas as médias móveis chave (MA7, MA25, MA99), o que confirma uma perspectiva de baixa
Conclusão para amanhã:
Há uma chance de o preço cair ainda mais, especialmente se romper abaixo do nível de suporte de 74.500.
No entanto, devido ao baixo RSI, um salto a curto prazo também pode ocorrer.
#BTCBelow80K A partir do gráfico diário BTC/USDT que você forneceu:
O preço atual está em torno de 78.739 USDT, com queda de -1,23%
Recentemente caiu para um mínimo de 74.508 USDT antes de uma pequena recuperação
O RSI está em 27,11, na zona de sobrevenda (uma recuperação a curto prazo é possível, mas ainda não há um sinal claro de reversão)
O MACD está negativo e o DIF está abaixo do DEA, indicando que a tendência de baixa ainda está em andamento
O preço está abaixo de todas as médias móveis chave (MA7, MA25, MA99), o que confirma uma perspectiva de baixa
Conclusão para amanhã:
Há uma chance de o preço cair ainda mais, especialmente se romper abaixo do nível de suporte de 74.500.
No entanto, devido ao baixo RSI, um salto a curto prazo também pode ocorrer.
O preço atual está em torno de 78.739 USDT, com queda de -1,23%
Recentemente caiu para um mínimo de 74.508 USDT antes de uma pequena recuperação
O RSI está em 27,11, na zona de sobrevenda (uma recuperação a curto prazo é possível, mas ainda não há um sinal claro de reversão)
O MACD está negativo e o DIF está abaixo do DEA, indicando que a tendência de baixa ainda está em andamento
O preço está abaixo de todas as médias móveis chave (MA7, MA25, MA99), o que confirma uma perspectiva de baixa
Conclusão para amanhã:
Há uma chance de o preço cair ainda mais, especialmente se romper abaixo do nível de suporte de 74.500.
No entanto, devido ao baixo RSI, um salto a curto prazo também pode ocorrer.
248
·
--
$BTC Com base no gráfico atual para BTC/USDT, aqui está uma análise para ajudar você a decidir se deve COMPRAR ou VENDER:
Observações Chave:
Preço Atual: $84,123.79
Máxima em 24h: $84,720
Mínima em 24h: $81,659
O preço está próximo de um nível de resistência de curto prazo.
Médias Móveis:
MA(7) (Curto Prazo): $83,228.58 (O preço está acima disso, mostrando leve momento altista)
MA(25) (Médio Prazo): $84,259.52 (O preço está logo abaixo disso, indicando resistência)
MA(99) (Longo Prazo): $93,049.09 (Bem acima do preço atual, significando que a tendência de longo prazo ainda é baixista)
RSI (6): 50.79
O RSI é neutro, significando que não há sinal claro de sobrecompra ou sobrevenda.
Indicador MACD:
O MACD é levemente positivo (92.87), mostrando que a pressão de compra está aumentando, mas ainda incerta.
Guia de Decisão:
COMPRE se:
O BTC ultrapassar a resistência de $84,720 com volume forte.
O MACD continuar subindo e o RSI se mover acima de 60 (indicando forte momento altista).
O BTC mantiver o preço acima da MA(25) ($84,259) para confirmação.
VENDA se:
O BTC cair abaixo de $81,659, indicando uma quebra baixista.
O RSI cair abaixo de 40 (mostrando aumento da pressão de venda).
O MACD cruzar para baixo, mostrando reversão de tendência para baixista.
Recomendação:
Operadores de curto prazo: Espere o BTC confirmar uma quebra acima de $84,720 antes de comprar.
Investidores de longo prazo: Se o BTC cair perto de $81,659 - $80,000, pode ser uma melhor oportunidade de compra.
Se você já possui BTC: Considere realizar lucro parcial se ele tiver dificuldades para ultrapassar $84,720.
$BTC Com base no gráfico atual para BTC/USDT, aqui está uma análise para ajudar você a decidir se deve COMPRAR ou VENDER:
Observações Chave:
Preço Atual: $84,123.79
Máxima em 24h: $84,720
Mínima em 24h: $81,659
O preço está próximo de um nível de resistência de curto prazo.
Médias Móveis:
MA(7) (Curto Prazo): $83,228.58 (O preço está acima disso, mostrando leve momento altista)
MA(25) (Médio Prazo): $84,259.52 (O preço está logo abaixo disso, indicando resistência)
MA(99) (Longo Prazo): $93,049.09 (Bem acima do preço atual, significando que a tendência de longo prazo ainda é baixista)
RSI (6): 50.79
O RSI é neutro, significando que não há sinal claro de sobrecompra ou sobrevenda.
Indicador MACD:
O MACD é levemente positivo (92.87), mostrando que a pressão de compra está aumentando, mas ainda incerta.
Guia de Decisão:
COMPRE se:
O BTC ultrapassar a resistência de $84,720 com volume forte.
O MACD continuar subindo e o RSI se mover acima de 60 (indicando forte momento altista).
O BTC mantiver o preço acima da MA(25) ($84,259) para confirmação.
VENDA se:
O BTC cair abaixo de $81,659, indicando uma quebra baixista.
O RSI cair abaixo de 40 (mostrando aumento da pressão de venda).
O MACD cruzar para baixo, mostrando reversão de tendência para baixista.
Recomendação:
Operadores de curto prazo: Espere o BTC confirmar uma quebra acima de $84,720 antes de comprar.
Investidores de longo prazo: Se o BTC cair perto de $81,659 - $80,000, pode ser uma melhor oportunidade de compra.
Se você já possui BTC: Considere realizar lucro parcial se ele tiver dificuldades para ultrapassar $84,720.
Observações Chave:
Preço Atual: $84,123.79
Máxima em 24h: $84,720
Mínima em 24h: $81,659
O preço está próximo de um nível de resistência de curto prazo.
Médias Móveis:
MA(7) (Curto Prazo): $83,228.58 (O preço está acima disso, mostrando leve momento altista)
MA(25) (Médio Prazo): $84,259.52 (O preço está logo abaixo disso, indicando resistência)
MA(99) (Longo Prazo): $93,049.09 (Bem acima do preço atual, significando que a tendência de longo prazo ainda é baixista)
RSI (6): 50.79
O RSI é neutro, significando que não há sinal claro de sobrecompra ou sobrevenda.
Indicador MACD:
O MACD é levemente positivo (92.87), mostrando que a pressão de compra está aumentando, mas ainda incerta.
Guia de Decisão:
COMPRE se:
O BTC ultrapassar a resistência de $84,720 com volume forte.
O MACD continuar subindo e o RSI se mover acima de 60 (indicando forte momento altista).
O BTC mantiver o preço acima da MA(25) ($84,259) para confirmação.
VENDA se:
O BTC cair abaixo de $81,659, indicando uma quebra baixista.
O RSI cair abaixo de 40 (mostrando aumento da pressão de venda).
O MACD cruzar para baixo, mostrando reversão de tendência para baixista.
Recomendação:
Operadores de curto prazo: Espere o BTC confirmar uma quebra acima de $84,720 antes de comprar.
Investidores de longo prazo: Se o BTC cair perto de $81,659 - $80,000, pode ser uma melhor oportunidade de compra.
Se você já possui BTC: Considere realizar lucro parcial se ele tiver dificuldades para ultrapassar $84,720.
264
·
--
#BinanceEarnYieldArena Com base no gráfico atual para BTC/USDT, aqui está uma análise para ajudar você a decidir se deve COMPRAR ou VENDER:
Observações Chave:
Preço Atual: $84,123.79
Máxima em 24h: $84,720
Mínima em 24h: $81,659
O preço está próximo de um nível de resistência de curto prazo.
Médias Móveis:
MA(7) (Curto Prazo): $83,228.58 (O preço está acima disso, mostrando leve momentum de alta)
MA(25) (Médio Prazo): $84,259.52 (O preço está logo abaixo disso, indicando resistência)
MA(99) (Longo Prazo): $93,049.09 (Bem acima do preço atual, o que significa que a tendência de longo prazo ainda é de baixa)
RSI (6): 50.79
O RSI é neutro, significando que não há um sinal claro de sobrecompra ou sobrevenda.
Indicador MACD:
O MACD é levemente positivo (92.87), mostrando que a pressão de compra está aumentando, mas ainda incerta.
Guia de Decisão:
COMPRAR se:
BTC ultrapassar a resistência de $84,720 com forte volume.
O MACD continuar subindo e o RSI se mover acima de 60 (indicando forte momentum de alta).
BTC manter o preço acima da MA(25) ($84,259) para confirmação.
VENDER se:
BTC cair abaixo de $81,659, indicando uma quebra de baixa.
O RSI cair abaixo de 40 (mostrando aumento da pressão de venda).
O MACD cruzar para baixo, mostrando reversão de tendência para baixa.
Recomendação:
Traders de curto prazo: Espere que o BTC confirme uma ruptura acima de $84,720 antes de comprar.
Investidores de longo prazo: Se o BTC cair perto de $81,659 - $80,000, pode ser uma melhor oportunidade de compra.
Se você já possui BTC: Considere realizar lucro parcial se ele tiver dificuldades para ultrapassar $84,720.
#BinanceEarnYieldArena Com base no gráfico atual para BTC/USDT, aqui está uma análise para ajudar você a decidir se deve COMPRAR ou VENDER:
Observações Chave:
Preço Atual: $84,123.79
Máxima em 24h: $84,720
Mínima em 24h: $81,659
O preço está próximo de um nível de resistência de curto prazo.
Médias Móveis:
MA(7) (Curto Prazo): $83,228.58 (O preço está acima disso, mostrando leve momentum de alta)
MA(25) (Médio Prazo): $84,259.52 (O preço está logo abaixo disso, indicando resistência)
MA(99) (Longo Prazo): $93,049.09 (Bem acima do preço atual, o que significa que a tendência de longo prazo ainda é de baixa)
RSI (6): 50.79
O RSI é neutro, significando que não há um sinal claro de sobrecompra ou sobrevenda.
Indicador MACD:
O MACD é levemente positivo (92.87), mostrando que a pressão de compra está aumentando, mas ainda incerta.
Guia de Decisão:
COMPRAR se:
BTC ultrapassar a resistência de $84,720 com forte volume.
O MACD continuar subindo e o RSI se mover acima de 60 (indicando forte momentum de alta).
BTC manter o preço acima da MA(25) ($84,259) para confirmação.
VENDER se:
BTC cair abaixo de $81,659, indicando uma quebra de baixa.
O RSI cair abaixo de 40 (mostrando aumento da pressão de venda).
O MACD cruzar para baixo, mostrando reversão de tendência para baixa.
Recomendação:
Traders de curto prazo: Espere que o BTC confirme uma ruptura acima de $84,720 antes de comprar.
Investidores de longo prazo: Se o BTC cair perto de $81,659 - $80,000, pode ser uma melhor oportunidade de compra.
Se você já possui BTC: Considere realizar lucro parcial se ele tiver dificuldades para ultrapassar $84,720.
Observações Chave:
Preço Atual: $84,123.79
Máxima em 24h: $84,720
Mínima em 24h: $81,659
O preço está próximo de um nível de resistência de curto prazo.
Médias Móveis:
MA(7) (Curto Prazo): $83,228.58 (O preço está acima disso, mostrando leve momentum de alta)
MA(25) (Médio Prazo): $84,259.52 (O preço está logo abaixo disso, indicando resistência)
MA(99) (Longo Prazo): $93,049.09 (Bem acima do preço atual, o que significa que a tendência de longo prazo ainda é de baixa)
RSI (6): 50.79
O RSI é neutro, significando que não há um sinal claro de sobrecompra ou sobrevenda.
Indicador MACD:
O MACD é levemente positivo (92.87), mostrando que a pressão de compra está aumentando, mas ainda incerta.
Guia de Decisão:
COMPRAR se:
BTC ultrapassar a resistência de $84,720 com forte volume.
O MACD continuar subindo e o RSI se mover acima de 60 (indicando forte momentum de alta).
BTC manter o preço acima da MA(25) ($84,259) para confirmação.
VENDER se:
BTC cair abaixo de $81,659, indicando uma quebra de baixa.
O RSI cair abaixo de 40 (mostrando aumento da pressão de venda).
O MACD cruzar para baixo, mostrando reversão de tendência para baixa.
Recomendação:
Traders de curto prazo: Espere que o BTC confirme uma ruptura acima de $84,720 antes de comprar.
Investidores de longo prazo: Se o BTC cair perto de $81,659 - $80,000, pode ser uma melhor oportunidade de compra.
Se você já possui BTC: Considere realizar lucro parcial se ele tiver dificuldades para ultrapassar $84,720.
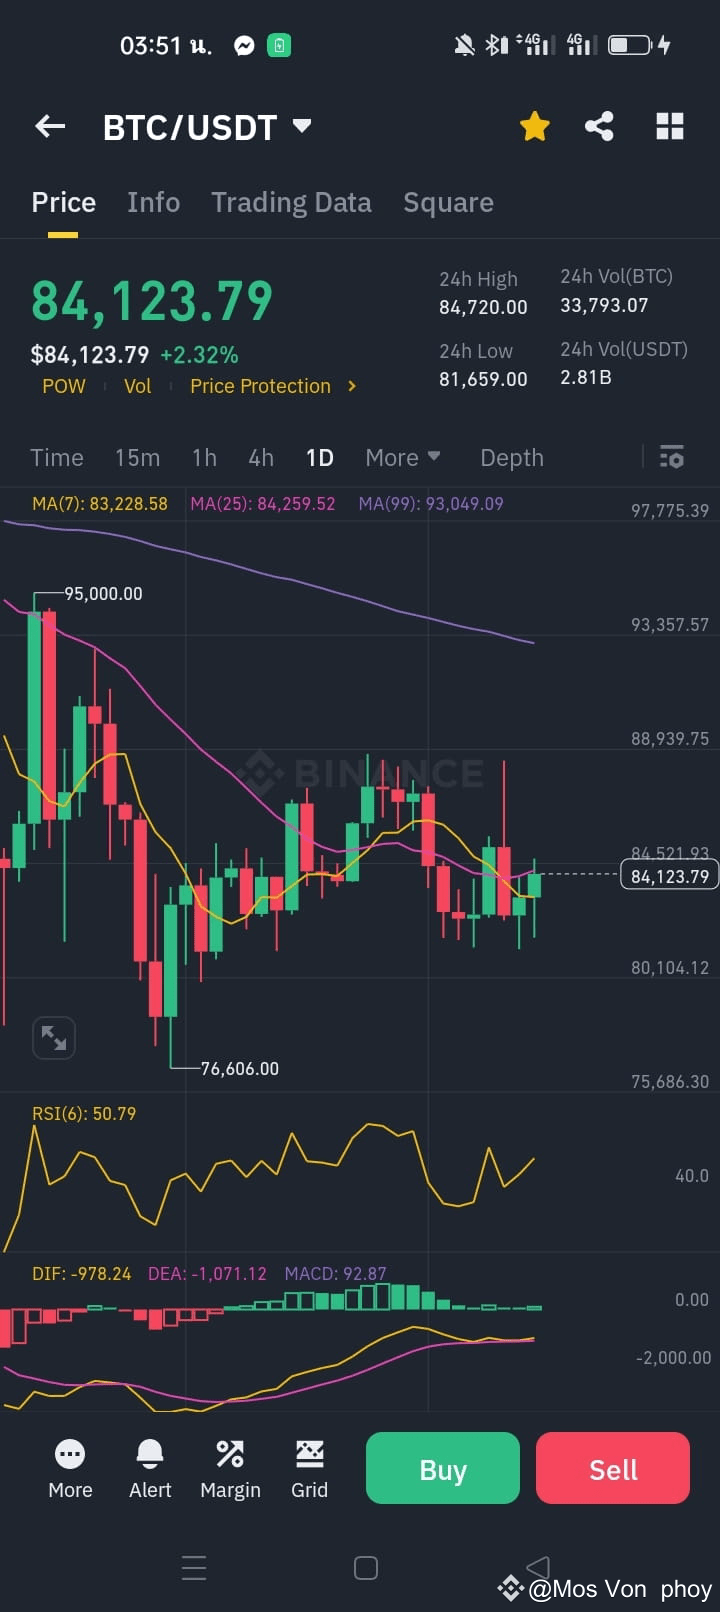
396
·
--
Com base no gráfico atual para BTC/USDT, aqui está uma análise para ajudá-lo a decidir se deve COMPRAR ou VENDER:
Observações Chave:
1. Preço Atual: $84,123.79
Máxima em 24h: $84,720
Mínima em 24h: $81,659
O preço está próximo de um nível de resistência de curto prazo.
2. Médias Móveis:
MA(7) (Curto Prazo): $83,228.58 (O preço está acima disso, mostrando leve momento de alta)
MA(25) (Médio Prazo): $84,259.52 (O preço está logo abaixo disso, indicando resistência)
MA(99) (Longo Prazo): $93,049.09 (Bem acima do preço atual, significando que a tendência de longo prazo ainda é de baixa)
3. RSI (6): 50.79
O RSI é neutro, significando que não há sinal claro de sobrecompra ou sobrevenda.
4. Indicador MACD:
O MACD é levemente positivo (92.87), mostrando que a pressão de compra está aumentando, mas ainda é incerta.
Guia de Decisão:
COMPRAR se:
BTC ultrapassar a resistência de $84,720 com volume forte.
O MACD continuar subindo e o RSI se mover acima de 60 (indicando forte momento de alta).
BTC manter o preço acima da MA(25) ($84,259) para confirmação.
VENDER se:
BTC cair abaixo de $81,659, indicando uma ruptura de baixa.
O RSI cair abaixo de 40 (mostrando aumento na pressão de venda).
O MACD cruzar para baixo, mostrando reversão de tendência para baixa.
Recomendação:
Operadores de curto prazo: Aguarde o BTC confirmar uma ruptura acima de $84,720 antes de comprar.
Investidores de longo prazo: Se o BTC cair perto de $81,659 - $80,000, pode ser uma melhor oportunidade de compra.
Se você já possui BTC: Considere realizar lucro parcial se ele tiver dificuldades para romper $84,720.
Com base no gráfico atual para BTC/USDT, aqui está uma análise para ajudá-lo a decidir se deve COMPRAR ou VENDER:
Observações Chave:
1. Preço Atual: $84,123.79
Máxima em 24h: $84,720
Mínima em 24h: $81,659
O preço está próximo de um nível de resistência de curto prazo.
2. Médias Móveis:
MA(7) (Curto Prazo): $83,228.58 (O preço está acima disso, mostrando leve momento de alta)
MA(25) (Médio Prazo): $84,259.52 (O preço está logo abaixo disso, indicando resistência)
MA(99) (Longo Prazo): $93,049.09 (Bem acima do preço atual, significando que a tendência de longo prazo ainda é de baixa)
3. RSI (6): 50.79
O RSI é neutro, significando que não há sinal claro de sobrecompra ou sobrevenda.
4. Indicador MACD:
O MACD é levemente positivo (92.87), mostrando que a pressão de compra está aumentando, mas ainda é incerta.
Guia de Decisão:
COMPRAR se:
BTC ultrapassar a resistência de $84,720 com volume forte.
O MACD continuar subindo e o RSI se mover acima de 60 (indicando forte momento de alta).
BTC manter o preço acima da MA(25) ($84,259) para confirmação.
VENDER se:
BTC cair abaixo de $81,659, indicando uma ruptura de baixa.
O RSI cair abaixo de 40 (mostrando aumento na pressão de venda).
O MACD cruzar para baixo, mostrando reversão de tendência para baixa.
Recomendação:
Operadores de curto prazo: Aguarde o BTC confirmar uma ruptura acima de $84,720 antes de comprar.
Investidores de longo prazo: Se o BTC cair perto de $81,659 - $80,000, pode ser uma melhor oportunidade de compra.
Se você já possui BTC: Considere realizar lucro parcial se ele tiver dificuldades para romper $84,720.
Observações Chave:
1. Preço Atual: $84,123.79
Máxima em 24h: $84,720
Mínima em 24h: $81,659
O preço está próximo de um nível de resistência de curto prazo.
2. Médias Móveis:
MA(7) (Curto Prazo): $83,228.58 (O preço está acima disso, mostrando leve momento de alta)
MA(25) (Médio Prazo): $84,259.52 (O preço está logo abaixo disso, indicando resistência)
MA(99) (Longo Prazo): $93,049.09 (Bem acima do preço atual, significando que a tendência de longo prazo ainda é de baixa)
3. RSI (6): 50.79
O RSI é neutro, significando que não há sinal claro de sobrecompra ou sobrevenda.
4. Indicador MACD:
O MACD é levemente positivo (92.87), mostrando que a pressão de compra está aumentando, mas ainda é incerta.
Guia de Decisão:
COMPRAR se:
BTC ultrapassar a resistência de $84,720 com volume forte.
O MACD continuar subindo e o RSI se mover acima de 60 (indicando forte momento de alta).
BTC manter o preço acima da MA(25) ($84,259) para confirmação.
VENDER se:
BTC cair abaixo de $81,659, indicando uma ruptura de baixa.
O RSI cair abaixo de 40 (mostrando aumento na pressão de venda).
O MACD cruzar para baixo, mostrando reversão de tendência para baixa.
Recomendação:
Operadores de curto prazo: Aguarde o BTC confirmar uma ruptura acima de $84,720 antes de comprar.
Investidores de longo prazo: Se o BTC cair perto de $81,659 - $80,000, pode ser uma melhor oportunidade de compra.
Se você já possui BTC: Considere realizar lucro parcial se ele tiver dificuldades para romper $84,720.
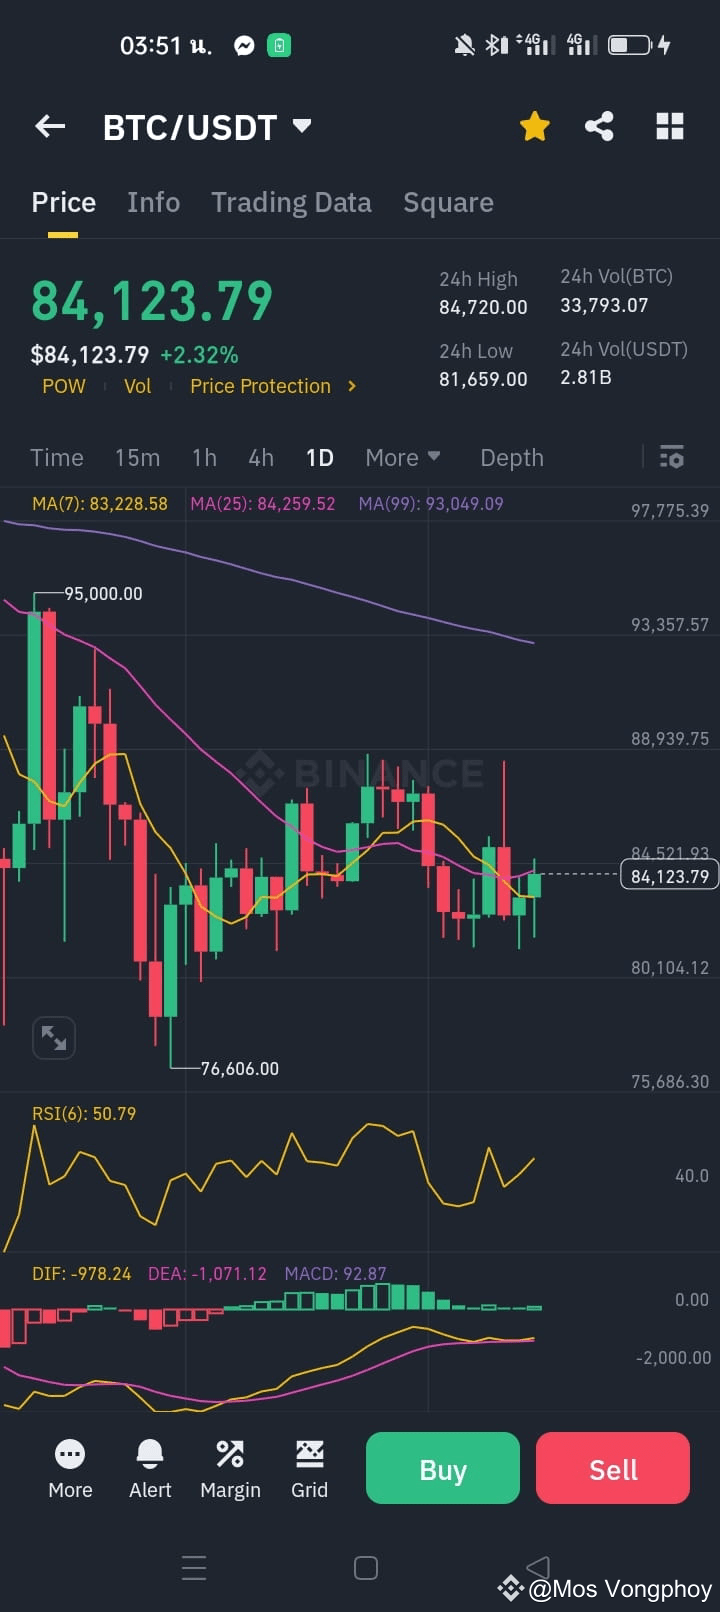
2
282
·
--
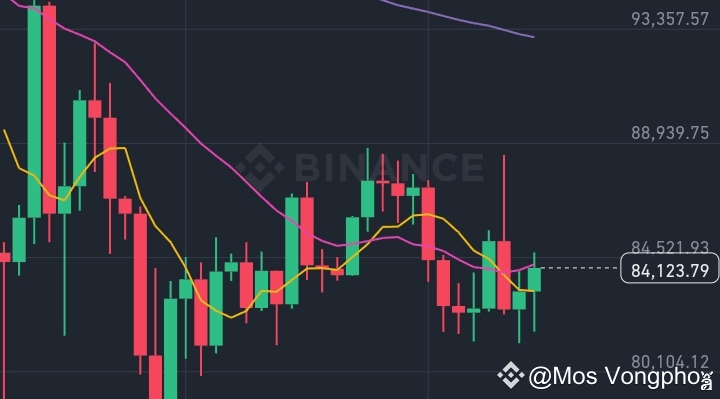
Artigo
Bitcoin todayFrom the graph displayed in the Binance app and technical factors, there are several interesting points:
Short-term trend of BTC/USDT
Moving Average (MA)
MA(7) = 83,228.58 (short-term moving average)
MA(25) = 84,259.52 (medium-term moving average)
MA(99) = 93,049.09 (long-term moving average)
Bitcoin today
From the graph displayed in the Binance app and technical factors, there are several interesting points:
Short-term trend of BTC/USDT
Moving Average (MA)
MA(7) = 83,228.58 (short-term moving average)
MA(25) = 84,259.52 (medium-term moving average)
MA(99) = 93,049.09 (long-term moving average)
Short-term trend of BTC/USDT
Moving Average (MA)
MA(7) = 83,228.58 (short-term moving average)
MA(25) = 84,259.52 (medium-term moving average)
MA(99) = 93,049.09 (long-term moving average)
1
100
·
--
Com base no gráfico, o Bitcoin (BTC) está atualmente a $84.300, mostrando uma tendência de alta de 5,10%. A máxima de 24 horas é de $85.309,71 e a mínima é de $79.939,90. Indicadores técnicos como o RSI (66,95) sugerem um forte momento, enquanto o preço está se movendo em direção à média móvel de 99 períodos ($85.322,55).
Para que o Bitcoin alcance $100.000, ele precisa romper níveis de resistência chave em torno de $86.500 e $90.000. Se o momento de alta continuar e o BTC mantiver suporte acima de $80.000, ele tem o potencial de testar novas máximas. No entanto, as condições de mercado e fatores externos, como tendências macroeconômicas e sentimento do investidor, desempenharão um papel crucial.#BTC #Binance
Com base no gráfico, o Bitcoin (BTC) está atualmente a $84.300, mostrando uma tendência de alta de 5,10%. A máxima de 24 horas é de $85.309,71 e a mínima é de $79.939,90. Indicadores técnicos como o RSI (66,95) sugerem um forte momento, enquanto o preço está se movendo em direção à média móvel de 99 períodos ($85.322,55).
Para que o Bitcoin alcance $100.000, ele precisa romper níveis de resistência chave em torno de $86.500 e $90.000. Se o momento de alta continuar e o BTC mantiver suporte acima de $80.000, ele tem o potencial de testar novas máximas. No entanto, as condições de mercado e fatores externos, como tendências macroeconômicas e sentimento do investidor, desempenharão um papel crucial.#BTC #Binance
Para que o Bitcoin alcance $100.000, ele precisa romper níveis de resistência chave em torno de $86.500 e $90.000. Se o momento de alta continuar e o BTC mantiver suporte acima de $80.000, ele tem o potencial de testar novas máximas. No entanto, as condições de mercado e fatores externos, como tendências macroeconômicas e sentimento do investidor, desempenharão um papel crucial.#BTC #Binance
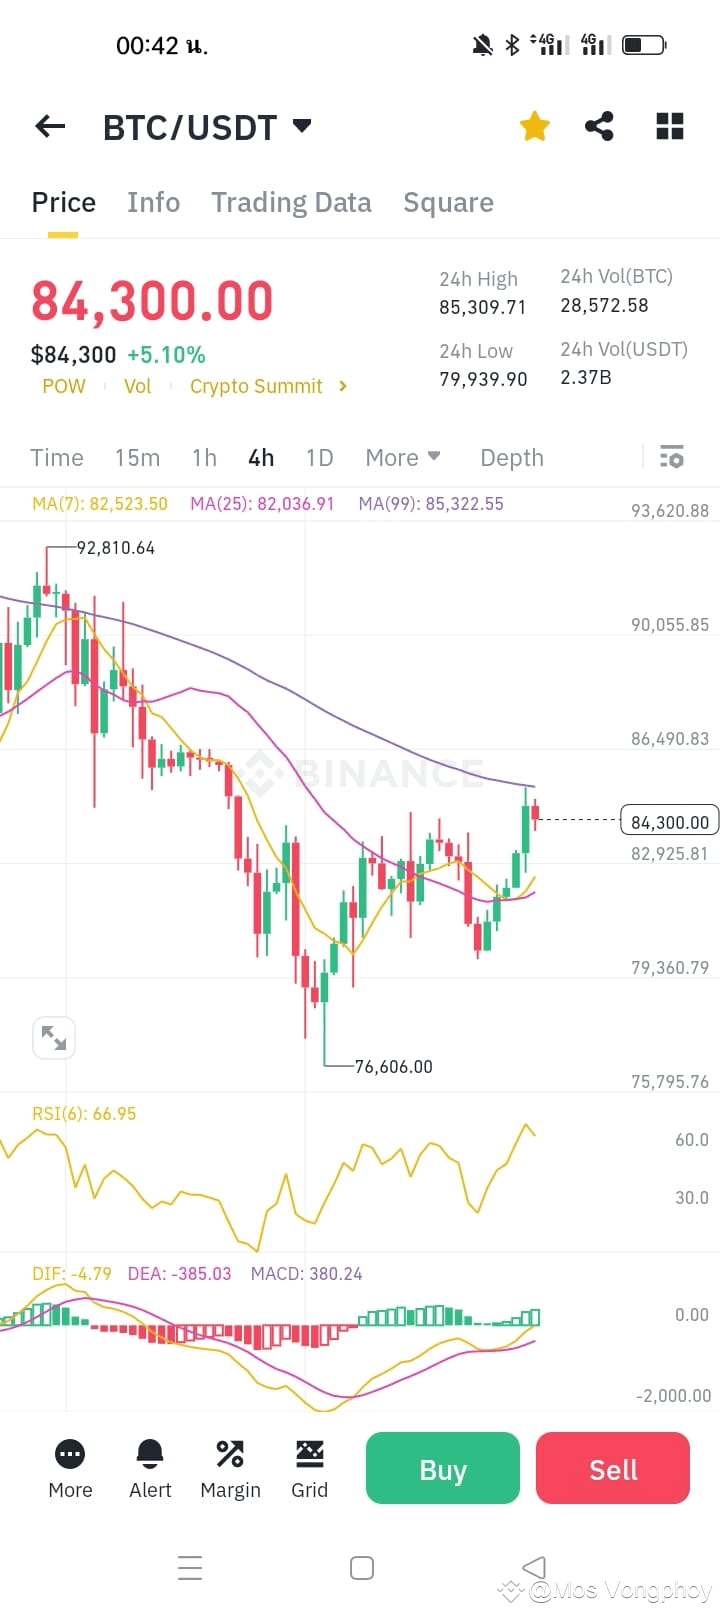
7
246
·
--
Em Baixa
Análise da Tendência de Preços BNB/USDT
Com base no gráfico e indicadores, aqui estão os fatores-chave a considerar:
Tendência de Preços e Médias Móveis (MA)
O preço atual é 578,28 USDT
A MA de 7 dias (567,68) está abaixo do preço, indicando uma possível recuperação
No entanto, a MA de 25 dias (608,12) e a MA de 99 dias (663,83) permanecem mais altas, sugerindo que a tendência de baixa ainda está intacta
Níveis de Suporte e Resistência
Suporte: Em torno de 567,99 USDT
Resistência: Primeiro em 590,48 USDT, depois em 608,12 USDT
RSI (Índice de Força Relativa)
RSI(6) está em 50,62, o que é neutro, indicando que não há forte impulso de compra ou venda
MACD (Convergência e Divergência de Médias Móveis)
DIF (-20,70) e DEA (-18,82) estão abaixo de zero, indicando uma tendência de baixa a longo prazo
MACD (-1,88) está começando a subir, indicando uma possível recuperação a curto prazo
Conclusão
Há sinais de uma recuperação a curto prazo à medida que o preço se move acima da MA7
No entanto, a tendência a longo prazo ainda é de baixa devido às MAs mais altas apontando para baixo
O RSI sugere um mercado neutro sem forte impulso
Se o preço ultrapassar 590,48 USDT e MA25 (608,12 USDT), uma nova alta é possível
Se cair abaixo de 567,99 USDT, pode retestar o suporte em torno de 500 USDT$BNB
Análise da Tendência de Preços BNB/USDT
Com base no gráfico e indicadores, aqui estão os fatores-chave a considerar:
Tendência de Preços e Médias Móveis (MA)
O preço atual é 578,28 USDT
A MA de 7 dias (567,68) está abaixo do preço, indicando uma possível recuperação
No entanto, a MA de 25 dias (608,12) e a MA de 99 dias (663,83) permanecem mais altas, sugerindo que a tendência de baixa ainda está intacta
Níveis de Suporte e Resistência
Suporte: Em torno de 567,99 USDT
Resistência: Primeiro em 590,48 USDT, depois em 608,12 USDT
RSI (Índice de Força Relativa)
RSI(6) está em 50,62, o que é neutro, indicando que não há forte impulso de compra ou venda
MACD (Convergência e Divergência de Médias Móveis)
DIF (-20,70) e DEA (-18,82) estão abaixo de zero, indicando uma tendência de baixa a longo prazo
MACD (-1,88) está começando a subir, indicando uma possível recuperação a curto prazo
Conclusão
Há sinais de uma recuperação a curto prazo à medida que o preço se move acima da MA7
No entanto, a tendência a longo prazo ainda é de baixa devido às MAs mais altas apontando para baixo
O RSI sugere um mercado neutro sem forte impulso
Se o preço ultrapassar 590,48 USDT e MA25 (608,12 USDT), uma nova alta é possível
Se cair abaixo de 567,99 USDT, pode retestar o suporte em torno de 500 USDT$BNB
Com base no gráfico e indicadores, aqui estão os fatores-chave a considerar:
Tendência de Preços e Médias Móveis (MA)
O preço atual é 578,28 USDT
A MA de 7 dias (567,68) está abaixo do preço, indicando uma possível recuperação
No entanto, a MA de 25 dias (608,12) e a MA de 99 dias (663,83) permanecem mais altas, sugerindo que a tendência de baixa ainda está intacta
Níveis de Suporte e Resistência
Suporte: Em torno de 567,99 USDT
Resistência: Primeiro em 590,48 USDT, depois em 608,12 USDT
RSI (Índice de Força Relativa)
RSI(6) está em 50,62, o que é neutro, indicando que não há forte impulso de compra ou venda
MACD (Convergência e Divergência de Médias Móveis)
DIF (-20,70) e DEA (-18,82) estão abaixo de zero, indicando uma tendência de baixa a longo prazo
MACD (-1,88) está começando a subir, indicando uma possível recuperação a curto prazo
Conclusão
Há sinais de uma recuperação a curto prazo à medida que o preço se move acima da MA7
No entanto, a tendência a longo prazo ainda é de baixa devido às MAs mais altas apontando para baixo
O RSI sugere um mercado neutro sem forte impulso
Se o preço ultrapassar 590,48 USDT e MA25 (608,12 USDT), uma nova alta é possível
Se cair abaixo de 567,99 USDT, pode retestar o suporte em torno de 500 USDT$BNB
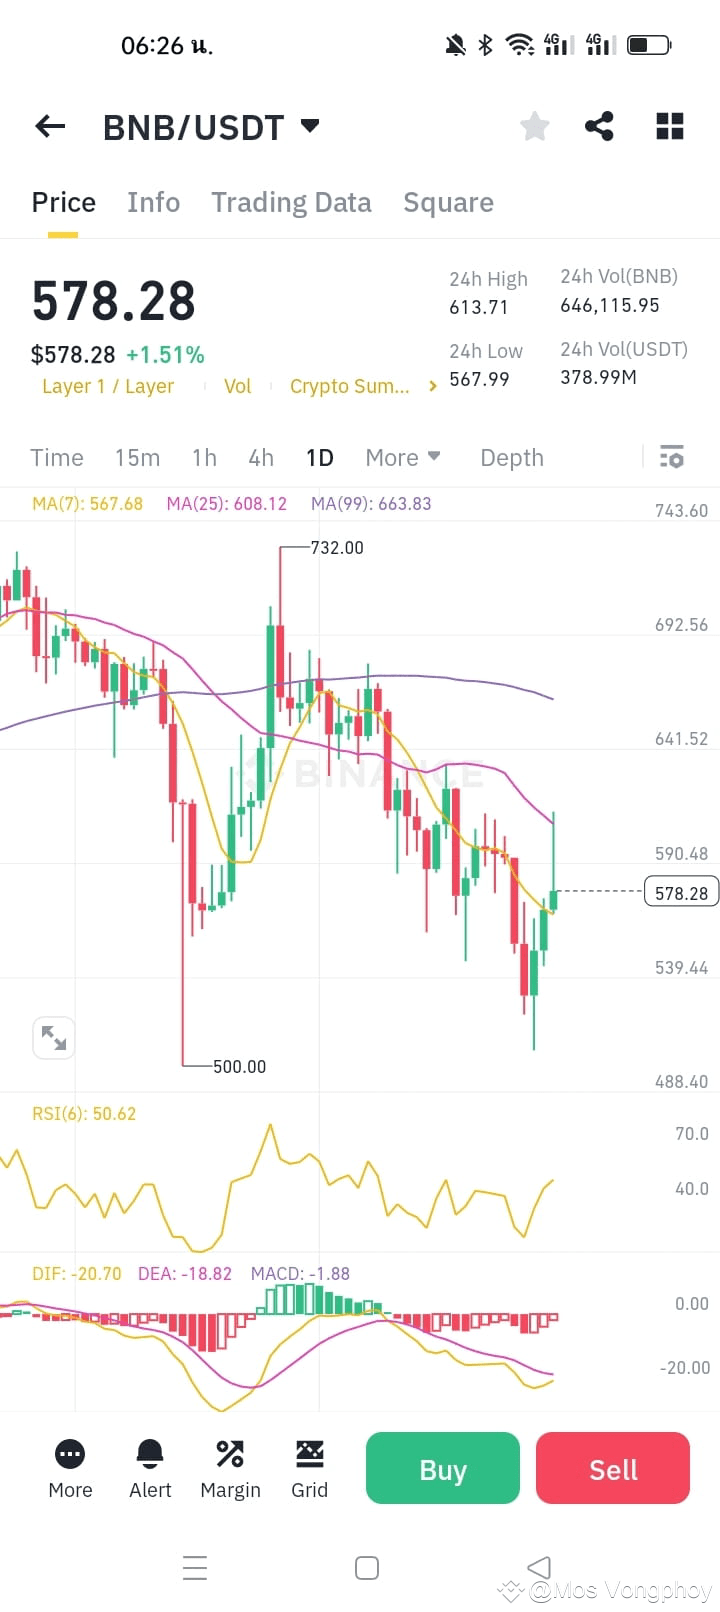
6
334
·
--
Análise do Gráfico Ethereum (ETH/USDT)
Informações Chave do Gráfico:
Preço: $1,871.08 (-1.96%)
Tendência: Tendência de Baixa (Baixista)
Nível de Suporte Chave: Aproximadamente $1,800
Nível de Resistência Chave: Aproximadamente $2,000
Detalhes da Análise do Gráfico:
Gráfico de Candlestick:
O preço tem diminuído continuamente.
Há muitas velas vermelhas, indicando forte pressão de venda.
Volume de Negociação:
O volume aumentou durante as quedas de preço, sugerindo forte momentum de venda.
Indicador MACD:
A linha MACD (azul) está abaixo da linha de Sinal (laranja).
O histograma é negativo e está em declínio, confirmando um momentum baixista.
Tendência Geral:
O preço está em uma clara tendência de baixa.
Há uma possibilidade de testar o nível de suporte de $1,800.
Se o preço não conseguir se manter acima deste nível, pode cair ainda mais para $1,700 ou até $1,600.
Isso sugere uma abordagem cautelosa, pois o mercado está mostrando fortes sinais de baixa.#FollowTheLeadTrader
Análise do Gráfico Ethereum (ETH/USDT)
Informações Chave do Gráfico:
Preço: $1,871.08 (-1.96%)
Tendência: Tendência de Baixa (Baixista)
Nível de Suporte Chave: Aproximadamente $1,800
Nível de Resistência Chave: Aproximadamente $2,000
Detalhes da Análise do Gráfico:
Gráfico de Candlestick:
O preço tem diminuído continuamente.
Há muitas velas vermelhas, indicando forte pressão de venda.
Volume de Negociação:
O volume aumentou durante as quedas de preço, sugerindo forte momentum de venda.
Indicador MACD:
A linha MACD (azul) está abaixo da linha de Sinal (laranja).
O histograma é negativo e está em declínio, confirmando um momentum baixista.
Tendência Geral:
O preço está em uma clara tendência de baixa.
Há uma possibilidade de testar o nível de suporte de $1,800.
Se o preço não conseguir se manter acima deste nível, pode cair ainda mais para $1,700 ou até $1,600.
Isso sugere uma abordagem cautelosa, pois o mercado está mostrando fortes sinais de baixa.#FollowTheLeadTrader
Informações Chave do Gráfico:
Preço: $1,871.08 (-1.96%)
Tendência: Tendência de Baixa (Baixista)
Nível de Suporte Chave: Aproximadamente $1,800
Nível de Resistência Chave: Aproximadamente $2,000
Detalhes da Análise do Gráfico:
Gráfico de Candlestick:
O preço tem diminuído continuamente.
Há muitas velas vermelhas, indicando forte pressão de venda.
Volume de Negociação:
O volume aumentou durante as quedas de preço, sugerindo forte momentum de venda.
Indicador MACD:
A linha MACD (azul) está abaixo da linha de Sinal (laranja).
O histograma é negativo e está em declínio, confirmando um momentum baixista.
Tendência Geral:
O preço está em uma clara tendência de baixa.
Há uma possibilidade de testar o nível de suporte de $1,800.
Se o preço não conseguir se manter acima deste nível, pode cair ainda mais para $1,700 ou até $1,600.
Isso sugere uma abordagem cautelosa, pois o mercado está mostrando fortes sinais de baixa.#FollowTheLeadTrader
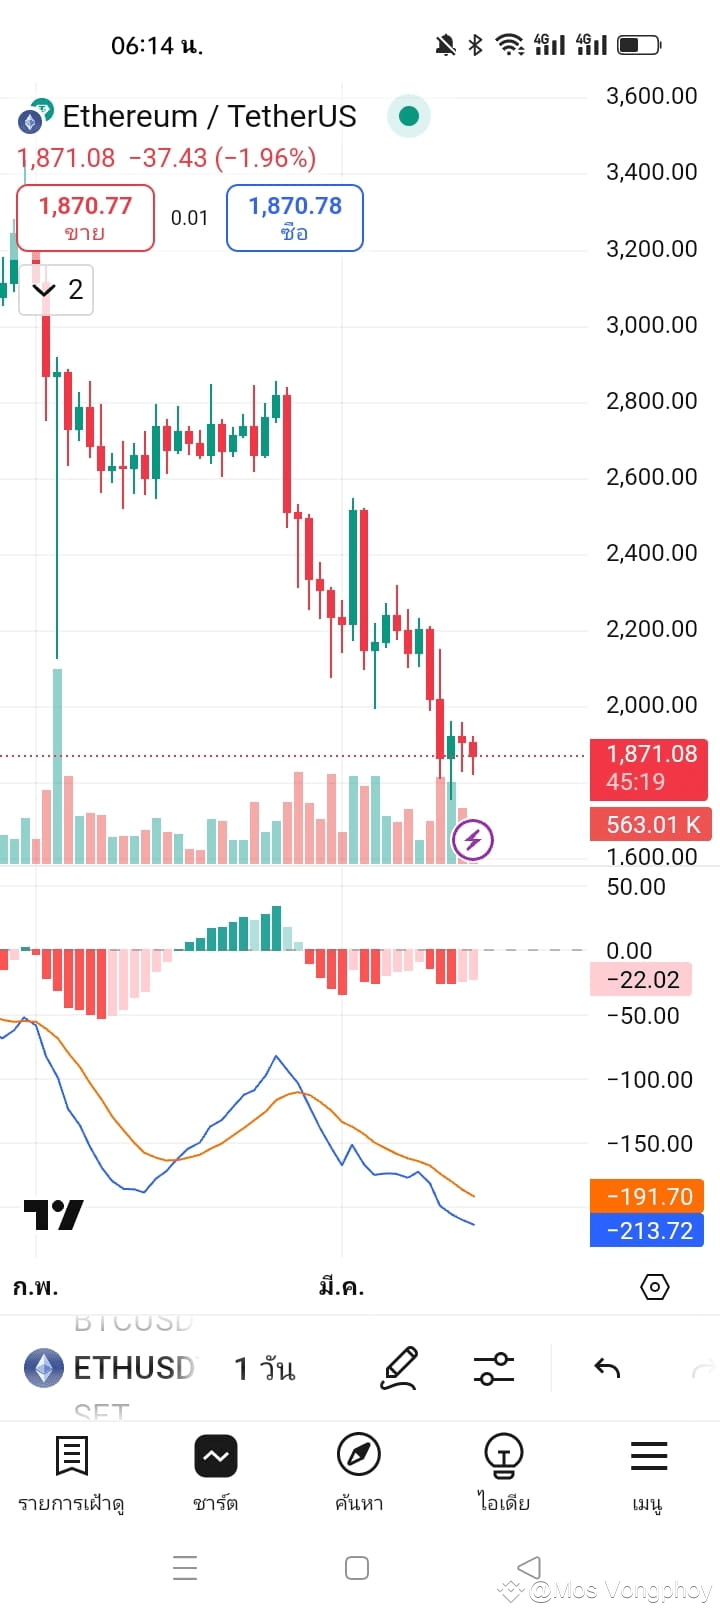
9
232
Inicia sessão para explorar mais conteúdos
Junta-te a utilizadores de criptomoedas de todo o mundo na Binance Square
⚡️ Obtém informações úteis e recentes sobre criptomoedas.
💬 Com a confiança da maior exchange de criptomoedas do mundo.
👍 Descobre perspetivas reais de criadores verificados.
E-mail/Número de telefone
Tópicos em Tendência
AIStocksWhatNext
933,995 visualizações
6,812 a discutir
Participe e ganhe recompensas de tráfego na nossa campanha de hashtag em alta
✨Tópico: Que outras oportunidades de investimento ainda existem enquanto as ações de IA continuam subindo?
👉Como participar:
Publique uma postagem curta ou um artigo com a hashtag #AIStocksWhatNext
Compartilhe se você está otimista ou pessimista e publique suas participações em ações de IA ou suas operações — usar o widget de negociação pode melhorar sua elegibilidade.
Você também pode fortalecer sua postagem compartilhando dados ou gráficos e evitando imagens geradas por IA.
✍️Crie conteúdo com base nos ângulos abaixo:
- A Nvidia diz que as vendas de chips vão dobrar no próximo ano, e as principais empresas de IA continuam registrando receita recorde; o gasto com computação por trás disso é igualmente impressionante. A demanda por IA realmente decolou? E por quanto tempo isso pode durar? As ações de IA estão em alta em todo o mercado. Isso é uma ruptura real ou apenas um repique de curto prazo?
- Líderes da indústria estão pedindo para desacelerar o desenvolvimento de IA, enquanto Trump planeja construir uma “Força de IA”, afirmando que a IA poderia representar 25% do PIB dos EUA no futuro. De que lado você está? O apoio em nível estadual será uma vitória de longo prazo para as ações de IA?
- Você está comprando ações de IA? Compartilhe com nosso widget de compartilhamento de negociações suas operações/posições relacionadas a IA.
⏰Período da campanha:
- 2026-09-22 7:00 - 2026-09-24 4:00 UTC
🎁Recompensa:
- As postagens qualificadas que cumprirem as diretrizes acima e tiverem mais de 100 palavras serão revisadas e poderão receber um impulso aleatório de tráfego de 500 a 3.000 visualizações. Você receberá uma notificação do seu secretário de feed caso sua postagem seja selecionada.
- Tenha a chance de ter seu artigo destacado no Binance Square Official
Precisa de ideias para sua postagem? Visite a página do tópico #AIStocksWhatNext ou a Square Guide on How to Post for Better Reach.
Binance Square Official
·600 gostos
·1.7M visualizações
BitcoinRejectedAt$87,300Twice
0 visualizações
0 a discutir
BCHJumps28%OnCMEFuturesListing
16,377 visualizações
598 a discutir