

Odunerd
54 Publicações

Odunerd
Denunciar
Bloquear Utilizador
BP-24948D0AD5FF
94 A seguir
432 Seguidores
1.3K+ Gostaram
Publicações
Tudo
Cotações
PINNED
·
--
Em Alta
muitas vezes negligenciamos nossas convicções e quando isso acontece você grita 😬 opa.
Além de TA e FA
existe algo chamado análise de sentimento
quais são os seus sentimentos sobre uma narrativa específica no espaço criptográfico e que efeito seus sentimentos oferecem a você, BOM ou RUIM?
Quero dizer, seja em alta ou em baixa, o que importa é o seu estado de espírito e não apenas o que o gráfico ou o MM publicam.
FIQUE FOCADO🤳
Tokens, estou direcionando minhas convicções para RN
#memes
#L2s
#AI
#exchtokens
muitas vezes negligenciamos nossas convicções e quando isso acontece você grita 😬 opa.
Além de TA e FA
existe algo chamado análise de sentimento
quais são os seus sentimentos sobre uma narrativa específica no espaço criptográfico e que efeito seus sentimentos oferecem a você, BOM ou RUIM?
Quero dizer, seja em alta ou em baixa, o que importa é o seu estado de espírito e não apenas o que o gráfico ou o MM publicam.
FIQUE FOCADO🤳
Tokens, estou direcionando minhas convicções para RN
#memes
#L2s
#AI
#exchtokens
Além de TA e FA
existe algo chamado análise de sentimento
quais são os seus sentimentos sobre uma narrativa específica no espaço criptográfico e que efeito seus sentimentos oferecem a você, BOM ou RUIM?
Quero dizer, seja em alta ou em baixa, o que importa é o seu estado de espírito e não apenas o que o gráfico ou o MM publicam.
FIQUE FOCADO🤳
Tokens, estou direcionando minhas convicções para RN
#memes
#L2s
#AI
#exchtokens

3
8
2.5k
·
--
Um token que mal está sobrevivendo para voltar a ficar de pé; desta vez não está parecendo nada bom para a família ripple, no momento..
#BitgetHackerMoves$83MStolenXRP
Um token que mal está sobrevivendo para voltar a ficar de pé; desta vez não está parecendo nada bom para a família ripple, no momento..
#BitgetHackerMoves$83MStolenXRP
#BitgetHackerMoves$83MStolenXRP
351
·
--
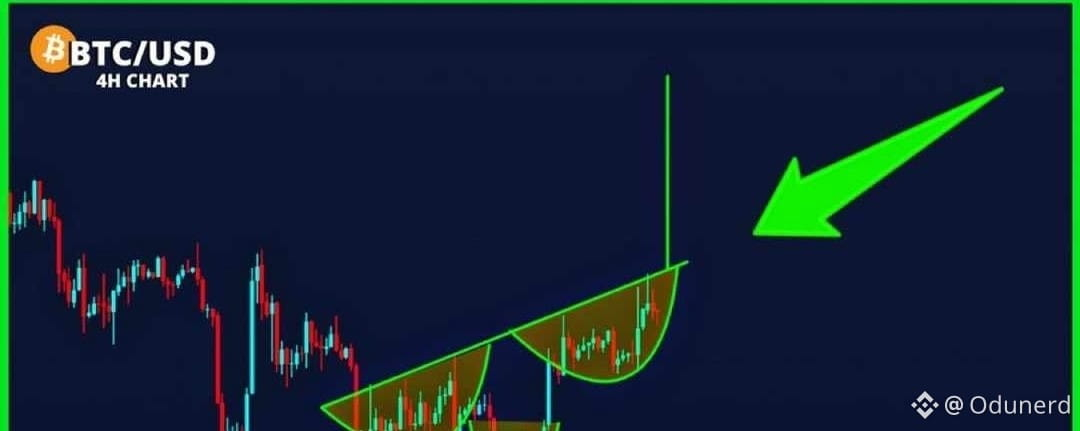
Artigo
Ver tradução
BITCOIN INCONSISTENCIES ANALYTICAL PROVEN..Was June 30, 2026 the Bitcoin Cycle Bottom?
One question has been sitting at the center of my Bitcoin analysis:
Did Bitcoin actually find its cycle bottom on June 30, 2026?
Rather than relying on the chart alone, I approached the question from two sides:
Market structure + on-chain and market data.
1. Starting With Price Action
I deliberately kept the technical analysis simple.
No complicated indicators.
Just price structure.
Bitcoin reached a low of approximately $58.53K on June 30.
Since then, the market has behaved differently from the downtrend that led into that low.
On the daily chart, $BTC moved away from the June low and entered a period of consolidation before beginning to form a sequence of higher highs and higher lows.
The weekly chart adds another important piece of context.
The June low has remained intact, while Bitcoin has recovered substantially from that level.
That is certainly worth paying attention to.
But there is an important distinction:
A strong recovery from a low does not, by itself, prove that the cycle bottom is in.
So I went deeper.
2. Looking Beneath the Chart
To test the June low from a data perspective, I built a framework around several metrics and historical comparisons:
- MVRV
- Bitcoin Realized Price
- ETF flows
- Historical cycle bottoms
- Peak-to-bottom drawdowns
- Post-bottom recovery behaviour
The objective wasn't to find one magic indicator.
Instead, I wanted to see whether multiple independent pieces of evidence were pointing toward the same conclusion.
Key numbers from the analysis
$58.53K — June 30 low
-53.11% — Peak-to-bottom drawdown
1.47 — Current MVRV
$53.19K — Realized Price
+30.52% — Recovery from the June low at the time of the analysis
When these figures are placed alongside historical Bitcoin cycle behaviour, the June 30 low starts to look increasingly significant.
3. What Does the Evidence Actually Tell Us?
The analysis suggests that June 30 is a credible candidate for the cycle bottom.
But there is an important caveat:
A candidate bottom is not the same thing as a confirmed cycle bottom.
Bitcoin has historically experienced significant recoveries that were later followed by another major move lower.
That's why I don't think one should look at the June low in isolation.
The more interesting observation is that both price structure and the underlying data are pointing toward a potential change in market behaviour around that period.
Price is showing a different structure.
The on-chain and market data provide additional evidence worth investigating.
But the higher-timeframe cycle still needs to prove itself.
4. Why Combine Technical Analysis With Data Analytics?
This is actually the bigger lesson behind the research.
The chart tells us what price is doing.
But data can help us investigate what may be happening underneath the price.
Instead of asking:
«"Does the chart look bullish?"»
The better analytical question becomes:
"Do multiple independent datasets support the same market hypothesis?"
That shift changes the way I approach crypto research.
Rather than relying on a single indicator or prediction, I want to combine:
Price → On-chain data → Historical behaviour → Market flows → Statistical context
Then let the evidence tell the story.
So, was June 30, 2026 the Bitcoin cycle bottom?
It is a credible candidate — but the data does not make it a confirmed fact yet.
For me, that's where the research becomes interesting.
The goal isn't to predict the market with certainty.
It's to identify important market events, collect the relevant data, test the hypothesis, and continue monitoring whether the evidence holds.
PS: I've put together the full research, dashboard, and methodology for anyone interested in going through the analysis from start to finish.
BITCOIN INCONSISTENCIES ANALYTICAL PROVEN..
Was June 30, 2026 the Bitcoin Cycle Bottom?
One question has been sitting at the center of my Bitcoin analysis:
Did Bitcoin actually find its cycle bottom on June 30, 2026?
Rather than relying on the chart alone, I approached the question from two sides:
Market structure + on-chain and market data.
1. Starting With Price Action
I deliberately kept the technical analysis simple.
No complicated indicators.
Just price structure.
Bitcoin reached a low of approximately $58.53K on June 30.
Since then, the market has behaved differently from the downtrend that led into that low.
On the daily chart, $BTC moved away from the June low and entered a period of consolidation before beginning to form a sequence of higher highs and higher lows.
The weekly chart adds another important piece of context.
The June low has remained intact, while Bitcoin has recovered substantially from that level.
That is certainly worth paying attention to.
But there is an important distinction:
A strong recovery from a low does not, by itself, prove that the cycle bottom is in.
So I went deeper.
2. Looking Beneath the Chart
To test the June low from a data perspective, I built a framework around several metrics and historical comparisons:
- MVRV
- Bitcoin Realized Price
- ETF flows
- Historical cycle bottoms
- Peak-to-bottom drawdowns
- Post-bottom recovery behaviour
The objective wasn't to find one magic indicator.
Instead, I wanted to see whether multiple independent pieces of evidence were pointing toward the same conclusion.
Key numbers from the analysis
$58.53K — June 30 low
-53.11% — Peak-to-bottom drawdown
1.47 — Current MVRV
$53.19K — Realized Price
+30.52% — Recovery from the June low at the time of the analysis
When these figures are placed alongside historical Bitcoin cycle behaviour, the June 30 low starts to look increasingly significant.
3. What Does the Evidence Actually Tell Us?
The analysis suggests that June 30 is a credible candidate for the cycle bottom.
But there is an important caveat:
A candidate bottom is not the same thing as a confirmed cycle bottom.
Bitcoin has historically experienced significant recoveries that were later followed by another major move lower.
That's why I don't think one should look at the June low in isolation.
The more interesting observation is that both price structure and the underlying data are pointing toward a potential change in market behaviour around that period.
Price is showing a different structure.
The on-chain and market data provide additional evidence worth investigating.
But the higher-timeframe cycle still needs to prove itself.
4. Why Combine Technical Analysis With Data Analytics?
This is actually the bigger lesson behind the research.
The chart tells us what price is doing.
But data can help us investigate what may be happening underneath the price.
Instead of asking:
«"Does the chart look bullish?"»
The better analytical question becomes:
"Do multiple independent datasets support the same market hypothesis?"
That shift changes the way I approach crypto research.
Rather than relying on a single indicator or prediction, I want to combine:
Price → On-chain data → Historical behaviour → Market flows → Statistical context
Then let the evidence tell the story.
So, was June 30, 2026 the Bitcoin cycle bottom?
It is a credible candidate — but the data does not make it a confirmed fact yet.
For me, that's where the research becomes interesting.
The goal isn't to predict the market with certainty.
It's to identify important market events, collect the relevant data, test the hypothesis, and continue monitoring whether the evidence holds.
PS: I've put together the full research, dashboard, and methodology for anyone interested in going through the analysis from start to finish.
One question has been sitting at the center of my Bitcoin analysis:
Did Bitcoin actually find its cycle bottom on June 30, 2026?
Rather than relying on the chart alone, I approached the question from two sides:
Market structure + on-chain and market data.
1. Starting With Price Action
I deliberately kept the technical analysis simple.
No complicated indicators.
Just price structure.
Bitcoin reached a low of approximately $58.53K on June 30.
Since then, the market has behaved differently from the downtrend that led into that low.
On the daily chart, $BTC moved away from the June low and entered a period of consolidation before beginning to form a sequence of higher highs and higher lows.
The weekly chart adds another important piece of context.
The June low has remained intact, while Bitcoin has recovered substantially from that level.
That is certainly worth paying attention to.
But there is an important distinction:
A strong recovery from a low does not, by itself, prove that the cycle bottom is in.
So I went deeper.
2. Looking Beneath the Chart
To test the June low from a data perspective, I built a framework around several metrics and historical comparisons:
- MVRV
- Bitcoin Realized Price
- ETF flows
- Historical cycle bottoms
- Peak-to-bottom drawdowns
- Post-bottom recovery behaviour
The objective wasn't to find one magic indicator.
Instead, I wanted to see whether multiple independent pieces of evidence were pointing toward the same conclusion.
Key numbers from the analysis
$58.53K — June 30 low
-53.11% — Peak-to-bottom drawdown
1.47 — Current MVRV
$53.19K — Realized Price
+30.52% — Recovery from the June low at the time of the analysis
When these figures are placed alongside historical Bitcoin cycle behaviour, the June 30 low starts to look increasingly significant.
3. What Does the Evidence Actually Tell Us?
The analysis suggests that June 30 is a credible candidate for the cycle bottom.
But there is an important caveat:
A candidate bottom is not the same thing as a confirmed cycle bottom.
Bitcoin has historically experienced significant recoveries that were later followed by another major move lower.
That's why I don't think one should look at the June low in isolation.
The more interesting observation is that both price structure and the underlying data are pointing toward a potential change in market behaviour around that period.
Price is showing a different structure.
The on-chain and market data provide additional evidence worth investigating.
But the higher-timeframe cycle still needs to prove itself.
4. Why Combine Technical Analysis With Data Analytics?
This is actually the bigger lesson behind the research.
The chart tells us what price is doing.
But data can help us investigate what may be happening underneath the price.
Instead of asking:
«"Does the chart look bullish?"»
The better analytical question becomes:
"Do multiple independent datasets support the same market hypothesis?"
That shift changes the way I approach crypto research.
Rather than relying on a single indicator or prediction, I want to combine:
Price → On-chain data → Historical behaviour → Market flows → Statistical context
Then let the evidence tell the story.
So, was June 30, 2026 the Bitcoin cycle bottom?
It is a credible candidate — but the data does not make it a confirmed fact yet.
For me, that's where the research becomes interesting.
The goal isn't to predict the market with certainty.
It's to identify important market events, collect the relevant data, test the hypothesis, and continue monitoring whether the evidence holds.
PS: I've put together the full research, dashboard, and methodology for anyone interested in going through the analysis from start to finish.
1
62
·
--
Em Alta
$ARB
$ZAMA
$SUI
As altcoins estão acordando, mas a taxa de recuperação de alguns tokens ainda não está compatível com o seu momentum.
$ARB
$ZAMA
$SUI
As altcoins estão acordando, mas a taxa de recuperação de alguns tokens ainda não está compatível com o seu momentum.
$ZAMA
$SUI
As altcoins estão acordando, mas a taxa de recuperação de alguns tokens ainda não está compatível com o seu momentum.
1
594
·
--
traga-me o modo escuro a qualquer hora e de qualquer maneira para o meu próprio bem, de fato, os danos que o modo claro causou precisam receber mais atenção.
traga-me o modo escuro a qualquer hora e de qualquer maneira para o meu próprio bem, de fato, os danos que o modo claro causou precisam receber mais atenção.

Odunerd
·
--
Em AltaComo desenvolvedor, aprendendo e também codificando qual tela você prefere enquanto está na tela.
▪︎Tela de luz
▪︎Tela escura
vamos conversar.
▪︎Tela de luz
▪︎Tela escura
vamos conversar.
1
6
·
--
#StockMarketCrash o efeito da guerra definitivamente vai se desenrolar como consequência do que vemos agora é um bate ou para atrair pessoas.
#StockMarketCrash o efeito da guerra definitivamente vai se desenrolar como consequência do que vemos agora é um bate ou para atrair pessoas.
1
53
·
--
Em Alta
O Bitcoin atingindo $73K não é uma base para se sentir chegado, o que está alimentando o aumento no mercado agora é a quantidade de $BTC em estoque e a guerra está distraindo os mineradores, por assim dizer.
O Bitcoin atingindo $73K não é uma base para se sentir chegado, o que está alimentando o aumento no mercado agora é a quantidade de $BTC em estoque e a guerra está distraindo os mineradores, por assim dizer.
1
65
·
--
Eles incapacitaram todos na posição de verdade
Eles incapacitaram todos na posição de verdade

Tyler Oliveira
·
--
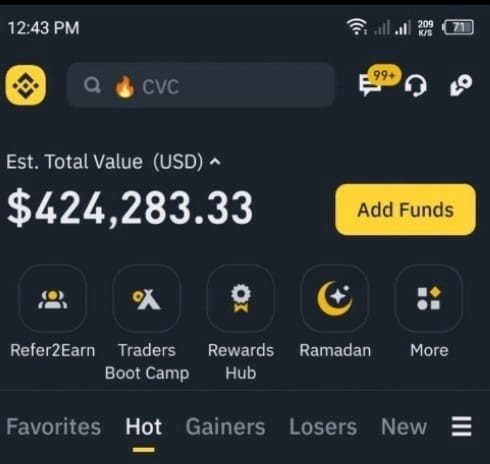
Eu tinha 1,2 milhões na minha conta há poucas horas 💔😭
Perdi quase 800K em $POWER , como vou recuperar essas perdas??? 😰
Estou comprando $RIVER 📈✅
Perdi quase 800K em $POWER , como vou recuperar essas perdas??? 😰
Estou comprando $RIVER 📈✅

1
16
·
--
Em Alta
igualmente otimista sobre $KAITO aqui
igualmente otimista sobre $KAITO aqui


CoinQuest
·
--
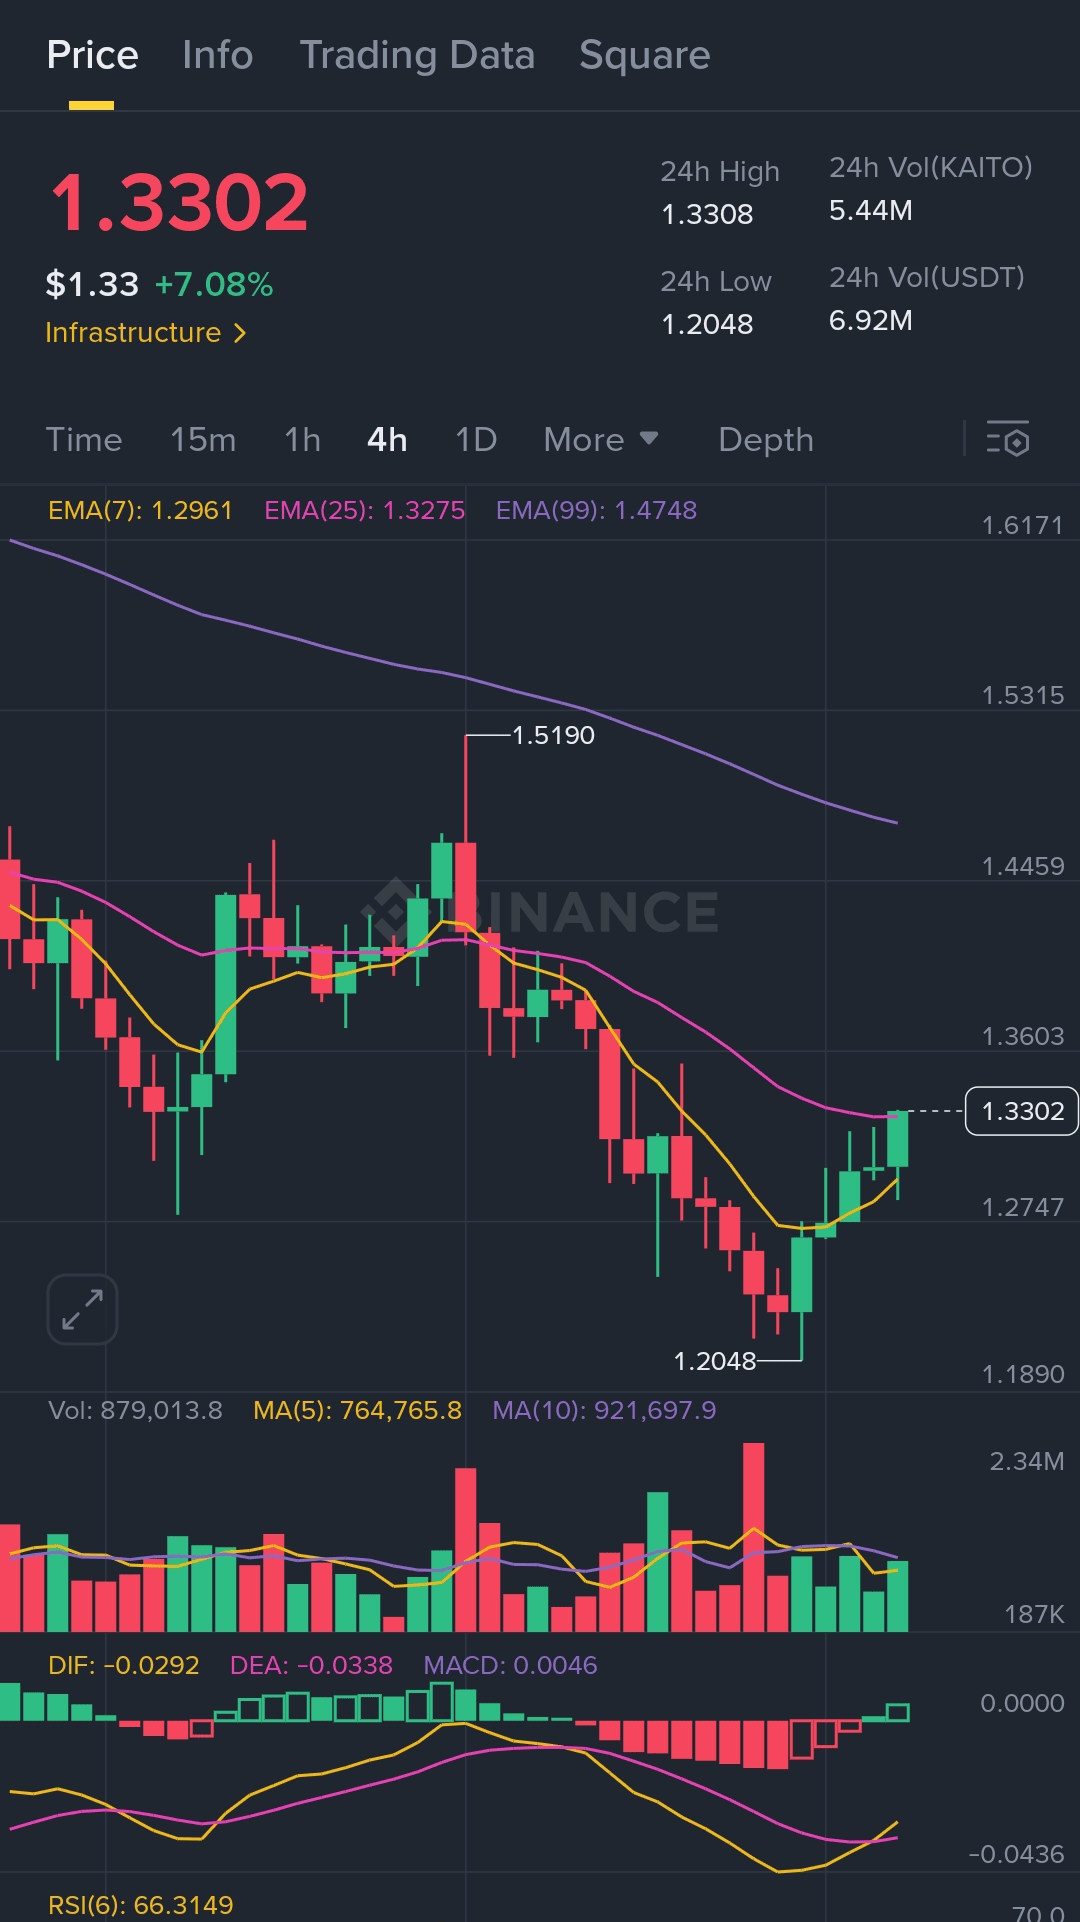
Em Alta$KAITO Estrutura de Quebra em Movimento ✅
KAITO virou a resistência com confirmação de volume e está formando mínimas mais altas, os touros estão recuperando o controle total.
🎯 Entrada: $1.3300
Alvos: $1.3538 | $1.3850 | $1.4200 (opcional para escalonamento)
🛡️ Stop Loss: $1.2975
O momento favorece a continuação. Os traders de quebra devem observar a força acima de $1.33, configuração limpa para extensão de alta.
KAITO virou a resistência com confirmação de volume e está formando mínimas mais altas, os touros estão recuperando o controle total.
🎯 Entrada: $1.3300
Alvos: $1.3538 | $1.3850 | $1.4200 (opcional para escalonamento)
🛡️ Stop Loss: $1.2975
O momento favorece a continuação. Os traders de quebra devem observar a força acima de $1.33, configuração limpa para extensão de alta.
182
·
--
Em Alta
➠Apenas o tempo é tudo que importa, mas a longo prazo, por favor, priorize sua segurança primeiro; tudo o mais é apenas uma piada.
📢📢
➠Apenas o tempo é tudo que importa, mas a longo prazo, por favor, priorize sua segurança primeiro; tudo o mais é apenas uma piada.
📢📢
📢📢
16
·
--
O Momento!
qual é seu nível de ganância de novo?
{spot}(BTCUSDT)
O Momento!
qual é seu nível de ganância de novo?
qual é seu nível de ganância de novo?
1
18
·
--
Em Alta
Não deixe pedra sobre pedra.
Meu conselho é não parar de clicar.
Não deixe pedra sobre pedra.
Meu conselho é não parar de clicar.
Meu conselho é não parar de clicar.

2
6
6.9k
·
--
Em Alta
Apenas uma pergunta real para uma resposta real.
Estamos perto das temporadas Alts?
Apenas uma pergunta real para uma resposta real.
Estamos perto das temporadas Alts?
Estamos perto das temporadas Alts?

11
7
7.1k
·
--
Em Alta
A chave principal aqui é ter convicções fortes sobre qualquer coisa que você esteja segurando depois, então reserve um tempo para checar alguns dados e estatísticas para embasar sua posição.
#Dogs tem um backend narrativo muito forte, não entre em pânico, em vez disso, segure é possível ou negocie com cautela.
ouvindo pavel durov, o CEO do Telegram, você entende de onde a #Dogs narrativa está vindo e você saberá que não é apenas um meme comum.
Estou STAYFOCUSED em X
podemos nos conectar além daqui.
Curta e compartilhe seus pensamentos.
#bnb 💛
A chave principal aqui é ter convicções fortes sobre qualquer coisa que você esteja segurando depois, então reserve um tempo para checar alguns dados e estatísticas para embasar sua posição.
#Dogs tem um backend narrativo muito forte, não entre em pânico, em vez disso, segure é possível ou negocie com cautela.
ouvindo pavel durov, o CEO do Telegram, você entende de onde a #Dogs narrativa está vindo e você saberá que não é apenas um meme comum.
Estou STAYFOCUSED em X
podemos nos conectar além daqui.
Curta e compartilhe seus pensamentos.
#bnb 💛
#Dogs tem um backend narrativo muito forte, não entre em pânico, em vez disso, segure é possível ou negocie com cautela.
ouvindo pavel durov, o CEO do Telegram, você entende de onde a #Dogs narrativa está vindo e você saberá que não é apenas um meme comum.
Estou STAYFOCUSED em X
podemos nos conectar além daqui.
Curta e compartilhe seus pensamentos.
#bnb 💛
1
706
·
--
Em Baixa
A rede aberta (TON) passa por uma queda repentina devido à prisão do CEO do Telegram.
#PavelDurov
Este é o momento de agir rápido nos notáveis Memes no Ton Blockchain para imitar e garantir esta oportunidade como um voto de compra.
#Fish
#Notcoin
#utyab
#Raff
Tpet
Durev
Tcandy
Tmonk.
E muitos que você pode conferir em geckoterminal.com ou usar esses dexs para comprar token listado.
Ston.fi
DeDust.io
A rede aberta (TON) passa por uma queda repentina devido à prisão do CEO do Telegram.
#PavelDurov
Este é o momento de agir rápido nos notáveis Memes no Ton Blockchain para imitar e garantir esta oportunidade como um voto de compra.
#Fish
#Notcoin
#utyab
#Raff
Tpet
Durev
Tcandy
Tmonk.
E muitos que você pode conferir em geckoterminal.com ou usar esses dexs para comprar token listado.
Ston.fi
DeDust.io
#PavelDurov
Este é o momento de agir rápido nos notáveis Memes no Ton Blockchain para imitar e garantir esta oportunidade como um voto de compra.
#Fish
#Notcoin
#utyab
#Raff
Tpet
Durev
Tcandy
Tmonk.
E muitos que você pode conferir em geckoterminal.com ou usar esses dexs para comprar token listado.
Ston.fi
DeDust.io

4
720
·
--
Em Alta
Essa parte de EDUCAR sempre aquece meu coração da Binance para o mundo.
#BNB 💛
Essa parte de EDUCAR sempre aquece meu coração da Binance para o mundo.
#BNB 💛
#BNB 💛


Binance Square Official
·
--
Como escrever um artigo longo no Square
202
·
--
Em Alta
Meu pensamento também para o mundo DEFI hoje é: vamos abraçar mais tecnologia e inovações e a ideia não será algo que faltará totalmente no espaço criptográfico.
Seja produtivo
Estar conectado
Seja mente aberta
Meu pensamento também para o mundo DEFI hoje é: vamos abraçar mais tecnologia e inovações e a ideia não será algo que faltará totalmente no espaço criptográfico.
Seja produtivo
Estar conectado
Seja mente aberta
Seja produtivo
Estar conectado
Seja mente aberta
5
269
·
--
#MarketSentimentToday Direi que o mercado está em uma posição doji no momento e é preciso ter muito cuidado ao tomar decisões.
#MarketSentimentToday Direi que o mercado está em uma posição doji no momento e é preciso ter muito cuidado ao tomar decisões.
5
3k
·
--
Em Alta
Como desenvolvedor, aprendendo e também codificando qual tela você prefere enquanto está na tela.
▪︎Tela de luz
▪︎Tela escura
vamos conversar.
Como desenvolvedor, aprendendo e também codificando qual tela você prefere enquanto está na tela.
▪︎Tela de luz
▪︎Tela escura
vamos conversar.
▪︎Tela de luz
▪︎Tela escura
vamos conversar.
1
2
5.5k
Inicia sessão para explorar mais conteúdos
Junta-te a utilizadores de criptomoedas de todo o mundo na Binance Square
⚡️ Obtém informações úteis e recentes sobre criptomoedas.
💬 Com a confiança da maior exchange de criptomoedas do mundo.
👍 Descobre perspetivas reais de criadores verificados.
E-mail/Número de telefone
Tópicos em Tendência
UKFCAWinsCourtOrderToRecover851400Pounds
40,422 visualizações
851 a discutir
🚨 A REGULAÇÃO DE CRIPTO ACABOU DE ENTRAR NUM NOVO ESTÁGIO: NÃO ESTÃO APENAS CRIANDO REGRAS — ESTÃO RECOBRANDO DINHEIRO.
A FCA do Reino Unido garantiu mais uma recuperação de ativos respaldada pela Justiça, reforçando um esforço mais amplo de fiscalização contra atividade financeira e relacionada a cripto não autorizada.
E veja o que está acontecendo ao mesmo tempo:
🇬🇧 FCA → fiscalização + recuperação de ativos
🇺🇸 SEC → regras mais claras para criptoativos funcionais
🇺🇸 Fed → supervisão formal de stablecoins sob a Lei GENIUS
Essa combinação importa.
Os reguladores não estão mais debatendo se a cripto deve ou não fazer parte do sistema financeiro.
Agora, estão cada vez mais decidindo quem terá acesso, quais regras devem seguir e o que acontece quando essas regras são quebradas.
O próximo ciclo de cripto pode não ser “regulação vs inovação”.
Pode ser cripto regulamentada vs todo mundo que não consegue cumprir o padrão. 👀
$COIN $CRCL $BTC
#ukfcawinscourtordertorecover851400pounds #ChainlinkLaunchesCCIP2WithEnterpriseVerification #GoldFallsTo$4144 #QNTFallsOver40%FromMorningHigh #USDTAdds845900HoldersInPast7Days
KimHotbae
·3 gostos
·4.4k visualizações
ChainlinkLaunchesCCIP2WithEnterpriseVerification
52,434 visualizações
1,014 a discutir
GoldFallsTo$4144
17,744 visualizações
169 a discutir