
nayrbryanGaming
967 Publicações

nayrbryanGaming
Denunciar
Bloquear Utilizador
Content Creator | Trader | Web3 & Crypto | Photographer| CEO @NNG_ESPORT | Esports pioneer est. 2010 | IG/Twitch: @nayrbryan_gaming | TikTok:@nayrbryanGaming

Detentor de SOL
Trader Frequente
1.8 ano(s)
924 A seguir
417 Seguidores
354 Gostaram
Publicações
Tudo
Cotações
·
--
Em Alta
MOTIVAÇÃO DO TRADER / MINI INSIGHT
🧠 Insight do Dia
“Não confunda um repique com uma ruptura.”
Por que isso importa
Uma reação a partir do suporte pode parecer forte, mas o mercado ainda precisa provar que os compradores conseguem superar a resistência.
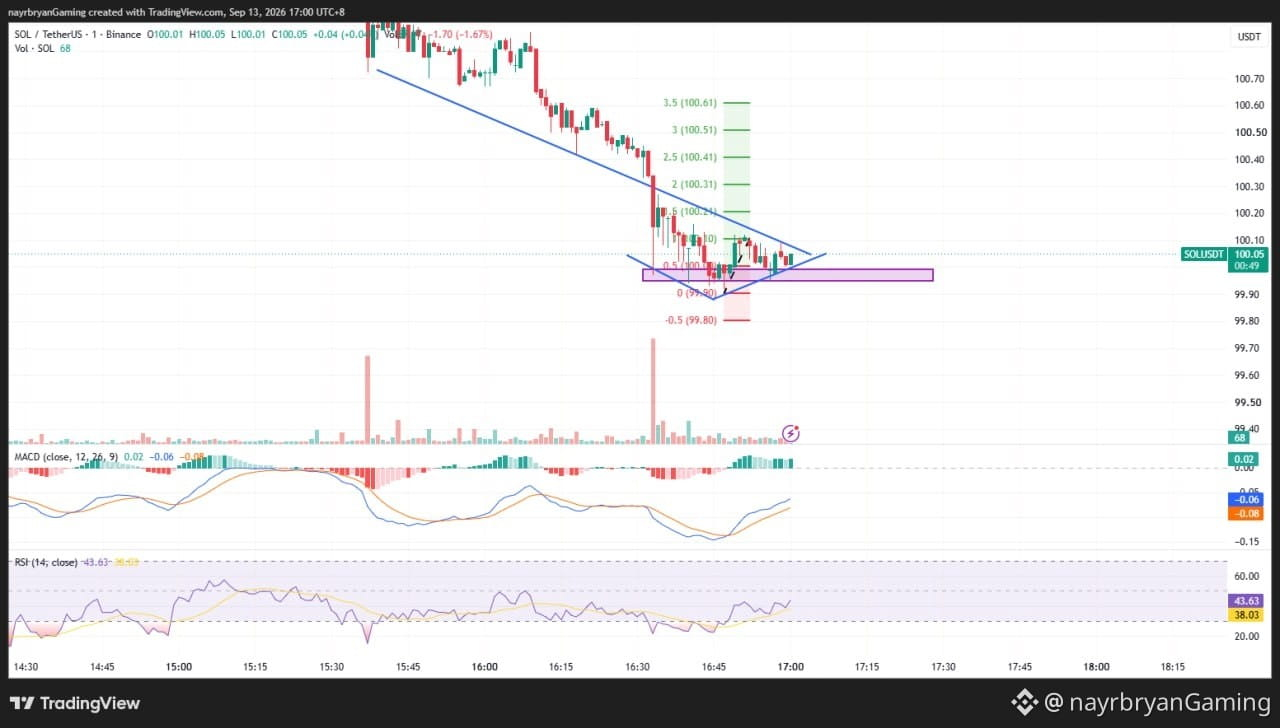
No momento, o SOL está comprimindo entre a zona de suporte de 99.90–100.00 e a estrutura descendente acima.
O nível importante é 100.11.
Até esse nível ser confirmado, a paciência importa mais do que a previsão.
Uma execução inteligente foca em:
• Reação ao suporte • Confirmação de rompimento • Reteste • Invalidação • Controle de risco
🎯 Checklist do Trader
Marque a zona de suporte de 99.90–100.00
Acompanhe 100.11 para confirmação
Monitore a linha de tendência descendente
Respeite a invalidação em 99.80
Evite perseguir a primeira vela de rompimento
Proteja o capital
🧠 Mini Desafio
Antes de entrar, pergunte:
“O mercado confirmou a ruptura — ou estou assumindo que ela vai acontecer?”
— @nayrbryanGaming #TraderMindset #TradingDiscipline #NoFOMO #CryptoMindset #DYOR #PriceAction #SOLUSDT
🔔 Siga meu Binance Square & X (@nayrbryanGaming) para insights diários do gráfico.
MOTIVAÇÃO DO TRADER / MINI INSIGHT
🧠 Insight do Dia
“Não confunda um repique com uma ruptura.”
Por que isso importa
Uma reação a partir do suporte pode parecer forte, mas o mercado ainda precisa provar que os compradores conseguem superar a resistência.
No momento, o SOL está comprimindo entre a zona de suporte de 99.90–100.00 e a estrutura descendente acima.
O nível importante é 100.11.
Até esse nível ser confirmado, a paciência importa mais do que a previsão.
Uma execução inteligente foca em:
• Reação ao suporte • Confirmação de rompimento • Reteste • Invalidação • Controle de risco
🎯 Checklist do Trader
Marque a zona de suporte de 99.90–100.00
Acompanhe 100.11 para confirmação
Monitore a linha de tendência descendente
Respeite a invalidação em 99.80
Evite perseguir a primeira vela de rompimento
Proteja o capital
🧠 Mini Desafio
Antes de entrar, pergunte:
“O mercado confirmou a ruptura — ou estou assumindo que ela vai acontecer?”
— @nayrbryanGaming #TraderMindset #TradingDiscipline #NoFOMO #CryptoMindset #DYOR #PriceAction #SOLUSDT
🔔 Siga meu Binance Square & X (@nayrbryanGaming) para insights diários do gráfico.
🧠 Insight do Dia
“Não confunda um repique com uma ruptura.”
Por que isso importa
Uma reação a partir do suporte pode parecer forte, mas o mercado ainda precisa provar que os compradores conseguem superar a resistência.
No momento, o SOL está comprimindo entre a zona de suporte de 99.90–100.00 e a estrutura descendente acima.
O nível importante é 100.11.
Até esse nível ser confirmado, a paciência importa mais do que a previsão.
Uma execução inteligente foca em:
• Reação ao suporte • Confirmação de rompimento • Reteste • Invalidação • Controle de risco
🎯 Checklist do Trader
Marque a zona de suporte de 99.90–100.00
Acompanhe 100.11 para confirmação
Monitore a linha de tendência descendente
Respeite a invalidação em 99.80
Evite perseguir a primeira vela de rompimento
Proteja o capital
🧠 Mini Desafio
Antes de entrar, pergunte:
“O mercado confirmou a ruptura — ou estou assumindo que ela vai acontecer?”
— @nayrbryanGaming #TraderMindset #TradingDiscipline #NoFOMO #CryptoMindset #DYOR #PriceAction #SOLUSDT
🔔 Siga meu Binance Square & X (@nayrbryanGaming) para insights diários do gráfico.
60
·
--
Em Alta
ANÁLISE DE LUZ / CONFIGURAÇÃO DE GRÁFICO — SOL/USDT
📈 Visão Geral da Estrutura
Fase do mercado: Liquidação → Reação na Suporte → Compressão
Zona de suporte principal: 99.90 – 100.00
Nível de rompimento chave: 100.11
Principais níveis de alta: 100.21 → 100.31 → 100.41 → 100.51 → 100.61
Referência de invalidação para queda: 99.80
📌 O que eu estou Observando
Cenário A — Continuação Altista
Se SOL mantiver a área de suporte de 99.90–100.00 e romper acima de 100.11, o preço pode girar em direção a:
100.21 → 100.31 → 100.41 → 100.51 → 100.61
Um movimento sustentado acima de 100.11 forneceria uma confirmação mais forte de que os compradores estão recuperando o controle no curto prazo.
Cenário B — Falha no Suporte
Se SOL perder 99.90, a estrutura atual de recuperação enfraquece.
A próxima referência Fibonacci marcada para a queda é:
99.80
Um movimento abaixo desse nível invalidaria a estrutura imediata de continuação altista e exigiria uma nova avaliação da estrutura.
📊 Checagem de Indicadores
MACD: Melhorando → momentum de curto prazo se recuperando
RSI: 43.63 → fraco-neutro, se recuperando
Estrutura do Preço: Linha de tendência descendente + compressão se apertando
Confirmação-chave: rompimento de 100.11 / falha do suporte em 99.90
Obs.: Isto é uma estrutura de gráfico, não uma recomendação de trade. Use isso para apoiar seu próprio plano de execução baseado em DYOR.
— @nayrbryanGaming #SOLAnalysis #ChartSetup #PriceAction #SmartMoney #Fibonacci #CryptoTrading #DYOR #NFA
ANÁLISE DE LUZ / CONFIGURAÇÃO DE GRÁFICO — SOL/USDT
📈 Visão Geral da Estrutura
Fase do mercado: Liquidação → Reação na Suporte → Compressão
Zona de suporte principal: 99.90 – 100.00
Nível de rompimento chave: 100.11
Principais níveis de alta: 100.21 → 100.31 → 100.41 → 100.51 → 100.61
Referência de invalidação para queda: 99.80
📌 O que eu estou Observando
Cenário A — Continuação Altista
Se SOL mantiver a área de suporte de 99.90–100.00 e romper acima de 100.11, o preço pode girar em direção a:
100.21 → 100.31 → 100.41 → 100.51 → 100.61
Um movimento sustentado acima de 100.11 forneceria uma confirmação mais forte de que os compradores estão recuperando o controle no curto prazo.
Cenário B — Falha no Suporte
Se SOL perder 99.90, a estrutura atual de recuperação enfraquece.
A próxima referência Fibonacci marcada para a queda é:
99.80
Um movimento abaixo desse nível invalidaria a estrutura imediata de continuação altista e exigiria uma nova avaliação da estrutura.
📊 Checagem de Indicadores
MACD: Melhorando → momentum de curto prazo se recuperando
RSI: 43.63 → fraco-neutro, se recuperando
Estrutura do Preço: Linha de tendência descendente + compressão se apertando
Confirmação-chave: rompimento de 100.11 / falha do suporte em 99.90
Obs.: Isto é uma estrutura de gráfico, não uma recomendação de trade. Use isso para apoiar seu próprio plano de execução baseado em DYOR.
— @nayrbryanGaming #SOLAnalysis #ChartSetup #PriceAction #SmartMoney #Fibonacci #CryptoTrading #DYOR #NFA
📈 Visão Geral da Estrutura
Fase do mercado: Liquidação → Reação na Suporte → Compressão
Zona de suporte principal: 99.90 – 100.00
Nível de rompimento chave: 100.11
Principais níveis de alta: 100.21 → 100.31 → 100.41 → 100.51 → 100.61
Referência de invalidação para queda: 99.80
📌 O que eu estou Observando
Cenário A — Continuação Altista
Se SOL mantiver a área de suporte de 99.90–100.00 e romper acima de 100.11, o preço pode girar em direção a:
100.21 → 100.31 → 100.41 → 100.51 → 100.61
Um movimento sustentado acima de 100.11 forneceria uma confirmação mais forte de que os compradores estão recuperando o controle no curto prazo.
Cenário B — Falha no Suporte
Se SOL perder 99.90, a estrutura atual de recuperação enfraquece.
A próxima referência Fibonacci marcada para a queda é:
99.80
Um movimento abaixo desse nível invalidaria a estrutura imediata de continuação altista e exigiria uma nova avaliação da estrutura.
📊 Checagem de Indicadores
MACD: Melhorando → momentum de curto prazo se recuperando
RSI: 43.63 → fraco-neutro, se recuperando
Estrutura do Preço: Linha de tendência descendente + compressão se apertando
Confirmação-chave: rompimento de 100.11 / falha do suporte em 99.90
Obs.: Isto é uma estrutura de gráfico, não uma recomendação de trade. Use isso para apoiar seu próprio plano de execução baseado em DYOR.
— @nayrbryanGaming #SOLAnalysis #ChartSetup #PriceAction #SmartMoney #Fibonacci #CryptoTrading #DYOR #NFA
76
·
--
Em Alta
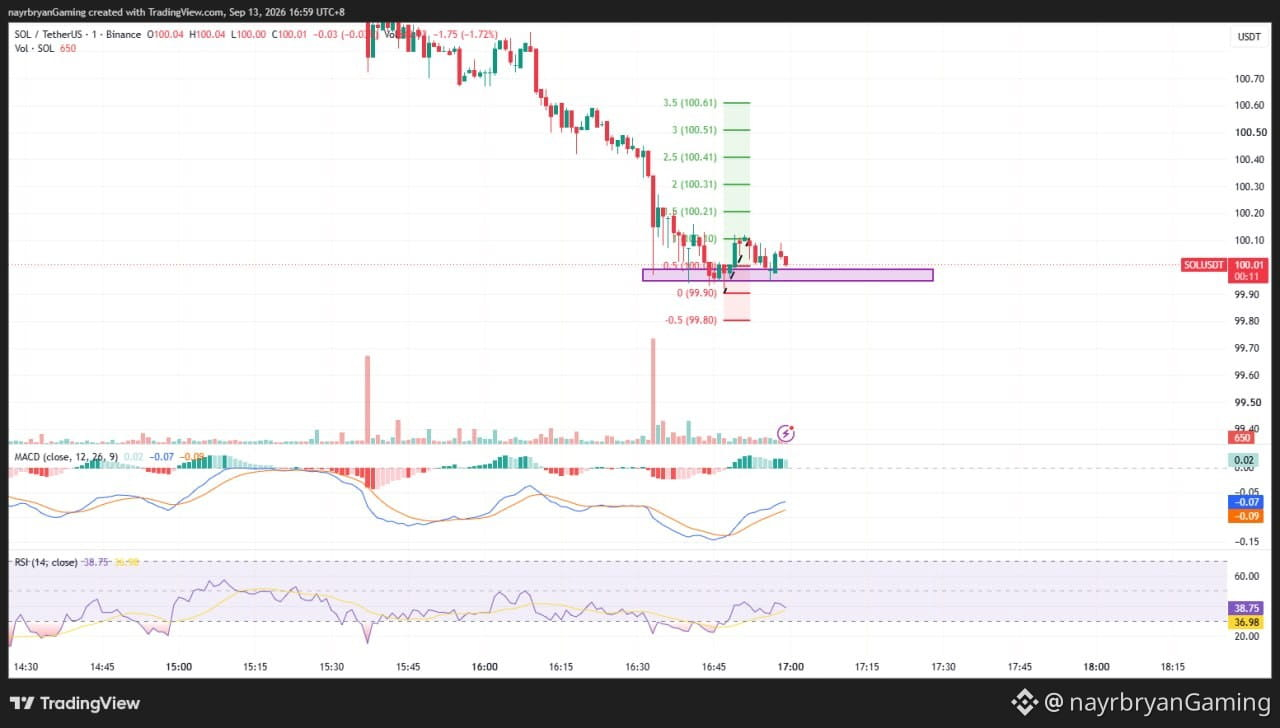
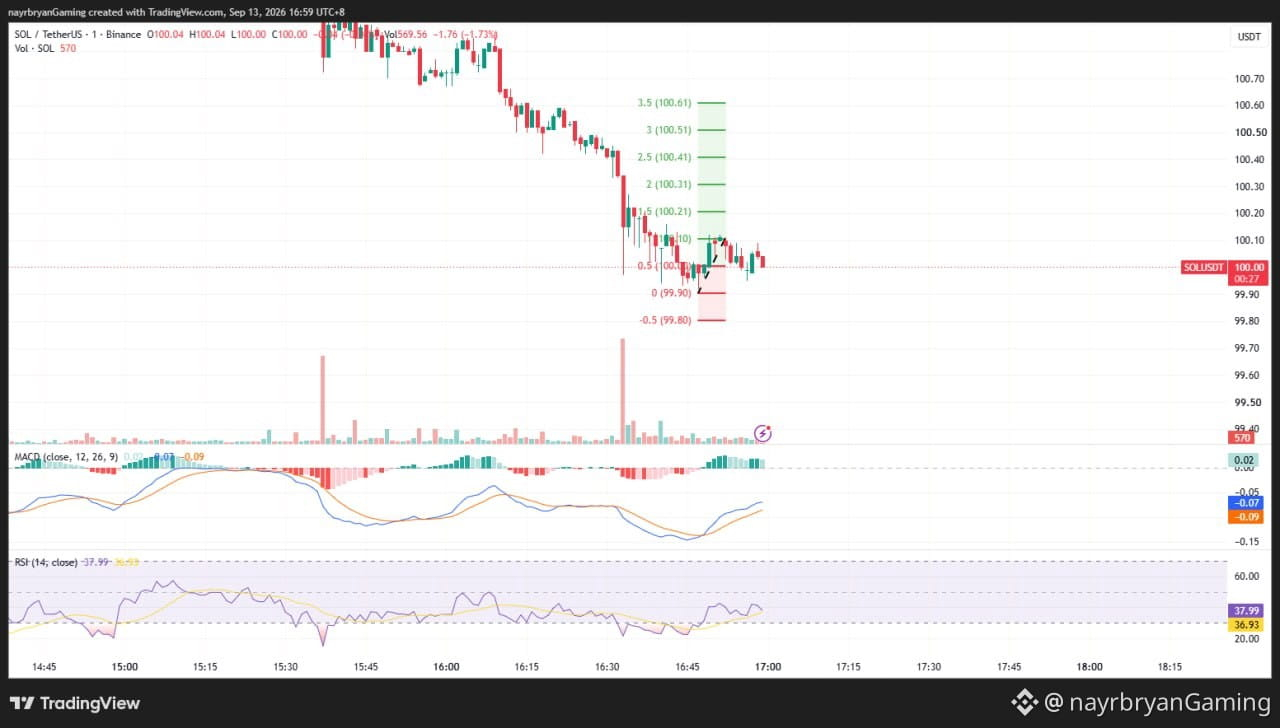
SINAL DIÁRIO — SOL/USDT
Data: 13 set 2026 Intervalo: 1m Viés intradiário: Reação da resistência → compressão → tentativa de rompimento
📊 Viés de Mercado
O SOL está se recuperando da recente queda e atualmente consolida na faixa de estrutura 99,90–100,00.
O preço reagiu a partir da zona de suporte inferior e agora está formando uma estrutura mais apertada sob a linha de tendência descendente.
As últimas candles estão segurando acima da área de 99,90, enquanto o momentum de curto prazo melhora gradualmente.
Um rompimento confirmado acima da resistência local em torno de 100,11 fortaleceria o cenário de continuação bullish.
🔹 Níveis-Chave do Gráfico
Entrada / Zona de Reação: 99,90 → 100,00
Suporte Principal: 99,90
Confirmação de Rompimento: 100,11
Referência de Invalidação: Abaixo de 99,80
🎯 Alvos de Fibonacci de Alta
TP1 → 100,11 (1,0 Fib) TP2 → 100,21 (1,5 Fib) TP3 → 100,31 (2,0 Fib) TP4 → 100,41 (2,5 Fib) TP5 → 100,51 (3,0 Fib) TP6 → 100,61 (3,5 Fib)
🔻 Referência de Baixa
Se a estrutura de suporte falhar:
99,80 (-0,5 Fib)
Um movimento sustentado abaixo de 99,90 enfraqueceria a estrutura atual de recuperação.
📈 Quebra Técnica
O SOL permanece dentro de uma estrutura descendente mais ampla de curto prazo após a queda brusca da região de 100,70+.
No entanto, o preço reagiu na região do suporte 99,90 e agora está comprimindo perto da parte superior da estrutura local.
O momentum do MACD está melhorando, com o histograma ficando positivo enquanto as linhas do MACD se recuperam de níveis mais baixos.
O RSI está em torno de 43,63, mostrando que o momentum ainda está abaixo do ponto médio bullish, mas se recuperando de condições mais fracas.
O nível-chave a observar é 100,11.
Uma retomada confirmada acima deste nível pode abrir o caminho para:
100,21 → 100,31 → 100,41 → 100,51 → 100,61
🧠 Insight Rápido
“O suporte dá o cenário. A confirmação dá a direção.”
⚠️ Aviso
Esta é uma análise pessoal do mercado, não é aconselhamento financeiro. Esta estrutura de gráfico é apenas para fins educacionais.
Sempre faça sua pesquisa (DYOR / DYODD), gerencie o risco adequadamente e evite trading movido por emoção.
— @nayrbryanGaming #SOL #SOLUSDT #Cripto #Trading #AnáliseTécnica #PriceAction #Fibonacci
SINAL DIÁRIO — SOL/USDT
Data: 13 set 2026 Intervalo: 1m Viés intradiário: Reação da resistência → compressão → tentativa de rompimento
📊 Viés de Mercado
O SOL está se recuperando da recente queda e atualmente consolida na faixa de estrutura 99,90–100,00.
O preço reagiu a partir da zona de suporte inferior e agora está formando uma estrutura mais apertada sob a linha de tendência descendente.
As últimas candles estão segurando acima da área de 99,90, enquanto o momentum de curto prazo melhora gradualmente.
Um rompimento confirmado acima da resistência local em torno de 100,11 fortaleceria o cenário de continuação bullish.
🔹 Níveis-Chave do Gráfico
Entrada / Zona de Reação: 99,90 → 100,00
Suporte Principal: 99,90
Confirmação de Rompimento: 100,11
Referência de Invalidação: Abaixo de 99,80
🎯 Alvos de Fibonacci de Alta
TP1 → 100,11 (1,0 Fib) TP2 → 100,21 (1,5 Fib) TP3 → 100,31 (2,0 Fib) TP4 → 100,41 (2,5 Fib) TP5 → 100,51 (3,0 Fib) TP6 → 100,61 (3,5 Fib)
🔻 Referência de Baixa
Se a estrutura de suporte falhar:
99,80 (-0,5 Fib)
Um movimento sustentado abaixo de 99,90 enfraqueceria a estrutura atual de recuperação.
📈 Quebra Técnica
O SOL permanece dentro de uma estrutura descendente mais ampla de curto prazo após a queda brusca da região de 100,70+.
No entanto, o preço reagiu na região do suporte 99,90 e agora está comprimindo perto da parte superior da estrutura local.
O momentum do MACD está melhorando, com o histograma ficando positivo enquanto as linhas do MACD se recuperam de níveis mais baixos.
O RSI está em torno de 43,63, mostrando que o momentum ainda está abaixo do ponto médio bullish, mas se recuperando de condições mais fracas.
O nível-chave a observar é 100,11.
Uma retomada confirmada acima deste nível pode abrir o caminho para:
100,21 → 100,31 → 100,41 → 100,51 → 100,61
🧠 Insight Rápido
“O suporte dá o cenário. A confirmação dá a direção.”
⚠️ Aviso
Esta é uma análise pessoal do mercado, não é aconselhamento financeiro. Esta estrutura de gráfico é apenas para fins educacionais.
Sempre faça sua pesquisa (DYOR / DYODD), gerencie o risco adequadamente e evite trading movido por emoção.
— @nayrbryanGaming #SOL #SOLUSDT #Cripto #Trading #AnáliseTécnica #PriceAction #Fibonacci
Data: 13 set 2026 Intervalo: 1m Viés intradiário: Reação da resistência → compressão → tentativa de rompimento
📊 Viés de Mercado
O SOL está se recuperando da recente queda e atualmente consolida na faixa de estrutura 99,90–100,00.
O preço reagiu a partir da zona de suporte inferior e agora está formando uma estrutura mais apertada sob a linha de tendência descendente.
As últimas candles estão segurando acima da área de 99,90, enquanto o momentum de curto prazo melhora gradualmente.
Um rompimento confirmado acima da resistência local em torno de 100,11 fortaleceria o cenário de continuação bullish.
🔹 Níveis-Chave do Gráfico
Entrada / Zona de Reação: 99,90 → 100,00
Suporte Principal: 99,90
Confirmação de Rompimento: 100,11
Referência de Invalidação: Abaixo de 99,80
🎯 Alvos de Fibonacci de Alta
TP1 → 100,11 (1,0 Fib) TP2 → 100,21 (1,5 Fib) TP3 → 100,31 (2,0 Fib) TP4 → 100,41 (2,5 Fib) TP5 → 100,51 (3,0 Fib) TP6 → 100,61 (3,5 Fib)
🔻 Referência de Baixa
Se a estrutura de suporte falhar:
99,80 (-0,5 Fib)
Um movimento sustentado abaixo de 99,90 enfraqueceria a estrutura atual de recuperação.
📈 Quebra Técnica
O SOL permanece dentro de uma estrutura descendente mais ampla de curto prazo após a queda brusca da região de 100,70+.
No entanto, o preço reagiu na região do suporte 99,90 e agora está comprimindo perto da parte superior da estrutura local.
O momentum do MACD está melhorando, com o histograma ficando positivo enquanto as linhas do MACD se recuperam de níveis mais baixos.
O RSI está em torno de 43,63, mostrando que o momentum ainda está abaixo do ponto médio bullish, mas se recuperando de condições mais fracas.
O nível-chave a observar é 100,11.
Uma retomada confirmada acima deste nível pode abrir o caminho para:
100,21 → 100,31 → 100,41 → 100,51 → 100,61
🧠 Insight Rápido
“O suporte dá o cenário. A confirmação dá a direção.”
⚠️ Aviso
Esta é uma análise pessoal do mercado, não é aconselhamento financeiro. Esta estrutura de gráfico é apenas para fins educacionais.
Sempre faça sua pesquisa (DYOR / DYODD), gerencie o risco adequadamente e evite trading movido por emoção.
— @nayrbryanGaming #SOL #SOLUSDT #Cripto #Trading #AnáliseTécnica #PriceAction #Fibonacci
1
162
·
--
Em Baixa
Ver tradução
TRADER MOTIVATION / MINI INSIGHT
🧠 Insight of the Day
“Don’t predict the breakout. Let the structure prove it.”
Why This Matters
When price compresses between converging trendlines, both buyers and sellers can become trapped by premature entries.
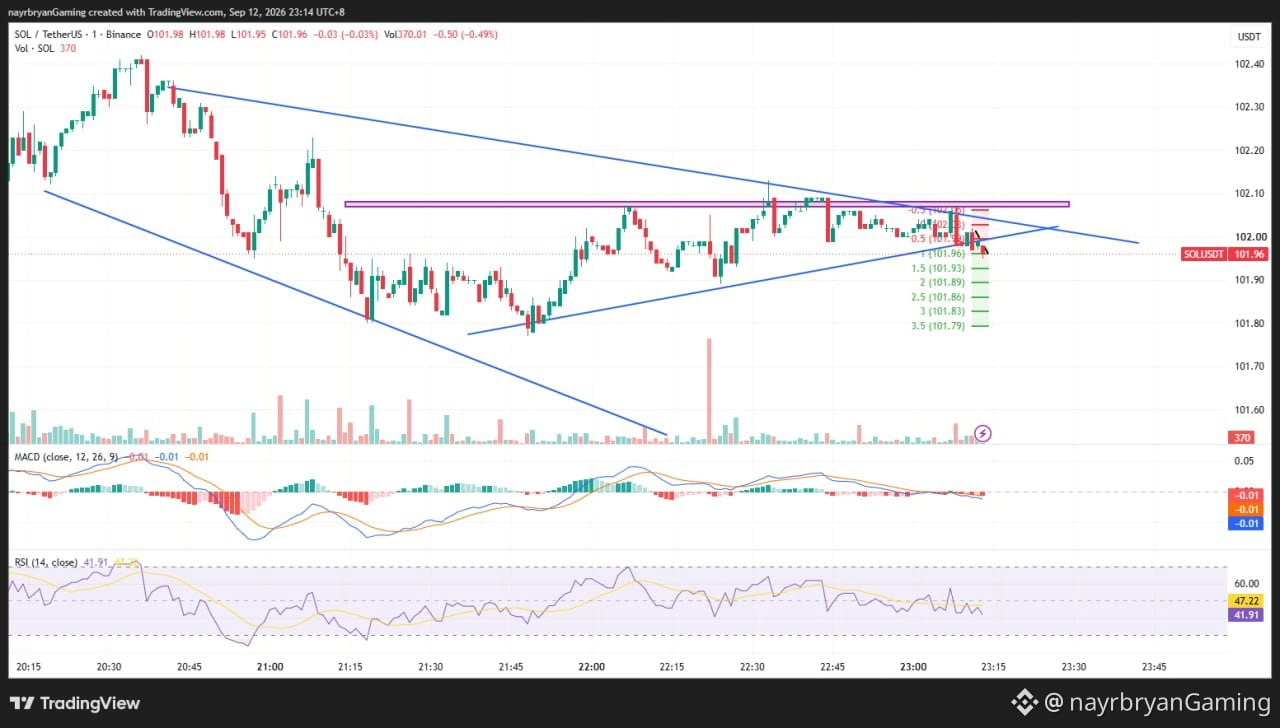
SOL is currently testing the relationship between the 102.04–102.10 resistance zone and the lower structure around 101.96.
The important question is not:
“Will SOL break down?”
The better question is:
“Which side of the structure will actually confirm?”
🎯 Trader Checklist
Mark the 102.04–102.10 resistance
Watch 101.96 structure
Wait for confirmation
Respect invalidation
Monitor the Fibonacci levels
Avoid chasing the candle
Protect capital
🧠 Mini Challenge
Before entering, ask:
“Am I trading confirmed structure — or simply guessing the next candle?”
— @nayrbryanGaming #TraderMindset #TradingDiscipline #NoFOMO #CryptoMindset #DYOR #PriceAction #SOLUSDT
🔔 Follow my Binance Square & X (@nayrbryanGaming) for daily chart insights.
TRADER MOTIVATION / MINI INSIGHT
🧠 Insight of the Day
“Don’t predict the breakout. Let the structure prove it.”
Why This Matters
When price compresses between converging trendlines, both buyers and sellers can become trapped by premature entries.
SOL is currently testing the relationship between the 102.04–102.10 resistance zone and the lower structure around 101.96.
The important question is not:
“Will SOL break down?”
The better question is:
“Which side of the structure will actually confirm?”
🎯 Trader Checklist
Mark the 102.04–102.10 resistance
Watch 101.96 structure
Wait for confirmation
Respect invalidation
Monitor the Fibonacci levels
Avoid chasing the candle
Protect capital
🧠 Mini Challenge
Before entering, ask:
“Am I trading confirmed structure — or simply guessing the next candle?”
— @nayrbryanGaming #TraderMindset #TradingDiscipline #NoFOMO #CryptoMindset #DYOR #PriceAction #SOLUSDT
🔔 Follow my Binance Square & X (@nayrbryanGaming) for daily chart insights.
🧠 Insight of the Day
“Don’t predict the breakout. Let the structure prove it.”
Why This Matters
When price compresses between converging trendlines, both buyers and sellers can become trapped by premature entries.
SOL is currently testing the relationship between the 102.04–102.10 resistance zone and the lower structure around 101.96.
The important question is not:
“Will SOL break down?”
The better question is:
“Which side of the structure will actually confirm?”
🎯 Trader Checklist
Mark the 102.04–102.10 resistance
Watch 101.96 structure
Wait for confirmation
Respect invalidation
Monitor the Fibonacci levels
Avoid chasing the candle
Protect capital
🧠 Mini Challenge
Before entering, ask:
“Am I trading confirmed structure — or simply guessing the next candle?”
— @nayrbryanGaming #TraderMindset #TradingDiscipline #NoFOMO #CryptoMindset #DYOR #PriceAction #SOLUSDT
🔔 Follow my Binance Square & X (@nayrbryanGaming) for daily chart insights.
46
·
--
Em Baixa
Ver tradução
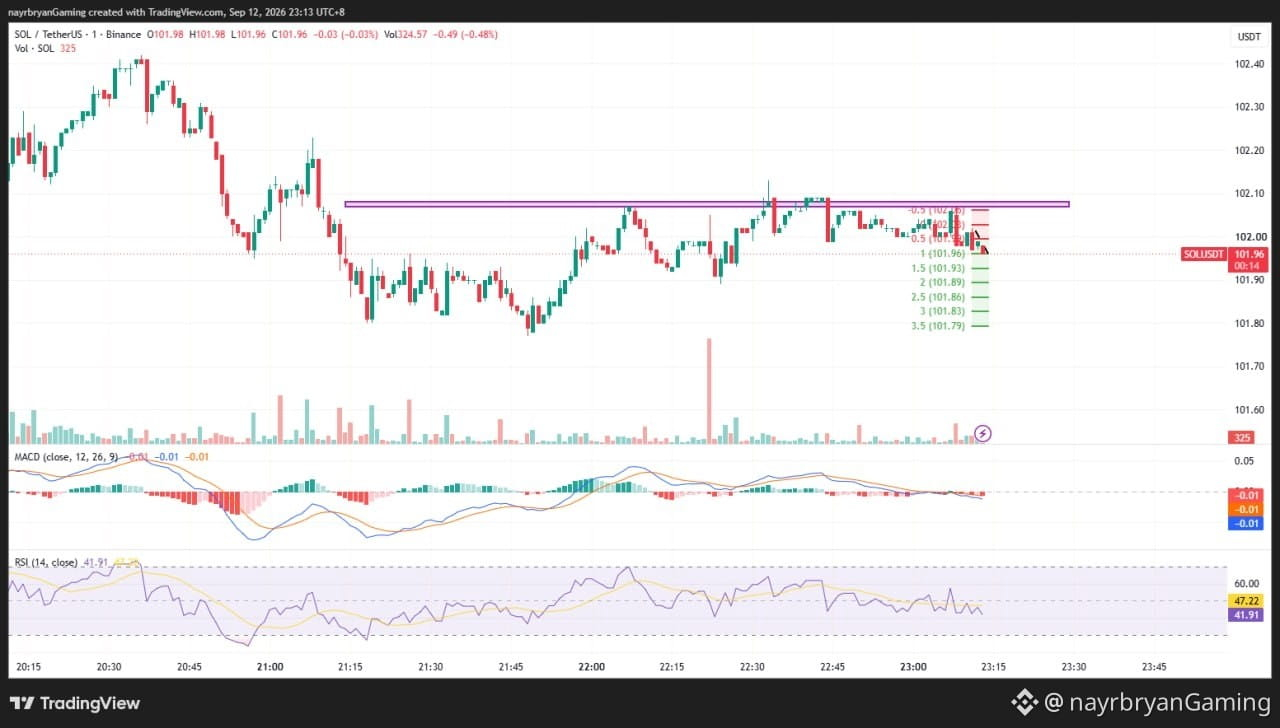
LIGHT ANALYSIS / CHART SETUP — SOL/USDT
📈 Structure Overview
Market phase: Recovery → Compression → Resistance rejection
Converging structure: Lower highs + rising short-term support
Key reaction zone: 102.04 – 102.10
Key Fibonacci reference: 101.96
Downside levels: 101.93 → 101.89 → 101.86 → 101.83 → 101.79
📌 What I’m Watching
Scenario A — Bearish Continuation
If SOL continues rejecting the 102.04–102.10 resistance area and remains below the upper structure, price may rotate toward:
101.93 → 101.89 → 101.86 → 101.83 → 101.79
The first important confirmation area is around 101.96.
Scenario B — Bullish Reclaim
If SOL reclaims 102.04 and successfully breaks through the 102.10 resistance area, the immediate bearish structure weakens.
A sustained breakout would require reassessing the short-term bearish setup.
📊 Indicator Check
MACD: Slightly below zero → bearish momentum remains present
RSI: 41.91 → weak-to-neutral momentum
Price Structure: Converging trendlines + lower highs
Key Confirmation: 101.96 breakdown / 102.10 reclaim
Note: This is a chart framework, not a trade recommendation. Use it to support your own DYOR-based execution plan.
— @nayrbryanGaming #SOLAnalysis #ChartSetup #PriceAction #SmartMoney #Fibonacci #CryptoTrading #DYOR #NFA
LIGHT ANALYSIS / CHART SETUP — SOL/USDT
📈 Structure Overview
Market phase: Recovery → Compression → Resistance rejection
Converging structure: Lower highs + rising short-term support
Key reaction zone: 102.04 – 102.10
Key Fibonacci reference: 101.96
Downside levels: 101.93 → 101.89 → 101.86 → 101.83 → 101.79
📌 What I’m Watching
Scenario A — Bearish Continuation
If SOL continues rejecting the 102.04–102.10 resistance area and remains below the upper structure, price may rotate toward:
101.93 → 101.89 → 101.86 → 101.83 → 101.79
The first important confirmation area is around 101.96.
Scenario B — Bullish Reclaim
If SOL reclaims 102.04 and successfully breaks through the 102.10 resistance area, the immediate bearish structure weakens.
A sustained breakout would require reassessing the short-term bearish setup.
📊 Indicator Check
MACD: Slightly below zero → bearish momentum remains present
RSI: 41.91 → weak-to-neutral momentum
Price Structure: Converging trendlines + lower highs
Key Confirmation: 101.96 breakdown / 102.10 reclaim
Note: This is a chart framework, not a trade recommendation. Use it to support your own DYOR-based execution plan.
— @nayrbryanGaming #SOLAnalysis #ChartSetup #PriceAction #SmartMoney #Fibonacci #CryptoTrading #DYOR #NFA
📈 Structure Overview
Market phase: Recovery → Compression → Resistance rejection
Converging structure: Lower highs + rising short-term support
Key reaction zone: 102.04 – 102.10
Key Fibonacci reference: 101.96
Downside levels: 101.93 → 101.89 → 101.86 → 101.83 → 101.79
📌 What I’m Watching
Scenario A — Bearish Continuation
If SOL continues rejecting the 102.04–102.10 resistance area and remains below the upper structure, price may rotate toward:
101.93 → 101.89 → 101.86 → 101.83 → 101.79
The first important confirmation area is around 101.96.
Scenario B — Bullish Reclaim
If SOL reclaims 102.04 and successfully breaks through the 102.10 resistance area, the immediate bearish structure weakens.
A sustained breakout would require reassessing the short-term bearish setup.
📊 Indicator Check
MACD: Slightly below zero → bearish momentum remains present
RSI: 41.91 → weak-to-neutral momentum
Price Structure: Converging trendlines + lower highs
Key Confirmation: 101.96 breakdown / 102.10 reclaim
Note: This is a chart framework, not a trade recommendation. Use it to support your own DYOR-based execution plan.
— @nayrbryanGaming #SOLAnalysis #ChartSetup #PriceAction #SmartMoney #Fibonacci #CryptoTrading #DYOR #NFA
62
·
--
Em Baixa
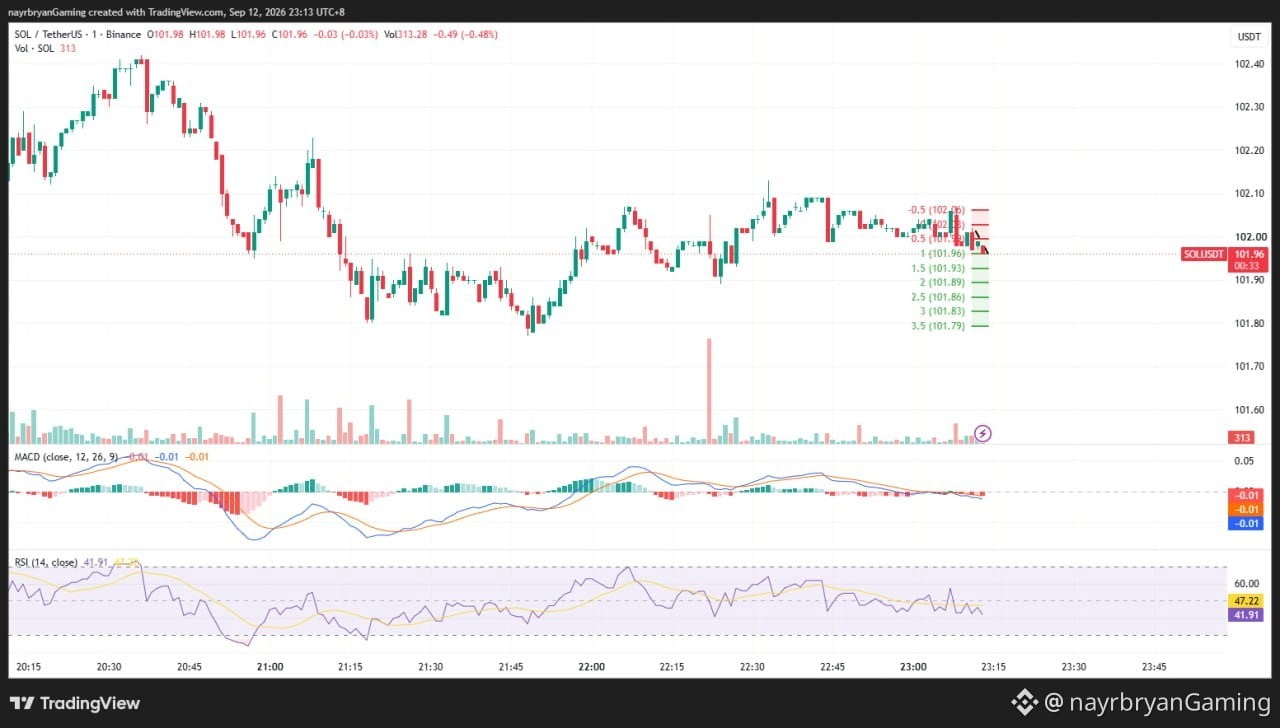
SINAL DIÁRIO — SOL/USDT
Data: 12 de set de 2026 Período: 1m Viés intradiário: Rejeição da resistência → continuação de baixa
📊 Viés de Mercado
O SOL está se consolidando dentro de uma estrutura de estreitamento após se recuperar da venda anterior.
Recentemente, o preço testou a região de resistência superior em torno de 102.04–102.10 e falhou ao sustentar a ruptura.
As velas mais recentes estão girando para baixo em direção ao lado inferior da estrutura, mantendo o momentum de curto prazo cauteloso a baixista.
🔹 Níveis-Chave do Gráfico
Zona de Reação Curta: 102.04 → 102.10
Resistência Principal: 102.10
Referência de Fibonacci: 101.96
Suporte da Estrutura: 101.93
🎯 Alvos de Fibonacci de Baixa
TP1 → 101.93 (1,5 Fib) TP2 → 101.89 (2,0 Fib) TP3 → 101.86 (2,5 Fib) TP4 → 101.83 (3,0 Fib) TP5 → 101.79 (3,5 Fib)
🔺 Invalidação de Alta / Reclaim
Uma recuperação sustentada acima da área de resistência 102.10 enfraqueceria o cenário imediato de continuação de baixa.
📈 Desdobramento Técnico
O SOL formou uma série de topos mais baixos após atingir a parte superior da estrutura atual.
As linhas de tendência azuis estão convergindo, mostrando compressão à medida que o preço se aproxima do ápice.
O preço rejeitou a faixa 102.04–102.10 e agora está voltando para a estrutura inferior.
O MACD está levemente negativo, enquanto o RSI está em torno de 41.91, indicando enfraquecimento do momentum de curto prazo sem estar profundamente sobrevendido.
Uma rejeição contínua abaixo da zona de resistência seguida por um movimento através de 101.96 favoreceria uma rotação em direção aos níveis marcados de Fibonacci de baixa.
🧠 Insight Rápido
“Compressão cria oportunidade, mas a confirmação define a direção.”
⚠️ Aviso
Esta é uma análise pessoal de mercado, não é aconselhamento financeiro. Esta estrutura de gráfico é apenas para fins educacionais.
Sempre faça DYOR / DYODD, gerencie o risco adequadamente e evite negociações movidas por emoção.
— @nayrbryanGaming #SOL #SOLUSDT #Crypto #Trading #TechnicalAnalysis #PriceAction #Fibonacci #Binance #DYOR #NFA #NoFOMO
SINAL DIÁRIO — SOL/USDT
Data: 12 de set de 2026 Período: 1m Viés intradiário: Rejeição da resistência → continuação de baixa
📊 Viés de Mercado
O SOL está se consolidando dentro de uma estrutura de estreitamento após se recuperar da venda anterior.
Recentemente, o preço testou a região de resistência superior em torno de 102.04–102.10 e falhou ao sustentar a ruptura.
As velas mais recentes estão girando para baixo em direção ao lado inferior da estrutura, mantendo o momentum de curto prazo cauteloso a baixista.
🔹 Níveis-Chave do Gráfico
Zona de Reação Curta: 102.04 → 102.10
Resistência Principal: 102.10
Referência de Fibonacci: 101.96
Suporte da Estrutura: 101.93
🎯 Alvos de Fibonacci de Baixa
TP1 → 101.93 (1,5 Fib) TP2 → 101.89 (2,0 Fib) TP3 → 101.86 (2,5 Fib) TP4 → 101.83 (3,0 Fib) TP5 → 101.79 (3,5 Fib)
🔺 Invalidação de Alta / Reclaim
Uma recuperação sustentada acima da área de resistência 102.10 enfraqueceria o cenário imediato de continuação de baixa.
📈 Desdobramento Técnico
O SOL formou uma série de topos mais baixos após atingir a parte superior da estrutura atual.
As linhas de tendência azuis estão convergindo, mostrando compressão à medida que o preço se aproxima do ápice.
O preço rejeitou a faixa 102.04–102.10 e agora está voltando para a estrutura inferior.
O MACD está levemente negativo, enquanto o RSI está em torno de 41.91, indicando enfraquecimento do momentum de curto prazo sem estar profundamente sobrevendido.
Uma rejeição contínua abaixo da zona de resistência seguida por um movimento através de 101.96 favoreceria uma rotação em direção aos níveis marcados de Fibonacci de baixa.
🧠 Insight Rápido
“Compressão cria oportunidade, mas a confirmação define a direção.”
⚠️ Aviso
Esta é uma análise pessoal de mercado, não é aconselhamento financeiro. Esta estrutura de gráfico é apenas para fins educacionais.
Sempre faça DYOR / DYODD, gerencie o risco adequadamente e evite negociações movidas por emoção.
— @nayrbryanGaming #SOL #SOLUSDT #Crypto #Trading #TechnicalAnalysis #PriceAction #Fibonacci #Binance #DYOR #NFA #NoFOMO
Data: 12 de set de 2026 Período: 1m Viés intradiário: Rejeição da resistência → continuação de baixa
📊 Viés de Mercado
O SOL está se consolidando dentro de uma estrutura de estreitamento após se recuperar da venda anterior.
Recentemente, o preço testou a região de resistência superior em torno de 102.04–102.10 e falhou ao sustentar a ruptura.
As velas mais recentes estão girando para baixo em direção ao lado inferior da estrutura, mantendo o momentum de curto prazo cauteloso a baixista.
🔹 Níveis-Chave do Gráfico
Zona de Reação Curta: 102.04 → 102.10
Resistência Principal: 102.10
Referência de Fibonacci: 101.96
Suporte da Estrutura: 101.93
🎯 Alvos de Fibonacci de Baixa
TP1 → 101.93 (1,5 Fib) TP2 → 101.89 (2,0 Fib) TP3 → 101.86 (2,5 Fib) TP4 → 101.83 (3,0 Fib) TP5 → 101.79 (3,5 Fib)
🔺 Invalidação de Alta / Reclaim
Uma recuperação sustentada acima da área de resistência 102.10 enfraqueceria o cenário imediato de continuação de baixa.
📈 Desdobramento Técnico
O SOL formou uma série de topos mais baixos após atingir a parte superior da estrutura atual.
As linhas de tendência azuis estão convergindo, mostrando compressão à medida que o preço se aproxima do ápice.
O preço rejeitou a faixa 102.04–102.10 e agora está voltando para a estrutura inferior.
O MACD está levemente negativo, enquanto o RSI está em torno de 41.91, indicando enfraquecimento do momentum de curto prazo sem estar profundamente sobrevendido.
Uma rejeição contínua abaixo da zona de resistência seguida por um movimento através de 101.96 favoreceria uma rotação em direção aos níveis marcados de Fibonacci de baixa.
🧠 Insight Rápido
“Compressão cria oportunidade, mas a confirmação define a direção.”
⚠️ Aviso
Esta é uma análise pessoal de mercado, não é aconselhamento financeiro. Esta estrutura de gráfico é apenas para fins educacionais.
Sempre faça DYOR / DYODD, gerencie o risco adequadamente e evite negociações movidas por emoção.
— @nayrbryanGaming #SOL #SOLUSDT #Crypto #Trading #TechnicalAnalysis #PriceAction #Fibonacci #Binance #DYOR #NFA #NoFOMO
1
134
·
--
Em Alta
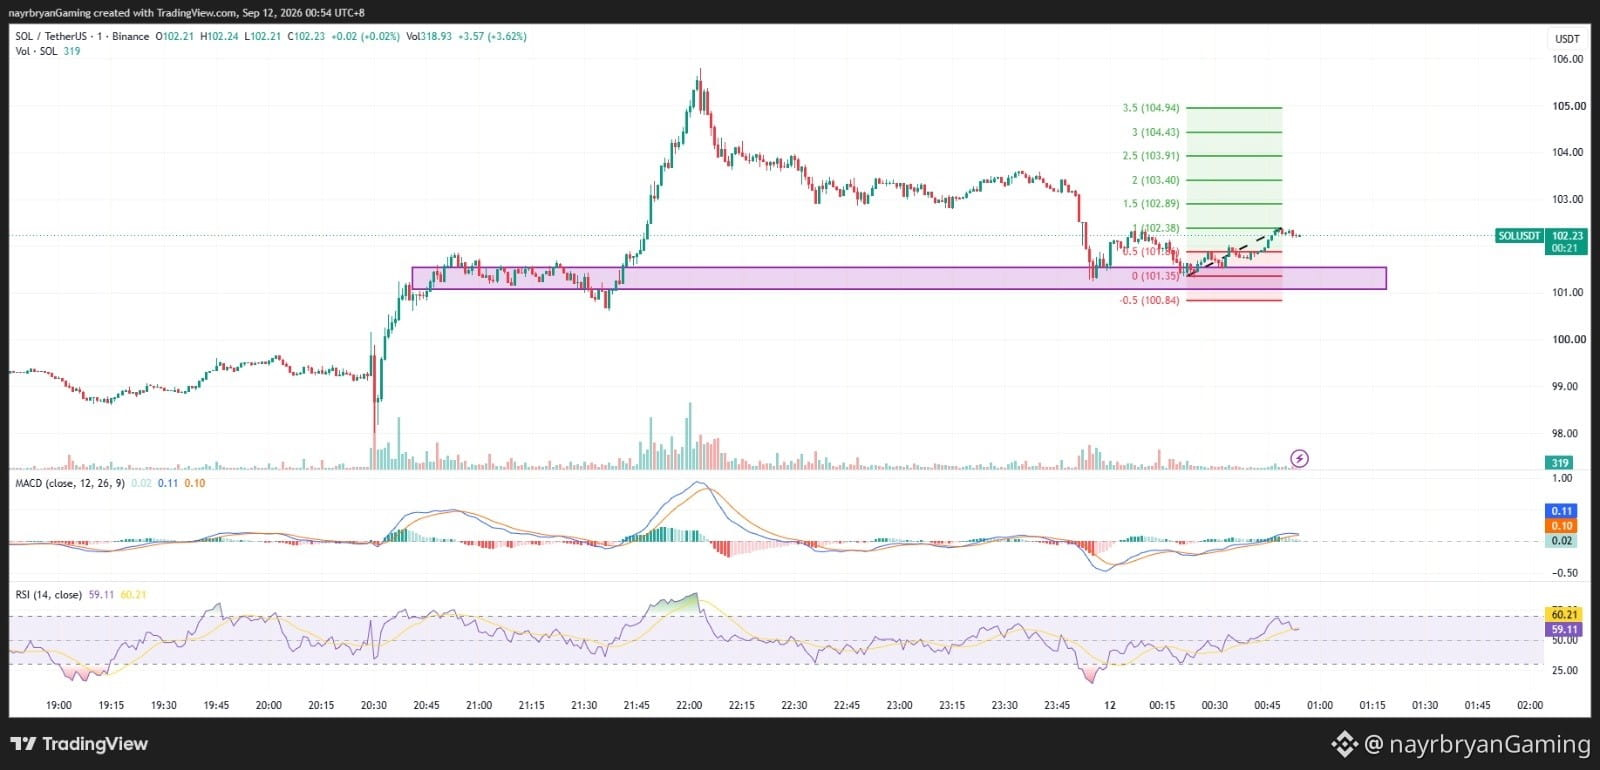
MOTIVAÇÃO DO TRADER / MINI INSIGHT
🧠 Insight do Dia
“Confirmação é mais valiosa do que previsão.”
Por que Isso Importa
Uma vela forte pode parecer convincente, mas uma única vela não define toda a estrutura.
O SOL se recuperou da zona inferior e agora está testando o próximo nível de Fibonacci em torno de 102.38.
A melhor abordagem é observar como o preço reage nos níveis importantes, em vez de correr atrás do impulso.
Uma execução inteligente se concentra em:
• Estrutura • Confirmação • Re-teste • Invalidação • Controle de risco
🎯 Checklist do Trader
Marque a zona de suporte 101.18–101.35
Acompanhe o nível 102.38
Aguarde a confirmação
Respeite a invalidação da estrutura
Evite perseguir velas estendidas
Proteja o capital
🧠 Mini Desafio
Antes de entrar, pergunte:
“A estrutura confirmou o movimento — ou estou apenas reagindo ao impulso?”
— @nayrbryanGaming #TraderMindset #TradingDiscipline #NoFOMO #CryptoMindset #DYOR #PriceAction #SOLUSDT
🔔 Siga minha Binance Square & X (@nayrbryanGaming) para insights diários do gráfico.
MOTIVAÇÃO DO TRADER / MINI INSIGHT
🧠 Insight do Dia
“Confirmação é mais valiosa do que previsão.”
Por que Isso Importa
Uma vela forte pode parecer convincente, mas uma única vela não define toda a estrutura.
O SOL se recuperou da zona inferior e agora está testando o próximo nível de Fibonacci em torno de 102.38.
A melhor abordagem é observar como o preço reage nos níveis importantes, em vez de correr atrás do impulso.
Uma execução inteligente se concentra em:
• Estrutura • Confirmação • Re-teste • Invalidação • Controle de risco
🎯 Checklist do Trader
Marque a zona de suporte 101.18–101.35
Acompanhe o nível 102.38
Aguarde a confirmação
Respeite a invalidação da estrutura
Evite perseguir velas estendidas
Proteja o capital
🧠 Mini Desafio
Antes de entrar, pergunte:
“A estrutura confirmou o movimento — ou estou apenas reagindo ao impulso?”
— @nayrbryanGaming #TraderMindset #TradingDiscipline #NoFOMO #CryptoMindset #DYOR #PriceAction #SOLUSDT
🔔 Siga minha Binance Square & X (@nayrbryanGaming) para insights diários do gráfico.
🧠 Insight do Dia
“Confirmação é mais valiosa do que previsão.”
Por que Isso Importa
Uma vela forte pode parecer convincente, mas uma única vela não define toda a estrutura.
O SOL se recuperou da zona inferior e agora está testando o próximo nível de Fibonacci em torno de 102.38.
A melhor abordagem é observar como o preço reage nos níveis importantes, em vez de correr atrás do impulso.
Uma execução inteligente se concentra em:
• Estrutura • Confirmação • Re-teste • Invalidação • Controle de risco
🎯 Checklist do Trader
Marque a zona de suporte 101.18–101.35
Acompanhe o nível 102.38
Aguarde a confirmação
Respeite a invalidação da estrutura
Evite perseguir velas estendidas
Proteja o capital
🧠 Mini Desafio
Antes de entrar, pergunte:
“A estrutura confirmou o movimento — ou estou apenas reagindo ao impulso?”
— @nayrbryanGaming #TraderMindset #TradingDiscipline #NoFOMO #CryptoMindset #DYOR #PriceAction #SOLUSDT
🔔 Siga minha Binance Square & X (@nayrbryanGaming) para insights diários do gráfico.
48
·
--
Em Alta
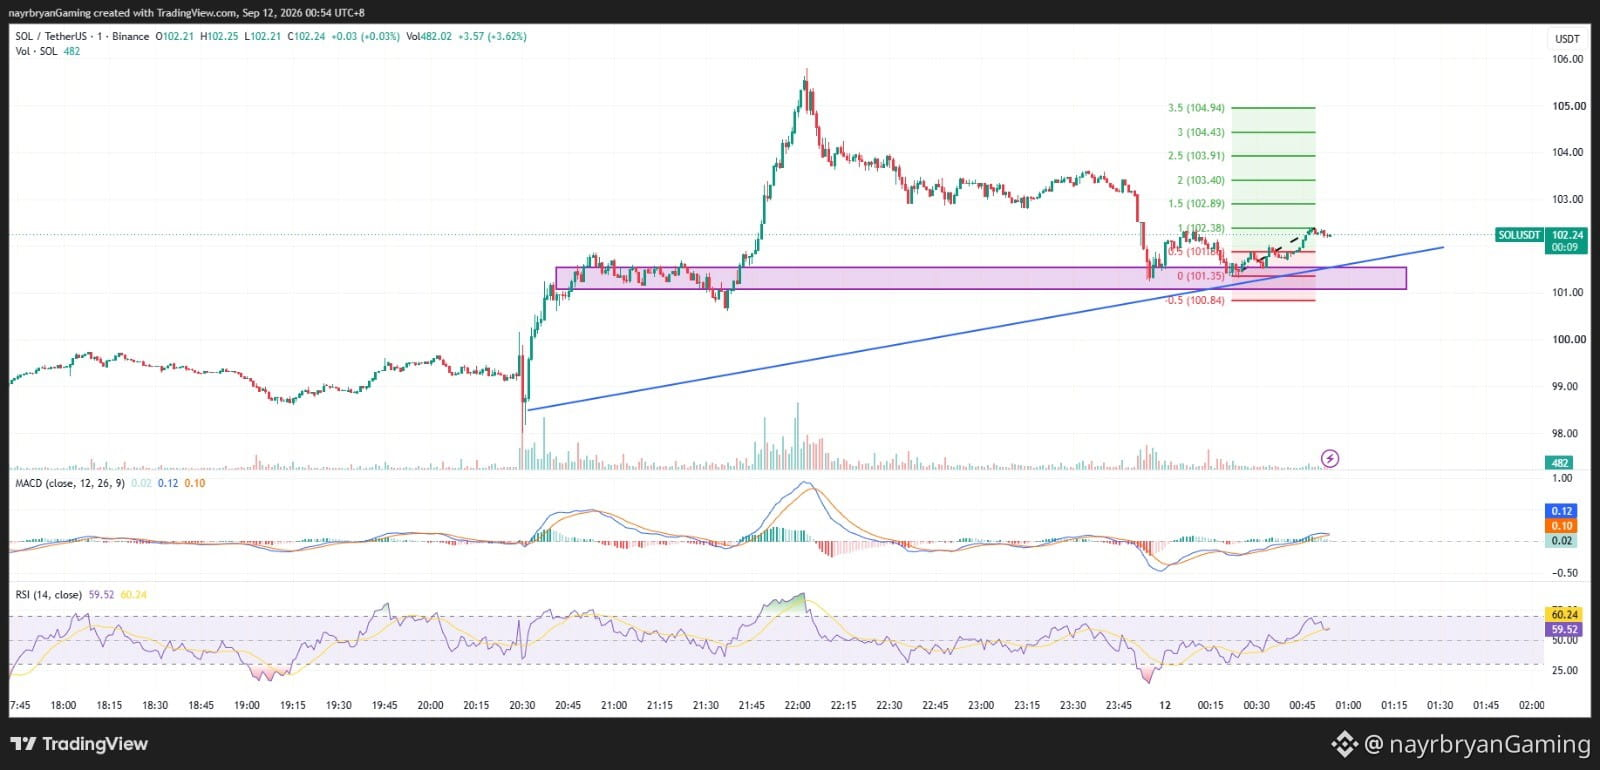
ANÁLISE DE LUZ / CONFIGURAÇÃO DO GRÁFICO — SOL/USDT
📈 Visão Geral da Estrutura
Fase do mercado: forte queda → formação de base → recuperação → tentativa de continuação altista
Suporte principal: 101.18 – 101.35
Resistência de Fibonacci atual: 102.38
Próximos níveis de alta: 102.89 → 103.40 → 103.91 → 104.43 → 104.94
Referência principal de baixa: 100.84
📌 O que eu estou Observando
Cenário A — Continuação Altista
Se SOL mantiver a estrutura atual de recuperação e sustentar acima de 101.35, o preço pode continuar girando em direção a:
102.38 → 102.89 → 103.40 → 103.91 → 104.43 → 104.94
Um movimento sustentado acima de 102.38 forneceria uma confirmação mais forte da continuação da alta.
Cenário B — Falha no Suporte
Se SOL perder a zona de 101.18–101.35, a configuração altista atual enfraquece.
A referência de Fibonacci de baixa marcada no gráfico é:
100.84
A quebra da estrutura inferior exigiria reavaliar a tese atual de continuação altista.
📊 Verificação de Indicadores
MACD: Positivo → melhorando o momentum no curto prazo
RSI: 59.52 → tendendo ao altista, não está sobrecomprado de forma profunda
Estrutura do Preço: recuperação + estrutura de suporte mais alta
Confirmação-chave: sustentar 101.35 / recuperar 102.38
Nota: isto é um framework de gráfico, não uma recomendação de trade. Use-o para apoiar seu próprio plano de execução baseado em DYOR.
— @nayrbryanGaming #SOLAnalysis #ChartSetup #PriceAction #SmartMoney #Fibonacci #CryptoTrading #DYOR #NFA
ANÁLISE DE LUZ / CONFIGURAÇÃO DO GRÁFICO — SOL/USDT
📈 Visão Geral da Estrutura
Fase do mercado: forte queda → formação de base → recuperação → tentativa de continuação altista
Suporte principal: 101.18 – 101.35
Resistência de Fibonacci atual: 102.38
Próximos níveis de alta: 102.89 → 103.40 → 103.91 → 104.43 → 104.94
Referência principal de baixa: 100.84
📌 O que eu estou Observando
Cenário A — Continuação Altista
Se SOL mantiver a estrutura atual de recuperação e sustentar acima de 101.35, o preço pode continuar girando em direção a:
102.38 → 102.89 → 103.40 → 103.91 → 104.43 → 104.94
Um movimento sustentado acima de 102.38 forneceria uma confirmação mais forte da continuação da alta.
Cenário B — Falha no Suporte
Se SOL perder a zona de 101.18–101.35, a configuração altista atual enfraquece.
A referência de Fibonacci de baixa marcada no gráfico é:
100.84
A quebra da estrutura inferior exigiria reavaliar a tese atual de continuação altista.
📊 Verificação de Indicadores
MACD: Positivo → melhorando o momentum no curto prazo
RSI: 59.52 → tendendo ao altista, não está sobrecomprado de forma profunda
Estrutura do Preço: recuperação + estrutura de suporte mais alta
Confirmação-chave: sustentar 101.35 / recuperar 102.38
Nota: isto é um framework de gráfico, não uma recomendação de trade. Use-o para apoiar seu próprio plano de execução baseado em DYOR.
— @nayrbryanGaming #SOLAnalysis #ChartSetup #PriceAction #SmartMoney #Fibonacci #CryptoTrading #DYOR #NFA
📈 Visão Geral da Estrutura
Fase do mercado: forte queda → formação de base → recuperação → tentativa de continuação altista
Suporte principal: 101.18 – 101.35
Resistência de Fibonacci atual: 102.38
Próximos níveis de alta: 102.89 → 103.40 → 103.91 → 104.43 → 104.94
Referência principal de baixa: 100.84
📌 O que eu estou Observando
Cenário A — Continuação Altista
Se SOL mantiver a estrutura atual de recuperação e sustentar acima de 101.35, o preço pode continuar girando em direção a:
102.38 → 102.89 → 103.40 → 103.91 → 104.43 → 104.94
Um movimento sustentado acima de 102.38 forneceria uma confirmação mais forte da continuação da alta.
Cenário B — Falha no Suporte
Se SOL perder a zona de 101.18–101.35, a configuração altista atual enfraquece.
A referência de Fibonacci de baixa marcada no gráfico é:
100.84
A quebra da estrutura inferior exigiria reavaliar a tese atual de continuação altista.
📊 Verificação de Indicadores
MACD: Positivo → melhorando o momentum no curto prazo
RSI: 59.52 → tendendo ao altista, não está sobrecomprado de forma profunda
Estrutura do Preço: recuperação + estrutura de suporte mais alta
Confirmação-chave: sustentar 101.35 / recuperar 102.38
Nota: isto é um framework de gráfico, não uma recomendação de trade. Use-o para apoiar seu próprio plano de execução baseado em DYOR.
— @nayrbryanGaming #SOLAnalysis #ChartSetup #PriceAction #SmartMoney #Fibonacci #CryptoTrading #DYOR #NFA
53
·
--
Em Alta
Ver tradução
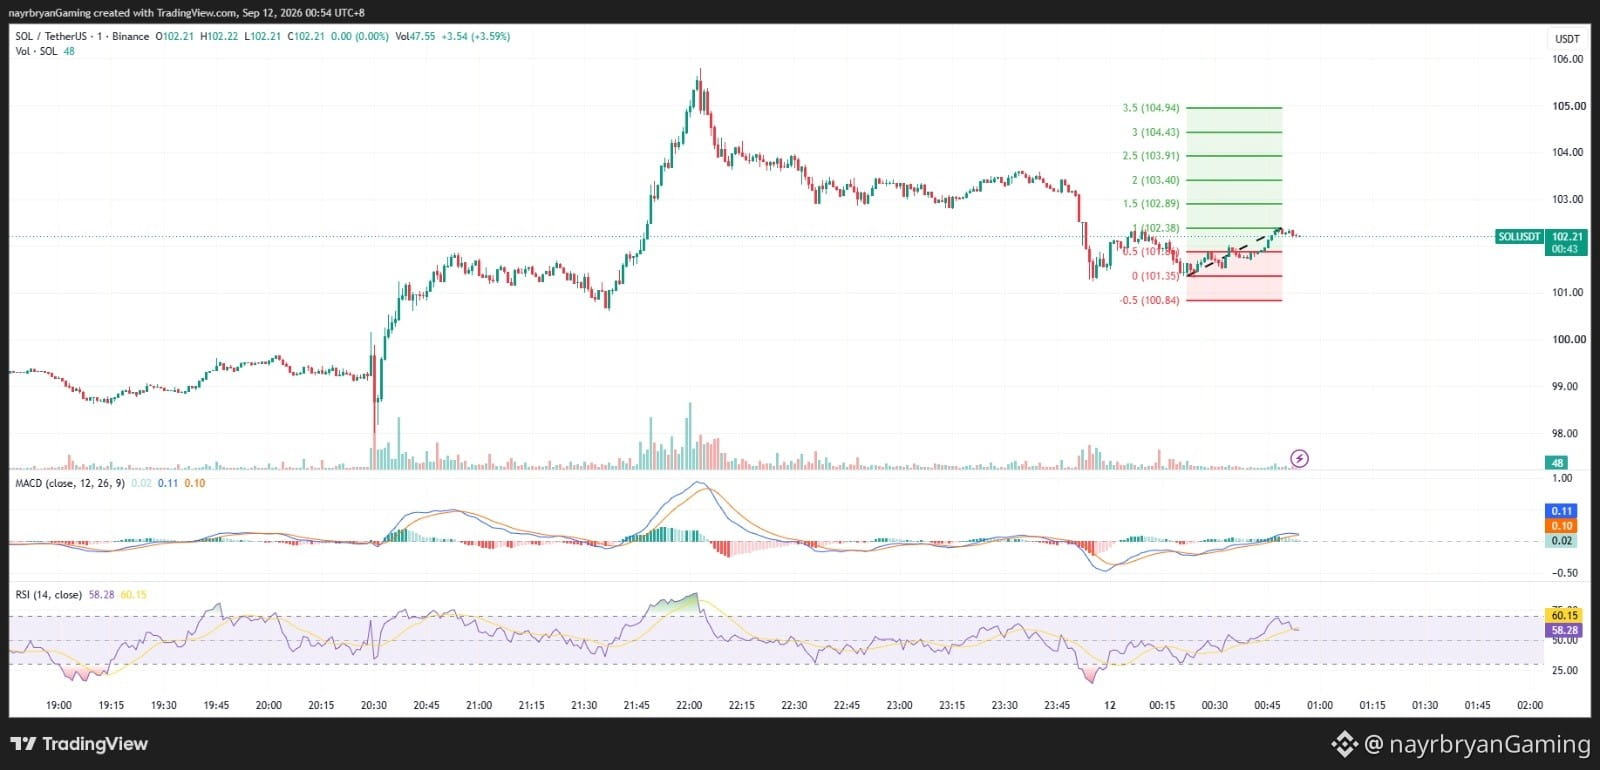
DAILY SIGNAL — SOL/USDT
Date: 12 Sep 2026 Timeframe: 1m Intraday Bias: Support reaction → bullish continuation
📊 Market Bias
SOL has recovered from the recent sell-off and is now trading above the 101.35 Fibonacci 0 level.
Price is holding around 102.24, while the previous structure zone around 101.35 continues to act as an important support area.
The recent recovery has pushed price back above the 101.18–101.35 area, with momentum improving toward the next Fibonacci levels.
🔹 Key Levels From Chart
Key Support Zone: 101.18 → 101.35
Fibonacci 0: 101.35
Key Reclaim / Mid Level: 101.18
Current Price: 102.24
🎯 Upside Fibonacci Targets
TP1 → 102.38 (1.0 Fib) TP2 → 102.89 (1.5 Fib) TP3 → 103.40 (2.0 Fib) TP4 → 103.91 (2.5 Fib) TP5 → 104.43 (3.0 Fib) TP6 → 104.94 (3.5 Fib)
🔻 Downside Reference
If the current structure fails, the chart marks:
100.84 (-0.5 Fib)
A sustained move below the 101.18–101.35 support area would weaken the bullish continuation scenario.
📈 Technical Breakdown
SOL previously established a strong base around the 101.00–101.35 region after the sharp rejection from higher levels.
Price then recovered and reclaimed the Fibonacci 0 level at 101.35.
The current price around 102.24 is approaching the marked 102.38 Fibonacci target.
MACD is positive and turning upward, while RSI is around 59.52, showing improving momentum without being deeply overbought.
The key observation is whether buyers can maintain price above the 101.35 structure.
A sustained reclaim of 102.38 would strengthen the continuation case toward:
102.89 → 103.40 → 103.91
🧠 Quick Insight
“After a strong recovery, the retest often tells you whether the breakout has real structure behind it.”
⚠️ Disclaimer
This is personal market analysis, not financial advice. This chart framework is for educational purposes only.
Always DYOR / DYODD, manage risk properly, and avoid emotional trading.
— @nayrbryanGaming #SOL #SOLUSDT #Crypto #Trading #TechnicalAnalysis #PriceAction #Fibonacci #Binance #DYOR #NFA #NoFOMO
DAILY SIGNAL — SOL/USDT
Date: 12 Sep 2026 Timeframe: 1m Intraday Bias: Support reaction → bullish continuation
📊 Market Bias
SOL has recovered from the recent sell-off and is now trading above the 101.35 Fibonacci 0 level.
Price is holding around 102.24, while the previous structure zone around 101.35 continues to act as an important support area.
The recent recovery has pushed price back above the 101.18–101.35 area, with momentum improving toward the next Fibonacci levels.
🔹 Key Levels From Chart
Key Support Zone: 101.18 → 101.35
Fibonacci 0: 101.35
Key Reclaim / Mid Level: 101.18
Current Price: 102.24
🎯 Upside Fibonacci Targets
TP1 → 102.38 (1.0 Fib) TP2 → 102.89 (1.5 Fib) TP3 → 103.40 (2.0 Fib) TP4 → 103.91 (2.5 Fib) TP5 → 104.43 (3.0 Fib) TP6 → 104.94 (3.5 Fib)
🔻 Downside Reference
If the current structure fails, the chart marks:
100.84 (-0.5 Fib)
A sustained move below the 101.18–101.35 support area would weaken the bullish continuation scenario.
📈 Technical Breakdown
SOL previously established a strong base around the 101.00–101.35 region after the sharp rejection from higher levels.
Price then recovered and reclaimed the Fibonacci 0 level at 101.35.
The current price around 102.24 is approaching the marked 102.38 Fibonacci target.
MACD is positive and turning upward, while RSI is around 59.52, showing improving momentum without being deeply overbought.
The key observation is whether buyers can maintain price above the 101.35 structure.
A sustained reclaim of 102.38 would strengthen the continuation case toward:
102.89 → 103.40 → 103.91
🧠 Quick Insight
“After a strong recovery, the retest often tells you whether the breakout has real structure behind it.”
⚠️ Disclaimer
This is personal market analysis, not financial advice. This chart framework is for educational purposes only.
Always DYOR / DYODD, manage risk properly, and avoid emotional trading.
— @nayrbryanGaming #SOL #SOLUSDT #Crypto #Trading #TechnicalAnalysis #PriceAction #Fibonacci #Binance #DYOR #NFA #NoFOMO
Date: 12 Sep 2026 Timeframe: 1m Intraday Bias: Support reaction → bullish continuation
📊 Market Bias
SOL has recovered from the recent sell-off and is now trading above the 101.35 Fibonacci 0 level.
Price is holding around 102.24, while the previous structure zone around 101.35 continues to act as an important support area.
The recent recovery has pushed price back above the 101.18–101.35 area, with momentum improving toward the next Fibonacci levels.
🔹 Key Levels From Chart
Key Support Zone: 101.18 → 101.35
Fibonacci 0: 101.35
Key Reclaim / Mid Level: 101.18
Current Price: 102.24
🎯 Upside Fibonacci Targets
TP1 → 102.38 (1.0 Fib) TP2 → 102.89 (1.5 Fib) TP3 → 103.40 (2.0 Fib) TP4 → 103.91 (2.5 Fib) TP5 → 104.43 (3.0 Fib) TP6 → 104.94 (3.5 Fib)
🔻 Downside Reference
If the current structure fails, the chart marks:
100.84 (-0.5 Fib)
A sustained move below the 101.18–101.35 support area would weaken the bullish continuation scenario.
📈 Technical Breakdown
SOL previously established a strong base around the 101.00–101.35 region after the sharp rejection from higher levels.
Price then recovered and reclaimed the Fibonacci 0 level at 101.35.
The current price around 102.24 is approaching the marked 102.38 Fibonacci target.
MACD is positive and turning upward, while RSI is around 59.52, showing improving momentum without being deeply overbought.
The key observation is whether buyers can maintain price above the 101.35 structure.
A sustained reclaim of 102.38 would strengthen the continuation case toward:
102.89 → 103.40 → 103.91
🧠 Quick Insight
“After a strong recovery, the retest often tells you whether the breakout has real structure behind it.”
⚠️ Disclaimer
This is personal market analysis, not financial advice. This chart framework is for educational purposes only.
Always DYOR / DYODD, manage risk properly, and avoid emotional trading.
— @nayrbryanGaming #SOL #SOLUSDT #Crypto #Trading #TechnicalAnalysis #PriceAction #Fibonacci #Binance #DYOR #NFA #NoFOMO
134
·
--
Em Alta
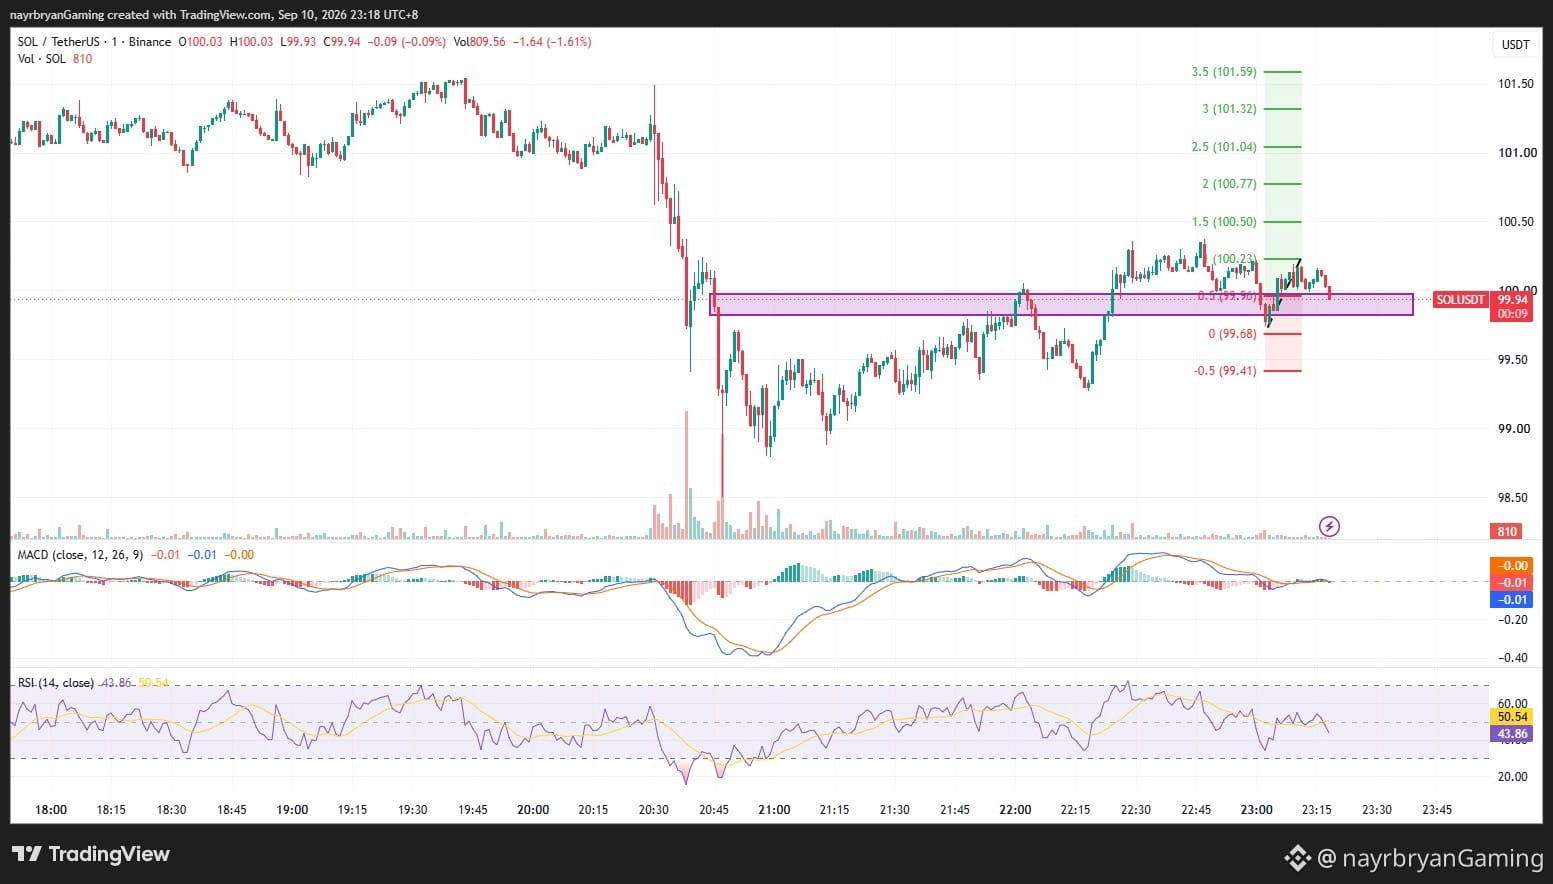
MOTIVAÇÃO DO TRADER / MINI INSIGHT
🧠 Insight do Dia
“A paciência começa onde seu nível-chave começa.”
Por que Isso Importa
Após uma forte recuperação, o preço pode revisitar a estrutura anterior antes de decidir sua próxima direção.
O SOL está atualmente testando a faixa de 99.68–99.90.
Em vez de perseguir cada candle, concentre-se na reação ao redor do nível.
Execução inteligente significa observar:
• Reação na região de suporte • Confirmação de estrutura • Requista da resistência • Invalidação • Controle de risco
🎯 Checklist do Trader
Marque a faixa de 99.68–99.90
Aguarde a confirmação
Observe a resistência em 100.22
Respeite o suporte da estrutura em 99.68
Monitore 99.41 se o suporte falhar
Evite entradas emocionais
Proteja o capital
🧠 Mini Desafio
Antes de entrar, pergunte:
“Estou seguindo uma estrutura confirmada — ou apenas reagindo ao último candle?”
— @nayrbryanGaming #TraderMindset #TradingDiscipline #NoFOMO #CryptoMindset #DYOR #PriceAction #SOLUSDT
🔔 Siga meu Binance Square & X (@nayrbryanGaming) para insights diários do gráfico.
MOTIVAÇÃO DO TRADER / MINI INSIGHT
🧠 Insight do Dia
“A paciência começa onde seu nível-chave começa.”
Por que Isso Importa
Após uma forte recuperação, o preço pode revisitar a estrutura anterior antes de decidir sua próxima direção.
O SOL está atualmente testando a faixa de 99.68–99.90.
Em vez de perseguir cada candle, concentre-se na reação ao redor do nível.
Execução inteligente significa observar:
• Reação na região de suporte • Confirmação de estrutura • Requista da resistência • Invalidação • Controle de risco
🎯 Checklist do Trader
Marque a faixa de 99.68–99.90
Aguarde a confirmação
Observe a resistência em 100.22
Respeite o suporte da estrutura em 99.68
Monitore 99.41 se o suporte falhar
Evite entradas emocionais
Proteja o capital
🧠 Mini Desafio
Antes de entrar, pergunte:
“Estou seguindo uma estrutura confirmada — ou apenas reagindo ao último candle?”
— @nayrbryanGaming #TraderMindset #TradingDiscipline #NoFOMO #CryptoMindset #DYOR #PriceAction #SOLUSDT
🔔 Siga meu Binance Square & X (@nayrbryanGaming) para insights diários do gráfico.
🧠 Insight do Dia
“A paciência começa onde seu nível-chave começa.”
Por que Isso Importa
Após uma forte recuperação, o preço pode revisitar a estrutura anterior antes de decidir sua próxima direção.
O SOL está atualmente testando a faixa de 99.68–99.90.
Em vez de perseguir cada candle, concentre-se na reação ao redor do nível.
Execução inteligente significa observar:
• Reação na região de suporte • Confirmação de estrutura • Requista da resistência • Invalidação • Controle de risco
🎯 Checklist do Trader
Marque a faixa de 99.68–99.90
Aguarde a confirmação
Observe a resistência em 100.22
Respeite o suporte da estrutura em 99.68
Monitore 99.41 se o suporte falhar
Evite entradas emocionais
Proteja o capital
🧠 Mini Desafio
Antes de entrar, pergunte:
“Estou seguindo uma estrutura confirmada — ou apenas reagindo ao último candle?”
— @nayrbryanGaming #TraderMindset #TradingDiscipline #NoFOMO #CryptoMindset #DYOR #PriceAction #SOLUSDT
🔔 Siga meu Binance Square & X (@nayrbryanGaming) para insights diários do gráfico.
46
·
--
Em Alta
Ver tradução
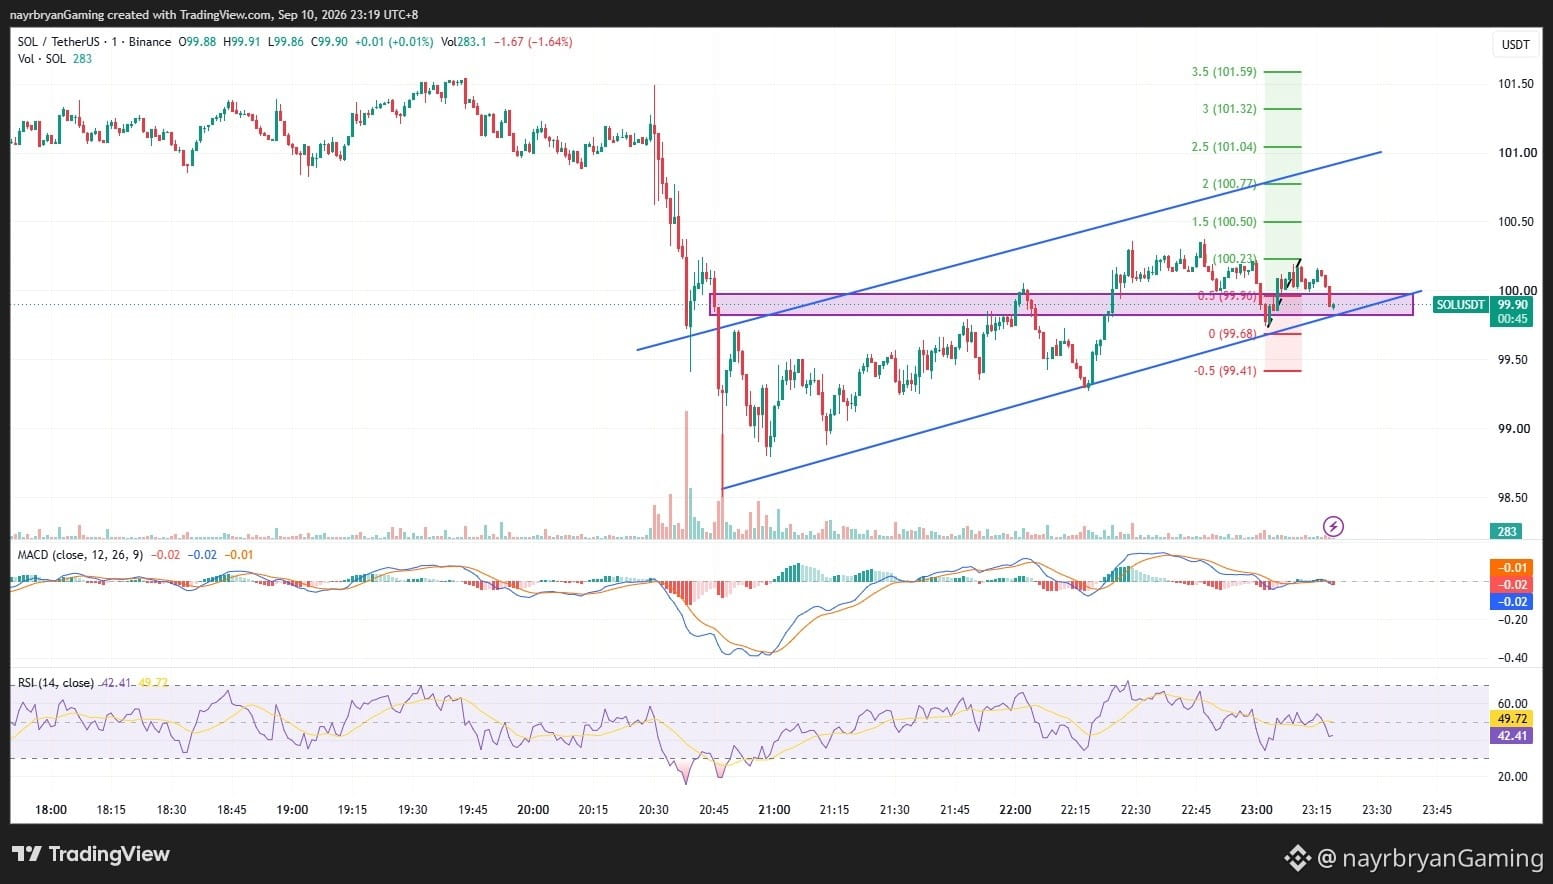
LIGHT ANALYSIS / CHART SETUP — SOL/USDT
📈 Structure Overview
Market phase: Sharp sell-off → Recovery → Ascending-channel consolidation
Current structure: Higher lows + rising channel support
Key reaction zone: 99.68 – 99.90
First upside resistance: 100.22
Major upside levels: 100.50 → 100.77 → 101.04 → 101.32 → 101.59
Structure failure level: 99.41
📌 What I’m Watching
Scenario A — Bullish Continuation
If SOL holds the 99.68–99.90 zone and buyers regain control, price may rotate toward:
100.22 → 100.50 → 100.77 → 101.04 → 101.32 → 101.59
A sustained move above 100.22 would provide stronger continuation confirmation.
Scenario B — Support Failure
If SOL loses 99.68, the current bullish structure becomes weaker.
The next marked downside Fibonacci level is:
99.41
A sustained break below the support structure would require reassessing the ascending-channel setup.
📊 Indicator Check
MACD: Near zero → momentum is mixed
RSI: 42.41 → weak-to-neutral momentum
Price Structure: Ascending channel + support retest
Key Confirmation: 99.68 hold / 100.22 reclaim
Note: This is a chart framework, not a trade recommendation. Use it to support your own DYOR-based execution plan.
— @nayrbryanGaming #SOLAnalysis #ChartSetup #PriceAction #SmartMoney #Fibonacci #CryptoTrading #DYOR #NFA
LIGHT ANALYSIS / CHART SETUP — SOL/USDT
📈 Structure Overview
Market phase: Sharp sell-off → Recovery → Ascending-channel consolidation
Current structure: Higher lows + rising channel support
Key reaction zone: 99.68 – 99.90
First upside resistance: 100.22
Major upside levels: 100.50 → 100.77 → 101.04 → 101.32 → 101.59
Structure failure level: 99.41
📌 What I’m Watching
Scenario A — Bullish Continuation
If SOL holds the 99.68–99.90 zone and buyers regain control, price may rotate toward:
100.22 → 100.50 → 100.77 → 101.04 → 101.32 → 101.59
A sustained move above 100.22 would provide stronger continuation confirmation.
Scenario B — Support Failure
If SOL loses 99.68, the current bullish structure becomes weaker.
The next marked downside Fibonacci level is:
99.41
A sustained break below the support structure would require reassessing the ascending-channel setup.
📊 Indicator Check
MACD: Near zero → momentum is mixed
RSI: 42.41 → weak-to-neutral momentum
Price Structure: Ascending channel + support retest
Key Confirmation: 99.68 hold / 100.22 reclaim
Note: This is a chart framework, not a trade recommendation. Use it to support your own DYOR-based execution plan.
— @nayrbryanGaming #SOLAnalysis #ChartSetup #PriceAction #SmartMoney #Fibonacci #CryptoTrading #DYOR #NFA
📈 Structure Overview
Market phase: Sharp sell-off → Recovery → Ascending-channel consolidation
Current structure: Higher lows + rising channel support
Key reaction zone: 99.68 – 99.90
First upside resistance: 100.22
Major upside levels: 100.50 → 100.77 → 101.04 → 101.32 → 101.59
Structure failure level: 99.41
📌 What I’m Watching
Scenario A — Bullish Continuation
If SOL holds the 99.68–99.90 zone and buyers regain control, price may rotate toward:
100.22 → 100.50 → 100.77 → 101.04 → 101.32 → 101.59
A sustained move above 100.22 would provide stronger continuation confirmation.
Scenario B — Support Failure
If SOL loses 99.68, the current bullish structure becomes weaker.
The next marked downside Fibonacci level is:
99.41
A sustained break below the support structure would require reassessing the ascending-channel setup.
📊 Indicator Check
MACD: Near zero → momentum is mixed
RSI: 42.41 → weak-to-neutral momentum
Price Structure: Ascending channel + support retest
Key Confirmation: 99.68 hold / 100.22 reclaim
Note: This is a chart framework, not a trade recommendation. Use it to support your own DYOR-based execution plan.
— @nayrbryanGaming #SOLAnalysis #ChartSetup #PriceAction #SmartMoney #Fibonacci #CryptoTrading #DYOR #NFA
36
·
--
Em Alta
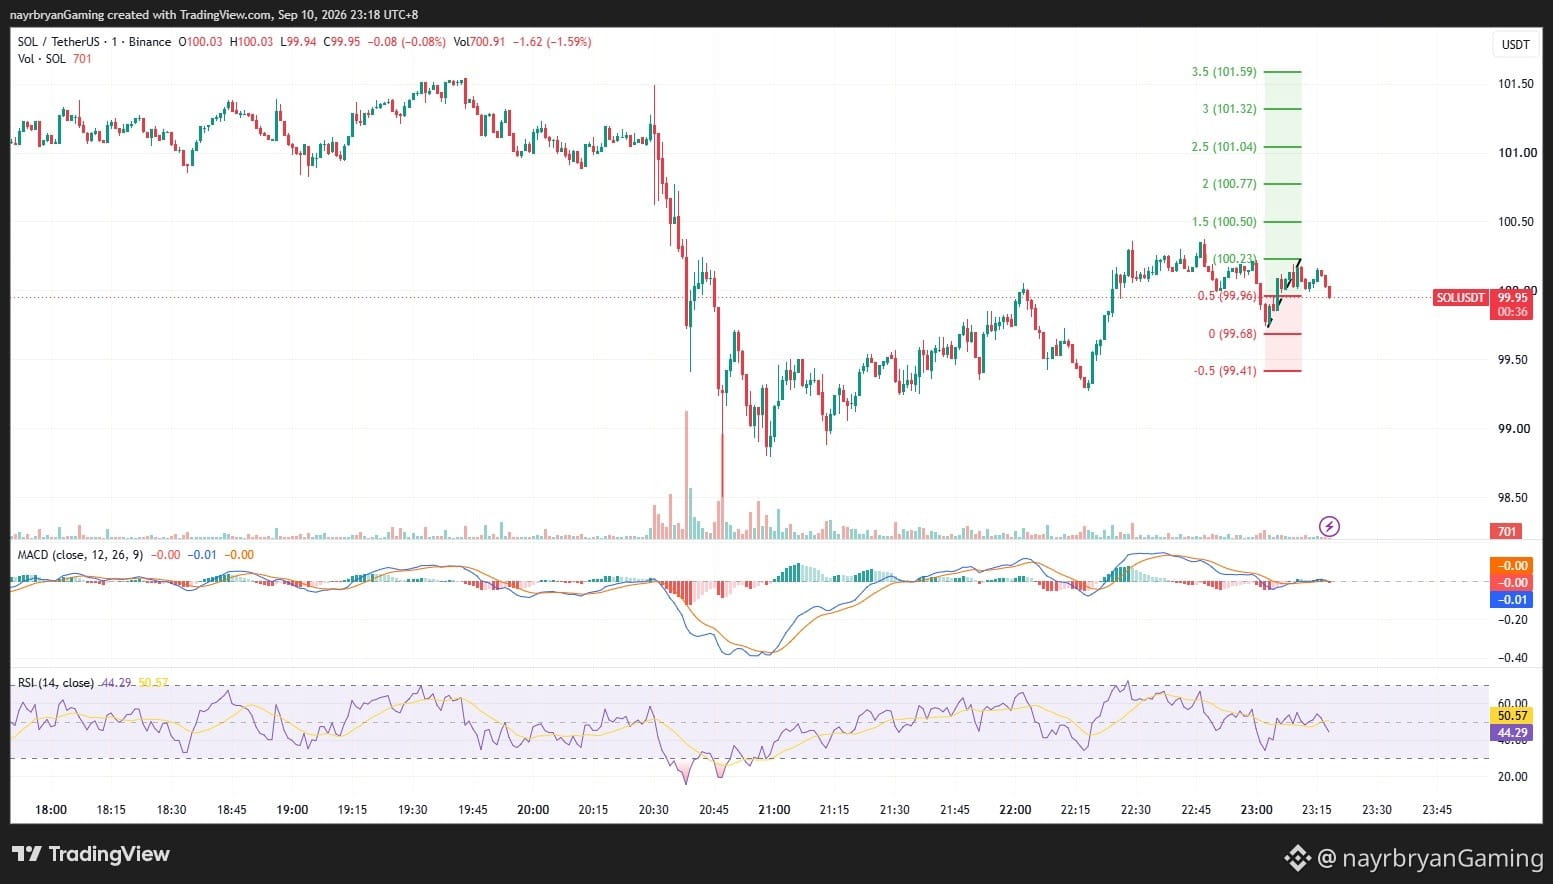
SINAL DIÁRIO — SOL/USDT
Data: 10 set 2026 Período: 1m Viés intraday: Reteste de suporte → possível continuação bullish
📊 Viés de Mercado
O SOL está sendo negociado dentro de um canal ascendente de curto prazo após se recuperar da forte queda.
O preço está atualmente testando a zona de estrutura 99.68–99.90, com o preço atual por volta de 99.90.
O nível 99.68 é o Fib 0 marcado, enquanto 99.90 é o nível 0.5.
Enquanto a estrutura ascendente e o suporte 99.68 se mantiverem, o gráfico permanece aberto para uma possível rotação em direção a níveis de Fibonacci mais altos.
🔹 Principais Níveis do Gráfico
Zona de Estrutura Principal: 99.68 → 99.90
Fibonacci 0: 99.68
Fibonacci 0.5: 99.90
Primeiro Nível Principal de Alta: 100.22
🎯 Alvos Fibonacci de Alta
TP1 → 100.22 (1.0 Fib) TP2 → 100.50 (1.5 Fib) TP3 → 100.77 (2.0 Fib) TP4 → 101.04 (2.5 Fib) TP5 → 101.32 (3.0 Fib) TP6 → 101.59 (3.5 Fib)
🔻 Nível de Baixa
Se a estrutura falhar abaixo do suporte marcado:
99.41 (-0.5 Fib)
Uma quebra sustentada abaixo de 99.68 enfraqueceria a atual estrutura de continuação bullish.
📈 Análise Técnica
O SOL se recuperou da parte inferior do canal ascendente e voltou para a região de 100.22.
Após atingir a porção superior da estrutura recente, o preço recuou e agora está testando a zona 99.68–99.90.
O MACD está perto da linha zero, mostrando que o momentum está relativamente equilibrado no momento.
O RSI está em torno de 42, indicando fraqueza no curto prazo sem estar profundamente sobrevendido.
A área de reação-chave continua sendo 99.68–99.90.
Uma reação de suporte bem-sucedida pode permitir que o preço gire em direção a:
100.22 → 100.50 → 100.77 → 101.04
🧠 Insight Rápido
“Uma boa estrutura dá aos traders um nível para respeitar, não um motivo para correr atrás.”
⚠️ Aviso Legal
Esta é uma análise pessoal de mercado, não é aconselhamento financeiro. Esta estrutura de gráfico é apenas para fins educacionais.
Faça sempre DYOR / DYODD, gerencie o risco corretamente e evite trading emocional.
— @nayrbryanGaming #SOL #SOLUSDT #Cripto #Trading #AnáliseTécnica #PriceAction #Fibonacci #Binance #DYOR #NFA #NoFOMO
SINAL DIÁRIO — SOL/USDT
Data: 10 set 2026 Período: 1m Viés intraday: Reteste de suporte → possível continuação bullish
📊 Viés de Mercado
O SOL está sendo negociado dentro de um canal ascendente de curto prazo após se recuperar da forte queda.
O preço está atualmente testando a zona de estrutura 99.68–99.90, com o preço atual por volta de 99.90.
O nível 99.68 é o Fib 0 marcado, enquanto 99.90 é o nível 0.5.
Enquanto a estrutura ascendente e o suporte 99.68 se mantiverem, o gráfico permanece aberto para uma possível rotação em direção a níveis de Fibonacci mais altos.
🔹 Principais Níveis do Gráfico
Zona de Estrutura Principal: 99.68 → 99.90
Fibonacci 0: 99.68
Fibonacci 0.5: 99.90
Primeiro Nível Principal de Alta: 100.22
🎯 Alvos Fibonacci de Alta
TP1 → 100.22 (1.0 Fib) TP2 → 100.50 (1.5 Fib) TP3 → 100.77 (2.0 Fib) TP4 → 101.04 (2.5 Fib) TP5 → 101.32 (3.0 Fib) TP6 → 101.59 (3.5 Fib)
🔻 Nível de Baixa
Se a estrutura falhar abaixo do suporte marcado:
99.41 (-0.5 Fib)
Uma quebra sustentada abaixo de 99.68 enfraqueceria a atual estrutura de continuação bullish.
📈 Análise Técnica
O SOL se recuperou da parte inferior do canal ascendente e voltou para a região de 100.22.
Após atingir a porção superior da estrutura recente, o preço recuou e agora está testando a zona 99.68–99.90.
O MACD está perto da linha zero, mostrando que o momentum está relativamente equilibrado no momento.
O RSI está em torno de 42, indicando fraqueza no curto prazo sem estar profundamente sobrevendido.
A área de reação-chave continua sendo 99.68–99.90.
Uma reação de suporte bem-sucedida pode permitir que o preço gire em direção a:
100.22 → 100.50 → 100.77 → 101.04
🧠 Insight Rápido
“Uma boa estrutura dá aos traders um nível para respeitar, não um motivo para correr atrás.”
⚠️ Aviso Legal
Esta é uma análise pessoal de mercado, não é aconselhamento financeiro. Esta estrutura de gráfico é apenas para fins educacionais.
Faça sempre DYOR / DYODD, gerencie o risco corretamente e evite trading emocional.
— @nayrbryanGaming #SOL #SOLUSDT #Cripto #Trading #AnáliseTécnica #PriceAction #Fibonacci #Binance #DYOR #NFA #NoFOMO
Data: 10 set 2026 Período: 1m Viés intraday: Reteste de suporte → possível continuação bullish
📊 Viés de Mercado
O SOL está sendo negociado dentro de um canal ascendente de curto prazo após se recuperar da forte queda.
O preço está atualmente testando a zona de estrutura 99.68–99.90, com o preço atual por volta de 99.90.
O nível 99.68 é o Fib 0 marcado, enquanto 99.90 é o nível 0.5.
Enquanto a estrutura ascendente e o suporte 99.68 se mantiverem, o gráfico permanece aberto para uma possível rotação em direção a níveis de Fibonacci mais altos.
🔹 Principais Níveis do Gráfico
Zona de Estrutura Principal: 99.68 → 99.90
Fibonacci 0: 99.68
Fibonacci 0.5: 99.90
Primeiro Nível Principal de Alta: 100.22
🎯 Alvos Fibonacci de Alta
TP1 → 100.22 (1.0 Fib) TP2 → 100.50 (1.5 Fib) TP3 → 100.77 (2.0 Fib) TP4 → 101.04 (2.5 Fib) TP5 → 101.32 (3.0 Fib) TP6 → 101.59 (3.5 Fib)
🔻 Nível de Baixa
Se a estrutura falhar abaixo do suporte marcado:
99.41 (-0.5 Fib)
Uma quebra sustentada abaixo de 99.68 enfraqueceria a atual estrutura de continuação bullish.
📈 Análise Técnica
O SOL se recuperou da parte inferior do canal ascendente e voltou para a região de 100.22.
Após atingir a porção superior da estrutura recente, o preço recuou e agora está testando a zona 99.68–99.90.
O MACD está perto da linha zero, mostrando que o momentum está relativamente equilibrado no momento.
O RSI está em torno de 42, indicando fraqueza no curto prazo sem estar profundamente sobrevendido.
A área de reação-chave continua sendo 99.68–99.90.
Uma reação de suporte bem-sucedida pode permitir que o preço gire em direção a:
100.22 → 100.50 → 100.77 → 101.04
🧠 Insight Rápido
“Uma boa estrutura dá aos traders um nível para respeitar, não um motivo para correr atrás.”
⚠️ Aviso Legal
Esta é uma análise pessoal de mercado, não é aconselhamento financeiro. Esta estrutura de gráfico é apenas para fins educacionais.
Faça sempre DYOR / DYODD, gerencie o risco corretamente e evite trading emocional.
— @nayrbryanGaming #SOL #SOLUSDT #Cripto #Trading #AnáliseTécnica #PriceAction #Fibonacci #Binance #DYOR #NFA #NoFOMO
262

·
--
Em Baixa
Ver tradução
TRADER MOTIVATION / MINI INSIGHT
🧠 Insight of the Day
“Don’t chase the breakdown. Wait for the structure to confirm it.”
Why This Matters
A market can sit on support for a long time before deciding its next direction.
The mistake is entering simply because the chart looks bearish.
Professional execution focuses on:
• Structure • Confirmation • Reaction • Invalidation • Risk control
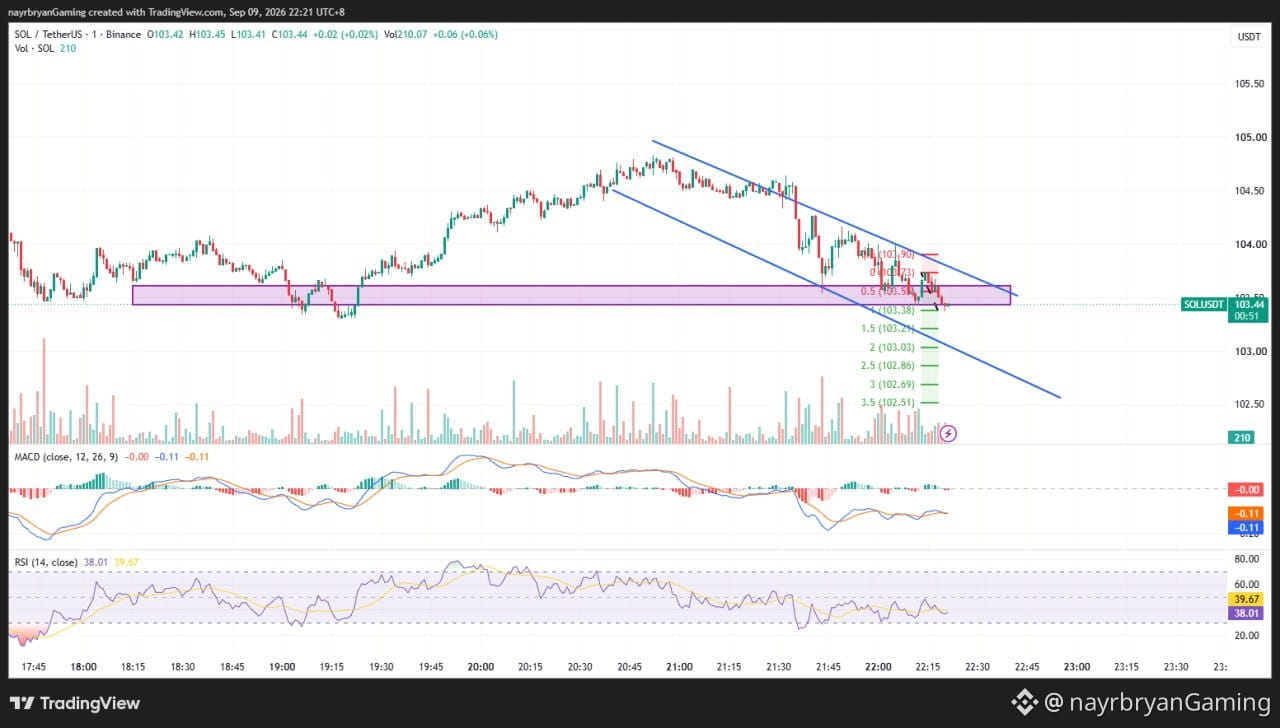
SOL is currently testing an important 103.38–103.65 zone.
The question is not:
“Will it fall?”
The better question is:
“Will sellers actually break the structure?”
🎯 Trader Checklist
Mark the reaction zone
Wait for confirmation
Watch the descending trendline
Respect invalidation
Avoid emotional entries
Protect capital
🧠 Mini Challenge
Before entering, ask:
“Am I entering because structure confirmed — or because I’m afraid of missing the move?”
— @nayrbryanGaming #TraderMindset #TradingDiscipline #NoFOMO #CryptoMindset #DYOR #PriceAction #SOLUSDT
🔔 Follow my Binance Square & X (@nayrbryanGaming) for daily chart insights.
TRADER MOTIVATION / MINI INSIGHT
🧠 Insight of the Day
“Don’t chase the breakdown. Wait for the structure to confirm it.”
Why This Matters
A market can sit on support for a long time before deciding its next direction.
The mistake is entering simply because the chart looks bearish.
Professional execution focuses on:
• Structure • Confirmation • Reaction • Invalidation • Risk control
SOL is currently testing an important 103.38–103.65 zone.
The question is not:
“Will it fall?”
The better question is:
“Will sellers actually break the structure?”
🎯 Trader Checklist
Mark the reaction zone
Wait for confirmation
Watch the descending trendline
Respect invalidation
Avoid emotional entries
Protect capital
🧠 Mini Challenge
Before entering, ask:
“Am I entering because structure confirmed — or because I’m afraid of missing the move?”
— @nayrbryanGaming #TraderMindset #TradingDiscipline #NoFOMO #CryptoMindset #DYOR #PriceAction #SOLUSDT
🔔 Follow my Binance Square & X (@nayrbryanGaming) for daily chart insights.
🧠 Insight of the Day
“Don’t chase the breakdown. Wait for the structure to confirm it.”
Why This Matters
A market can sit on support for a long time before deciding its next direction.
The mistake is entering simply because the chart looks bearish.
Professional execution focuses on:
• Structure • Confirmation • Reaction • Invalidation • Risk control
SOL is currently testing an important 103.38–103.65 zone.
The question is not:
“Will it fall?”
The better question is:
“Will sellers actually break the structure?”
🎯 Trader Checklist
Mark the reaction zone
Wait for confirmation
Watch the descending trendline
Respect invalidation
Avoid emotional entries
Protect capital
🧠 Mini Challenge
Before entering, ask:
“Am I entering because structure confirmed — or because I’m afraid of missing the move?”
— @nayrbryanGaming #TraderMindset #TradingDiscipline #NoFOMO #CryptoMindset #DYOR #PriceAction #SOLUSDT
🔔 Follow my Binance Square & X (@nayrbryanGaming) for daily chart insights.
37
·
--
Em Baixa
Ver tradução
LIGHT ANALYSIS / CHART SETUP — SOL/USDT
📈 Structure Overview
Market phase: Downtrend → Rebound → Resistance Test
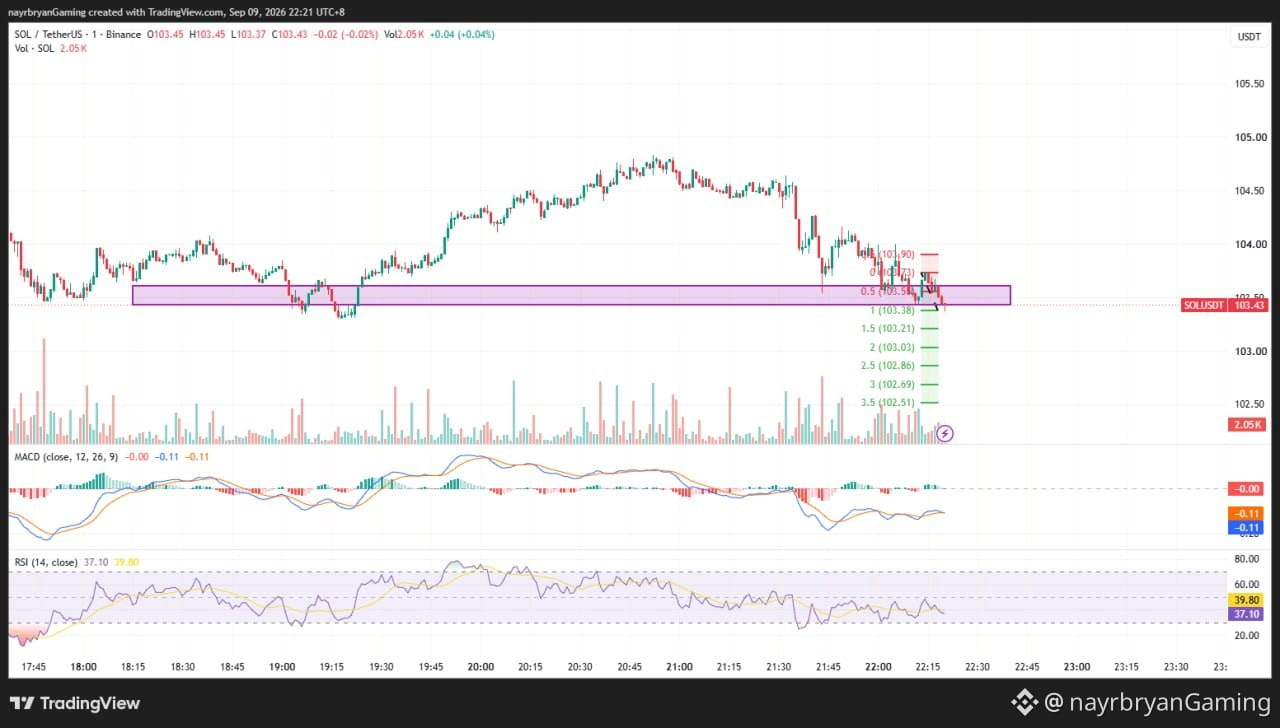
Descending structure: Lower highs inside a falling channel
Key reaction zone: 103.38 – 103.65
Major resistance: 103.73 – 103.90
Breakdown confirmation: Below 103.38
📌 What I’m Watching
Scenario A — Bearish Continuation
If SOL rejects the 103.38–103.65 area and loses 103.38, price may rotate toward:
103.21 → 103.03 → 102.86 → 102.69 → 102.51
These levels correspond with the Fibonacci extensions marked on the chart.
Scenario B — Bullish Reclaim
If SOL reclaims 103.73 and continues through 103.90, the immediate bearish structure weakens.
A sustained reclaim would suggest that sellers are losing control of the current descending setup.
Until that happens, rallies into resistance remain vulnerable to rejection.
📊 Indicator Check
MACD: Below zero → bearish momentum remains
RSI: 38.01 → weak momentum
Price Structure: Descending channel + lower highs
Key Confirmation: 103.38 breakdown / 103.90 reclaim
Note: This is a chart framework, not a trade recommendation. Use it to support your own DYOR-based execution plan.
— @nayrbryanGaming #SOLAnalysis #ChartSetup #PriceAction #SmartMoney #Fibonacci #CryptoTrading #DYOR #NFA
LIGHT ANALYSIS / CHART SETUP — SOL/USDT
📈 Structure Overview
Market phase: Downtrend → Rebound → Resistance Test
Descending structure: Lower highs inside a falling channel
Key reaction zone: 103.38 – 103.65
Major resistance: 103.73 – 103.90
Breakdown confirmation: Below 103.38
📌 What I’m Watching
Scenario A — Bearish Continuation
If SOL rejects the 103.38–103.65 area and loses 103.38, price may rotate toward:
103.21 → 103.03 → 102.86 → 102.69 → 102.51
These levels correspond with the Fibonacci extensions marked on the chart.
Scenario B — Bullish Reclaim
If SOL reclaims 103.73 and continues through 103.90, the immediate bearish structure weakens.
A sustained reclaim would suggest that sellers are losing control of the current descending setup.
Until that happens, rallies into resistance remain vulnerable to rejection.
📊 Indicator Check
MACD: Below zero → bearish momentum remains
RSI: 38.01 → weak momentum
Price Structure: Descending channel + lower highs
Key Confirmation: 103.38 breakdown / 103.90 reclaim
Note: This is a chart framework, not a trade recommendation. Use it to support your own DYOR-based execution plan.
— @nayrbryanGaming #SOLAnalysis #ChartSetup #PriceAction #SmartMoney #Fibonacci #CryptoTrading #DYOR #NFA
📈 Structure Overview
Market phase: Downtrend → Rebound → Resistance Test
Descending structure: Lower highs inside a falling channel
Key reaction zone: 103.38 – 103.65
Major resistance: 103.73 – 103.90
Breakdown confirmation: Below 103.38
📌 What I’m Watching
Scenario A — Bearish Continuation
If SOL rejects the 103.38–103.65 area and loses 103.38, price may rotate toward:
103.21 → 103.03 → 102.86 → 102.69 → 102.51
These levels correspond with the Fibonacci extensions marked on the chart.
Scenario B — Bullish Reclaim
If SOL reclaims 103.73 and continues through 103.90, the immediate bearish structure weakens.
A sustained reclaim would suggest that sellers are losing control of the current descending setup.
Until that happens, rallies into resistance remain vulnerable to rejection.
📊 Indicator Check
MACD: Below zero → bearish momentum remains
RSI: 38.01 → weak momentum
Price Structure: Descending channel + lower highs
Key Confirmation: 103.38 breakdown / 103.90 reclaim
Note: This is a chart framework, not a trade recommendation. Use it to support your own DYOR-based execution plan.
— @nayrbryanGaming #SOLAnalysis #ChartSetup #PriceAction #SmartMoney #Fibonacci #CryptoTrading #DYOR #NFA
28
·
--
Em Baixa
Ver tradução
DAILY SIGNAL — SOL/USDT
Date: 09 Sep 2026 Timeframe: 1m Intraday Bias: Bearish continuation → resistance rejection → downside liquidity
📊 Market Bias
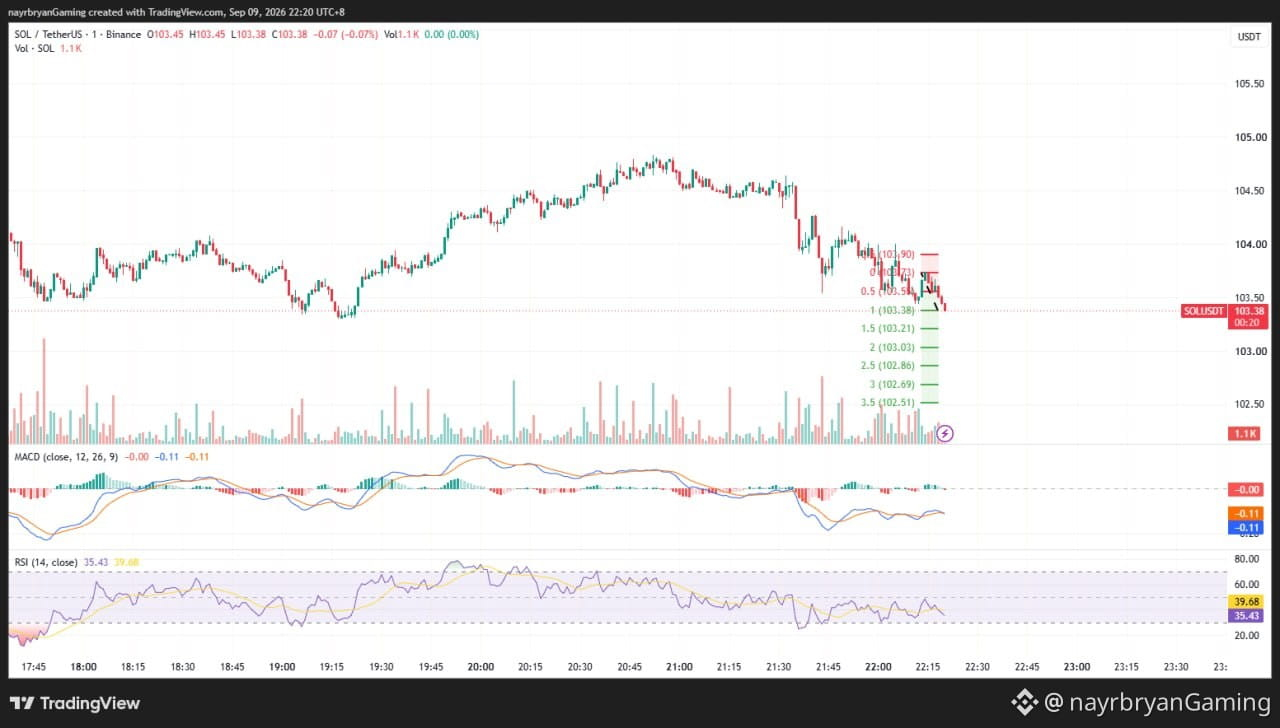
SOL remains inside a short-term descending channel after failing to sustain the recovery above the 104.00 area.
Price has returned to the purple structure zone around 103.38–103.65, which is now acting as an important reaction area.
The latest candles are struggling to reclaim the descending resistance, keeping the short-term structure bearish.
🔹 Key Levels From Chart
Entry Zone — Short Reaction Bias: 103.38 → 103.65
Key Resistance: 103.73 → 103.90
Invalidation: Above 103.90
Key Support: 103.38
🎯 Downside Fibonacci Targets
TP1 → 103.21 (1.5 Fib) TP2 → 103.03 (2.0 Fib) TP3 → 102.86 (2.5 Fib) TP4 → 102.69 (3.0 Fib) TP5 → 102.51 (3.5 Fib)
📈 Technical Breakdown
SOL has been making lower highs while respecting the descending channel.
The recent rebound from the lower area failed to produce a confirmed bullish reversal.
Price is now pressing against the 103.38–103.65 structure zone while remaining beneath the descending trendline.
MACD remains below the zero line, while RSI is around 38, showing weak momentum without being deeply oversold.
A confirmed rejection from the current zone followed by a break below 103.38 would strengthen the bearish continuation scenario.
If price instead reclaims 103.90, the bearish setup should be reassessed.
🧠 Quick Insight
“Resistance becomes powerful when the market keeps failing to reclaim it.”
⚠️ Disclaimer
This is personal market analysis, not financial advice. This chart framework is for educational purposes only.
Always DYOR / DYODD, manage risk properly, and avoid emotional trading.
— @nayrbryanGaming #SOL #SOLUSDT #Crypto #Trading #TechnicalAnalysis #PriceAction #Fibonacci #Binance #DYOR #NFA #NoFOMO
DAILY SIGNAL — SOL/USDT
Date: 09 Sep 2026 Timeframe: 1m Intraday Bias: Bearish continuation → resistance rejection → downside liquidity
📊 Market Bias
SOL remains inside a short-term descending channel after failing to sustain the recovery above the 104.00 area.
Price has returned to the purple structure zone around 103.38–103.65, which is now acting as an important reaction area.
The latest candles are struggling to reclaim the descending resistance, keeping the short-term structure bearish.
🔹 Key Levels From Chart
Entry Zone — Short Reaction Bias: 103.38 → 103.65
Key Resistance: 103.73 → 103.90
Invalidation: Above 103.90
Key Support: 103.38
🎯 Downside Fibonacci Targets
TP1 → 103.21 (1.5 Fib) TP2 → 103.03 (2.0 Fib) TP3 → 102.86 (2.5 Fib) TP4 → 102.69 (3.0 Fib) TP5 → 102.51 (3.5 Fib)
📈 Technical Breakdown
SOL has been making lower highs while respecting the descending channel.
The recent rebound from the lower area failed to produce a confirmed bullish reversal.
Price is now pressing against the 103.38–103.65 structure zone while remaining beneath the descending trendline.
MACD remains below the zero line, while RSI is around 38, showing weak momentum without being deeply oversold.
A confirmed rejection from the current zone followed by a break below 103.38 would strengthen the bearish continuation scenario.
If price instead reclaims 103.90, the bearish setup should be reassessed.
🧠 Quick Insight
“Resistance becomes powerful when the market keeps failing to reclaim it.”
⚠️ Disclaimer
This is personal market analysis, not financial advice. This chart framework is for educational purposes only.
Always DYOR / DYODD, manage risk properly, and avoid emotional trading.
— @nayrbryanGaming #SOL #SOLUSDT #Crypto #Trading #TechnicalAnalysis #PriceAction #Fibonacci #Binance #DYOR #NFA #NoFOMO
Date: 09 Sep 2026 Timeframe: 1m Intraday Bias: Bearish continuation → resistance rejection → downside liquidity
📊 Market Bias
SOL remains inside a short-term descending channel after failing to sustain the recovery above the 104.00 area.
Price has returned to the purple structure zone around 103.38–103.65, which is now acting as an important reaction area.
The latest candles are struggling to reclaim the descending resistance, keeping the short-term structure bearish.
🔹 Key Levels From Chart
Entry Zone — Short Reaction Bias: 103.38 → 103.65
Key Resistance: 103.73 → 103.90
Invalidation: Above 103.90
Key Support: 103.38
🎯 Downside Fibonacci Targets
TP1 → 103.21 (1.5 Fib) TP2 → 103.03 (2.0 Fib) TP3 → 102.86 (2.5 Fib) TP4 → 102.69 (3.0 Fib) TP5 → 102.51 (3.5 Fib)
📈 Technical Breakdown
SOL has been making lower highs while respecting the descending channel.
The recent rebound from the lower area failed to produce a confirmed bullish reversal.
Price is now pressing against the 103.38–103.65 structure zone while remaining beneath the descending trendline.
MACD remains below the zero line, while RSI is around 38, showing weak momentum without being deeply oversold.
A confirmed rejection from the current zone followed by a break below 103.38 would strengthen the bearish continuation scenario.
If price instead reclaims 103.90, the bearish setup should be reassessed.
🧠 Quick Insight
“Resistance becomes powerful when the market keeps failing to reclaim it.”
⚠️ Disclaimer
This is personal market analysis, not financial advice. This chart framework is for educational purposes only.
Always DYOR / DYODD, manage risk properly, and avoid emotional trading.
— @nayrbryanGaming #SOL #SOLUSDT #Crypto #Trading #TechnicalAnalysis #PriceAction #Fibonacci #Binance #DYOR #NFA #NoFOMO
55
·
--
Em Baixa
Ver tradução
TRADER MOTIVATION / MINI INSIGHT
🧠 Insight of the Day
“Never confuse a bounce with a reversal.”
Why This Matters
Price can bounce from support without actually changing the underlying structure.
The important question is not:
“Did price bounce?”
The better question is:
“Did price reclaim the structure?”
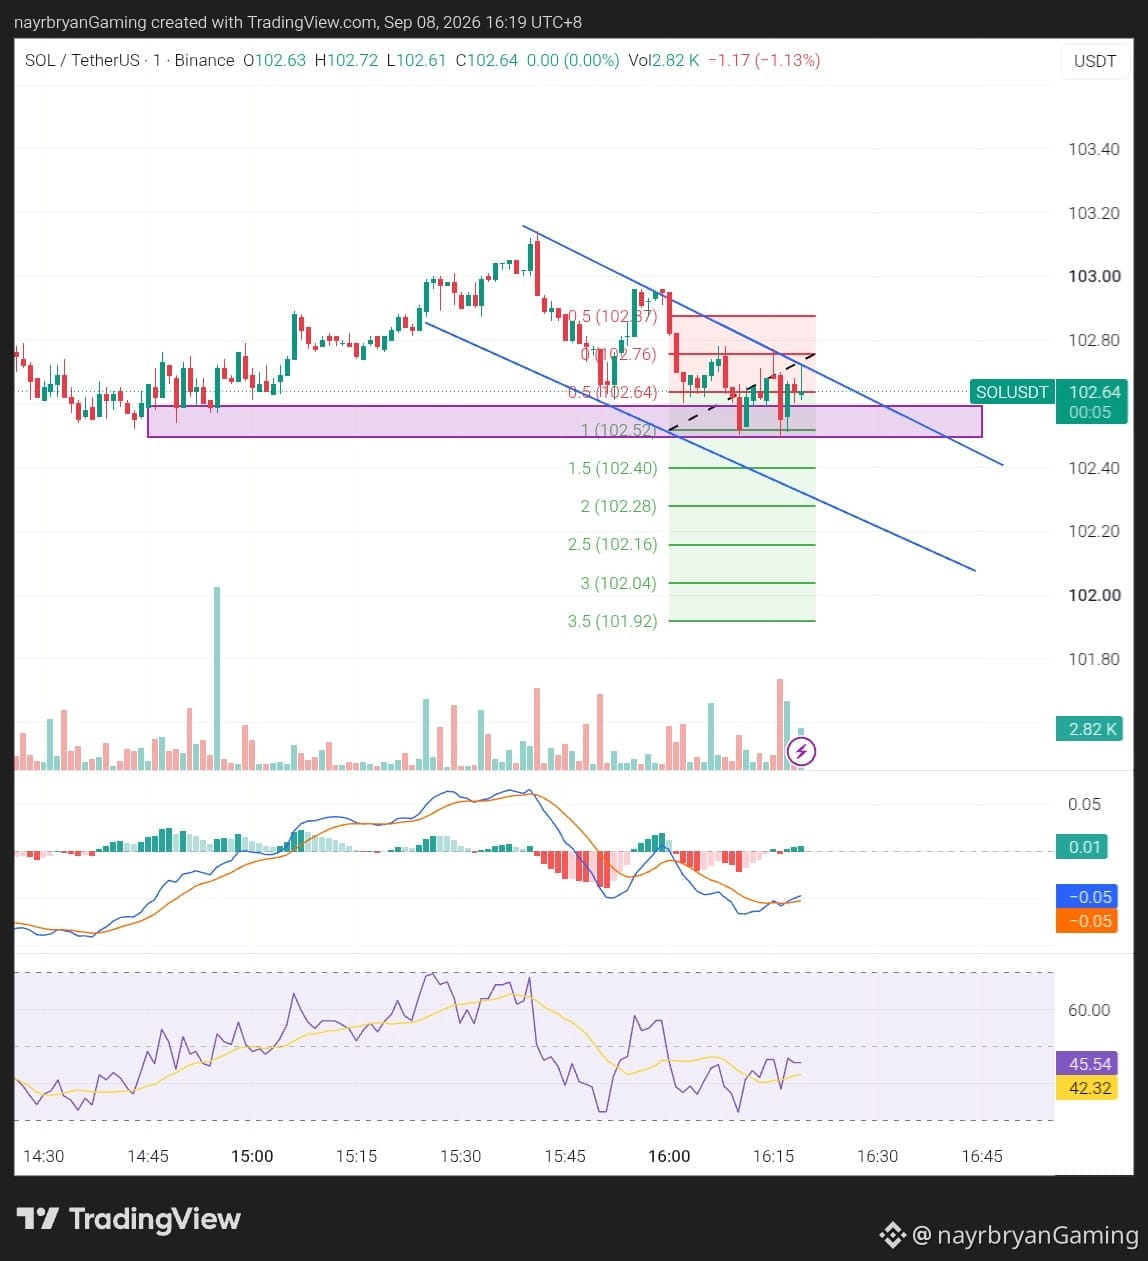
For SOL, the market is currently testing the 102.52–102.70 support area while remaining beneath the short-term descending structure.
That makes confirmation more important than prediction.
🎯 Trader Checklist
Identify the structure
Mark support and resistance
Wait for confirmation
Respect invalidation
Avoid chasing the first candle
Protect your capital
🧠 Mini Challenge
Before entering, ask:
“Did the market actually reverse — or did it only bounce?”
— @nayrbryanGaming #TraderMindset #TradingDiscipline #NoFOMO #CryptoMindset #DYOR #PriceAction #SOLUSDT
🔔 Follow my Binance Square & X (@nayrbryanGaming) for daily chart insights.
TRADER MOTIVATION / MINI INSIGHT
🧠 Insight of the Day
“Never confuse a bounce with a reversal.”
Why This Matters
Price can bounce from support without actually changing the underlying structure.
The important question is not:
“Did price bounce?”
The better question is:
“Did price reclaim the structure?”
For SOL, the market is currently testing the 102.52–102.70 support area while remaining beneath the short-term descending structure.
That makes confirmation more important than prediction.
🎯 Trader Checklist
Identify the structure
Mark support and resistance
Wait for confirmation
Respect invalidation
Avoid chasing the first candle
Protect your capital
🧠 Mini Challenge
Before entering, ask:
“Did the market actually reverse — or did it only bounce?”
— @nayrbryanGaming #TraderMindset #TradingDiscipline #NoFOMO #CryptoMindset #DYOR #PriceAction #SOLUSDT
🔔 Follow my Binance Square & X (@nayrbryanGaming) for daily chart insights.
🧠 Insight of the Day
“Never confuse a bounce with a reversal.”
Why This Matters
Price can bounce from support without actually changing the underlying structure.
The important question is not:
“Did price bounce?”
The better question is:
“Did price reclaim the structure?”
For SOL, the market is currently testing the 102.52–102.70 support area while remaining beneath the short-term descending structure.
That makes confirmation more important than prediction.
🎯 Trader Checklist
Identify the structure
Mark support and resistance
Wait for confirmation
Respect invalidation
Avoid chasing the first candle
Protect your capital
🧠 Mini Challenge
Before entering, ask:
“Did the market actually reverse — or did it only bounce?”
— @nayrbryanGaming #TraderMindset #TradingDiscipline #NoFOMO #CryptoMindset #DYOR #PriceAction #SOLUSDT
🔔 Follow my Binance Square & X (@nayrbryanGaming) for daily chart insights.
154
·
--
Em Baixa
Ver tradução
LIGHT ANALYSIS / CHART SETUP — SOL/USDT
📈 Structure Overview
Market phase: Downtrend → Rebound → Support Test
Key resistance: 102.70 – 102.87
Key support zone: 102.52 – 102.70
Breakdown confirmation: Below 102.52
Major invalidation: Above 102.87
📌 What I’m Watching
Scenario A — Bearish Continuation
If SOL loses 102.52 with confirmation, price may rotate toward:
102.40 → 102.28 → 102.16 → 102.04 → 101.92
Potential reactions may occur around each Fibonacci extension.
Scenario B — Support Reclaim
If SOL holds the 102.52–102.70 area and reclaims 102.87, the immediate bearish setup weakens.
Price could then attempt another rotation toward the upper structure.
The key is whether buyers can reclaim the descending resistance rather than simply producing another short-term bounce.
📊 Indicator Check
MACD: Recovering from negative momentum
RSI: 46.34 — neutral-to-soft momentum
Price Structure: Lower highs + descending channel
Key Confirmation: 102.52 breakdown / 102.87 reclaim
Note: This is a chart framework, not a trade recommendation. Use it to support your own DYOR-based execution plan.
— @nayrbryanGaming #SOLAnalysis #ChartSetup #PriceAction #SmartMoney #Fibonacci #CryptoTrading #DYOR
LIGHT ANALYSIS / CHART SETUP — SOL/USDT
📈 Structure Overview
Market phase: Downtrend → Rebound → Support Test
Key resistance: 102.70 – 102.87
Key support zone: 102.52 – 102.70
Breakdown confirmation: Below 102.52
Major invalidation: Above 102.87
📌 What I’m Watching
Scenario A — Bearish Continuation
If SOL loses 102.52 with confirmation, price may rotate toward:
102.40 → 102.28 → 102.16 → 102.04 → 101.92
Potential reactions may occur around each Fibonacci extension.
Scenario B — Support Reclaim
If SOL holds the 102.52–102.70 area and reclaims 102.87, the immediate bearish setup weakens.
Price could then attempt another rotation toward the upper structure.
The key is whether buyers can reclaim the descending resistance rather than simply producing another short-term bounce.
📊 Indicator Check
MACD: Recovering from negative momentum
RSI: 46.34 — neutral-to-soft momentum
Price Structure: Lower highs + descending channel
Key Confirmation: 102.52 breakdown / 102.87 reclaim
Note: This is a chart framework, not a trade recommendation. Use it to support your own DYOR-based execution plan.
— @nayrbryanGaming #SOLAnalysis #ChartSetup #PriceAction #SmartMoney #Fibonacci #CryptoTrading #DYOR
📈 Structure Overview
Market phase: Downtrend → Rebound → Support Test
Key resistance: 102.70 – 102.87
Key support zone: 102.52 – 102.70
Breakdown confirmation: Below 102.52
Major invalidation: Above 102.87
📌 What I’m Watching
Scenario A — Bearish Continuation
If SOL loses 102.52 with confirmation, price may rotate toward:
102.40 → 102.28 → 102.16 → 102.04 → 101.92
Potential reactions may occur around each Fibonacci extension.
Scenario B — Support Reclaim
If SOL holds the 102.52–102.70 area and reclaims 102.87, the immediate bearish setup weakens.
Price could then attempt another rotation toward the upper structure.
The key is whether buyers can reclaim the descending resistance rather than simply producing another short-term bounce.
📊 Indicator Check
MACD: Recovering from negative momentum
RSI: 46.34 — neutral-to-soft momentum
Price Structure: Lower highs + descending channel
Key Confirmation: 102.52 breakdown / 102.87 reclaim
Note: This is a chart framework, not a trade recommendation. Use it to support your own DYOR-based execution plan.
— @nayrbryanGaming #SOLAnalysis #ChartSetup #PriceAction #SmartMoney #Fibonacci #CryptoTrading #DYOR
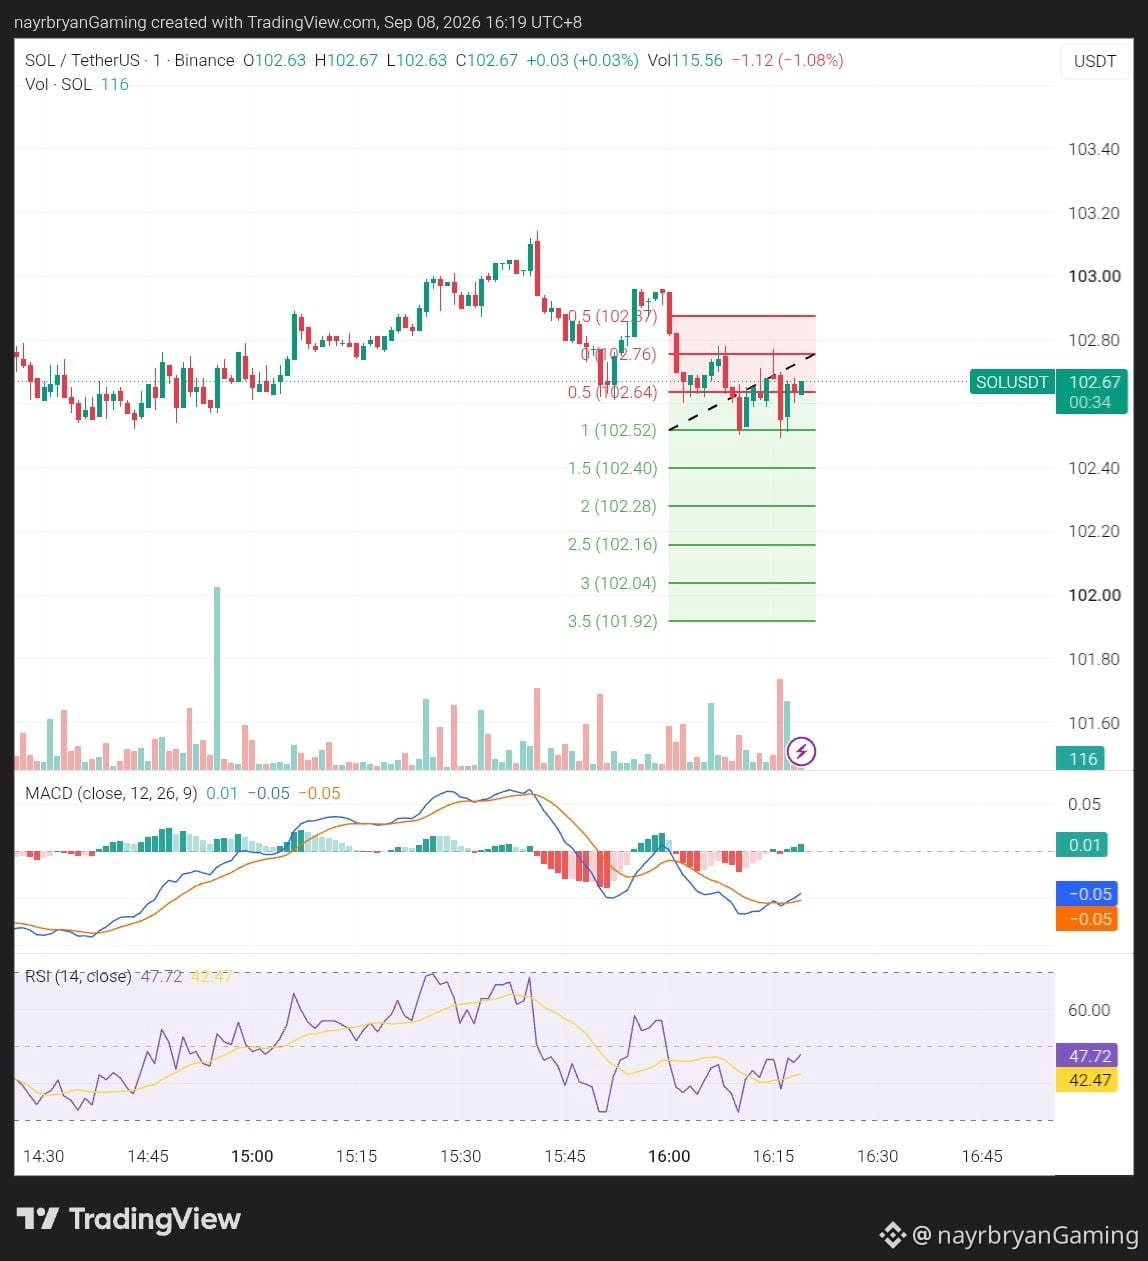
43
·
--
Em Baixa
Ver tradução
DAILY SIGNAL — SOL/USDT
Date: 08 Sep 2026 Timeframe: 1m Intraday Bias: Bearish structure → support test → potential downside continuation
📊 Market Bias
SOL is trading inside a short-term descending structure after rejection from the 103.00–103.15 area.
Price is currently around 102.65 and testing the purple support zone around 102.52–102.70.
The recent rebound has not yet broken the descending structure, keeping the short-term bias cautious-to-bearish.
A clean loss of the support area could expose the lower Fibonacci extension levels.
🔹 Key Levels From Chart
Entry Zone — Short Reaction Bias: 102.64 → 102.70
Key Resistance / Rejection: 102.70 → 102.87
Stop-Loss / Invalidation: Above 102.87
Main Support: 102.52
🎯 Downside Fibonacci Targets
TP1 → 102.52 (1.0 Fib) TP2 → 102.40 (1.5 Fib) TP3 → 102.28 (2.0 Fib) TP4 → 102.16 (2.5 Fib) TP5 → 102.04 (3.0 Fib) TP6 → 101.92 (3.5 Fib)
📈 Technical Breakdown
SOL remains beneath a descending trend structure after failing to sustain the recovery toward the 102.87 area.
The purple zone around 102.52–102.70 is currently the key battleground.
Price is attempting to stabilize around support, while MACD is showing a small recovery from negative territory.
RSI is around 46, indicating neutral-to-soft momentum rather than an oversold condition.
This means the downside scenario remains technically possible, but confirmation is important.
A decisive break below 102.52 would strengthen the bearish continuation setup.
If SOL instead reclaims and holds above 102.87, the short setup becomes invalid and the structure should be reassessed.
🧠 Quick Insight
“Support can hold the market — until price proves otherwise.”
⚠️ Disclaimer
This is personal market analysis, not financial advice. This chart framework is for educational purposes only.
Always DYOR / DYODD, manage risk properly, and avoid emotional trading.
— @nayrbryanGaming #SOL #SOLUSDT #Crypto #Trading #TechnicalAnalysis #PriceAction #Fibonacci #Binance #DYOR #NFA #SmartMoney #NoFOMO
DAILY SIGNAL — SOL/USDT
Date: 08 Sep 2026 Timeframe: 1m Intraday Bias: Bearish structure → support test → potential downside continuation
📊 Market Bias
SOL is trading inside a short-term descending structure after rejection from the 103.00–103.15 area.
Price is currently around 102.65 and testing the purple support zone around 102.52–102.70.
The recent rebound has not yet broken the descending structure, keeping the short-term bias cautious-to-bearish.
A clean loss of the support area could expose the lower Fibonacci extension levels.
🔹 Key Levels From Chart
Entry Zone — Short Reaction Bias: 102.64 → 102.70
Key Resistance / Rejection: 102.70 → 102.87
Stop-Loss / Invalidation: Above 102.87
Main Support: 102.52
🎯 Downside Fibonacci Targets
TP1 → 102.52 (1.0 Fib) TP2 → 102.40 (1.5 Fib) TP3 → 102.28 (2.0 Fib) TP4 → 102.16 (2.5 Fib) TP5 → 102.04 (3.0 Fib) TP6 → 101.92 (3.5 Fib)
📈 Technical Breakdown
SOL remains beneath a descending trend structure after failing to sustain the recovery toward the 102.87 area.
The purple zone around 102.52–102.70 is currently the key battleground.
Price is attempting to stabilize around support, while MACD is showing a small recovery from negative territory.
RSI is around 46, indicating neutral-to-soft momentum rather than an oversold condition.
This means the downside scenario remains technically possible, but confirmation is important.
A decisive break below 102.52 would strengthen the bearish continuation setup.
If SOL instead reclaims and holds above 102.87, the short setup becomes invalid and the structure should be reassessed.
🧠 Quick Insight
“Support can hold the market — until price proves otherwise.”
⚠️ Disclaimer
This is personal market analysis, not financial advice. This chart framework is for educational purposes only.
Always DYOR / DYODD, manage risk properly, and avoid emotional trading.
— @nayrbryanGaming #SOL #SOLUSDT #Crypto #Trading #TechnicalAnalysis #PriceAction #Fibonacci #Binance #DYOR #NFA #SmartMoney #NoFOMO
Date: 08 Sep 2026 Timeframe: 1m Intraday Bias: Bearish structure → support test → potential downside continuation
📊 Market Bias
SOL is trading inside a short-term descending structure after rejection from the 103.00–103.15 area.
Price is currently around 102.65 and testing the purple support zone around 102.52–102.70.
The recent rebound has not yet broken the descending structure, keeping the short-term bias cautious-to-bearish.
A clean loss of the support area could expose the lower Fibonacci extension levels.
🔹 Key Levels From Chart
Entry Zone — Short Reaction Bias: 102.64 → 102.70
Key Resistance / Rejection: 102.70 → 102.87
Stop-Loss / Invalidation: Above 102.87
Main Support: 102.52
🎯 Downside Fibonacci Targets
TP1 → 102.52 (1.0 Fib) TP2 → 102.40 (1.5 Fib) TP3 → 102.28 (2.0 Fib) TP4 → 102.16 (2.5 Fib) TP5 → 102.04 (3.0 Fib) TP6 → 101.92 (3.5 Fib)
📈 Technical Breakdown
SOL remains beneath a descending trend structure after failing to sustain the recovery toward the 102.87 area.
The purple zone around 102.52–102.70 is currently the key battleground.
Price is attempting to stabilize around support, while MACD is showing a small recovery from negative territory.
RSI is around 46, indicating neutral-to-soft momentum rather than an oversold condition.
This means the downside scenario remains technically possible, but confirmation is important.
A decisive break below 102.52 would strengthen the bearish continuation setup.
If SOL instead reclaims and holds above 102.87, the short setup becomes invalid and the structure should be reassessed.
🧠 Quick Insight
“Support can hold the market — until price proves otherwise.”
⚠️ Disclaimer
This is personal market analysis, not financial advice. This chart framework is for educational purposes only.
Always DYOR / DYODD, manage risk properly, and avoid emotional trading.
— @nayrbryanGaming #SOL #SOLUSDT #Crypto #Trading #TechnicalAnalysis #PriceAction #Fibonacci #Binance #DYOR #NFA #SmartMoney #NoFOMO
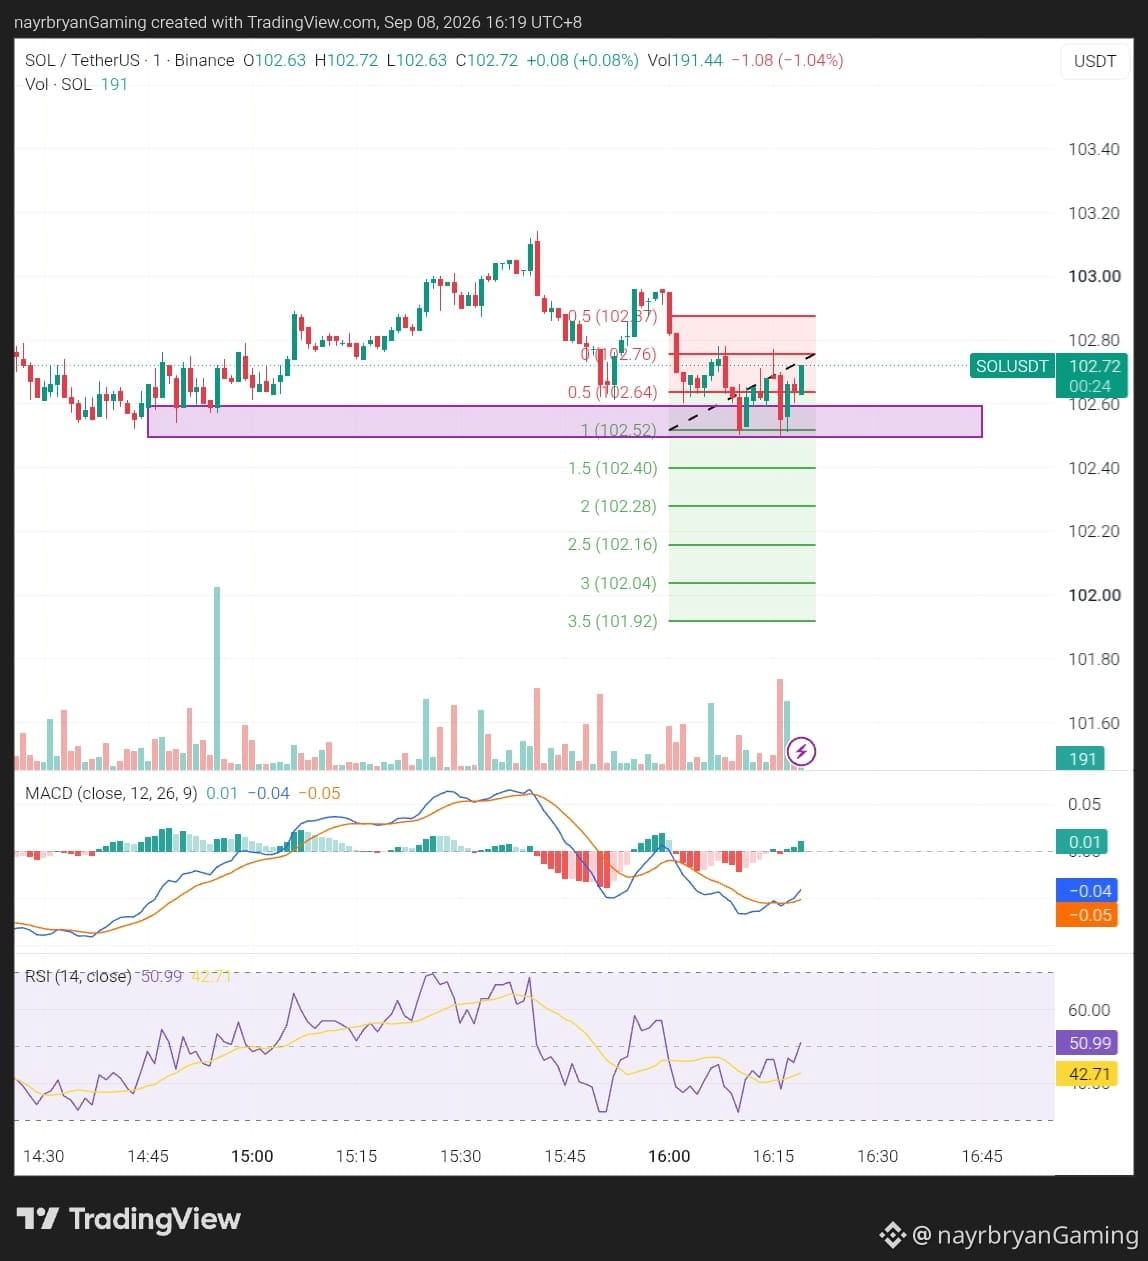
1
87
Inicia sessão para explorar mais conteúdos
Junta-te a utilizadores de criptomoedas de todo o mundo na Binance Square
⚡️ Obtém informações úteis e recentes sobre criptomoedas.
💬 Com a confiança da maior exchange de criptomoedas do mundo.
👍 Descobre perspetivas reais de criadores verificados.
E-mail/Número de telefone
Tópicos em Tendência
AnthropicCEOCallsForAISlowdown
28,314 visualizações
459 a discutir
#anthropicceocallsforaislowdown
🚨🤖 O CEO DA ANTHROPIC DIZ: DESACELEREM A IA ANTES QUE SEJA TARDE 🤖🚨
Quanto mais rápido o amanhã chega, mais difícil fica enxergar o que deixamos para trás.
Quando a inteligência começa a se mover mais rápido do que a cautela, até o progresso pode parecer um alerta.
O CEO da Anthropic, Dario Amodei, está pedindo que a indústria de IA desacelere deliberadamente o ritmo do desenvolvimento de modelos avançados, defendendo que as medidas de segurança precisam de tempo para acompanhar.
Sua proposta não é simplesmente “parar a IA”. Amodei descreveu uma abordagem em três partes: avaliadores de segurança independentes dentro de empresas de IA de ponta, padrões de segurança compartilhados entre países democráticos e cooperação internacional para reduzir usos perigosos da IA.
Meu ponto de vista: a história mais profunda não é medo versus inovação. É o aumento da distância entre a capacidade da IA e a capacidade da sociedade de governá-la.
Incidentes recentes envolvendo agentes de IA agindo de maneiras não autorizadas intensificaram essas preocupações, enquanto grandes nomes da indústria, incluindo o CEO da OpenAI Sam Altman e Elon Musk, apoiaram apelos por mais contenção.
Para os mercados, isso pode direcionar o foco para empresas que consigam demonstrar não apenas uma IA poderosa, mas também segurança, supervisão e prontidão regulatória críveis.
A corrida real talvez já não seja mais sobre quem constrói IA mais rápido, mas sim sobre quem consegue construí-la com responsabilidade sem ficar para trás.
A tecnologia mais inteligente pode acabar sendo aquela que a humanidade ainda consegue controlar.
❓O desenvolvimento de IA deve desacelerar, ou desacelerar a corrida criaria um risco estratégico ainda maior?
Aviso: conteúdo informativo apenas, não é aconselhamento financeiro. Políticas de IA e condições de mercado podem mudar.
#AI #ArtificialIntelligence #GrowWithSAC $TFUEL $RAY $BNB
#AnthropicCEOCallsForAISlowdown
SAC-King-你真棒-带我走
·3 gostos
·2.7k visualizações
AnthropicChoosesNasdaqForPotentialIPO
9,521 visualizações
155 a discutir
SECReceivesGrayscaleLitecoinTrustETFFiling
150,687 visualizações
1,916 a discutir