

Mughal007
3 Publicações

Mughal007
Denunciar
Bloquear Utilizador
Aberto ao trading
Trader Ocasional
3 ano(s)
1 A seguir
4 Seguidores
0 Gostaram
Publicações
Portfólio
·
--
Ver tradução
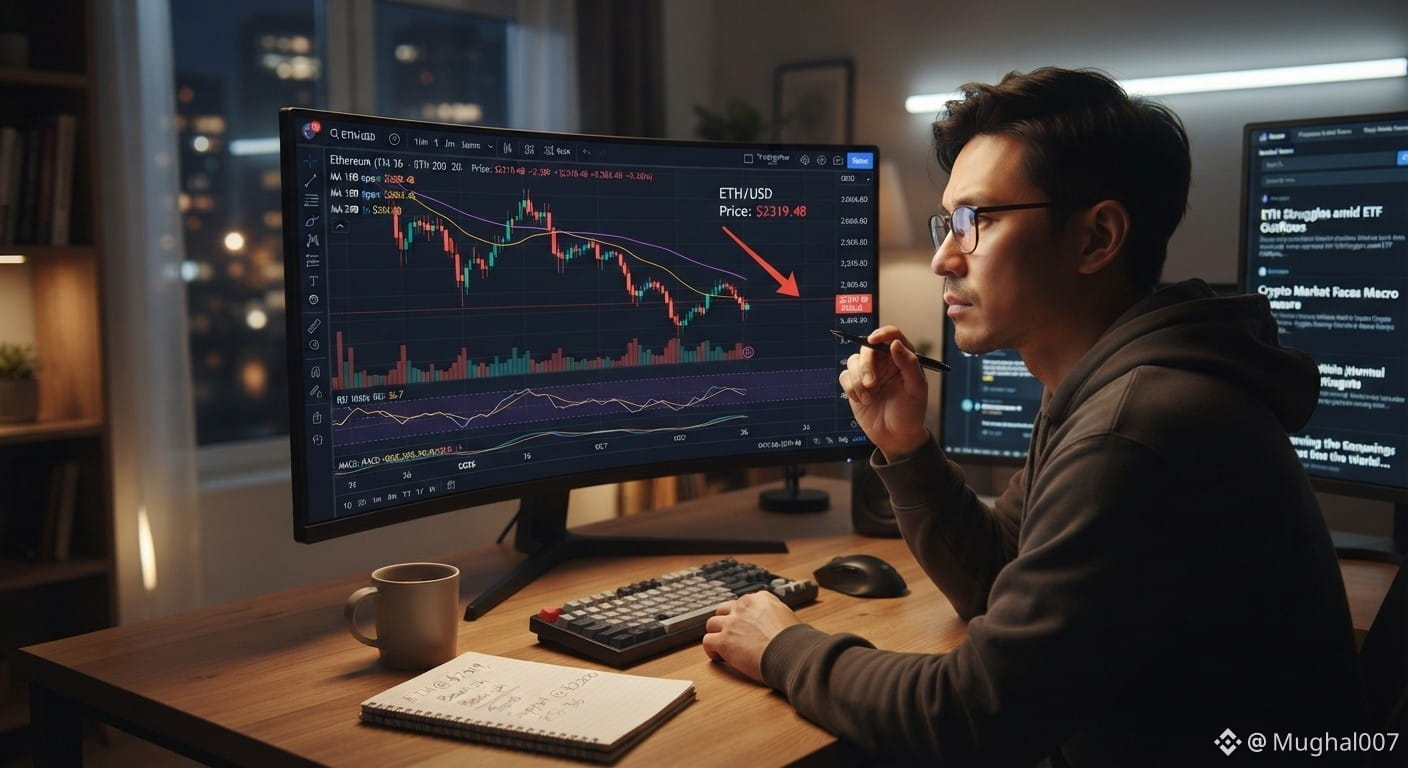
$ETH Honestly, ETH has been looking pretty rough this month. After trying to push up near that $2,800 resistance a while back, the bulls just couldn't keep the momentum going. Right now, it's sliding down around the $2,310 to $2,330 range, losing about 11-12% over the course of October.
If you're watching the charts, a few things stand out:
The Support Test: Price is currently sitting right around the $2,300 mark. This is a pretty crucial spot. If this level breaks, we could easily see it slide down to test the psychological $2,000 zone.
The Indicators: The RSI is sitting in the mid-30s—getting close to oversold territory, which usually means we might see a small relief bounce soon, but the overall trend is still heavy. The sell volume in the futures market has been pretty dominant, too.
The Vibe: Institutional inflows just haven't been strong enough lately to rescue the price, and the broader macro market has been spooked.
Basically, it’s a waiting game right now. ETH really needs to reclaim $2,400+ and hold it before anyone can seriously talk about a trend reversal.
What kind of setup are you looking at right now—are you trying to find a spot to accumulate, or just watching the Binance charts closely to see where it bottoms out? @Ethereum_official
{spot}(ETHUSDT)
#Ethereum
$ETH Honestly, ETH has been looking pretty rough this month. After trying to push up near that $2,800 resistance a while back, the bulls just couldn't keep the momentum going. Right now, it's sliding down around the $2,310 to $2,330 range, losing about 11-12% over the course of October.
If you're watching the charts, a few things stand out:
The Support Test: Price is currently sitting right around the $2,300 mark. This is a pretty crucial spot. If this level breaks, we could easily see it slide down to test the psychological $2,000 zone.
The Indicators: The RSI is sitting in the mid-30s—getting close to oversold territory, which usually means we might see a small relief bounce soon, but the overall trend is still heavy. The sell volume in the futures market has been pretty dominant, too.
The Vibe: Institutional inflows just haven't been strong enough lately to rescue the price, and the broader macro market has been spooked.
Basically, it’s a waiting game right now. ETH really needs to reclaim $2,400+ and hold it before anyone can seriously talk about a trend reversal.
What kind of setup are you looking at right now—are you trying to find a spot to accumulate, or just watching the Binance charts closely to see where it bottoms out? @Ethereum
#Ethereum
135
·
--
Artigo
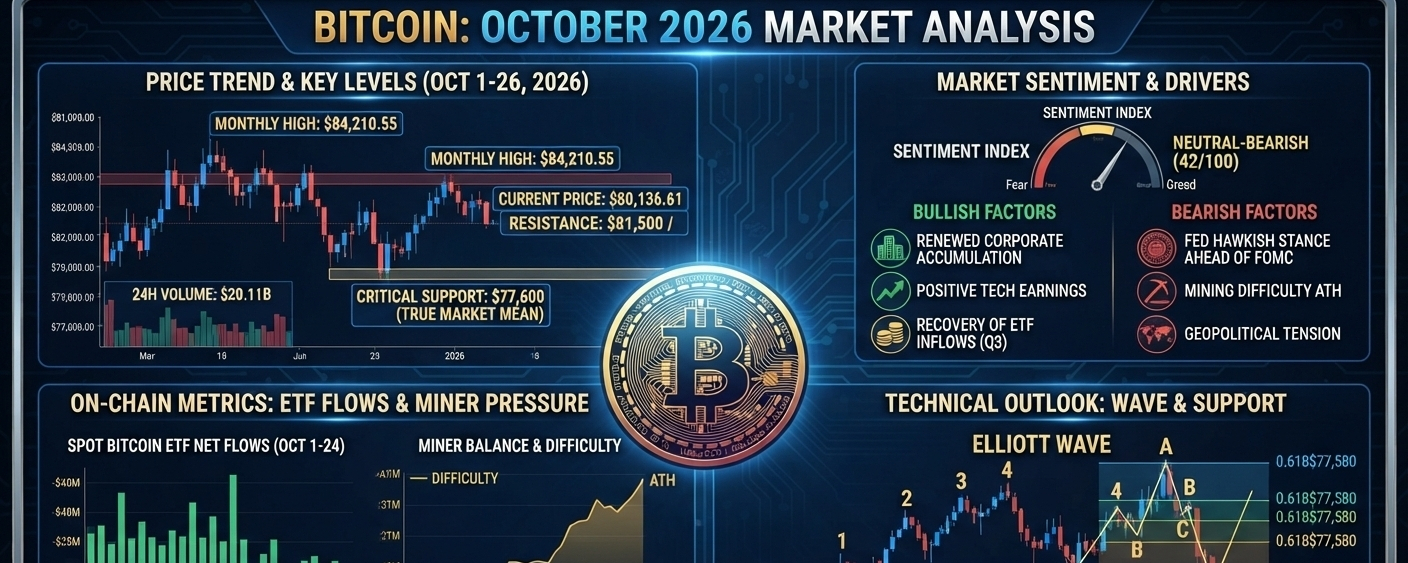
Análise do Bitcoin — outubro de 2026$BTC Análise de mercado do (BTC) – outubro de 2026
O Bitcoin ($BTC) apresentou uma volatilidade significativa em outubro de 2026, caindo para a região dos US$ 77.600 antes de tentar se estabilizar em torno da marca de US$ 80.100. A fase atual do mercado representa um período crítico de consolidação, enquanto o ativo enfrenta ventos contrários macroeconômicos e mudanças fundamentais on-chain.
Veja uma análise detalhada dos fatores técnicos, fundamentais e de sentimento que estão moldando atualmente a movimentação do preço do Bitcoin:
1. Movimentação dos preços e níveis-chave
Análise do Bitcoin — outubro de 2026
$BTC Análise de mercado do (BTC) – outubro de 2026
O Bitcoin ($BTC ) apresentou uma volatilidade significativa em outubro de 2026, caindo para a região dos US$ 77.600 antes de tentar se estabilizar em torno da marca de US$ 80.100. A fase atual do mercado representa um período crítico de consolidação, enquanto o ativo enfrenta ventos contrários macroeconômicos e mudanças fundamentais on-chain.
Veja uma análise detalhada dos fatores técnicos, fundamentais e de sentimento que estão moldando atualmente a movimentação do preço do Bitcoin:
1. Movimentação dos preços e níveis-chave
73
·
--
#EarnFreeCrypto2024
Acho que devemos nos acalmar durante os tempos financeiros ruins para que possamos criar bons momentos para nós.
#EarnFreeCrypto2024
Acho que devemos nos acalmar durante os tempos financeiros ruins para que possamos criar bons momentos para nós.
Acho que devemos nos acalmar durante os tempos financeiros ruins para que possamos criar bons momentos para nós.
1
138
Inicia sessão para explorar mais conteúdos
Junta-te a utilizadores de criptomoedas de todo o mundo na Binance Square
⚡️ Obtém informações úteis e recentes sobre criptomoedas.
💬 Com a confiança da maior exchange de criptomoedas do mundo.
👍 Descobre perspetivas reais de criadores verificados.
E-mail/Número de telefone
Tópicos em Tendência
BinancePick
3.1M visualizações
153,244 a discutir
Participe da #TemporadaDeResultados: preveja resultados no Binance Pick e compartilhe sua opinião no Binance Square!
Binance Square Official
·413 gostos
·343.4k visualizações
EarningsSeason
5.3M visualizações
26,054 a discutir
AnthropicTTMRevenueGrewAbout1200%
35,426 visualizações
442 a discutir