

TheChartQueen
4.2k Publicações

TheChartQueen
Denunciar
Bloquear Utilizador
Trading raw data so you don't have to 📊 A girl, her charts & daily setups. Tips are never expected, but they fuel my 3AM analysis!
Trader de Alta Frequência
5 ano(s)
12 A seguir
563 Seguidores
737 Gostaram
Publicações
Tudo
Cotações
Ver tradução
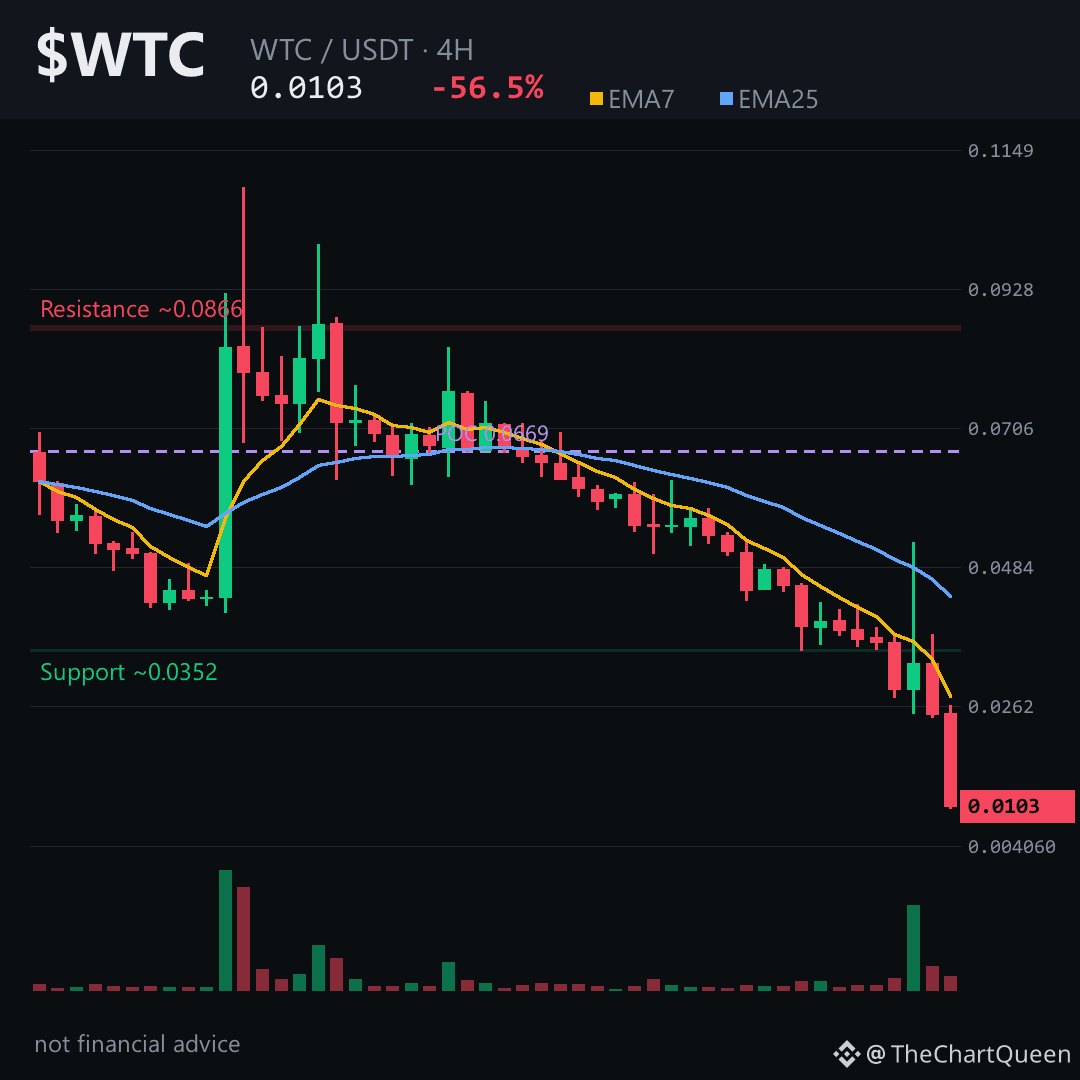
-56.54%.
That’s not a dip. That’s a structural break.
$WTC just printed its lowest 4-hour close on record — trading below every historical anchor. The daily shows an unfilled bearish gap overhead around 0.054–0.058. That’s not resistance. That’s a ceiling.
RSI on the 4H is pinned near 20. Oversold doesn’t mean bounce — it means the trend is still dictating. EMA7 is nearly half of EMA25. Price can’t even touch the short-term average. That’s sustained distribution, not a flush.
The key level on the 4H is ~0.0108. As long as $WTC stays below that, the path points toward 0.0094 — a level that was never support, just the next void. A 4H close back above 0.0108 and the read shifts. Until then, the chart is still falling through empty space.
My read: bounce attempts are getting shallower and sold faster. That’s not a base forming — that’s a market still looking for where value actually lives. Tap $WTC to pull up the chart and check the 4H structure yourself.
Follow me — if this floor finally holds, I’ll map where the next real level sits.
What’s the one level you’re watching on WTC right now 👇
⚠️ Not financial advice. DYOR.
#WTC #Crypto #BinanceSquare #Altcoins
-56.54%.
That’s not a dip. That’s a structural break.
$WTC just printed its lowest 4-hour close on record — trading below every historical anchor. The daily shows an unfilled bearish gap overhead around 0.054–0.058. That’s not resistance. That’s a ceiling.
RSI on the 4H is pinned near 20. Oversold doesn’t mean bounce — it means the trend is still dictating. EMA7 is nearly half of EMA25. Price can’t even touch the short-term average. That’s sustained distribution, not a flush.
The key level on the 4H is ~0.0108. As long as $WTC stays below that, the path points toward 0.0094 — a level that was never support, just the next void. A 4H close back above 0.0108 and the read shifts. Until then, the chart is still falling through empty space.
My read: bounce attempts are getting shallower and sold faster. That’s not a base forming — that’s a market still looking for where value actually lives. Tap $WTC to pull up the chart and check the 4H structure yourself.
Follow me — if this floor finally holds, I’ll map where the next real level sits.
What’s the one level you’re watching on WTC right now 👇
⚠️ Not financial advice. DYOR.
#WTC #Crypto #BinanceSquare #Altcoins
That’s not a dip. That’s a structural break.
$WTC just printed its lowest 4-hour close on record — trading below every historical anchor. The daily shows an unfilled bearish gap overhead around 0.054–0.058. That’s not resistance. That’s a ceiling.
RSI on the 4H is pinned near 20. Oversold doesn’t mean bounce — it means the trend is still dictating. EMA7 is nearly half of EMA25. Price can’t even touch the short-term average. That’s sustained distribution, not a flush.
The key level on the 4H is ~0.0108. As long as $WTC stays below that, the path points toward 0.0094 — a level that was never support, just the next void. A 4H close back above 0.0108 and the read shifts. Until then, the chart is still falling through empty space.
My read: bounce attempts are getting shallower and sold faster. That’s not a base forming — that’s a market still looking for where value actually lives. Tap $WTC to pull up the chart and check the 4H structure yourself.
Follow me — if this floor finally holds, I’ll map where the next real level sits.
What’s the one level you’re watching on WTC right now 👇
⚠️ Not financial advice. DYOR.
#WTC #Crypto #BinanceSquare #Altcoins
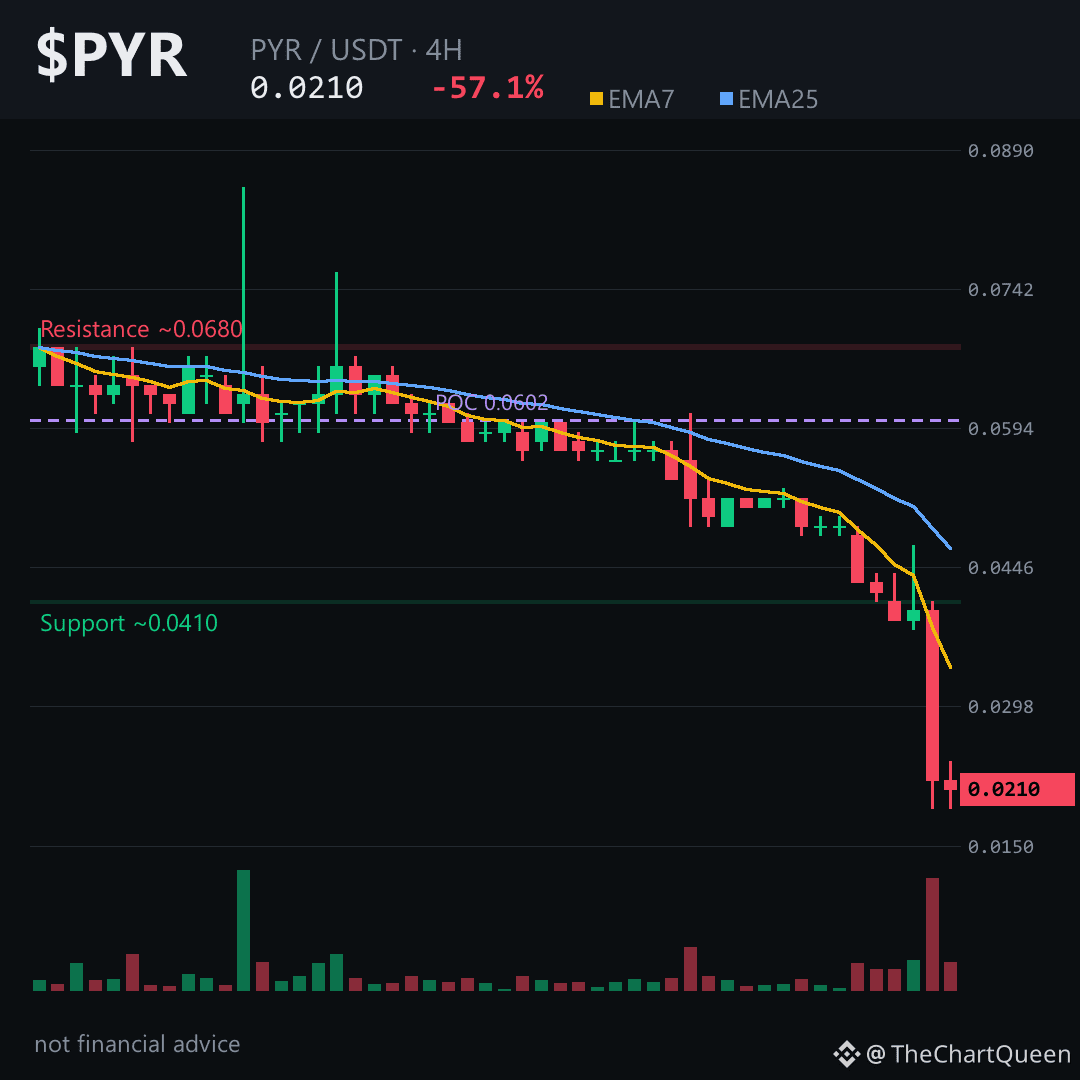
O que parece um desconto geralmente acaba sendo uma faca caindo — então por que o PYR caiu 57% em um único dia?
Aqui vai a análise, sem rodeios.
No gráfico de 4 horas do $PYR: quase não há impulso. O RSI está bem abaixo de 10 — pressão vendedora extrema. Mas esse tipo de exaustão geralmente indica apenas uma pausa, não uma reversão de verdade. O filtro de tendência continua apontando fortemente para baixo.
A única faixa que importa agora é o gap não preenchido entre aproximadamente 0.044 e 0.048. Até que essa área seja recuperada, qualquer repique provavelmente será vendido.
A região atual, perto de 0.021, é o ponto decisivo. Se os compradores não conseguirem sustentar essa zona, o próximo destino natural é a região de 0.019. A leitura só muda se o $PYR conseguir subir acima da região de 0.022 e se manter lá — caso contrário, o caminho de menor resistência continua sendo para baixo.
Minha leitura: a estrutura está rompida, mas ainda não temos um fundo. O verdadeiro risco é perseguir um repique sem suporte confirmado.
Vou compartilhar uma atualização se essa zona começar a atrair demanda de verdade — siga-me para acompanhar.
Qual nível do $PYR você está observando mais de perto? 👇
⚠️ Isto não é aconselhamento financeiro. Faça sua própria pesquisa.
#PYR #VulcanForged #Crypto #BinanceSquare
O que parece um desconto geralmente acaba sendo uma faca caindo — então por que o PYR caiu 57% em um único dia?
Aqui vai a análise, sem rodeios.
No gráfico de 4 horas do $PYR: quase não há impulso. O RSI está bem abaixo de 10 — pressão vendedora extrema. Mas esse tipo de exaustão geralmente indica apenas uma pausa, não uma reversão de verdade. O filtro de tendência continua apontando fortemente para baixo.
A única faixa que importa agora é o gap não preenchido entre aproximadamente 0.044 e 0.048. Até que essa área seja recuperada, qualquer repique provavelmente será vendido.
A região atual, perto de 0.021, é o ponto decisivo. Se os compradores não conseguirem sustentar essa zona, o próximo destino natural é a região de 0.019. A leitura só muda se o $PYR conseguir subir acima da região de 0.022 e se manter lá — caso contrário, o caminho de menor resistência continua sendo para baixo.
Minha leitura: a estrutura está rompida, mas ainda não temos um fundo. O verdadeiro risco é perseguir um repique sem suporte confirmado.
Vou compartilhar uma atualização se essa zona começar a atrair demanda de verdade — siga-me para acompanhar.
Qual nível do $PYR você está observando mais de perto? 👇
⚠️ Isto não é aconselhamento financeiro. Faça sua própria pesquisa.
#PYR #VulcanForged #Crypto #BinanceSquare
Aqui vai a análise, sem rodeios.
No gráfico de 4 horas do $PYR: quase não há impulso. O RSI está bem abaixo de 10 — pressão vendedora extrema. Mas esse tipo de exaustão geralmente indica apenas uma pausa, não uma reversão de verdade. O filtro de tendência continua apontando fortemente para baixo.
A única faixa que importa agora é o gap não preenchido entre aproximadamente 0.044 e 0.048. Até que essa área seja recuperada, qualquer repique provavelmente será vendido.
A região atual, perto de 0.021, é o ponto decisivo. Se os compradores não conseguirem sustentar essa zona, o próximo destino natural é a região de 0.019. A leitura só muda se o $PYR conseguir subir acima da região de 0.022 e se manter lá — caso contrário, o caminho de menor resistência continua sendo para baixo.
Minha leitura: a estrutura está rompida, mas ainda não temos um fundo. O verdadeiro risco é perseguir um repique sem suporte confirmado.
Vou compartilhar uma atualização se essa zona começar a atrair demanda de verdade — siga-me para acompanhar.
Qual nível do $PYR você está observando mais de perto? 👇
⚠️ Isto não é aconselhamento financeiro. Faça sua própria pesquisa.
#PYR #VulcanForged #Crypto #BinanceSquare
2
Ver tradução
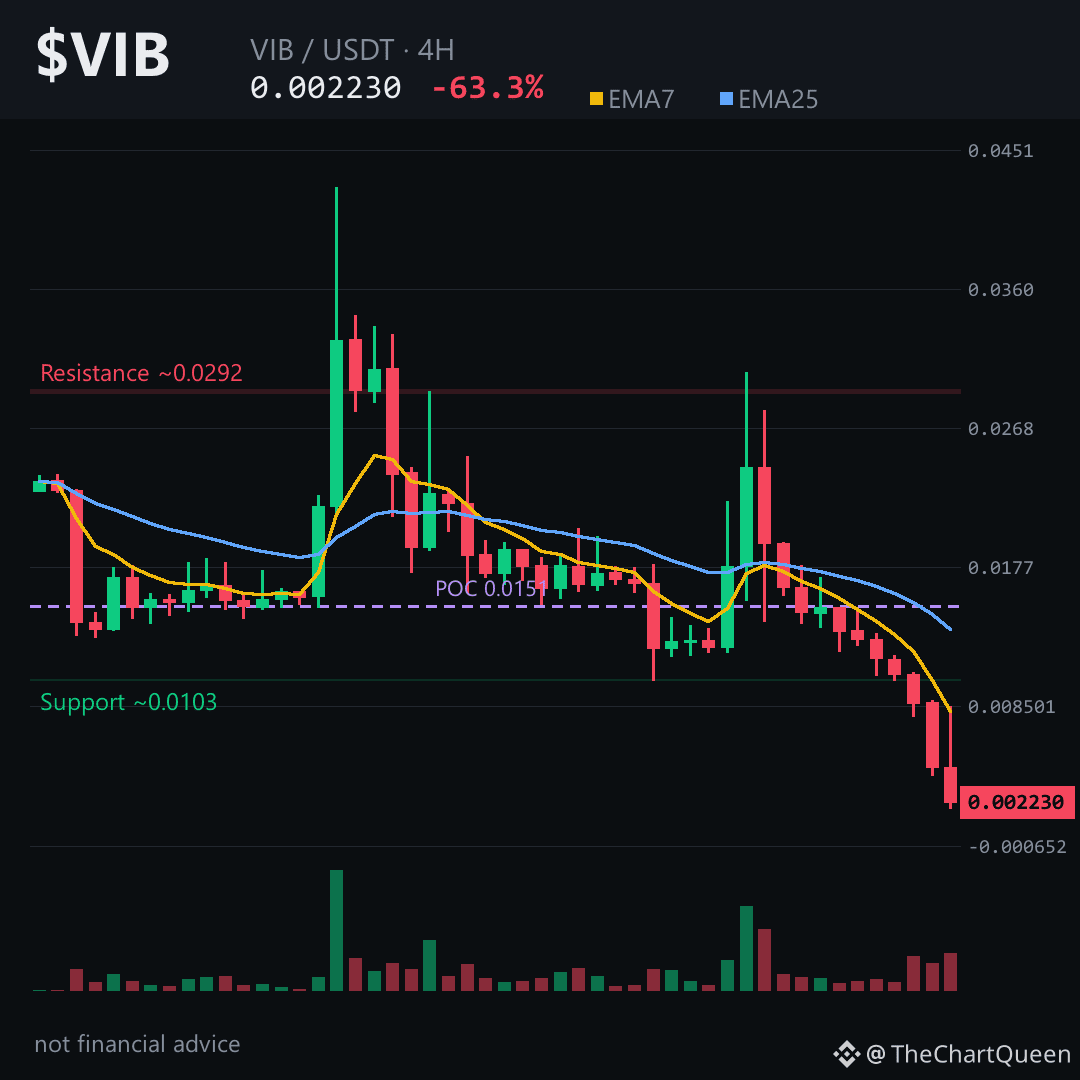
Everyone sees a -63% candle and thinks the bottom is in.
Flip it: the last two candles printed -49% and -50% — that’s not capitulation, that’s a falling knife still accelerating.
The 4H chart on $VIB is a straight vertical collapse. Two green candles out of twelve. RSI is buried near 28. Momentum isn’t weak — it’s broken.
There’s an unfilled bearish gap between roughly 0.0102 and 0.0089. Price knifed through it and never looked back. Gaps like that often act like a magnet if any bounce gets going — but right now, no bounce is even trying.
The level that matters: if $VIB can’t reclaim the 0.00235 area on a 4H close, the path of least resistance stays pointed toward the 0.00204 zone. Lose that shelf and there’s not much structural support until the 0.0018 area — the 24-hour low. Tap $VIB to pull up the chart and see how clean that breakdown is.
My read: this isn’t a dip to buy. It’s a liquidity vacuum — low volume, no futures open interest, and a chart pricing in abandonment, not reversal.
If this starts basing with a strong reclaim above 0.00235, I’ll revisit that bearish gap as the next magnet. Follow for that update — a real reversal here won’t be subtle.
What’s the one level you trust more on VIB right now — 0.00235 or 0.0018? 👇
⚠️ Not financial advice. DYOR.
#VIB #Crypto #MarketAnalysis #BinanceSquare
Everyone sees a -63% candle and thinks the bottom is in.
Flip it: the last two candles printed -49% and -50% — that’s not capitulation, that’s a falling knife still accelerating.
The 4H chart on $VIB is a straight vertical collapse. Two green candles out of twelve. RSI is buried near 28. Momentum isn’t weak — it’s broken.
There’s an unfilled bearish gap between roughly 0.0102 and 0.0089. Price knifed through it and never looked back. Gaps like that often act like a magnet if any bounce gets going — but right now, no bounce is even trying.
The level that matters: if $VIB can’t reclaim the 0.00235 area on a 4H close, the path of least resistance stays pointed toward the 0.00204 zone. Lose that shelf and there’s not much structural support until the 0.0018 area — the 24-hour low. Tap $VIB to pull up the chart and see how clean that breakdown is.
My read: this isn’t a dip to buy. It’s a liquidity vacuum — low volume, no futures open interest, and a chart pricing in abandonment, not reversal.
If this starts basing with a strong reclaim above 0.00235, I’ll revisit that bearish gap as the next magnet. Follow for that update — a real reversal here won’t be subtle.
What’s the one level you trust more on VIB right now — 0.00235 or 0.0018? 👇
⚠️ Not financial advice. DYOR.
#VIB #Crypto #MarketAnalysis #BinanceSquare
Flip it: the last two candles printed -49% and -50% — that’s not capitulation, that’s a falling knife still accelerating.
The 4H chart on $VIB is a straight vertical collapse. Two green candles out of twelve. RSI is buried near 28. Momentum isn’t weak — it’s broken.
There’s an unfilled bearish gap between roughly 0.0102 and 0.0089. Price knifed through it and never looked back. Gaps like that often act like a magnet if any bounce gets going — but right now, no bounce is even trying.
The level that matters: if $VIB can’t reclaim the 0.00235 area on a 4H close, the path of least resistance stays pointed toward the 0.00204 zone. Lose that shelf and there’s not much structural support until the 0.0018 area — the 24-hour low. Tap $VIB to pull up the chart and see how clean that breakdown is.
My read: this isn’t a dip to buy. It’s a liquidity vacuum — low volume, no futures open interest, and a chart pricing in abandonment, not reversal.
If this starts basing with a strong reclaim above 0.00235, I’ll revisit that bearish gap as the next magnet. Follow for that update — a real reversal here won’t be subtle.
What’s the one level you trust more on VIB right now — 0.00235 or 0.0018? 👇
⚠️ Not financial advice. DYOR.
#VIB #Crypto #MarketAnalysis #BinanceSquare
2
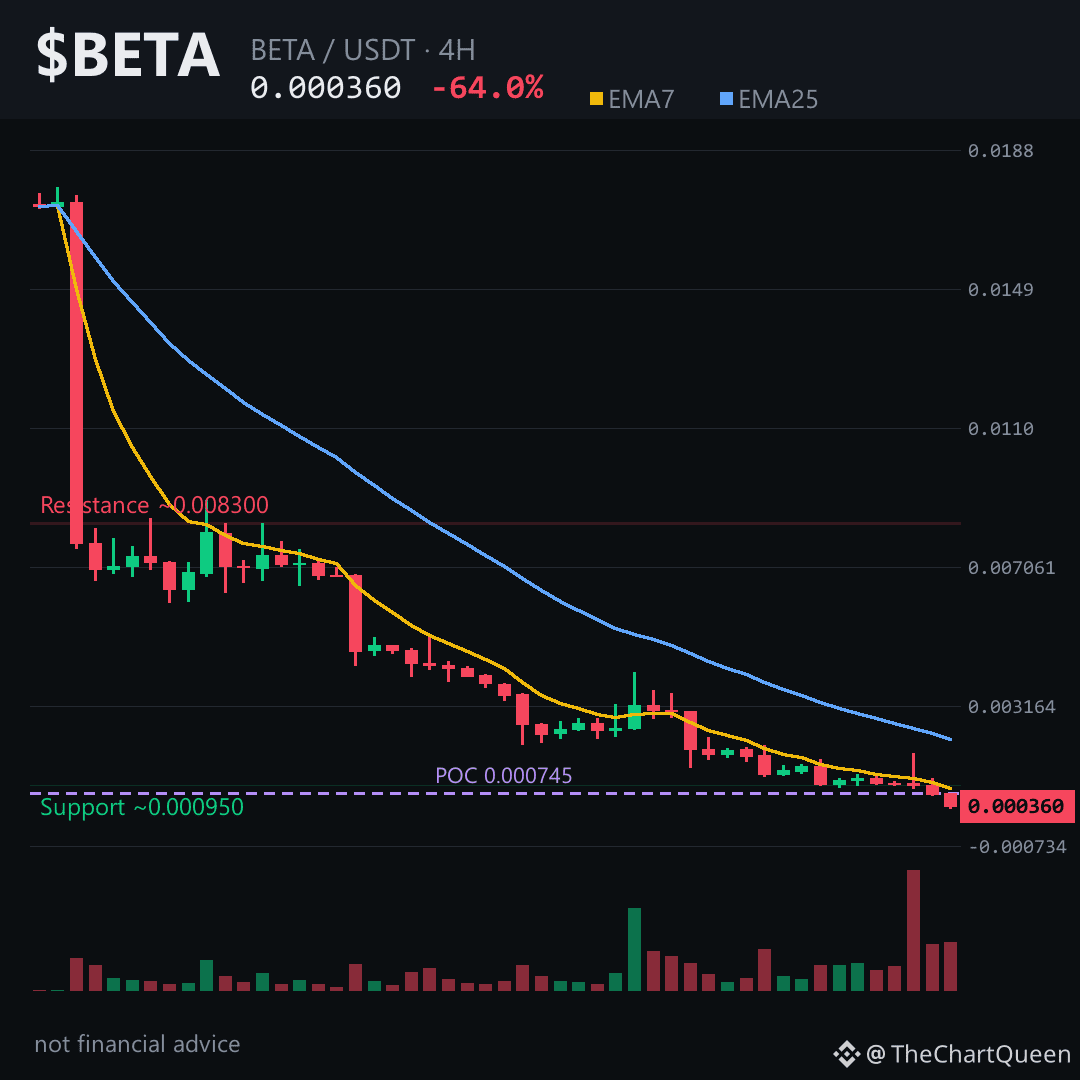
Uma queda de 64% em um único dia. A verdadeira pergunta não é «está caindo?» — é «até onde uma moeda sem mercado de futuros pode realmente cair?»
Sem taxa de financiamento, sem contratos em aberto. Sem posições compradas alavancadas para liquidar, sem combustível para um short squeeze. Apenas vendas no mercado à vista — e as quedas limitadas ao mercado à vista costumam se arrastar mais devagar, mas por mais tempo.
Gráfico de 4 horas: preço perto de 0.00036, depois de atravessar todos os suportes próximos. O ponto de controle do perfil de volume está bem acima, em 0.000745. Quase todos que compraram nos últimos dois dias estão no prejuízo. Não há nenhum ímã natural puxando o preço de volta para cima.
Gap de baixa acima: 0.0023–0.0029. Até que essa faixa seja revisitada, o caminho de menor resistência continua sendo para baixo.
Se $BETA não conseguir recuperar 0.00038 no fechamento de 4 horas, o próximo alvo é a faixa baixa dos 0.00033, seguida pela zona de 0.00031 (mínima de 24 horas). Perder esse piso com volume abre caminho para novas mínimas.
Minha leitura: uma faca em queda, sem rede de segurança. Não há padrão de pavio de capitulação + squeeze por aqui. Oferta bruta encontrando demanda escassa — isso raramente reverte sem antes formar uma base longa e entediante.
Vou observar se o preço se mantém acima de 0.00031 até o próximo fechamento diário — primeiro sinal de um piso, não de uma recuperação. Acompanhe e vou atualizar quando a estrutura mudar. Qual nível você está observando em $BETA agora? 👇
⚠️ Isto não é aconselhamento financeiro. Faça sua própria pesquisa.
#BETA #Crypto #BinanceSquare #Altcoins #MarketAnalysis
Uma queda de 64% em um único dia. A verdadeira pergunta não é «está caindo?» — é «até onde uma moeda sem mercado de futuros pode realmente cair?»
Sem taxa de financiamento, sem contratos em aberto. Sem posições compradas alavancadas para liquidar, sem combustível para um short squeeze. Apenas vendas no mercado à vista — e as quedas limitadas ao mercado à vista costumam se arrastar mais devagar, mas por mais tempo.
Gráfico de 4 horas: preço perto de 0.00036, depois de atravessar todos os suportes próximos. O ponto de controle do perfil de volume está bem acima, em 0.000745. Quase todos que compraram nos últimos dois dias estão no prejuízo. Não há nenhum ímã natural puxando o preço de volta para cima.
Gap de baixa acima: 0.0023–0.0029. Até que essa faixa seja revisitada, o caminho de menor resistência continua sendo para baixo.
Se $BETA não conseguir recuperar 0.00038 no fechamento de 4 horas, o próximo alvo é a faixa baixa dos 0.00033, seguida pela zona de 0.00031 (mínima de 24 horas). Perder esse piso com volume abre caminho para novas mínimas.
Minha leitura: uma faca em queda, sem rede de segurança. Não há padrão de pavio de capitulação + squeeze por aqui. Oferta bruta encontrando demanda escassa — isso raramente reverte sem antes formar uma base longa e entediante.
Vou observar se o preço se mantém acima de 0.00031 até o próximo fechamento diário — primeiro sinal de um piso, não de uma recuperação. Acompanhe e vou atualizar quando a estrutura mudar. Qual nível você está observando em $BETA agora? 👇
⚠️ Isto não é aconselhamento financeiro. Faça sua própria pesquisa.
#BETA #Crypto #BinanceSquare #Altcoins #MarketAnalysis
Sem taxa de financiamento, sem contratos em aberto. Sem posições compradas alavancadas para liquidar, sem combustível para um short squeeze. Apenas vendas no mercado à vista — e as quedas limitadas ao mercado à vista costumam se arrastar mais devagar, mas por mais tempo.
Gráfico de 4 horas: preço perto de 0.00036, depois de atravessar todos os suportes próximos. O ponto de controle do perfil de volume está bem acima, em 0.000745. Quase todos que compraram nos últimos dois dias estão no prejuízo. Não há nenhum ímã natural puxando o preço de volta para cima.
Gap de baixa acima: 0.0023–0.0029. Até que essa faixa seja revisitada, o caminho de menor resistência continua sendo para baixo.
Se $BETA não conseguir recuperar 0.00038 no fechamento de 4 horas, o próximo alvo é a faixa baixa dos 0.00033, seguida pela zona de 0.00031 (mínima de 24 horas). Perder esse piso com volume abre caminho para novas mínimas.
Minha leitura: uma faca em queda, sem rede de segurança. Não há padrão de pavio de capitulação + squeeze por aqui. Oferta bruta encontrando demanda escassa — isso raramente reverte sem antes formar uma base longa e entediante.
Vou observar se o preço se mantém acima de 0.00031 até o próximo fechamento diário — primeiro sinal de um piso, não de uma recuperação. Acompanhe e vou atualizar quando a estrutura mudar. Qual nível você está observando em $BETA agora? 👇
⚠️ Isto não é aconselhamento financeiro. Faça sua própria pesquisa.
#BETA #Crypto #BinanceSquare #Altcoins #MarketAnalysis
Ver tradução
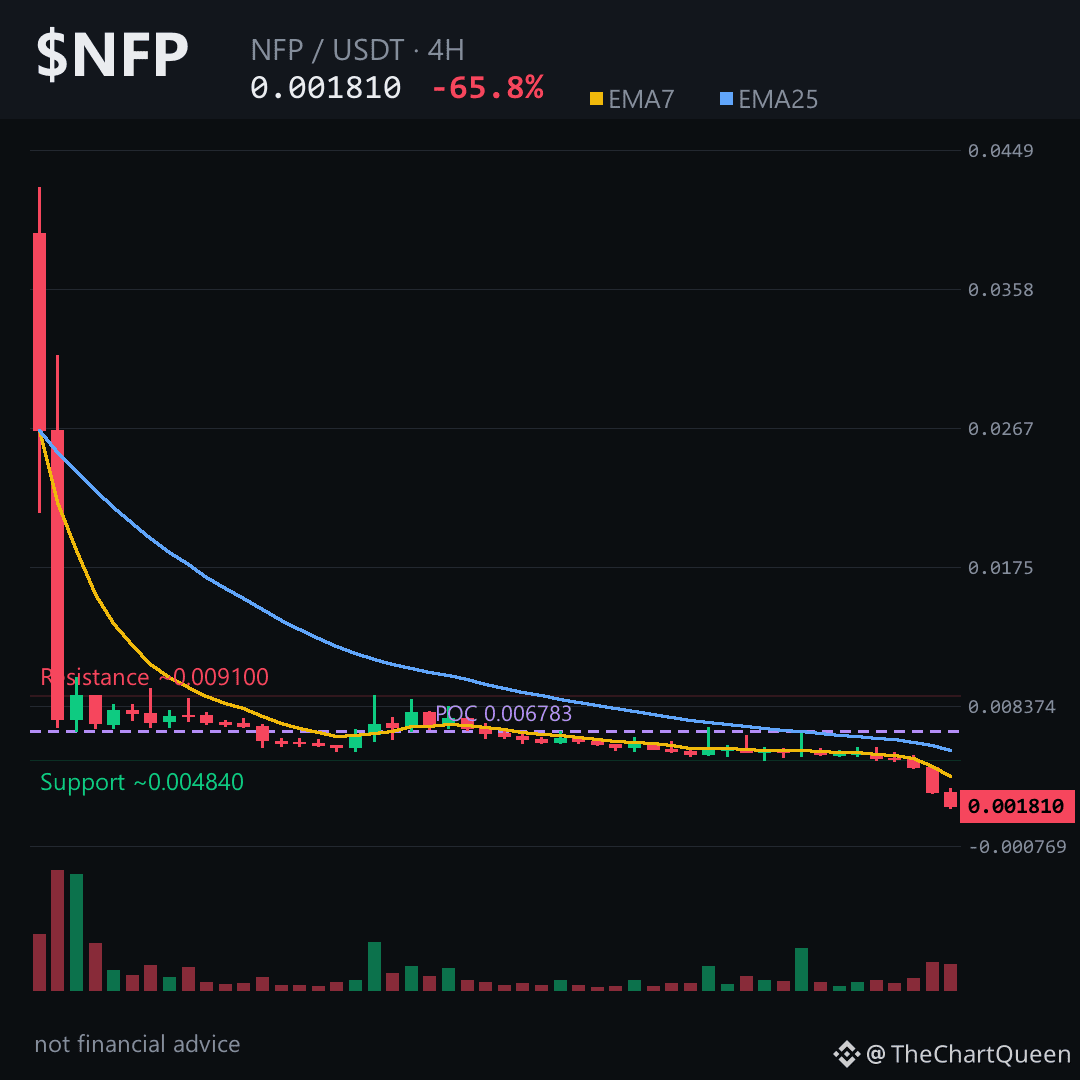
-65.85% in 24 hours isn't a dip — it's a liquidation cascade. And the 4H chart is throwing off a signal so extreme it almost looks broken: RSI at 12.89, with price now sitting inside a fresh bearish gap between the 0.00479 and 0.00445 area.
$NFP didn't just slide — it collapsed in two 4H candles that erased ~60% of its value in eight hours. EMA7 is buried under EMA25 on every timeframe. Funding is flat and open interest is nonexistent — no one's left to defend a bounce. That's not bullish. That's apathy.
Price is clinging just above the 0.00168 low from that violent overnight flush. The invalidation sits around 0.00191 — if $NFP reclaims that zone on a 4H close, the freefall pauses. Until then, the path of least resistance points toward 0.00165, and below that, the chart gets very quiet. Tap $NFP to pull up the chart and read these levels yourself.
Bounce attempts here are relief, not reversal. The real risk is trying to catch a falling knife when there's no volume behind the bids.
I'll be watching whether that 0.00191 ceiling gets tested or rejected cold — follow if you want the read when it happens. What level are you watching on NFP right now? 👇
⚠️ Not financial advice. DYOR.
#NFP #Crypto #BinanceSquare
-65.85% in 24 hours isn't a dip — it's a liquidation cascade. And the 4H chart is throwing off a signal so extreme it almost looks broken: RSI at 12.89, with price now sitting inside a fresh bearish gap between the 0.00479 and 0.00445 area.
$NFP didn't just slide — it collapsed in two 4H candles that erased ~60% of its value in eight hours. EMA7 is buried under EMA25 on every timeframe. Funding is flat and open interest is nonexistent — no one's left to defend a bounce. That's not bullish. That's apathy.
Price is clinging just above the 0.00168 low from that violent overnight flush. The invalidation sits around 0.00191 — if $NFP reclaims that zone on a 4H close, the freefall pauses. Until then, the path of least resistance points toward 0.00165, and below that, the chart gets very quiet. Tap $NFP to pull up the chart and read these levels yourself.
Bounce attempts here are relief, not reversal. The real risk is trying to catch a falling knife when there's no volume behind the bids.
I'll be watching whether that 0.00191 ceiling gets tested or rejected cold — follow if you want the read when it happens. What level are you watching on NFP right now? 👇
⚠️ Not financial advice. DYOR.
#NFP #Crypto #BinanceSquare
$NFP didn't just slide — it collapsed in two 4H candles that erased ~60% of its value in eight hours. EMA7 is buried under EMA25 on every timeframe. Funding is flat and open interest is nonexistent — no one's left to defend a bounce. That's not bullish. That's apathy.
Price is clinging just above the 0.00168 low from that violent overnight flush. The invalidation sits around 0.00191 — if $NFP reclaims that zone on a 4H close, the freefall pauses. Until then, the path of least resistance points toward 0.00165, and below that, the chart gets very quiet. Tap $NFP to pull up the chart and read these levels yourself.
Bounce attempts here are relief, not reversal. The real risk is trying to catch a falling knife when there's no volume behind the bids.
I'll be watching whether that 0.00191 ceiling gets tested or rejected cold — follow if you want the read when it happens. What level are you watching on NFP right now? 👇
⚠️ Not financial advice. DYOR.
#NFP #Crypto #BinanceSquare
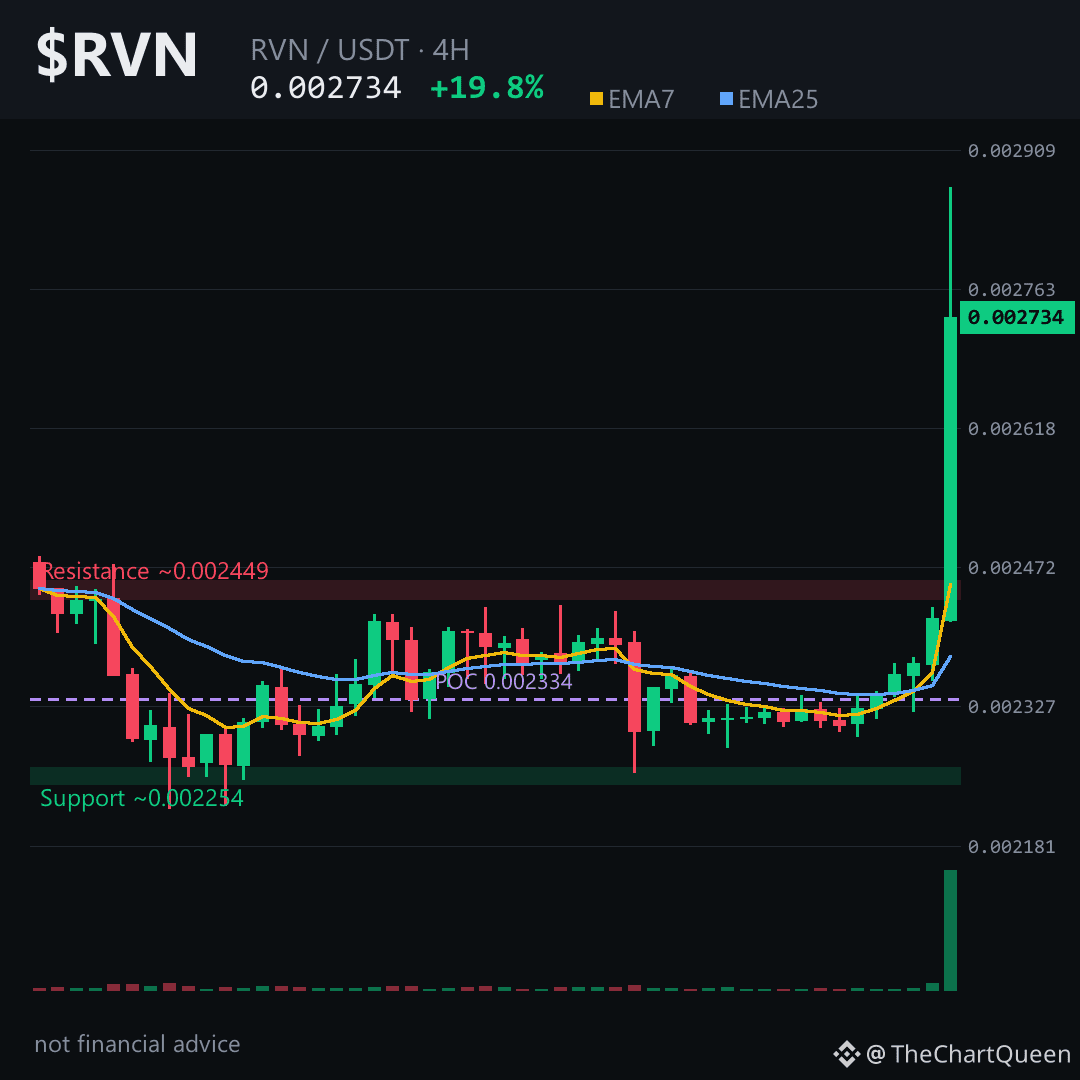
“+19% num dia — mas será que a verdadeira história está escondida nos dados dos futuros?”
$RVN acabou de registar a maior vela de 4H de toda esta sequência — um monstro de +13% que triplicou a amplitude anterior numa única vela. Isto não é momentum normal. É uma faísca.
Eis a tensão. O RSI está perto de 83 — sobreaquecido, um nível de calor que normalmente precisa de arrefecer. Mas os futuros estão a sussurrar algo diferente. O funding está profundamente negativo; os shorts estão a pagar aos longs só para se manterem em posição. O interesse em aberto é enorme. O rácio long/short está acima de 1,6. Esta combinação costuma sinalizar um mercado excessivamente alavancado numa direção e vulnerável a uma inversão brusca.
O nível mais importante para $RVN neste momento é ~0.00261. Essa é a zona de invalidação no gráfico de 4H — se o preço fechar novamente abaixo dela, é provável que a história do momentum de alta tenha terminado neste movimento. Acima dela, o caminho continua aberto até ~0.00300, que coincide quase na perfeição com o objetivo do swing de 1D. Toca em $RVN para abrir o gráfico e acompanhar essa faixa entre 0.00261 e 0.00300.
A minha leitura: isto é uma explosão de momentum dentro de uma tendência descendente mais ampla. O verdadeiro risco é entrar demasiado tarde. O gráfico de 4H diz “sobreaquecido”, o diário diz “ainda não confirmado” e o semanal continua pesado. Sê paciente, não corajoso.
Vou acompanhar se esse suporte em 0.00261 aguenta ou cede — segue-me para acompanhares a análise quando for importante.
Que zona estás a acompanhar mais de perto no RVN — o suporte que salva a recuperação ou a resistência que a limita? 👇
⚠️ Isto não é aconselhamento financeiro. Faz a tua própria pesquisa.
#RVN #Ravencoin #Crypto #BinanceSquare
“+19% num dia — mas será que a verdadeira história está escondida nos dados dos futuros?”
$RVN acabou de registar a maior vela de 4H de toda esta sequência — um monstro de +13% que triplicou a amplitude anterior numa única vela. Isto não é momentum normal. É uma faísca.
Eis a tensão. O RSI está perto de 83 — sobreaquecido, um nível de calor que normalmente precisa de arrefecer. Mas os futuros estão a sussurrar algo diferente. O funding está profundamente negativo; os shorts estão a pagar aos longs só para se manterem em posição. O interesse em aberto é enorme. O rácio long/short está acima de 1,6. Esta combinação costuma sinalizar um mercado excessivamente alavancado numa direção e vulnerável a uma inversão brusca.
O nível mais importante para $RVN neste momento é ~0.00261. Essa é a zona de invalidação no gráfico de 4H — se o preço fechar novamente abaixo dela, é provável que a história do momentum de alta tenha terminado neste movimento. Acima dela, o caminho continua aberto até ~0.00300, que coincide quase na perfeição com o objetivo do swing de 1D. Toca em $RVN para abrir o gráfico e acompanhar essa faixa entre 0.00261 e 0.00300.
A minha leitura: isto é uma explosão de momentum dentro de uma tendência descendente mais ampla. O verdadeiro risco é entrar demasiado tarde. O gráfico de 4H diz “sobreaquecido”, o diário diz “ainda não confirmado” e o semanal continua pesado. Sê paciente, não corajoso.
Vou acompanhar se esse suporte em 0.00261 aguenta ou cede — segue-me para acompanhares a análise quando for importante.
Que zona estás a acompanhar mais de perto no RVN — o suporte que salva a recuperação ou a resistência que a limita? 👇
⚠️ Isto não é aconselhamento financeiro. Faz a tua própria pesquisa.
#RVN #Ravencoin #Crypto #BinanceSquare
$RVN acabou de registar a maior vela de 4H de toda esta sequência — um monstro de +13% que triplicou a amplitude anterior numa única vela. Isto não é momentum normal. É uma faísca.
Eis a tensão. O RSI está perto de 83 — sobreaquecido, um nível de calor que normalmente precisa de arrefecer. Mas os futuros estão a sussurrar algo diferente. O funding está profundamente negativo; os shorts estão a pagar aos longs só para se manterem em posição. O interesse em aberto é enorme. O rácio long/short está acima de 1,6. Esta combinação costuma sinalizar um mercado excessivamente alavancado numa direção e vulnerável a uma inversão brusca.
O nível mais importante para $RVN neste momento é ~0.00261. Essa é a zona de invalidação no gráfico de 4H — se o preço fechar novamente abaixo dela, é provável que a história do momentum de alta tenha terminado neste movimento. Acima dela, o caminho continua aberto até ~0.00300, que coincide quase na perfeição com o objetivo do swing de 1D. Toca em $RVN para abrir o gráfico e acompanhar essa faixa entre 0.00261 e 0.00300.
A minha leitura: isto é uma explosão de momentum dentro de uma tendência descendente mais ampla. O verdadeiro risco é entrar demasiado tarde. O gráfico de 4H diz “sobreaquecido”, o diário diz “ainda não confirmado” e o semanal continua pesado. Sê paciente, não corajoso.
Vou acompanhar se esse suporte em 0.00261 aguenta ou cede — segue-me para acompanhares a análise quando for importante.
Que zona estás a acompanhar mais de perto no RVN — o suporte que salva a recuperação ou a resistência que a limita? 👇
⚠️ Isto não é aconselhamento financeiro. Faz a tua própria pesquisa.
#RVN #Ravencoin #Crypto #BinanceSquare
316
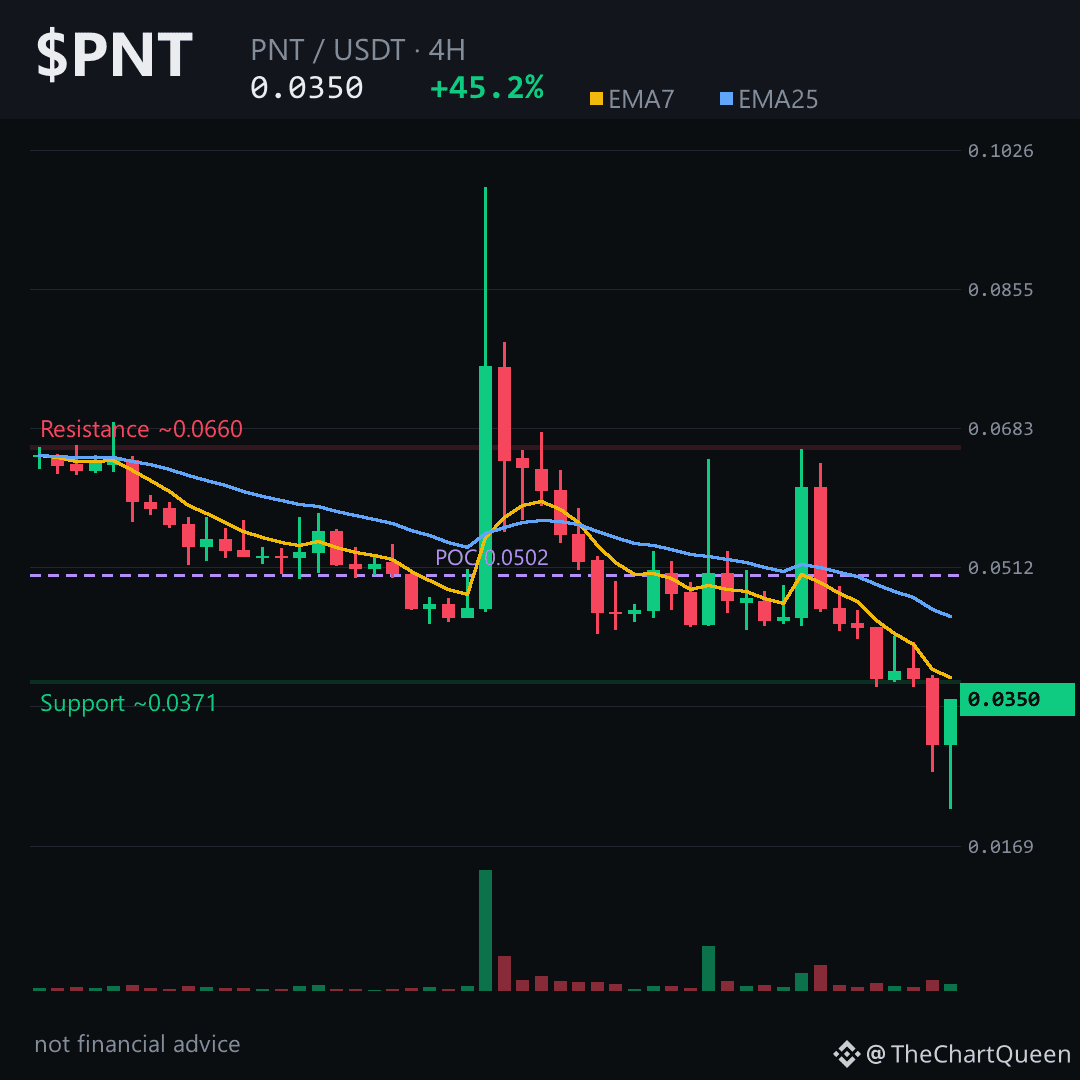
Uma alta de 45% em uma moeda que acabou de registrar um candle vermelho de 21% há quatro horas. Isso não é momentum. É um gato morto quicando dentro de uma bandeira de baixa.
$PNT não está formando uma base aqui. Está caindo em todos os períodos gráficos, e o repique que você está vendo agora é do tipo que perde força antes mesmo de a maioria das pessoas terminar o café. O gráfico de 4H mostra o preço preso abaixo da região de 0.0369, com a EMA7 inclinada fortemente para baixo, abaixo da EMA25. O RSI está em 40 — não está sobrevendido o suficiente para significar alguma coisa, apenas fraco.
Os níveis que importam são simples. Se $PNT não conseguir recuperar a zona de 0.0369 no fechamento de um candle de 4H, o cenário continua baixista, e o caminho de menor resistência aponta para a região de 0.032. Se perder esse nível, o gráfico diário abre espaço para a zona de 0.030. Toque em $PNT para abrir o gráfico e conferir esses níveis por conta própria.
Minha leitura: este é um repique dentro de uma tendência de baixa, não uma reversão. O risco é correr atrás de candles verdes em uma moeda que vem registrando máximas cada vez mais baixas há dias.
O nível 0.0369 é a linha que estou observando. Se a PNT começar a fechar acima dele, o cenário muda rapidamente. Que zona você está acompanhando neste gráfico? 👇
Isto não é aconselhamento financeiro. Faça sua própria pesquisa.
Siga para acompanhar a próxima análise deste gráfico.
#PNT #Crypto #Altcoins #BinanceSquare
Uma alta de 45% em uma moeda que acabou de registrar um candle vermelho de 21% há quatro horas. Isso não é momentum. É um gato morto quicando dentro de uma bandeira de baixa.
$PNT não está formando uma base aqui. Está caindo em todos os períodos gráficos, e o repique que você está vendo agora é do tipo que perde força antes mesmo de a maioria das pessoas terminar o café. O gráfico de 4H mostra o preço preso abaixo da região de 0.0369, com a EMA7 inclinada fortemente para baixo, abaixo da EMA25. O RSI está em 40 — não está sobrevendido o suficiente para significar alguma coisa, apenas fraco.
Os níveis que importam são simples. Se $PNT não conseguir recuperar a zona de 0.0369 no fechamento de um candle de 4H, o cenário continua baixista, e o caminho de menor resistência aponta para a região de 0.032. Se perder esse nível, o gráfico diário abre espaço para a zona de 0.030. Toque em $PNT para abrir o gráfico e conferir esses níveis por conta própria.
Minha leitura: este é um repique dentro de uma tendência de baixa, não uma reversão. O risco é correr atrás de candles verdes em uma moeda que vem registrando máximas cada vez mais baixas há dias.
O nível 0.0369 é a linha que estou observando. Se a PNT começar a fechar acima dele, o cenário muda rapidamente. Que zona você está acompanhando neste gráfico? 👇
Isto não é aconselhamento financeiro. Faça sua própria pesquisa.
Siga para acompanhar a próxima análise deste gráfico.
#PNT #Crypto #Altcoins #BinanceSquare
$PNT não está formando uma base aqui. Está caindo em todos os períodos gráficos, e o repique que você está vendo agora é do tipo que perde força antes mesmo de a maioria das pessoas terminar o café. O gráfico de 4H mostra o preço preso abaixo da região de 0.0369, com a EMA7 inclinada fortemente para baixo, abaixo da EMA25. O RSI está em 40 — não está sobrevendido o suficiente para significar alguma coisa, apenas fraco.
Os níveis que importam são simples. Se $PNT não conseguir recuperar a zona de 0.0369 no fechamento de um candle de 4H, o cenário continua baixista, e o caminho de menor resistência aponta para a região de 0.032. Se perder esse nível, o gráfico diário abre espaço para a zona de 0.030. Toque em $PNT para abrir o gráfico e conferir esses níveis por conta própria.
Minha leitura: este é um repique dentro de uma tendência de baixa, não uma reversão. O risco é correr atrás de candles verdes em uma moeda que vem registrando máximas cada vez mais baixas há dias.
O nível 0.0369 é a linha que estou observando. Se a PNT começar a fechar acima dele, o cenário muda rapidamente. Que zona você está acompanhando neste gráfico? 👇
Isto não é aconselhamento financeiro. Faça sua própria pesquisa.
Siga para acompanhar a próxima análise deste gráfico.
#PNT #Crypto #Altcoins #BinanceSquare
6
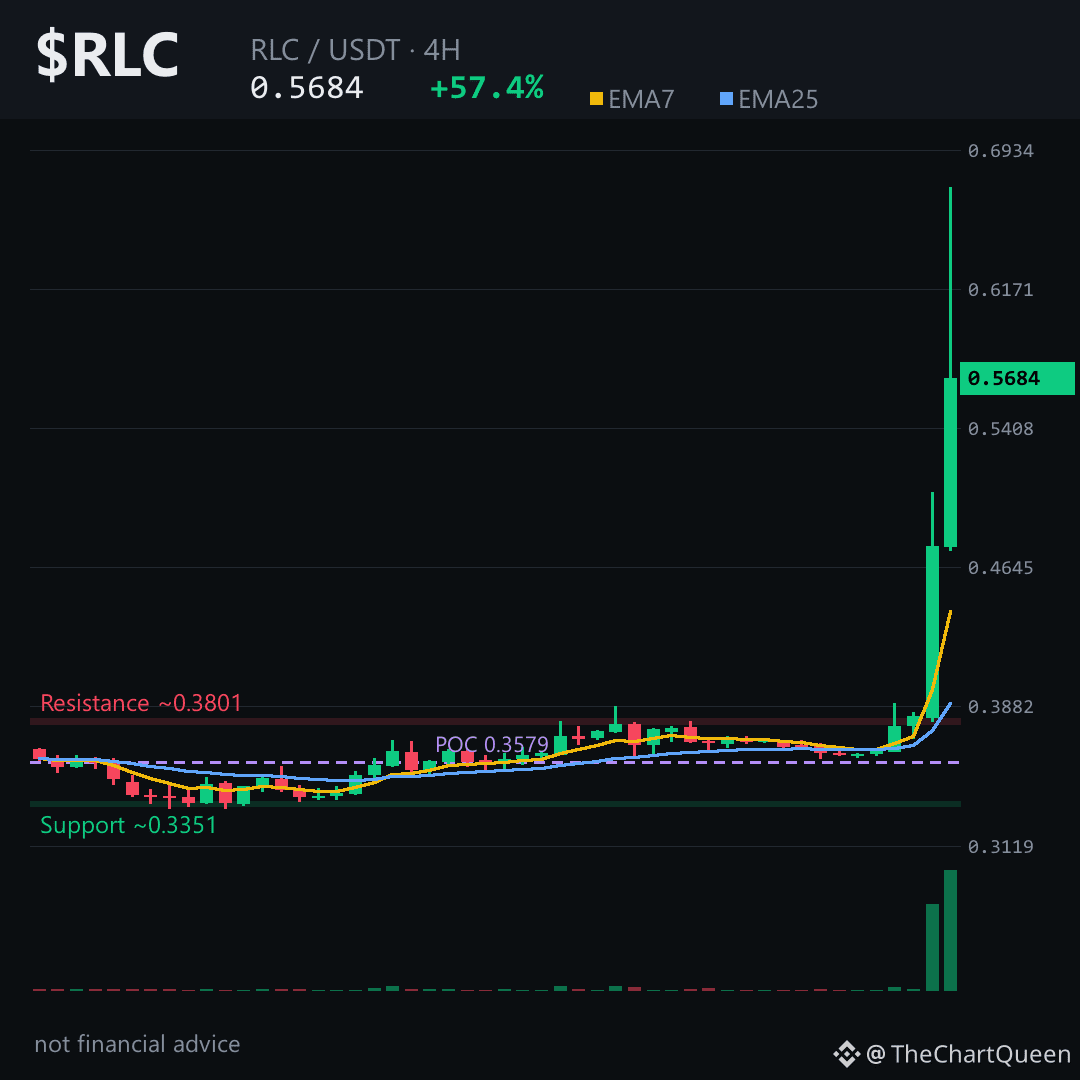
Todo mundo vê +57% e pensa que a alta acabou.
O gráfico diz o contrário — mas o esgotamento é real, e o próximo candle de 4H vai decidir quem sai no prejuízo.
$RLC disparou da faixa dos 0,36 até 0,673 em dois candles, depois devolveu quase um terço dessa alta. Isso não é distribuição. É um primeiro impulso violento, com pressão ainda acumulada acima.
O RSI está acima de 92 no gráfico de 4H — sobrecomprado, claro. Mas o funding negativo em -2% conta outra história: os vendidos estão pagando os comprados para continuarem vendidos. Esse tipo de desequilíbrio costuma alimentar a continuação, não uma queda brusca.
O nível mais importante é a região dos 0,54. Um fechamento de 4H abaixo dessa zona, e o rompimento começa a perder força, rumo à faixa de demanda entre 0,46 e 0,50, onde surgiram as verdadeiras ordens de compra.
Se segurar acima de 0,54, a próxima perna mira a zona dos 0,62–0,65 — justamente onde a máxima de 24H deixou negócios pendentes.
Minha leitura: a tendência segue intacta, mas o dinheiro fácil veio no primeiro impulso. O mais seguro é observar se 0,54 se mantém como suporte, sem correr atrás dos candles verdes.
Acesse $RLC e abra o gráfico de 4H — a linha dos 0,54 é o que define toda a operação agora.
Siga-me — vou atualizar minha análise quando esse nível for testado, porque é aí que essa configuração fica realmente interessante.
Qual é o seu limite para $RLC — 0,54 ou 0,46? 👇
⚠️ Não é recomendação financeira. Faça sua própria pesquisa.
#RLC #Crypto #BinanceSquare
Todo mundo vê +57% e pensa que a alta acabou.
O gráfico diz o contrário — mas o esgotamento é real, e o próximo candle de 4H vai decidir quem sai no prejuízo.
$RLC disparou da faixa dos 0,36 até 0,673 em dois candles, depois devolveu quase um terço dessa alta. Isso não é distribuição. É um primeiro impulso violento, com pressão ainda acumulada acima.
O RSI está acima de 92 no gráfico de 4H — sobrecomprado, claro. Mas o funding negativo em -2% conta outra história: os vendidos estão pagando os comprados para continuarem vendidos. Esse tipo de desequilíbrio costuma alimentar a continuação, não uma queda brusca.
O nível mais importante é a região dos 0,54. Um fechamento de 4H abaixo dessa zona, e o rompimento começa a perder força, rumo à faixa de demanda entre 0,46 e 0,50, onde surgiram as verdadeiras ordens de compra.
Se segurar acima de 0,54, a próxima perna mira a zona dos 0,62–0,65 — justamente onde a máxima de 24H deixou negócios pendentes.
Minha leitura: a tendência segue intacta, mas o dinheiro fácil veio no primeiro impulso. O mais seguro é observar se 0,54 se mantém como suporte, sem correr atrás dos candles verdes.
Acesse $RLC e abra o gráfico de 4H — a linha dos 0,54 é o que define toda a operação agora.
Siga-me — vou atualizar minha análise quando esse nível for testado, porque é aí que essa configuração fica realmente interessante.
Qual é o seu limite para $RLC — 0,54 ou 0,46? 👇
⚠️ Não é recomendação financeira. Faça sua própria pesquisa.
#RLC #Crypto #BinanceSquare
O gráfico diz o contrário — mas o esgotamento é real, e o próximo candle de 4H vai decidir quem sai no prejuízo.
$RLC disparou da faixa dos 0,36 até 0,673 em dois candles, depois devolveu quase um terço dessa alta. Isso não é distribuição. É um primeiro impulso violento, com pressão ainda acumulada acima.
O RSI está acima de 92 no gráfico de 4H — sobrecomprado, claro. Mas o funding negativo em -2% conta outra história: os vendidos estão pagando os comprados para continuarem vendidos. Esse tipo de desequilíbrio costuma alimentar a continuação, não uma queda brusca.
O nível mais importante é a região dos 0,54. Um fechamento de 4H abaixo dessa zona, e o rompimento começa a perder força, rumo à faixa de demanda entre 0,46 e 0,50, onde surgiram as verdadeiras ordens de compra.
Se segurar acima de 0,54, a próxima perna mira a zona dos 0,62–0,65 — justamente onde a máxima de 24H deixou negócios pendentes.
Minha leitura: a tendência segue intacta, mas o dinheiro fácil veio no primeiro impulso. O mais seguro é observar se 0,54 se mantém como suporte, sem correr atrás dos candles verdes.
Acesse $RLC e abra o gráfico de 4H — a linha dos 0,54 é o que define toda a operação agora.
Siga-me — vou atualizar minha análise quando esse nível for testado, porque é aí que essa configuração fica realmente interessante.
Qual é o seu limite para $RLC — 0,54 ou 0,46? 👇
⚠️ Não é recomendação financeira. Faça sua própria pesquisa.
#RLC #Crypto #BinanceSquare
109
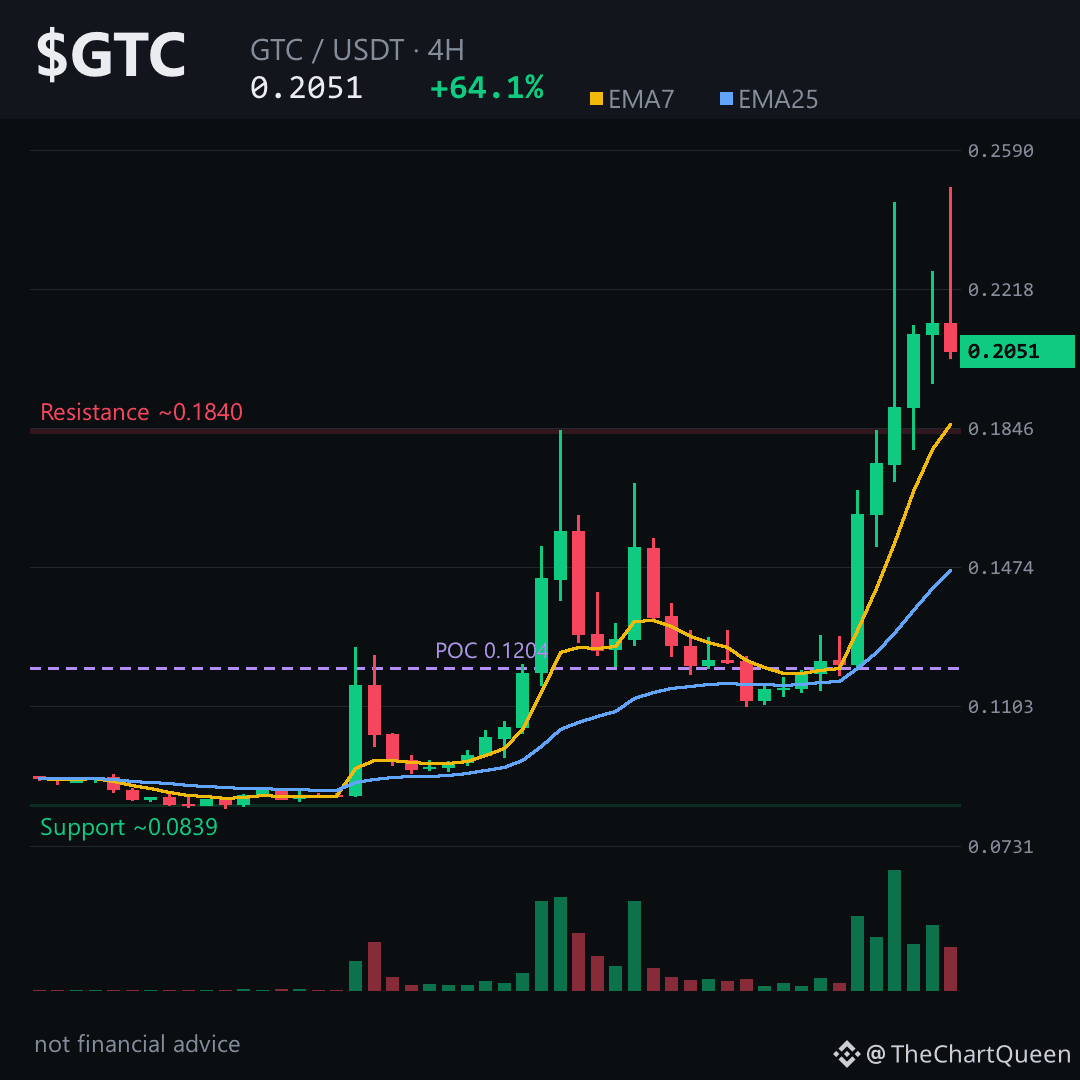
GTC acabou de registar uma vela diária de 64% e nem pestanejou 💥
Mas aqui está a parte de que ninguém está a falar:
a taxa de financiamento está profundamente negativa, enquanto o preço dispara.
Isso não é normal. É combustível ⛽
O preço subiu de 0.118 para 0.249 em menos de 48 horas — não foi uma subida gradual, foi uma quebra em alta que escapou à gravidade.
Ainda assim, os vendedores a descoberto estão a pagar para manter as suas posições, enquanto o preço sobe. Isso muitas vezes significa que o mercado não está suficientemente posicionado para a continuação da subida.
O nível que estou a acompanhar no gráfico de 4H:
~0.194 é a linha que separa os cenários.
Enquanto $GTC se mantiver nessa zona, o caminho de menor resistência aponta para ~0.222 — uma zona natural de liquidez formada pela estrutura da máxima recente.
Se perder ~0.194 num fecho de 4H, a perspetiva de alta perde força.
O cenário de médio prazo confirma: a tendência diária está claramente em alta, com mínimos mais altos intactos desde a zona dos 0.09.
Toque em $GTC para abrir o gráfico e analisar estes níveis por si.
A minha leitura: quebra de resistência impulsionada pelo momentum, com uma corrente contrária — o financiamento negativo, aliado à subida do preço, recompensa a paciência em vez do pânico.
O verdadeiro risco não é a subida; é perseguir a mecha.
Em que nível confia mais — o suporte em 0.194 ou o alvo em 0.222? 👇
Siga-me para a próxima análise deste gráfico.
⚠️ Isto não é aconselhamento financeiro. Faça a sua própria pesquisa.
#GTC #Gitcoin #Crypto #BinanceSquare
GTC acabou de registar uma vela diária de 64% e nem pestanejou 💥
Mas aqui está a parte de que ninguém está a falar:
a taxa de financiamento está profundamente negativa, enquanto o preço dispara.
Isso não é normal. É combustível ⛽
O preço subiu de 0.118 para 0.249 em menos de 48 horas — não foi uma subida gradual, foi uma quebra em alta que escapou à gravidade.
Ainda assim, os vendedores a descoberto estão a pagar para manter as suas posições, enquanto o preço sobe. Isso muitas vezes significa que o mercado não está suficientemente posicionado para a continuação da subida.
O nível que estou a acompanhar no gráfico de 4H:
~0.194 é a linha que separa os cenários.
Enquanto $GTC se mantiver nessa zona, o caminho de menor resistência aponta para ~0.222 — uma zona natural de liquidez formada pela estrutura da máxima recente.
Se perder ~0.194 num fecho de 4H, a perspetiva de alta perde força.
O cenário de médio prazo confirma: a tendência diária está claramente em alta, com mínimos mais altos intactos desde a zona dos 0.09.
Toque em $GTC para abrir o gráfico e analisar estes níveis por si.
A minha leitura: quebra de resistência impulsionada pelo momentum, com uma corrente contrária — o financiamento negativo, aliado à subida do preço, recompensa a paciência em vez do pânico.
O verdadeiro risco não é a subida; é perseguir a mecha.
Em que nível confia mais — o suporte em 0.194 ou o alvo em 0.222? 👇
Siga-me para a próxima análise deste gráfico.
⚠️ Isto não é aconselhamento financeiro. Faça a sua própria pesquisa.
#GTC #Gitcoin #Crypto #BinanceSquare
Mas aqui está a parte de que ninguém está a falar:
a taxa de financiamento está profundamente negativa, enquanto o preço dispara.
Isso não é normal. É combustível ⛽
O preço subiu de 0.118 para 0.249 em menos de 48 horas — não foi uma subida gradual, foi uma quebra em alta que escapou à gravidade.
Ainda assim, os vendedores a descoberto estão a pagar para manter as suas posições, enquanto o preço sobe. Isso muitas vezes significa que o mercado não está suficientemente posicionado para a continuação da subida.
O nível que estou a acompanhar no gráfico de 4H:
~0.194 é a linha que separa os cenários.
Enquanto $GTC se mantiver nessa zona, o caminho de menor resistência aponta para ~0.222 — uma zona natural de liquidez formada pela estrutura da máxima recente.
Se perder ~0.194 num fecho de 4H, a perspetiva de alta perde força.
O cenário de médio prazo confirma: a tendência diária está claramente em alta, com mínimos mais altos intactos desde a zona dos 0.09.
Toque em $GTC para abrir o gráfico e analisar estes níveis por si.
A minha leitura: quebra de resistência impulsionada pelo momentum, com uma corrente contrária — o financiamento negativo, aliado à subida do preço, recompensa a paciência em vez do pânico.
O verdadeiro risco não é a subida; é perseguir a mecha.
Em que nível confia mais — o suporte em 0.194 ou o alvo em 0.222? 👇
Siga-me para a próxima análise deste gráfico.
⚠️ Isto não é aconselhamento financeiro. Faça a sua própria pesquisa.
#GTC #Gitcoin #Crypto #BinanceSquare
154
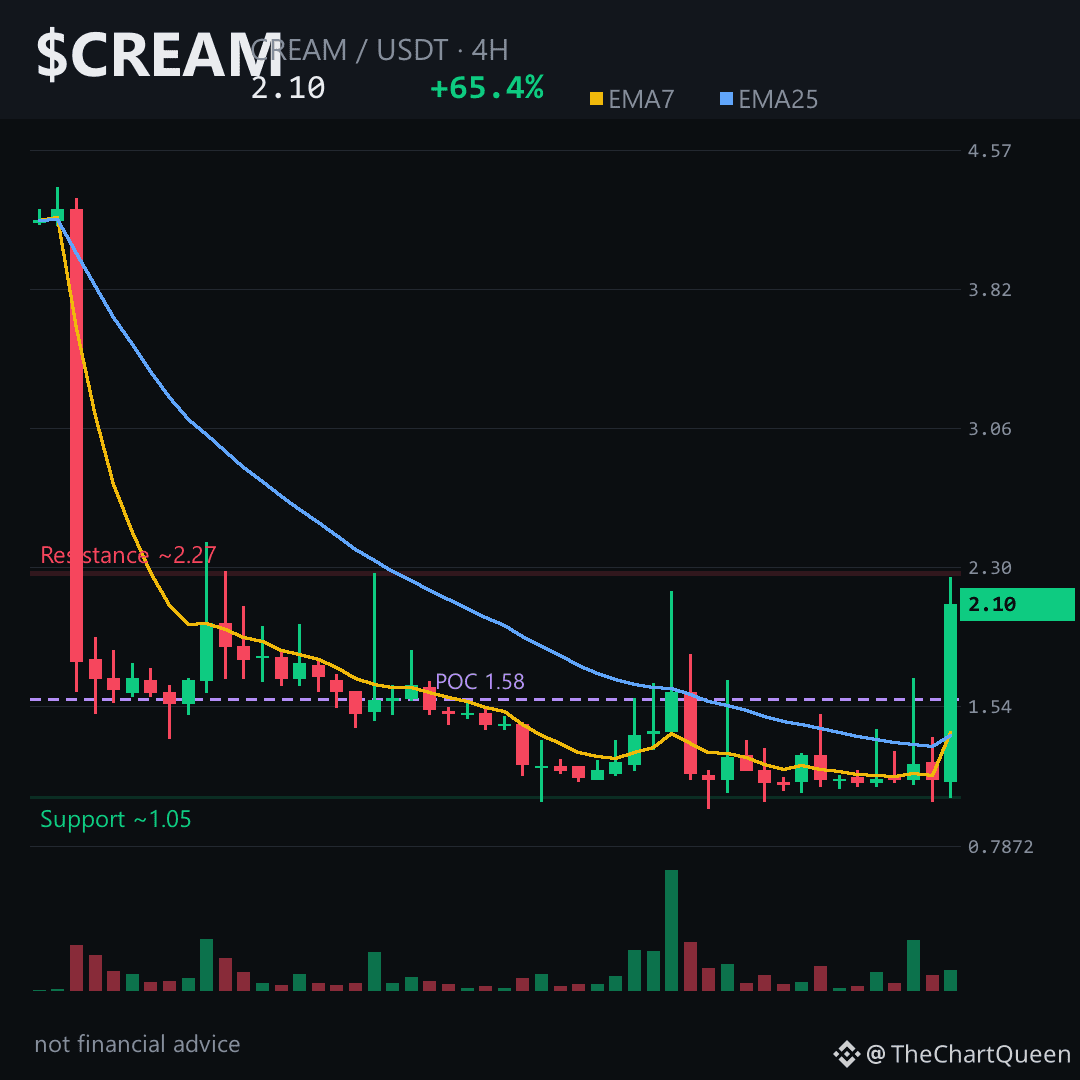
Um dia de +65% numa moeda com interesse em aberto zero em futuros. Isso não é um rompimento. É uma cidade fantasma com um único comprador barulhento.
A vela de 4H acabou de registrar uma amplitude de 84% — abertura perto de 1,14, máxima em 2,25 e fechamento em 2,10. Isso não é acumulação saudável. É uma reprecificação violenta, com pouca liquidez. O funding está estável, e o interesse em aberto é zero. Sem alavancagem, sem hedge, sem instituições — apenas fluxo no mercado à vista diante de um livro de ofertas raso.
A estrutura de 4H é de alta: EMA7 acima da EMA25, RSI em 65, preço de volta acima de 1,98. Mas o gráfico diário conta outra história: EMA7 em 1,71 contra EMA25 em 3,30, com o preço abaixo de um enorme gap de baixa ainda não preenchido, de 3,63 até 2,44. Esse gap é o verdadeiro teto. No semanal, é ainda pior — muito abaixo das duas EMAs, com o RSI mal saindo do fundo.
O nível que importa é 1,98. Enquanto $CREAM se mantiver nessa zona no gráfico de 4H, o momentum continua intacto e o próximo alvo é 2,28. Se perder 1,98, essa recuperação não passa de ruído dentro de uma estrutura diária rompida. A faixa entre 2,28 e 2,44 é onde essa alta vai se provar ou estagnar diante do gap ainda não preenchido.
Minha leitura: momentum de curto prazo dentro de uma tendência de baixa de longo prazo. A alta é real, mas limitada por esse FVG de baixa. Se o fechamento diário não conseguir recuperar 2,44, os vendedores que controlam esse ativo desde 3,63 ainda estarão no comando. Toque em $CREAM para abrir o gráfico.
Siga-me — vou atualizar se 1,98 virar suporte ou se 2,28 for testado. É aí que estará a próxima decisão.
Qual nível de $CREAM você está acompanhando mais de perto — 1,98 ou 2,28? 👇
Isto não é aconselhamento financeiro. Faça sua própria pesquisa.
#CREAM #DeFi #Crypto #BinanceSquare
Um dia de +65% numa moeda com interesse em aberto zero em futuros. Isso não é um rompimento. É uma cidade fantasma com um único comprador barulhento.
A vela de 4H acabou de registrar uma amplitude de 84% — abertura perto de 1,14, máxima em 2,25 e fechamento em 2,10. Isso não é acumulação saudável. É uma reprecificação violenta, com pouca liquidez. O funding está estável, e o interesse em aberto é zero. Sem alavancagem, sem hedge, sem instituições — apenas fluxo no mercado à vista diante de um livro de ofertas raso.
A estrutura de 4H é de alta: EMA7 acima da EMA25, RSI em 65, preço de volta acima de 1,98. Mas o gráfico diário conta outra história: EMA7 em 1,71 contra EMA25 em 3,30, com o preço abaixo de um enorme gap de baixa ainda não preenchido, de 3,63 até 2,44. Esse gap é o verdadeiro teto. No semanal, é ainda pior — muito abaixo das duas EMAs, com o RSI mal saindo do fundo.
O nível que importa é 1,98. Enquanto $CREAM se mantiver nessa zona no gráfico de 4H, o momentum continua intacto e o próximo alvo é 2,28. Se perder 1,98, essa recuperação não passa de ruído dentro de uma estrutura diária rompida. A faixa entre 2,28 e 2,44 é onde essa alta vai se provar ou estagnar diante do gap ainda não preenchido.
Minha leitura: momentum de curto prazo dentro de uma tendência de baixa de longo prazo. A alta é real, mas limitada por esse FVG de baixa. Se o fechamento diário não conseguir recuperar 2,44, os vendedores que controlam esse ativo desde 3,63 ainda estarão no comando. Toque em $CREAM para abrir o gráfico.
Siga-me — vou atualizar se 1,98 virar suporte ou se 2,28 for testado. É aí que estará a próxima decisão.
Qual nível de $CREAM você está acompanhando mais de perto — 1,98 ou 2,28? 👇
Isto não é aconselhamento financeiro. Faça sua própria pesquisa.
#CREAM #DeFi #Crypto #BinanceSquare
A vela de 4H acabou de registrar uma amplitude de 84% — abertura perto de 1,14, máxima em 2,25 e fechamento em 2,10. Isso não é acumulação saudável. É uma reprecificação violenta, com pouca liquidez. O funding está estável, e o interesse em aberto é zero. Sem alavancagem, sem hedge, sem instituições — apenas fluxo no mercado à vista diante de um livro de ofertas raso.
A estrutura de 4H é de alta: EMA7 acima da EMA25, RSI em 65, preço de volta acima de 1,98. Mas o gráfico diário conta outra história: EMA7 em 1,71 contra EMA25 em 3,30, com o preço abaixo de um enorme gap de baixa ainda não preenchido, de 3,63 até 2,44. Esse gap é o verdadeiro teto. No semanal, é ainda pior — muito abaixo das duas EMAs, com o RSI mal saindo do fundo.
O nível que importa é 1,98. Enquanto $CREAM se mantiver nessa zona no gráfico de 4H, o momentum continua intacto e o próximo alvo é 2,28. Se perder 1,98, essa recuperação não passa de ruído dentro de uma estrutura diária rompida. A faixa entre 2,28 e 2,44 é onde essa alta vai se provar ou estagnar diante do gap ainda não preenchido.
Minha leitura: momentum de curto prazo dentro de uma tendência de baixa de longo prazo. A alta é real, mas limitada por esse FVG de baixa. Se o fechamento diário não conseguir recuperar 2,44, os vendedores que controlam esse ativo desde 3,63 ainda estarão no comando. Toque em $CREAM para abrir o gráfico.
Siga-me — vou atualizar se 1,98 virar suporte ou se 2,28 for testado. É aí que estará a próxima decisão.
Qual nível de $CREAM você está acompanhando mais de perto — 1,98 ou 2,28? 👇
Isto não é aconselhamento financeiro. Faça sua própria pesquisa.
#CREAM #DeFi #Crypto #BinanceSquare
2
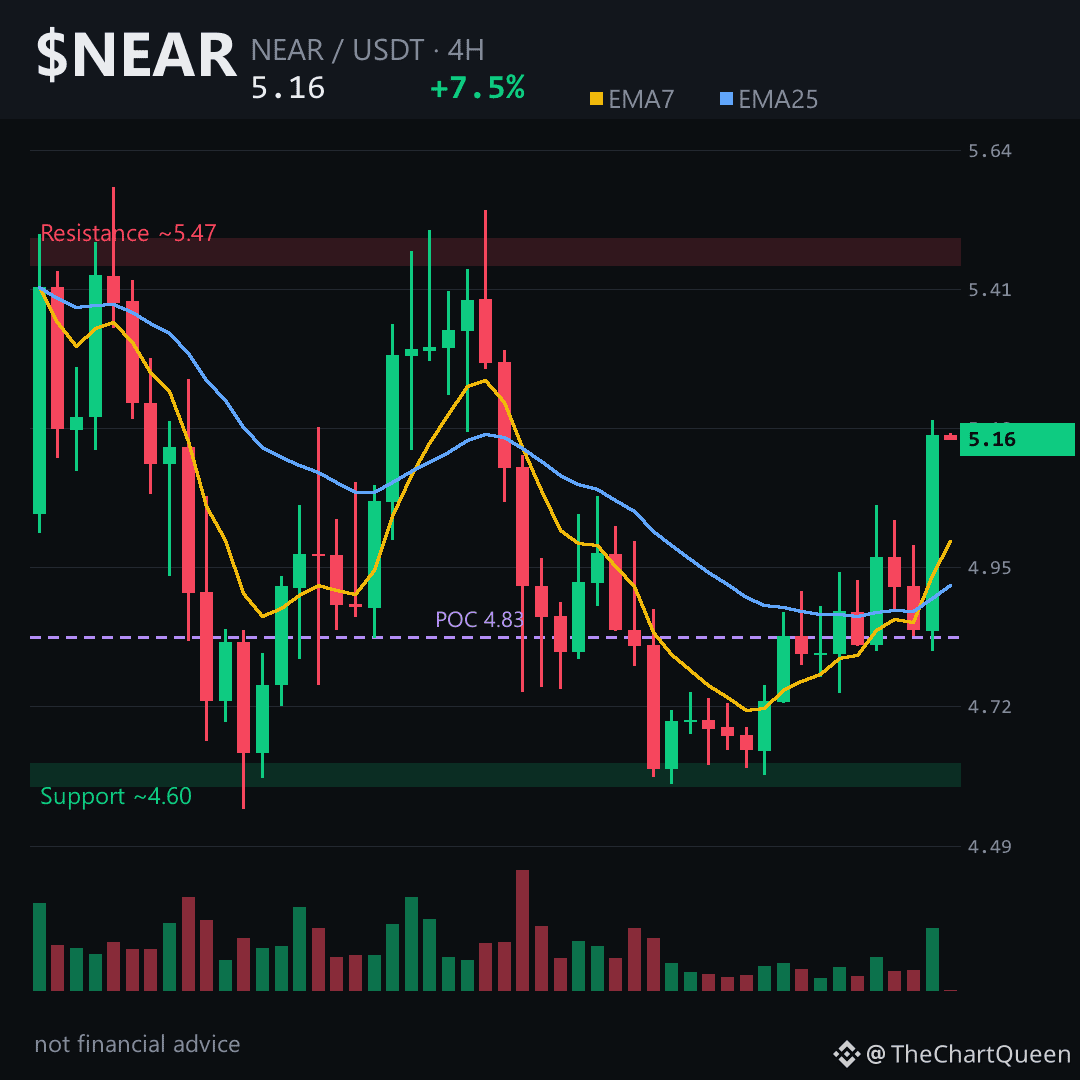
$NEAR subiu +7.5% nas últimas 24 horas e está rondando os $5.16 — mas a verdadeira questão não é se pode subir mais. É se este movimento tem combustível suficiente para continuar ou se está a assistir ao último suspiro de um topo local.
O preço está acima das médias móveis de curto prazo — o momentum está inclinado para cima. O RSI está perto de 60 no gráfico de 4 horas. Ainda não está sobreaquecido, mas está suficientemente perto para deixar de assumir que os ganhos fáceis vão continuar.
A taxa de financiamento está apenas ligeiramente positiva — ainda não há alavancagem extrema. Mas o rácio long/short está inclinado para posições long, e o open interest está a subir. Muitas vezes, isso significa que a confiança está a crescer mais depressa do que a confirmação do preço. Se $NEAR estagnar, os compradores que entraram tarde tornam-se liquidez de saída.
O nível mais importante é ~$4.88 — a zona de invalidação no gráfico de 4 horas. Se perder esse nível no fecho, a estrutura de alta quebra. Acima dele, o caminho até ~$5.60 continua aberto.
Toque em $NEAR para abrir o gráfico e analisar estes níveis por si.
A minha leitura: a tendência é de alta, mas provavelmente a parte fácil já ficou para trás. O risco real está em perseguir a força acima de $5.20 sem antes haver um reteste claro.
Voltarei a analisar se NEAR fechar acima de $5.20 ou perder a zona dos $4.88 — siga-me para não perder essa atualização.
Em que nível confia mais neste momento — no suporte dos $4.88 ou no alvo dos $5.60? 👇
⚠️ Isto não é aconselhamento financeiro. Faça a sua própria pesquisa (DYOR).
#NEAR #Crypto #BinanceSquare #Altcoins
$NEAR subiu +7.5% nas últimas 24 horas e está rondando os $5.16 — mas a verdadeira questão não é se pode subir mais. É se este movimento tem combustível suficiente para continuar ou se está a assistir ao último suspiro de um topo local.
O preço está acima das médias móveis de curto prazo — o momentum está inclinado para cima. O RSI está perto de 60 no gráfico de 4 horas. Ainda não está sobreaquecido, mas está suficientemente perto para deixar de assumir que os ganhos fáceis vão continuar.
A taxa de financiamento está apenas ligeiramente positiva — ainda não há alavancagem extrema. Mas o rácio long/short está inclinado para posições long, e o open interest está a subir. Muitas vezes, isso significa que a confiança está a crescer mais depressa do que a confirmação do preço. Se $NEAR estagnar, os compradores que entraram tarde tornam-se liquidez de saída.
O nível mais importante é ~$4.88 — a zona de invalidação no gráfico de 4 horas. Se perder esse nível no fecho, a estrutura de alta quebra. Acima dele, o caminho até ~$5.60 continua aberto.
Toque em $NEAR para abrir o gráfico e analisar estes níveis por si.
A minha leitura: a tendência é de alta, mas provavelmente a parte fácil já ficou para trás. O risco real está em perseguir a força acima de $5.20 sem antes haver um reteste claro.
Voltarei a analisar se NEAR fechar acima de $5.20 ou perder a zona dos $4.88 — siga-me para não perder essa atualização.
Em que nível confia mais neste momento — no suporte dos $4.88 ou no alvo dos $5.60? 👇
⚠️ Isto não é aconselhamento financeiro. Faça a sua própria pesquisa (DYOR).
#NEAR #Crypto #BinanceSquare #Altcoins
O preço está acima das médias móveis de curto prazo — o momentum está inclinado para cima. O RSI está perto de 60 no gráfico de 4 horas. Ainda não está sobreaquecido, mas está suficientemente perto para deixar de assumir que os ganhos fáceis vão continuar.
A taxa de financiamento está apenas ligeiramente positiva — ainda não há alavancagem extrema. Mas o rácio long/short está inclinado para posições long, e o open interest está a subir. Muitas vezes, isso significa que a confiança está a crescer mais depressa do que a confirmação do preço. Se $NEAR estagnar, os compradores que entraram tarde tornam-se liquidez de saída.
O nível mais importante é ~$4.88 — a zona de invalidação no gráfico de 4 horas. Se perder esse nível no fecho, a estrutura de alta quebra. Acima dele, o caminho até ~$5.60 continua aberto.
Toque em $NEAR para abrir o gráfico e analisar estes níveis por si.
A minha leitura: a tendência é de alta, mas provavelmente a parte fácil já ficou para trás. O risco real está em perseguir a força acima de $5.20 sem antes haver um reteste claro.
Voltarei a analisar se NEAR fechar acima de $5.20 ou perder a zona dos $4.88 — siga-me para não perder essa atualização.
Em que nível confia mais neste momento — no suporte dos $4.88 ou no alvo dos $5.60? 👇
⚠️ Isto não é aconselhamento financeiro. Faça a sua própria pesquisa (DYOR).
#NEAR #Crypto #BinanceSquare #Altcoins
60
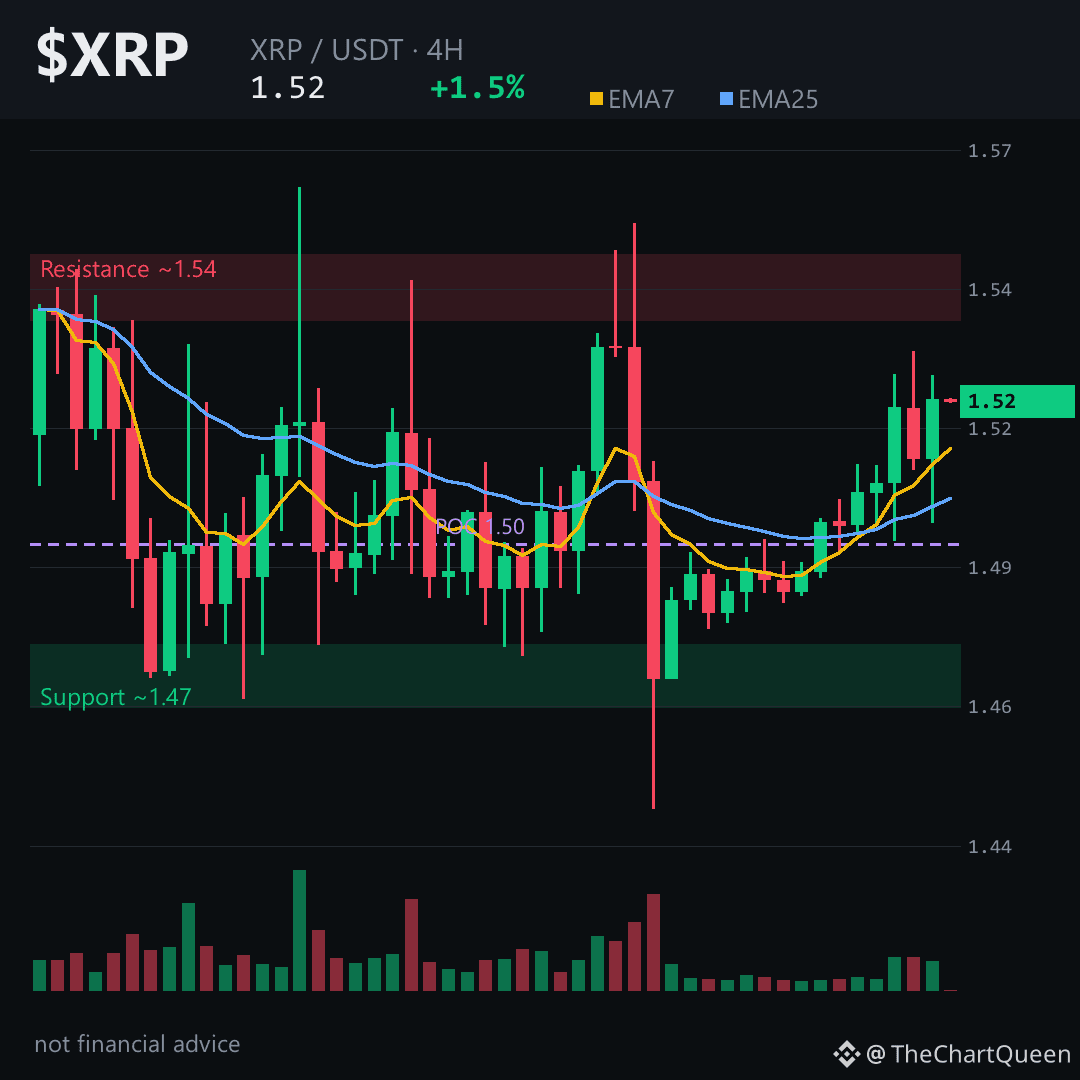
$1.5222.
É aí que $XRP se encontra, após uma amplitude de apenas 2,48% nas últimas 24 horas — estreita o suficiente para transmitir calma, mas ampla o bastante para esconder uma armadilha. O POC do perfil de volume está perto de 1,495, com uma lacuna de alta ainda não preenchida logo abaixo. O preço está acima de ambos, testando se esse piso realmente se mantém.
O funding está ligeiramente positivo, o open interest ronda os 320M e a proporção long/short está elevada — mais de duas posições longas por cada posição curta. Isto não é um cenário de short squeeze; é uma sala cheia. Quando uma sala fica lotada perto da resistência, as saídas tornam-se estreitas.
A estrutura de 4 horas é a leitura mais clara. O preço recuperou a tendência de curto prazo, com a EMA7 acima da EMA25 e o RSI a manter-se na casa dos 50. O nível importante é 1,493–1,495: o POC, o topo da lacuna ainda não preenchida e o piso psicológico. Se $XRP perder essa zona num fecho de 4 horas, esta leitura otimista deixa de ser válida.
A objetivo de alta situa-se perto de 1,582 — um nível alinhado com o movimento projetado a partir do intervalo de consolidação. Mas a invalidação está mais perto do que o objetivo, por isso a relação risco/recompensa não é muito convincente. É uma subida lenta, não um disparo.
A minha leitura: o gráfico pende para a alta, mas o posicionamento da multidão faz-me levar mais a sério o risco de queda. O verdadeiro risco não é uma quebra repentina — é uma descida lenta de volta à lacuna.
Toque em $XRP e abra o gráfico de 4 horas. Observe como o preço reage à zona de 1,495 antes de confiar na quebra.
Que nível está a acompanhar mais de perto — 1,495 ou 1,582? 👇
Isto não é aconselhamento financeiro. Faça a sua própria pesquisa.
Siga-me para a próxima análise deste gráfico.
#XRP #Ripple #Crypto #BinanceSquare
$1.5222.
É aí que $XRP se encontra, após uma amplitude de apenas 2,48% nas últimas 24 horas — estreita o suficiente para transmitir calma, mas ampla o bastante para esconder uma armadilha. O POC do perfil de volume está perto de 1,495, com uma lacuna de alta ainda não preenchida logo abaixo. O preço está acima de ambos, testando se esse piso realmente se mantém.
O funding está ligeiramente positivo, o open interest ronda os 320M e a proporção long/short está elevada — mais de duas posições longas por cada posição curta. Isto não é um cenário de short squeeze; é uma sala cheia. Quando uma sala fica lotada perto da resistência, as saídas tornam-se estreitas.
A estrutura de 4 horas é a leitura mais clara. O preço recuperou a tendência de curto prazo, com a EMA7 acima da EMA25 e o RSI a manter-se na casa dos 50. O nível importante é 1,493–1,495: o POC, o topo da lacuna ainda não preenchida e o piso psicológico. Se $XRP perder essa zona num fecho de 4 horas, esta leitura otimista deixa de ser válida.
A objetivo de alta situa-se perto de 1,582 — um nível alinhado com o movimento projetado a partir do intervalo de consolidação. Mas a invalidação está mais perto do que o objetivo, por isso a relação risco/recompensa não é muito convincente. É uma subida lenta, não um disparo.
A minha leitura: o gráfico pende para a alta, mas o posicionamento da multidão faz-me levar mais a sério o risco de queda. O verdadeiro risco não é uma quebra repentina — é uma descida lenta de volta à lacuna.
Toque em $XRP e abra o gráfico de 4 horas. Observe como o preço reage à zona de 1,495 antes de confiar na quebra.
Que nível está a acompanhar mais de perto — 1,495 ou 1,582? 👇
Isto não é aconselhamento financeiro. Faça a sua própria pesquisa.
Siga-me para a próxima análise deste gráfico.
#XRP #Ripple #Crypto #BinanceSquare
É aí que $XRP se encontra, após uma amplitude de apenas 2,48% nas últimas 24 horas — estreita o suficiente para transmitir calma, mas ampla o bastante para esconder uma armadilha. O POC do perfil de volume está perto de 1,495, com uma lacuna de alta ainda não preenchida logo abaixo. O preço está acima de ambos, testando se esse piso realmente se mantém.
O funding está ligeiramente positivo, o open interest ronda os 320M e a proporção long/short está elevada — mais de duas posições longas por cada posição curta. Isto não é um cenário de short squeeze; é uma sala cheia. Quando uma sala fica lotada perto da resistência, as saídas tornam-se estreitas.
A estrutura de 4 horas é a leitura mais clara. O preço recuperou a tendência de curto prazo, com a EMA7 acima da EMA25 e o RSI a manter-se na casa dos 50. O nível importante é 1,493–1,495: o POC, o topo da lacuna ainda não preenchida e o piso psicológico. Se $XRP perder essa zona num fecho de 4 horas, esta leitura otimista deixa de ser válida.
A objetivo de alta situa-se perto de 1,582 — um nível alinhado com o movimento projetado a partir do intervalo de consolidação. Mas a invalidação está mais perto do que o objetivo, por isso a relação risco/recompensa não é muito convincente. É uma subida lenta, não um disparo.
A minha leitura: o gráfico pende para a alta, mas o posicionamento da multidão faz-me levar mais a sério o risco de queda. O verdadeiro risco não é uma quebra repentina — é uma descida lenta de volta à lacuna.
Toque em $XRP e abra o gráfico de 4 horas. Observe como o preço reage à zona de 1,495 antes de confiar na quebra.
Que nível está a acompanhar mais de perto — 1,495 ou 1,582? 👇
Isto não é aconselhamento financeiro. Faça a sua própria pesquisa.
Siga-me para a próxima análise deste gráfico.
#XRP #Ripple #Crypto #BinanceSquare
53
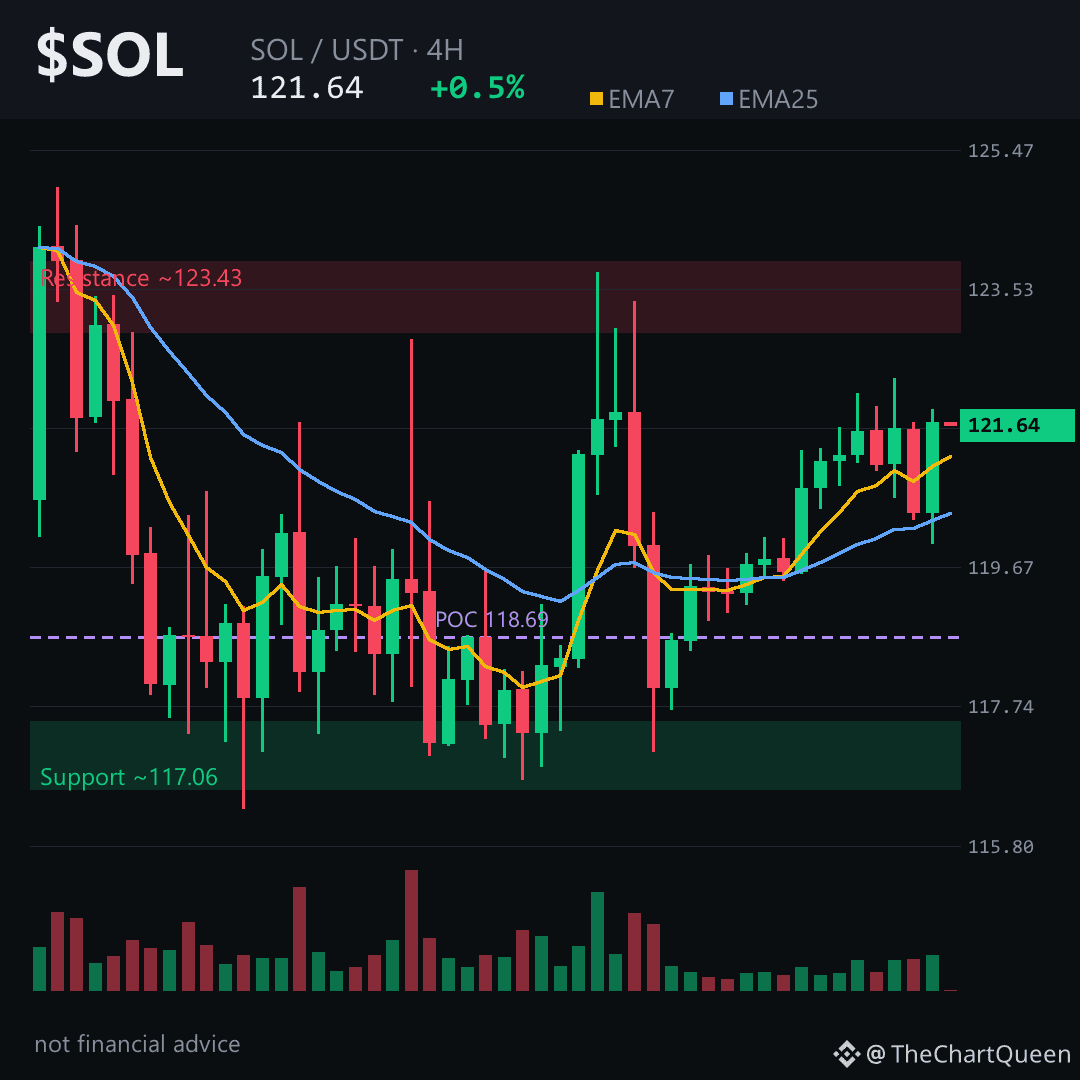
Vamos ser sinceros — uma moeda que se move menos de meio por cento em um dia não forma um gráfico. É uma sala de espera. E é nas salas de espera que as verdadeiras oportunidades começam a se formar.
$SOL está pouco acima de 121.50, andando de lado no gráfico de 4H, enquanto o gráfico diário vai formando discretamente fundos cada vez mais altos. Essa diferença entre o tédio de curto prazo e a estrutura de longo prazo é a história toda.
No gráfico de 4H, as EMAs estão bem comprimidas, o RSI está na casa dos 50 e o volume é baixo. Sem convicção, só oscilação.
O gráfico diário está mais claro. O preço continua se mantendo acima de 120, com um desequilíbrio altista não preenchido abaixo, na região de 115.50–111.50, atuando como um ímã. Acima, 139 é o verdadeiro prêmio caso o impulso volte.
Os futuros pedem cautela: o funding está pouco positivo e a relação long/short está fortemente inclinada para posições compradas. É uma zona perfeita para liquidações antes de qualquer movimento real.
Minha leitura: o gráfico de 4H é ruído. A estrutura diária é o que importa. Se $SOL se mantiver na região de 120, o caminho primeiro até 126 e depois até 139 continua aberto. Se perder a zona de 118.50 em um fechamento de 4H, essa leitura otimista perde sustentação.
Acesse $SOL e confira o gráfico diário — é lá que a operação está realmente se formando.
Vou atualizar esta análise conforme o preço sair da faixa. Siga-me para acompanhar quando a estrutura mudar. Que nível você está observando no SOL agora? 👇
⚠️ Isto não é aconselhamento financeiro. Faça sua própria pesquisa.
#SOL #Solana #Crypto #BinanceSquare
Vamos ser sinceros — uma moeda que se move menos de meio por cento em um dia não forma um gráfico. É uma sala de espera. E é nas salas de espera que as verdadeiras oportunidades começam a se formar.
$SOL está pouco acima de 121.50, andando de lado no gráfico de 4H, enquanto o gráfico diário vai formando discretamente fundos cada vez mais altos. Essa diferença entre o tédio de curto prazo e a estrutura de longo prazo é a história toda.
No gráfico de 4H, as EMAs estão bem comprimidas, o RSI está na casa dos 50 e o volume é baixo. Sem convicção, só oscilação.
O gráfico diário está mais claro. O preço continua se mantendo acima de 120, com um desequilíbrio altista não preenchido abaixo, na região de 115.50–111.50, atuando como um ímã. Acima, 139 é o verdadeiro prêmio caso o impulso volte.
Os futuros pedem cautela: o funding está pouco positivo e a relação long/short está fortemente inclinada para posições compradas. É uma zona perfeita para liquidações antes de qualquer movimento real.
Minha leitura: o gráfico de 4H é ruído. A estrutura diária é o que importa. Se $SOL se mantiver na região de 120, o caminho primeiro até 126 e depois até 139 continua aberto. Se perder a zona de 118.50 em um fechamento de 4H, essa leitura otimista perde sustentação.
Acesse $SOL e confira o gráfico diário — é lá que a operação está realmente se formando.
Vou atualizar esta análise conforme o preço sair da faixa. Siga-me para acompanhar quando a estrutura mudar. Que nível você está observando no SOL agora? 👇
⚠️ Isto não é aconselhamento financeiro. Faça sua própria pesquisa.
#SOL #Solana #Crypto #BinanceSquare
$SOL está pouco acima de 121.50, andando de lado no gráfico de 4H, enquanto o gráfico diário vai formando discretamente fundos cada vez mais altos. Essa diferença entre o tédio de curto prazo e a estrutura de longo prazo é a história toda.
No gráfico de 4H, as EMAs estão bem comprimidas, o RSI está na casa dos 50 e o volume é baixo. Sem convicção, só oscilação.
O gráfico diário está mais claro. O preço continua se mantendo acima de 120, com um desequilíbrio altista não preenchido abaixo, na região de 115.50–111.50, atuando como um ímã. Acima, 139 é o verdadeiro prêmio caso o impulso volte.
Os futuros pedem cautela: o funding está pouco positivo e a relação long/short está fortemente inclinada para posições compradas. É uma zona perfeita para liquidações antes de qualquer movimento real.
Minha leitura: o gráfico de 4H é ruído. A estrutura diária é o que importa. Se $SOL se mantiver na região de 120, o caminho primeiro até 126 e depois até 139 continua aberto. Se perder a zona de 118.50 em um fechamento de 4H, essa leitura otimista perde sustentação.
Acesse $SOL e confira o gráfico diário — é lá que a operação está realmente se formando.
Vou atualizar esta análise conforme o preço sair da faixa. Siga-me para acompanhar quando a estrutura mudar. Que nível você está observando no SOL agora? 👇
⚠️ Isto não é aconselhamento financeiro. Faça sua própria pesquisa.
#SOL #Solana #Crypto #BinanceSquare
68
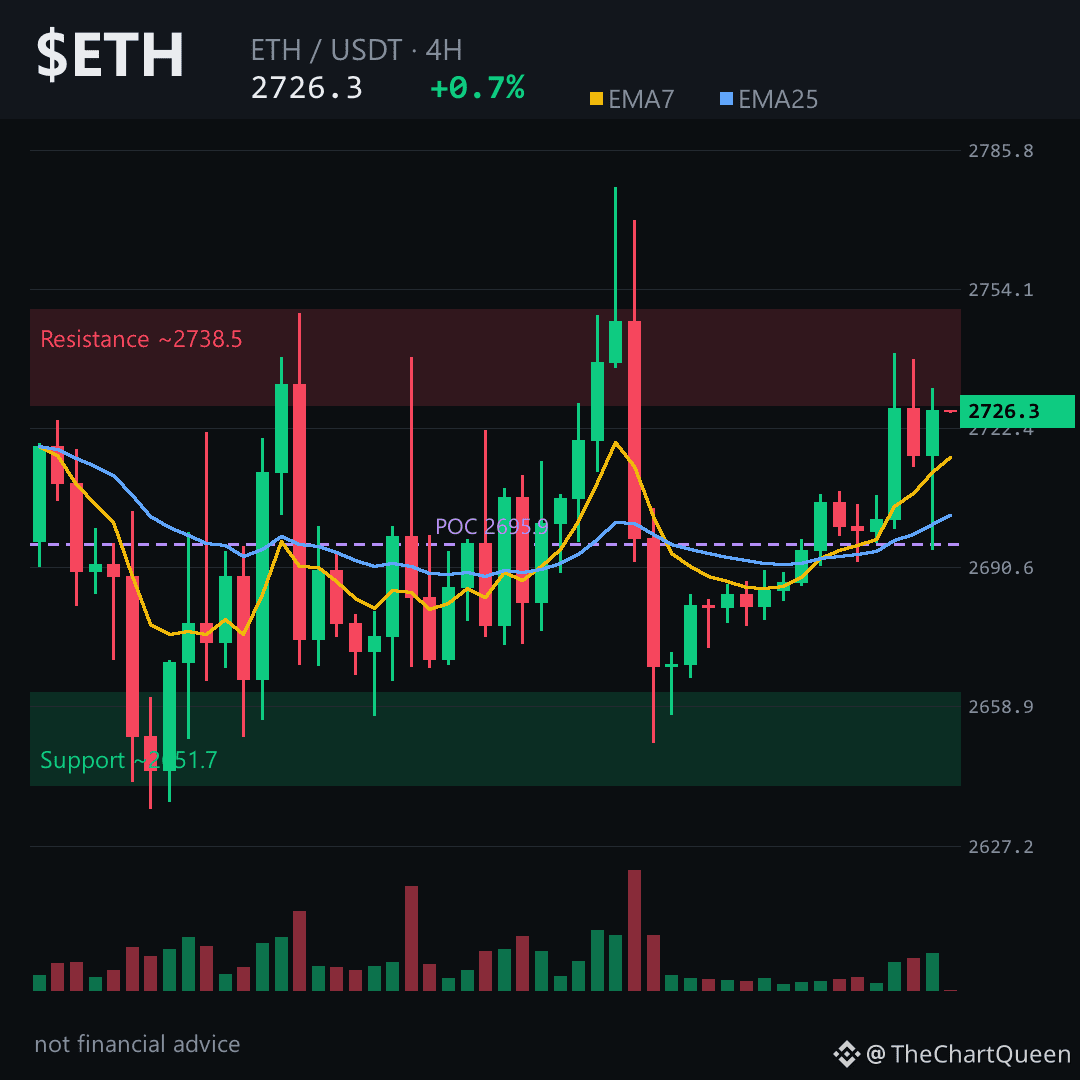
Todos estão convencidos de que $ETH já parou de se mover — um dia de 0,75%, mal dá sinal de vida, certo?
Errado.
Um volume baixo em um nível importante costuma ser o sinal mais forte. O gráfico de 4H acabou de deixar um pequeno gap não preenchido entre 2691 e 2689 — aquele tipo de faixa que o preço costuma revisitar apenas quando a estrutura está realmente fraca. Não é o caso aqui.
A multidão está posicionada em compras, com o funding ligeiramente positivo. Normalmente, isso me deixaria com uma visão contrária e baixista. Mas o open interest é minúsculo. Este não é um topo lotado — é um mercado à deriva, não perseguindo o preço. O preço continua defendendo 2690–2700, enquanto forma fundos mais altos no gráfico de 4H. Isso não é exaustão. É acumulação com cara de tédio.
O preço está se mantendo acima de 2700, e o objetivo fica perto de 2800 se o momentum continuar. Uma perda da zona de 2670 no fechamento de 4H desmonta toda a tese — essa é a linha que importa. Toque em $ETH para abrir o gráfico.
Minha leitura: o caminho de menor resistência continua sendo para cima, mas o verdadeiro risco não é uma quebra — é a impaciência. Este movimento quer avançar aos poucos, não disparar.
Vou atualizar se 2670 ceder ou se 2800 for atingido — siga-me para que essa análise apareça no seu feed, e não no de outra pessoa.
Qual é o nível que você está mais de olho em $ETH agora? 👇
⚠️ Isto não é aconselhamento financeiro. Faça sua própria pesquisa.
#ETH #Ethereum #Crypto #BinanceSquare
Todos estão convencidos de que $ETH já parou de se mover — um dia de 0,75%, mal dá sinal de vida, certo?
Errado.
Um volume baixo em um nível importante costuma ser o sinal mais forte. O gráfico de 4H acabou de deixar um pequeno gap não preenchido entre 2691 e 2689 — aquele tipo de faixa que o preço costuma revisitar apenas quando a estrutura está realmente fraca. Não é o caso aqui.
A multidão está posicionada em compras, com o funding ligeiramente positivo. Normalmente, isso me deixaria com uma visão contrária e baixista. Mas o open interest é minúsculo. Este não é um topo lotado — é um mercado à deriva, não perseguindo o preço. O preço continua defendendo 2690–2700, enquanto forma fundos mais altos no gráfico de 4H. Isso não é exaustão. É acumulação com cara de tédio.
O preço está se mantendo acima de 2700, e o objetivo fica perto de 2800 se o momentum continuar. Uma perda da zona de 2670 no fechamento de 4H desmonta toda a tese — essa é a linha que importa. Toque em $ETH para abrir o gráfico.
Minha leitura: o caminho de menor resistência continua sendo para cima, mas o verdadeiro risco não é uma quebra — é a impaciência. Este movimento quer avançar aos poucos, não disparar.
Vou atualizar se 2670 ceder ou se 2800 for atingido — siga-me para que essa análise apareça no seu feed, e não no de outra pessoa.
Qual é o nível que você está mais de olho em $ETH agora? 👇
⚠️ Isto não é aconselhamento financeiro. Faça sua própria pesquisa.
#ETH #Ethereum #Crypto #BinanceSquare
Errado.
Um volume baixo em um nível importante costuma ser o sinal mais forte. O gráfico de 4H acabou de deixar um pequeno gap não preenchido entre 2691 e 2689 — aquele tipo de faixa que o preço costuma revisitar apenas quando a estrutura está realmente fraca. Não é o caso aqui.
A multidão está posicionada em compras, com o funding ligeiramente positivo. Normalmente, isso me deixaria com uma visão contrária e baixista. Mas o open interest é minúsculo. Este não é um topo lotado — é um mercado à deriva, não perseguindo o preço. O preço continua defendendo 2690–2700, enquanto forma fundos mais altos no gráfico de 4H. Isso não é exaustão. É acumulação com cara de tédio.
O preço está se mantendo acima de 2700, e o objetivo fica perto de 2800 se o momentum continuar. Uma perda da zona de 2670 no fechamento de 4H desmonta toda a tese — essa é a linha que importa. Toque em $ETH para abrir o gráfico.
Minha leitura: o caminho de menor resistência continua sendo para cima, mas o verdadeiro risco não é uma quebra — é a impaciência. Este movimento quer avançar aos poucos, não disparar.
Vou atualizar se 2670 ceder ou se 2800 for atingido — siga-me para que essa análise apareça no seu feed, e não no de outra pessoa.
Qual é o nível que você está mais de olho em $ETH agora? 👇
⚠️ Isto não é aconselhamento financeiro. Faça sua própria pesquisa.
#ETH #Ethereum #Crypto #BinanceSquare
65
Todo mundo acha que o rompimento acabou de acontecer.
Mas o gráfico de 4H mostra que o verdadeiro teste nem começou.
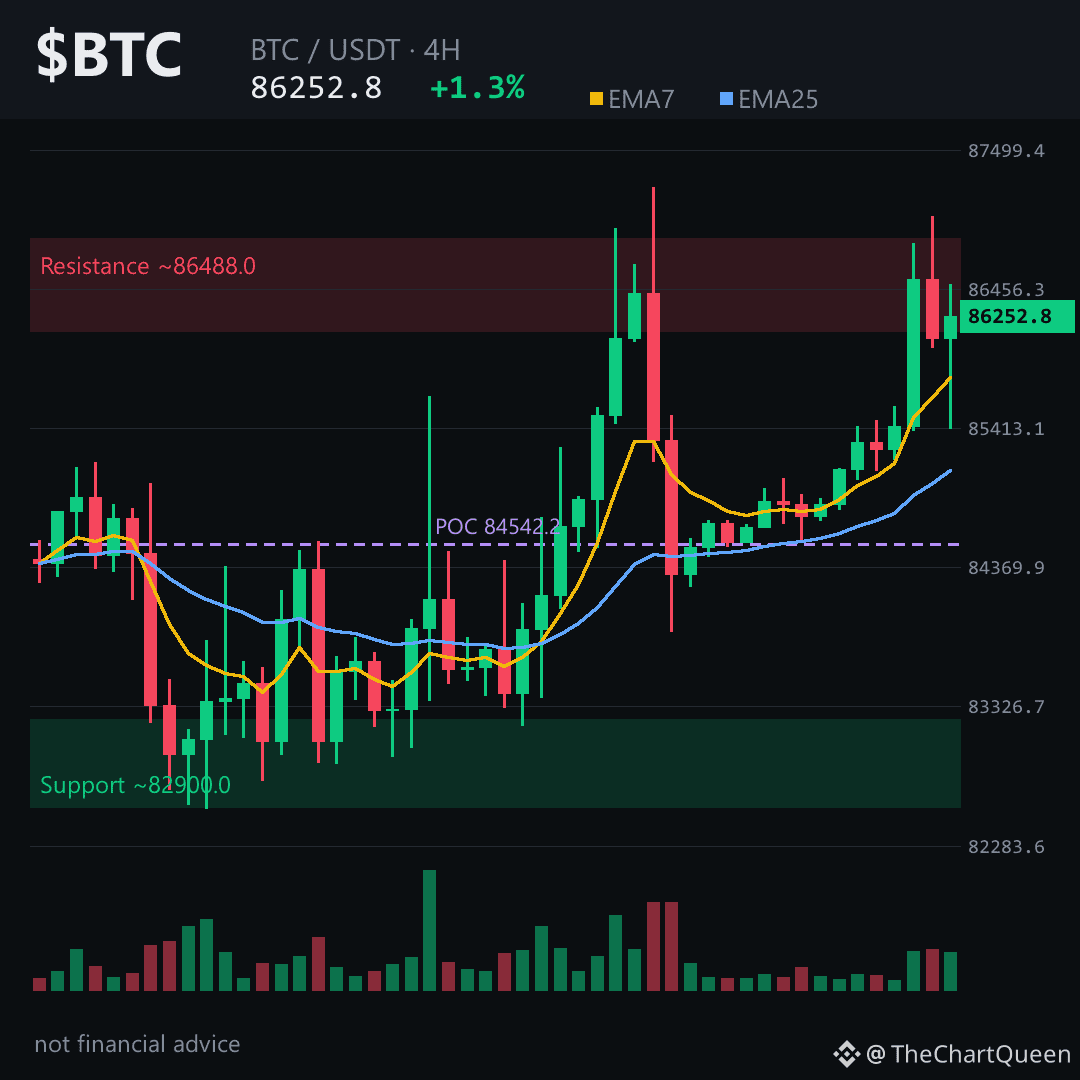
Aquela máxima de 86,9K foi vendida rapidamente — uma clássica caça a stops acima da máxima da faixa, não uma aceitação. O preço voltou direto para baixo dela. E há um gap de alta não preenchido logo abaixo, na região de 84,9–85,0K. Gaps assim agem como ímãs, especialmente depois de uma tentativa frustrada de subir.
O mercado de futuros está quase neutro — o funding mal está positivo, e o número de posições compradas e vendidas é quase igual. Isso não é euforia. É hesitação. Em geral, os investidores experientes se posicionam antes de uma expansão real, não depois de uma máxima com pavio.
Se $BTC se mantiver na região de ~84,4K no fechamento de qualquer candle de 4H, essa queda é apenas parte da estrutura. O objetivo acima continua sendo a região de 88,4K — a extensão projetada a partir da última consolidação. Mas, se perder a região de 84,4K, a leitura de alta de curto prazo deixa de valer.
Minha leitura: a tendência continua de alta, mas esta é uma zona de “prove isso”. O risco recai sobre quem corre atrás da máxima antes de o reteste se concretizar. Toque em $BTC para abrir o gráfico e ver como esse gap se alinha perfeitamente com a zona de invalidação.
Siga-me para receber a atualização quando esse nível se mantiver ou ceder — é aí que começa o próximo movimento de verdade. Que nível você está acompanhando em $BTC agora 👇
⚠️ Isto não é aconselhamento financeiro. Faça sua própria pesquisa.
#BTC #Bitcoin #Crypto #BinanceSquare
Todo mundo acha que o rompimento acabou de acontecer.
Mas o gráfico de 4H mostra que o verdadeiro teste nem começou.
Aquela máxima de 86,9K foi vendida rapidamente — uma clássica caça a stops acima da máxima da faixa, não uma aceitação. O preço voltou direto para baixo dela. E há um gap de alta não preenchido logo abaixo, na região de 84,9–85,0K. Gaps assim agem como ímãs, especialmente depois de uma tentativa frustrada de subir.
O mercado de futuros está quase neutro — o funding mal está positivo, e o número de posições compradas e vendidas é quase igual. Isso não é euforia. É hesitação. Em geral, os investidores experientes se posicionam antes de uma expansão real, não depois de uma máxima com pavio.
Se $BTC se mantiver na região de ~84,4K no fechamento de qualquer candle de 4H, essa queda é apenas parte da estrutura. O objetivo acima continua sendo a região de 88,4K — a extensão projetada a partir da última consolidação. Mas, se perder a região de 84,4K, a leitura de alta de curto prazo deixa de valer.
Minha leitura: a tendência continua de alta, mas esta é uma zona de “prove isso”. O risco recai sobre quem corre atrás da máxima antes de o reteste se concretizar. Toque em $BTC para abrir o gráfico e ver como esse gap se alinha perfeitamente com a zona de invalidação.
Siga-me para receber a atualização quando esse nível se mantiver ou ceder — é aí que começa o próximo movimento de verdade. Que nível você está acompanhando em $BTC agora 👇
⚠️ Isto não é aconselhamento financeiro. Faça sua própria pesquisa.
#BTC #Bitcoin #Crypto #BinanceSquare
Mas o gráfico de 4H mostra que o verdadeiro teste nem começou.
Aquela máxima de 86,9K foi vendida rapidamente — uma clássica caça a stops acima da máxima da faixa, não uma aceitação. O preço voltou direto para baixo dela. E há um gap de alta não preenchido logo abaixo, na região de 84,9–85,0K. Gaps assim agem como ímãs, especialmente depois de uma tentativa frustrada de subir.
O mercado de futuros está quase neutro — o funding mal está positivo, e o número de posições compradas e vendidas é quase igual. Isso não é euforia. É hesitação. Em geral, os investidores experientes se posicionam antes de uma expansão real, não depois de uma máxima com pavio.
Se $BTC se mantiver na região de ~84,4K no fechamento de qualquer candle de 4H, essa queda é apenas parte da estrutura. O objetivo acima continua sendo a região de 88,4K — a extensão projetada a partir da última consolidação. Mas, se perder a região de 84,4K, a leitura de alta de curto prazo deixa de valer.
Minha leitura: a tendência continua de alta, mas esta é uma zona de “prove isso”. O risco recai sobre quem corre atrás da máxima antes de o reteste se concretizar. Toque em $BTC para abrir o gráfico e ver como esse gap se alinha perfeitamente com a zona de invalidação.
Siga-me para receber a atualização quando esse nível se mantiver ou ceder — é aí que começa o próximo movimento de verdade. Que nível você está acompanhando em $BTC agora 👇
⚠️ Isto não é aconselhamento financeiro. Faça sua própria pesquisa.
#BTC #Bitcoin #Crypto #BinanceSquare
70
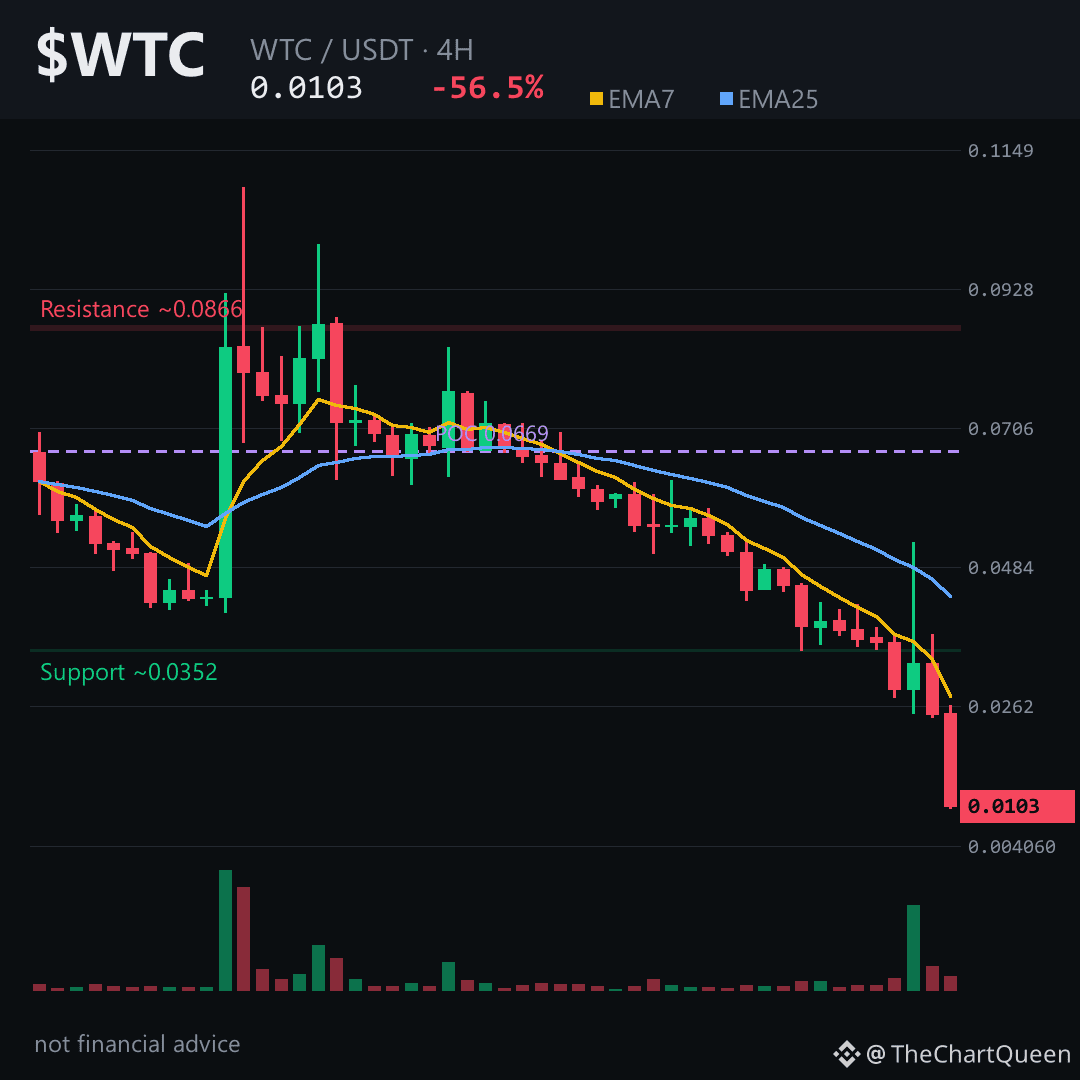
Uma queda de 58% em uma única vela não é uma baixa. Isso é um ativo sendo abandonado. E as últimas 48 horas em $WTC contam uma história que a maioria não quer admitir: não há demanda aqui, só ar.
O gráfico de 4 horas é uma cachoeira. Nove velas vermelhas contra três verdes, com a última cortando de cerca de 0.025 para 0.010 — mais da metade do valor restante foi embora em seis horas. O RSI está enterrado perto de 20 em todos os timeframes. Isso não é sobrevenda. Isso é um mercado que parou de se importar.
Aqui está a parte que deveria preocupar você mais: o mercado de futuros está vazio. Funding estável, open interest zero. Não há shorts se acumulando para um squeeze, nem hedge. Ninguém está lá. O preço está caindo em um vazio, e vazios não quicam como mercados saudáveis.
O swing diário é a leitura mais clara. O preço perto de 0.0105, com a única invalidação relevante por volta de 0.0113. Se essa zona se mantiver como resistência, o caminho continua mais baixo — em direção a 0.0088, o próximo bolsão de liquidez. O gap baixista entre 0.054 e 0.057 agora é quase irrelevante. É assim que a estrutura está quebrada.
Minha leitura: não é um setup de “compre a baixa”. É uma faca caindo, sem participação de futuros para amortecer. O único trade aqui é paciência — ou aceitar que alguns coins não se recuperam só porque estão baratos.
Toque em $WTC para abrir o gráfico e ver como um range diário de 140% realmente parece. Me siga — eu vou te dizer quando essa coisa realmente encontrar um fundo, não só uma pausa.
Em que nível você está acompanhando $WTC antes mesmo de pensar que ele já chegou ao fundo? 👇
Não é aconselhamento financeiro. Faça sua própria pesquisa (DYOR).
#WTC #Crypto #BinanceSquare #Altcoins
Uma queda de 58% em uma única vela não é uma baixa. Isso é um ativo sendo abandonado. E as últimas 48 horas em $WTC contam uma história que a maioria não quer admitir: não há demanda aqui, só ar.
O gráfico de 4 horas é uma cachoeira. Nove velas vermelhas contra três verdes, com a última cortando de cerca de 0.025 para 0.010 — mais da metade do valor restante foi embora em seis horas. O RSI está enterrado perto de 20 em todos os timeframes. Isso não é sobrevenda. Isso é um mercado que parou de se importar.
Aqui está a parte que deveria preocupar você mais: o mercado de futuros está vazio. Funding estável, open interest zero. Não há shorts se acumulando para um squeeze, nem hedge. Ninguém está lá. O preço está caindo em um vazio, e vazios não quicam como mercados saudáveis.
O swing diário é a leitura mais clara. O preço perto de 0.0105, com a única invalidação relevante por volta de 0.0113. Se essa zona se mantiver como resistência, o caminho continua mais baixo — em direção a 0.0088, o próximo bolsão de liquidez. O gap baixista entre 0.054 e 0.057 agora é quase irrelevante. É assim que a estrutura está quebrada.
Minha leitura: não é um setup de “compre a baixa”. É uma faca caindo, sem participação de futuros para amortecer. O único trade aqui é paciência — ou aceitar que alguns coins não se recuperam só porque estão baratos.
Toque em $WTC para abrir o gráfico e ver como um range diário de 140% realmente parece. Me siga — eu vou te dizer quando essa coisa realmente encontrar um fundo, não só uma pausa.
Em que nível você está acompanhando $WTC antes mesmo de pensar que ele já chegou ao fundo? 👇
Não é aconselhamento financeiro. Faça sua própria pesquisa (DYOR).
#WTC #Crypto #BinanceSquare #Altcoins
O gráfico de 4 horas é uma cachoeira. Nove velas vermelhas contra três verdes, com a última cortando de cerca de 0.025 para 0.010 — mais da metade do valor restante foi embora em seis horas. O RSI está enterrado perto de 20 em todos os timeframes. Isso não é sobrevenda. Isso é um mercado que parou de se importar.
Aqui está a parte que deveria preocupar você mais: o mercado de futuros está vazio. Funding estável, open interest zero. Não há shorts se acumulando para um squeeze, nem hedge. Ninguém está lá. O preço está caindo em um vazio, e vazios não quicam como mercados saudáveis.
O swing diário é a leitura mais clara. O preço perto de 0.0105, com a única invalidação relevante por volta de 0.0113. Se essa zona se mantiver como resistência, o caminho continua mais baixo — em direção a 0.0088, o próximo bolsão de liquidez. O gap baixista entre 0.054 e 0.057 agora é quase irrelevante. É assim que a estrutura está quebrada.
Minha leitura: não é um setup de “compre a baixa”. É uma faca caindo, sem participação de futuros para amortecer. O único trade aqui é paciência — ou aceitar que alguns coins não se recuperam só porque estão baratos.
Toque em $WTC para abrir o gráfico e ver como um range diário de 140% realmente parece. Me siga — eu vou te dizer quando essa coisa realmente encontrar um fundo, não só uma pausa.
Em que nível você está acompanhando $WTC antes mesmo de pensar que ele já chegou ao fundo? 👇
Não é aconselhamento financeiro. Faça sua própria pesquisa (DYOR).
#WTC #Crypto #BinanceSquare #Altcoins
4
Um dia de -57% é o começo do fim ou o fim do começo para $PYR?
Aquela única vela vermelha às 20:00 conta toda a história. O preço abriu perto de 0.040 e despencou para 0.019 em um único período de 4 horas. Isso não é uma pressão vendedora normal. É uma ruptura estrutural.
O gráfico de 4H mostra um FVG de baixa entre 0.044 e 0.048. O preço atravessou essa zona com convicção. Agora, esse gap funciona como um teto, não como um piso.
O RSI no gráfico de 4H está em 12 — profundamente sobrevendido. Mas sobrevendido não significa reversão. Em uma tendência de baixa tão violenta, o ativo pode continuar sobrevendido por dias.
A zona de pivô de 4H fica em torno de 0.0211. Se o preço não conseguir recuperar esse nível, o próximo alvo está perto de 0.0192. Se perder esse suporte, o gráfico se abre em direção a 0.0133 — um nível semanal que de repente parece estar ao alcance.
O ponto de invalidação é claro: um fechamento de 4H de volta acima da região de 0.0222 me diria que a pressão vendedora imediata está se esgotando. Até lá, o caminho de menor resistência continua sendo para baixo.
Minha leitura: é uma faca caindo. A zona de 0.019–0.021 é onde o preço ou se estabiliza ou dá mais uma pernada para baixo. Prefiro observar esse nível a tentar agarrar a faca.
Siga-me para ver minha análise atualizada quando 0.019 for testado — esse é o nível que nos dirá o que vem a seguir.
Qual é a sua leitura sincera sobre $PYR — território de repique de gato morto ou capitulação real? 👇
#PYR #Crypto #Altcoins #BinanceSquare
⚠️ Isto não é aconselhamento financeiro. Faça sua própria pesquisa (DYOR).
Um dia de -57% é o começo do fim ou o fim do começo para $PYR?
Aquela única vela vermelha às 20:00 conta toda a história. O preço abriu perto de 0.040 e despencou para 0.019 em um único período de 4 horas. Isso não é uma pressão vendedora normal. É uma ruptura estrutural.
O gráfico de 4H mostra um FVG de baixa entre 0.044 e 0.048. O preço atravessou essa zona com convicção. Agora, esse gap funciona como um teto, não como um piso.
O RSI no gráfico de 4H está em 12 — profundamente sobrevendido. Mas sobrevendido não significa reversão. Em uma tendência de baixa tão violenta, o ativo pode continuar sobrevendido por dias.
A zona de pivô de 4H fica em torno de 0.0211. Se o preço não conseguir recuperar esse nível, o próximo alvo está perto de 0.0192. Se perder esse suporte, o gráfico se abre em direção a 0.0133 — um nível semanal que de repente parece estar ao alcance.
O ponto de invalidação é claro: um fechamento de 4H de volta acima da região de 0.0222 me diria que a pressão vendedora imediata está se esgotando. Até lá, o caminho de menor resistência continua sendo para baixo.
Minha leitura: é uma faca caindo. A zona de 0.019–0.021 é onde o preço ou se estabiliza ou dá mais uma pernada para baixo. Prefiro observar esse nível a tentar agarrar a faca.
Siga-me para ver minha análise atualizada quando 0.019 for testado — esse é o nível que nos dirá o que vem a seguir.
Qual é a sua leitura sincera sobre $PYR — território de repique de gato morto ou capitulação real? 👇
#PYR #Crypto #Altcoins #BinanceSquare
⚠️ Isto não é aconselhamento financeiro. Faça sua própria pesquisa (DYOR).
Aquela única vela vermelha às 20:00 conta toda a história. O preço abriu perto de 0.040 e despencou para 0.019 em um único período de 4 horas. Isso não é uma pressão vendedora normal. É uma ruptura estrutural.
O gráfico de 4H mostra um FVG de baixa entre 0.044 e 0.048. O preço atravessou essa zona com convicção. Agora, esse gap funciona como um teto, não como um piso.
O RSI no gráfico de 4H está em 12 — profundamente sobrevendido. Mas sobrevendido não significa reversão. Em uma tendência de baixa tão violenta, o ativo pode continuar sobrevendido por dias.
A zona de pivô de 4H fica em torno de 0.0211. Se o preço não conseguir recuperar esse nível, o próximo alvo está perto de 0.0192. Se perder esse suporte, o gráfico se abre em direção a 0.0133 — um nível semanal que de repente parece estar ao alcance.
O ponto de invalidação é claro: um fechamento de 4H de volta acima da região de 0.0222 me diria que a pressão vendedora imediata está se esgotando. Até lá, o caminho de menor resistência continua sendo para baixo.
Minha leitura: é uma faca caindo. A zona de 0.019–0.021 é onde o preço ou se estabiliza ou dá mais uma pernada para baixo. Prefiro observar esse nível a tentar agarrar a faca.
Siga-me para ver minha análise atualizada quando 0.019 for testado — esse é o nível que nos dirá o que vem a seguir.
Qual é a sua leitura sincera sobre $PYR — território de repique de gato morto ou capitulação real? 👇
#PYR #Crypto #Altcoins #BinanceSquare
⚠️ Isto não é aconselhamento financeiro. Faça sua própria pesquisa (DYOR).
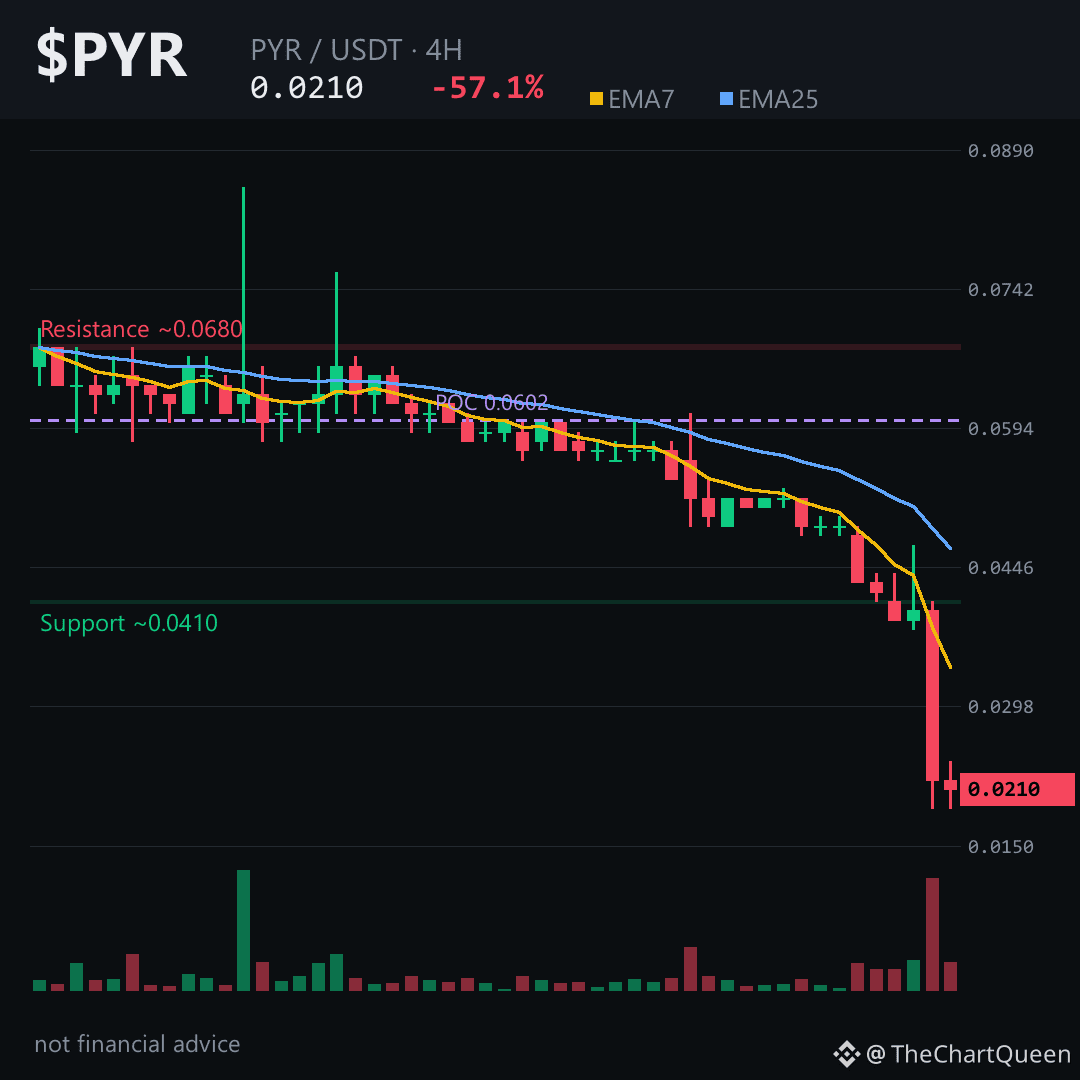
2
O que acontece quando uma moeda perde 63% em um único dia e ainda não encontrou um piso?
Essa é exatamente a pergunta que o $VIB está forçando agora.
Uma faixa intraday de 288% diz tudo sobre o medo neste mercado.
O preço caiu da região de 0.015 para a área de 0.002 em cerca de 24 horas — isso não é uma correção, é uma liquidação total.
Os vendedores estão no controle absoluto. As métricas de futuros mostram zero open interest e zero funding — a galera alavancada desapareceu, deixando o pânico no spot fazer o trabalho.
**Os Níveis Que Importam:**
O $VIB está pairando na região de 0.00223, e a única invalidação que realmente importa é a zona de 0.00235.
Se o preço não conseguir recuperar isso em um fechamento de 4 horas, o caminho de menor resistência aponta para a área de 0.00203.
Abaixo disso, há um desequilíbrio de baixa entre aproximadamente 0.0102 e 0.0089 — um ímã, mas bem longe do preço atual.
A história imediata é mais simples: é uma faca caindo até que a região de 0.00235 seja retomada.
Toque em $VIB para abrir o gráfico e ver como essa zona de invalidação está limpa.
**Minha leitura:**
Existe potencial de repique, mas é fraco — o momentum ainda está apontando para baixo, e o volume sugere que nenhum comprador de verdade entrou ainda.
O risco não é perder uma reversão, e sim pegar um repique de “dead-cat bounce” que apaga em poucas horas.
Vou continuar monitorando a zona de 0.00235 no VIB — se começar a agir como teto em vez de piso, isso nos diz bastante sobre o próximo movimento. Siga para a atualização desse nível enquanto ele se desenvolve.
Qual nível você está observando neste gráfico — a invalidação, ou o gap abaixo? 👇
⚠️ Não é conselho financeiro. DYOR.
#VIB #Viberate #Crypto #BinanceSquare
O que acontece quando uma moeda perde 63% em um único dia e ainda não encontrou um piso?
Essa é exatamente a pergunta que o $VIB está forçando agora.
Uma faixa intraday de 288% diz tudo sobre o medo neste mercado.
O preço caiu da região de 0.015 para a área de 0.002 em cerca de 24 horas — isso não é uma correção, é uma liquidação total.
Os vendedores estão no controle absoluto. As métricas de futuros mostram zero open interest e zero funding — a galera alavancada desapareceu, deixando o pânico no spot fazer o trabalho.
**Os Níveis Que Importam:**
O $VIB está pairando na região de 0.00223, e a única invalidação que realmente importa é a zona de 0.00235.
Se o preço não conseguir recuperar isso em um fechamento de 4 horas, o caminho de menor resistência aponta para a área de 0.00203.
Abaixo disso, há um desequilíbrio de baixa entre aproximadamente 0.0102 e 0.0089 — um ímã, mas bem longe do preço atual.
A história imediata é mais simples: é uma faca caindo até que a região de 0.00235 seja retomada.
Toque em $VIB para abrir o gráfico e ver como essa zona de invalidação está limpa.
**Minha leitura:**
Existe potencial de repique, mas é fraco — o momentum ainda está apontando para baixo, e o volume sugere que nenhum comprador de verdade entrou ainda.
O risco não é perder uma reversão, e sim pegar um repique de “dead-cat bounce” que apaga em poucas horas.
Vou continuar monitorando a zona de 0.00235 no VIB — se começar a agir como teto em vez de piso, isso nos diz bastante sobre o próximo movimento. Siga para a atualização desse nível enquanto ele se desenvolve.
Qual nível você está observando neste gráfico — a invalidação, ou o gap abaixo? 👇
⚠️ Não é conselho financeiro. DYOR.
#VIB #Viberate #Crypto #BinanceSquare
Essa é exatamente a pergunta que o $VIB está forçando agora.
Uma faixa intraday de 288% diz tudo sobre o medo neste mercado.
O preço caiu da região de 0.015 para a área de 0.002 em cerca de 24 horas — isso não é uma correção, é uma liquidação total.
Os vendedores estão no controle absoluto. As métricas de futuros mostram zero open interest e zero funding — a galera alavancada desapareceu, deixando o pânico no spot fazer o trabalho.
**Os Níveis Que Importam:**
O $VIB está pairando na região de 0.00223, e a única invalidação que realmente importa é a zona de 0.00235.
Se o preço não conseguir recuperar isso em um fechamento de 4 horas, o caminho de menor resistência aponta para a área de 0.00203.
Abaixo disso, há um desequilíbrio de baixa entre aproximadamente 0.0102 e 0.0089 — um ímã, mas bem longe do preço atual.
A história imediata é mais simples: é uma faca caindo até que a região de 0.00235 seja retomada.
Toque em $VIB para abrir o gráfico e ver como essa zona de invalidação está limpa.
**Minha leitura:**
Existe potencial de repique, mas é fraco — o momentum ainda está apontando para baixo, e o volume sugere que nenhum comprador de verdade entrou ainda.
O risco não é perder uma reversão, e sim pegar um repique de “dead-cat bounce” que apaga em poucas horas.
Vou continuar monitorando a zona de 0.00235 no VIB — se começar a agir como teto em vez de piso, isso nos diz bastante sobre o próximo movimento. Siga para a atualização desse nível enquanto ele se desenvolve.
Qual nível você está observando neste gráfico — a invalidação, ou o gap abaixo? 👇
⚠️ Não é conselho financeiro. DYOR.
#VIB #Viberate #Crypto #BinanceSquare
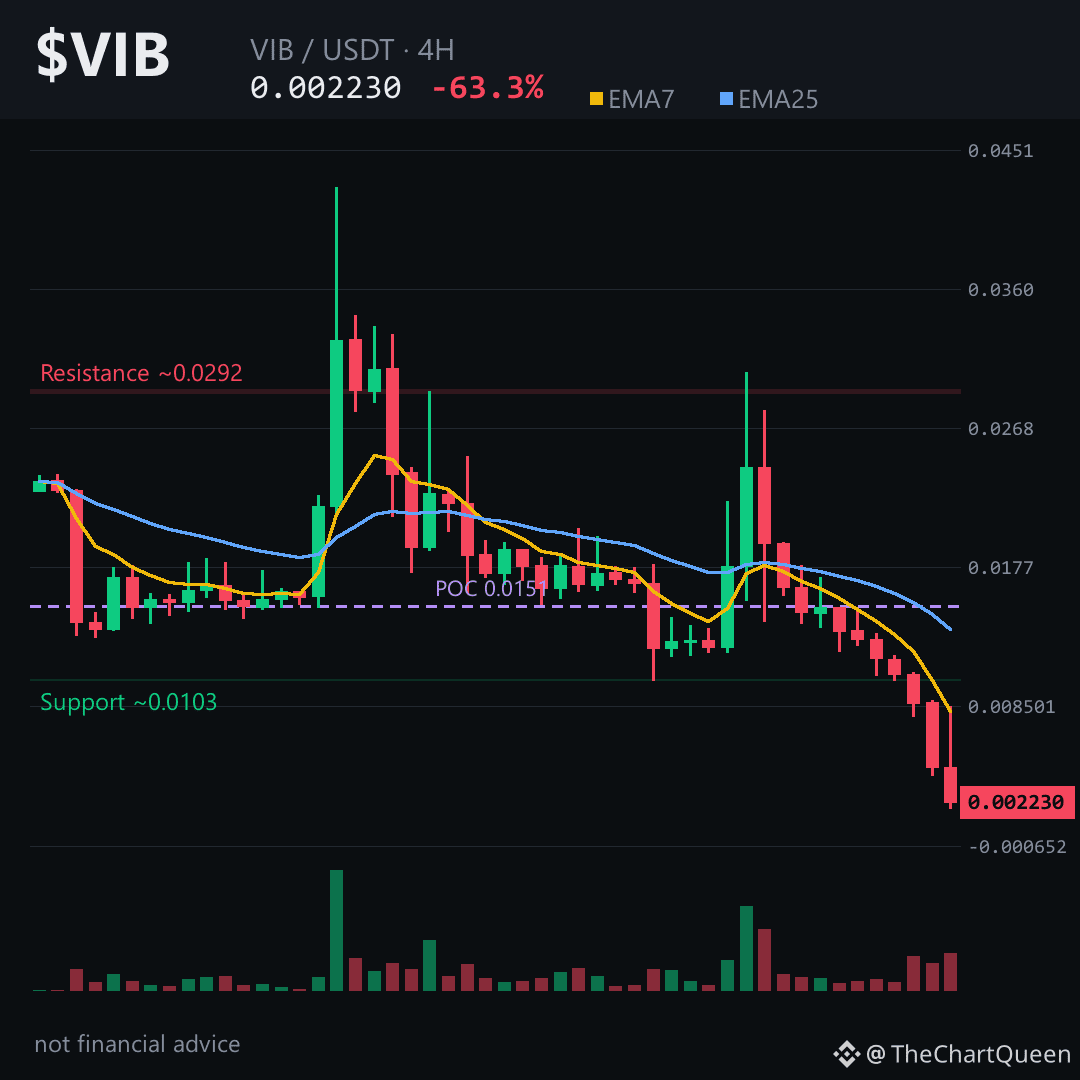
1
12
Todo mundo vê uma vela de -64% e acha que o fundo deve estar perto.
Inverta isso: o gráfico diz que o fundo nem foi testado ainda.
$BETA não está consolidando — está rompendo e vazando por todos os níveis. A estrutura em 4H é uma escada de topos mais baixos e fundos mais feios. RSI enterrado em 17, mas sobrevenda é uma condição, não um sinal de reversão.
Sem funding, sem open interest — sem uma multidão alavancada para ser espremida. Isso não é "capitulação concluída". É ausência de ordens de compra entrando na frente do movimento.
O diário está pior. O preço fica a quilômetros abaixo de todas as médias móveis, e o gap não preenchido acima — aproximadamente de 0.00230 a 0.00286 — funciona como teto, não como um ímã. Até esse gap ser revisitado, qualquer repique é só ruído dentro de uma tendência de baixa semanal que ainda não encontrou um piso.
O nível de 4H que estou observando: ~0.00038 é a linha divisória. Enquanto $BETA permanecer abaixo disso, o caminho de menor resistência aponta para ~0.00033. Um fechamento em 4H de volta acima de ~0.00038 me diz que a faca finalmente parou de cair.
Minha leitura: este gráfico ainda está buscando liquidez, não uma reversão. O risco não é perder o fundo — é pegar um repique que nunca vem.
Toque em $BETA para abrir o gráfico e veja esses níveis por conta própria.
Me siga — vou atualizar essa leitura se a estrutura mudar nessa zona de ~0.00038.
Em que nível você está de olho no BETA agora? 👇
⚠️ Não é conselho financeiro. DYOR.
#BETA #Crypto #BinanceSquare
Todo mundo vê uma vela de -64% e acha que o fundo deve estar perto.
Inverta isso: o gráfico diz que o fundo nem foi testado ainda.
$BETA não está consolidando — está rompendo e vazando por todos os níveis. A estrutura em 4H é uma escada de topos mais baixos e fundos mais feios. RSI enterrado em 17, mas sobrevenda é uma condição, não um sinal de reversão.
Sem funding, sem open interest — sem uma multidão alavancada para ser espremida. Isso não é "capitulação concluída". É ausência de ordens de compra entrando na frente do movimento.
O diário está pior. O preço fica a quilômetros abaixo de todas as médias móveis, e o gap não preenchido acima — aproximadamente de 0.00230 a 0.00286 — funciona como teto, não como um ímã. Até esse gap ser revisitado, qualquer repique é só ruído dentro de uma tendência de baixa semanal que ainda não encontrou um piso.
O nível de 4H que estou observando: ~0.00038 é a linha divisória. Enquanto $BETA permanecer abaixo disso, o caminho de menor resistência aponta para ~0.00033. Um fechamento em 4H de volta acima de ~0.00038 me diz que a faca finalmente parou de cair.
Minha leitura: este gráfico ainda está buscando liquidez, não uma reversão. O risco não é perder o fundo — é pegar um repique que nunca vem.
Toque em $BETA para abrir o gráfico e veja esses níveis por conta própria.
Me siga — vou atualizar essa leitura se a estrutura mudar nessa zona de ~0.00038.
Em que nível você está de olho no BETA agora? 👇
⚠️ Não é conselho financeiro. DYOR.
#BETA #Crypto #BinanceSquare
Inverta isso: o gráfico diz que o fundo nem foi testado ainda.
$BETA não está consolidando — está rompendo e vazando por todos os níveis. A estrutura em 4H é uma escada de topos mais baixos e fundos mais feios. RSI enterrado em 17, mas sobrevenda é uma condição, não um sinal de reversão.
Sem funding, sem open interest — sem uma multidão alavancada para ser espremida. Isso não é "capitulação concluída". É ausência de ordens de compra entrando na frente do movimento.
O diário está pior. O preço fica a quilômetros abaixo de todas as médias móveis, e o gap não preenchido acima — aproximadamente de 0.00230 a 0.00286 — funciona como teto, não como um ímã. Até esse gap ser revisitado, qualquer repique é só ruído dentro de uma tendência de baixa semanal que ainda não encontrou um piso.
O nível de 4H que estou observando: ~0.00038 é a linha divisória. Enquanto $BETA permanecer abaixo disso, o caminho de menor resistência aponta para ~0.00033. Um fechamento em 4H de volta acima de ~0.00038 me diz que a faca finalmente parou de cair.
Minha leitura: este gráfico ainda está buscando liquidez, não uma reversão. O risco não é perder o fundo — é pegar um repique que nunca vem.
Toque em $BETA para abrir o gráfico e veja esses níveis por conta própria.
Me siga — vou atualizar essa leitura se a estrutura mudar nessa zona de ~0.00038.
Em que nível você está de olho no BETA agora? 👇
⚠️ Não é conselho financeiro. DYOR.
#BETA #Crypto #BinanceSquare
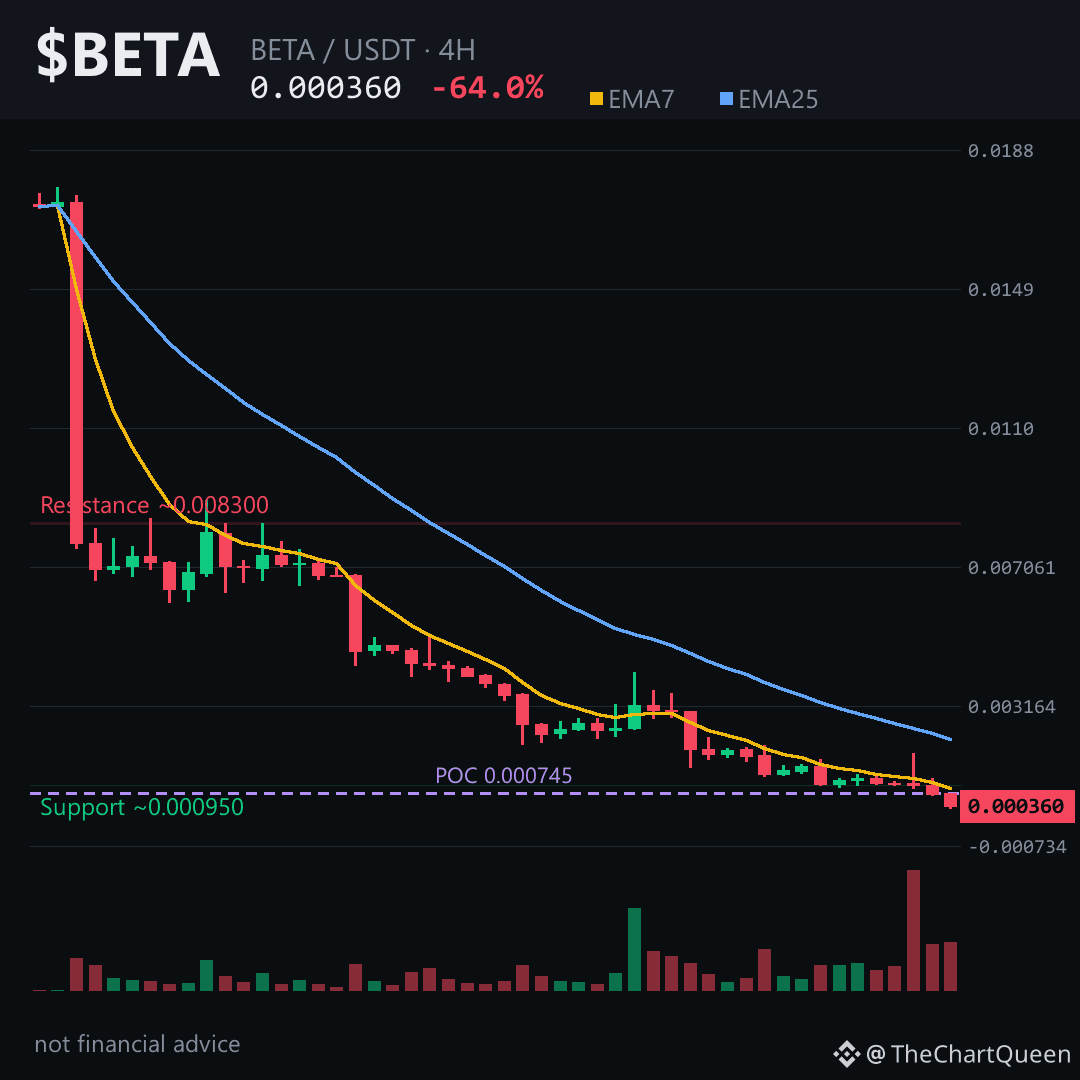
1
O que acontece quando uma moeda cai 66% em um único dia e ainda não encontrou um fundo?
Essa é a pergunta que paira sobre $NFP neste momento. Os candles de 4 horas contam uma história brutal: duas sessões consecutivas de queda, de 37% e 34%, com o preço agora perto de 0.00181. Mas aqui está o detalhe que muitos não percebem — o RSI de 4 horas está em 12.89. Isso não é apenas sobrevenda. É um nível estatisticamente raro, em que as recuperações costumam ser violentas antes de a tendência de baixa voltar.
O momentum é claramente baixista — todas as médias móveis apontam para baixo, e o preço mais negociado está bem acima, perto de 0.00678. Quase todo mundo que comprou recentemente está no prejuízo. Esse tipo de posicionamento costuma levar a repiques fracos, enquanto os investidores presos tentam sair em qualquer alta.
O nível mais importante neste momento está na região de 0.00191. Se $NFP não conseguir recuperar essa zona, o caminho de menor resistência continua sendo para baixo, em direção à região de 0.00165. Mas um fechamento de 4 horas acima desse nível poderia levar essa recuperação mais longe do que os vendidos esperam.
Minha leitura: a tendência é de baixa, mas o elástico está esticado. Abrir posições vendidas agora parece tardio; esperar por uma recuperação frustrada perto da resistência oferece um cenário mais claro.
Que nível você está acompanhando em $NFP neste momento? 👇
Siga para acompanhar a próxima análise deste gráfico.
⚠️ Isto não é aconselhamento financeiro. Faça sua própria pesquisa.
#NFP #Crypto #BinanceSquare #Altcoins
O que acontece quando uma moeda cai 66% em um único dia e ainda não encontrou um fundo?
Essa é a pergunta que paira sobre $NFP neste momento. Os candles de 4 horas contam uma história brutal: duas sessões consecutivas de queda, de 37% e 34%, com o preço agora perto de 0.00181. Mas aqui está o detalhe que muitos não percebem — o RSI de 4 horas está em 12.89. Isso não é apenas sobrevenda. É um nível estatisticamente raro, em que as recuperações costumam ser violentas antes de a tendência de baixa voltar.
O momentum é claramente baixista — todas as médias móveis apontam para baixo, e o preço mais negociado está bem acima, perto de 0.00678. Quase todo mundo que comprou recentemente está no prejuízo. Esse tipo de posicionamento costuma levar a repiques fracos, enquanto os investidores presos tentam sair em qualquer alta.
O nível mais importante neste momento está na região de 0.00191. Se $NFP não conseguir recuperar essa zona, o caminho de menor resistência continua sendo para baixo, em direção à região de 0.00165. Mas um fechamento de 4 horas acima desse nível poderia levar essa recuperação mais longe do que os vendidos esperam.
Minha leitura: a tendência é de baixa, mas o elástico está esticado. Abrir posições vendidas agora parece tardio; esperar por uma recuperação frustrada perto da resistência oferece um cenário mais claro.
Que nível você está acompanhando em $NFP neste momento? 👇
Siga para acompanhar a próxima análise deste gráfico.
⚠️ Isto não é aconselhamento financeiro. Faça sua própria pesquisa.
#NFP #Crypto #BinanceSquare #Altcoins
Essa é a pergunta que paira sobre $NFP neste momento. Os candles de 4 horas contam uma história brutal: duas sessões consecutivas de queda, de 37% e 34%, com o preço agora perto de 0.00181. Mas aqui está o detalhe que muitos não percebem — o RSI de 4 horas está em 12.89. Isso não é apenas sobrevenda. É um nível estatisticamente raro, em que as recuperações costumam ser violentas antes de a tendência de baixa voltar.
O momentum é claramente baixista — todas as médias móveis apontam para baixo, e o preço mais negociado está bem acima, perto de 0.00678. Quase todo mundo que comprou recentemente está no prejuízo. Esse tipo de posicionamento costuma levar a repiques fracos, enquanto os investidores presos tentam sair em qualquer alta.
O nível mais importante neste momento está na região de 0.00191. Se $NFP não conseguir recuperar essa zona, o caminho de menor resistência continua sendo para baixo, em direção à região de 0.00165. Mas um fechamento de 4 horas acima desse nível poderia levar essa recuperação mais longe do que os vendidos esperam.
Minha leitura: a tendência é de baixa, mas o elástico está esticado. Abrir posições vendidas agora parece tardio; esperar por uma recuperação frustrada perto da resistência oferece um cenário mais claro.
Que nível você está acompanhando em $NFP neste momento? 👇
Siga para acompanhar a próxima análise deste gráfico.
⚠️ Isto não é aconselhamento financeiro. Faça sua própria pesquisa.
#NFP #Crypto #BinanceSquare #Altcoins
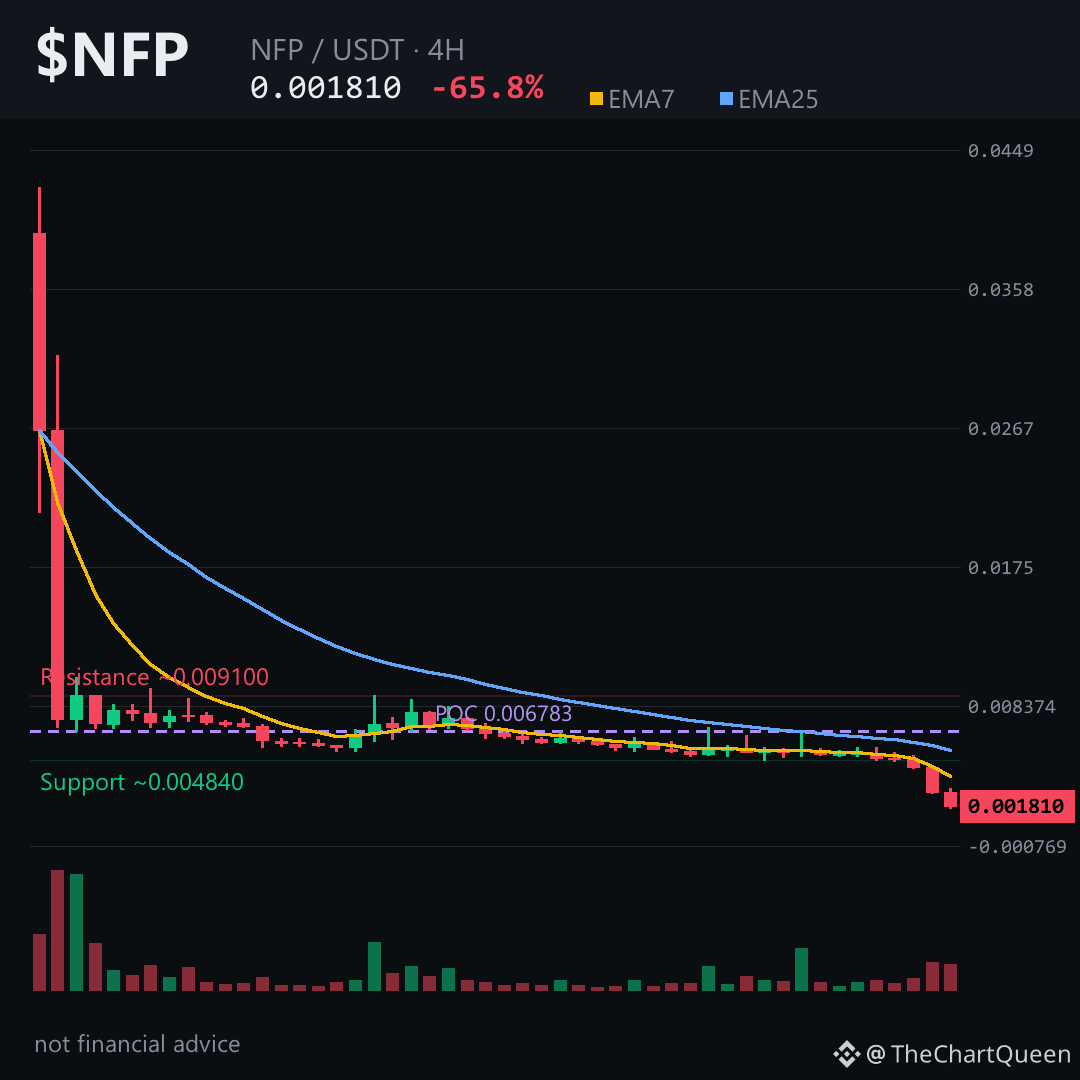
5
Inicia sessão para explorar mais conteúdos
Junta-te a utilizadores de criptomoedas de todo o mundo na Binance Square
⚡️ Obtém informações úteis e recentes sobre criptomoedas.
💬 Com a confiança da maior exchange de criptomoedas do mundo.
👍 Descobre perspetivas reais de criadores verificados.
E-mail/Número de telefone
Tópicos em Tendência
BinanceLaunchesBinanceIntelligence
69,026 visualizações
867 a discutir
🚨 A BINANCE ACABOU DE INTEGRAR IA DIRETAMENTE NA EXCHANGE — E ISTO PODE MUDAR A FORMA COMO OS INVESTIDORES DE RETALHO NEGOCIAM.
A Binance lançou oficialmente a Binance Intelligence, uma nova camada de IA integrada no ecossistema Binance. Combina três produtos:
Binance AI para utilizadores do dia a dia,
Binance AI Pro para fluxos de trabalho de negociação automatizados,
e Agent OS para programadores que criam agentes financeiros.
O que deve interessar aos traders?
A Binance AI pode apresentar resumos do mercado, alertas inteligentes, resumos de lucros e perdas (PnL) e informações personalizadas, enquanto a AI Pro foi concebida para transformar uma ideia de negociação escrita em linguagem simples num fluxo de trabalho de estratégia visual.
Isto significa que a próxima fase da concorrência entre exchanges talvez já não seja:
taxas mais baixas vs. maior liquidez.
Pode passar a ser:
quem oferece aos traders a melhor camada de execução com IA.
Se a Binance Intelligence realmente levar a uma maior atividade dos utilizadores, a estratégias automatizadas e a uma frequência de negociação mais elevada, fique de olho primeiro na $BNB.
Adoção da IA ↑
→ envolvimento com a Binance ↑
→ atividade de negociação ↑
→ narrativa do ecossistema ganha força.
O catalisador que acompanharia agora:
lançamento global + lançamento da AI Pro + adoção mensurável pelos utilizadores.
Porque quando a IA deixa de apenas dizer o que está a acontecer no mercado…
…e começa a ajudar a construir a própria operação?
É aí que isto se torna muito mais do que apenas mais um chatbot. 👀
#binancelaunchesbinanceintelligence #EvernorthXRPTreasuryCompletesSPACMerger #ADAGains10%Above$0.27 #ETHUp70%InQ3ButLiquidityFalls #EthStakingExitQueueHits2026High
KimHotbae
·24 gostos
·30.7k visualizações
StriveBuys2000BTCFor$169M
291 visualizações
34 a discutir
EvernorthXRPTreasuryCompletesSPACMerger
53,840 visualizações
616 a discutir