
Jimbo Finance
23 Publicações

Jimbo Finance
Denunciar
Bloquear Utilizador
https://x.com/Jimbo_Finance
Crypto, Finance Content Creator, Airdrop Guides & Trading Insights, Macro, Investing
0 A seguir
22 Seguidores
22 Gostaram
Publicações
Artigo
Ver tradução
The Macro Trading Playbook: Data Thesis TradeMost traders wait for the number.
I want a plan before it hits.
Over a stretch of about two weeks I traded around NFP, PPI, ISM, JPY volatility, Nasdaq, Bitcoin, Solana, and gold. The point was not to call every candle. It was to know what the market was waiting for, how a surprise could move it, and where I wanted to be if volatility showed up.
The sequence I use is simple:
Calendar → expectations → scenario → level → invalidation.
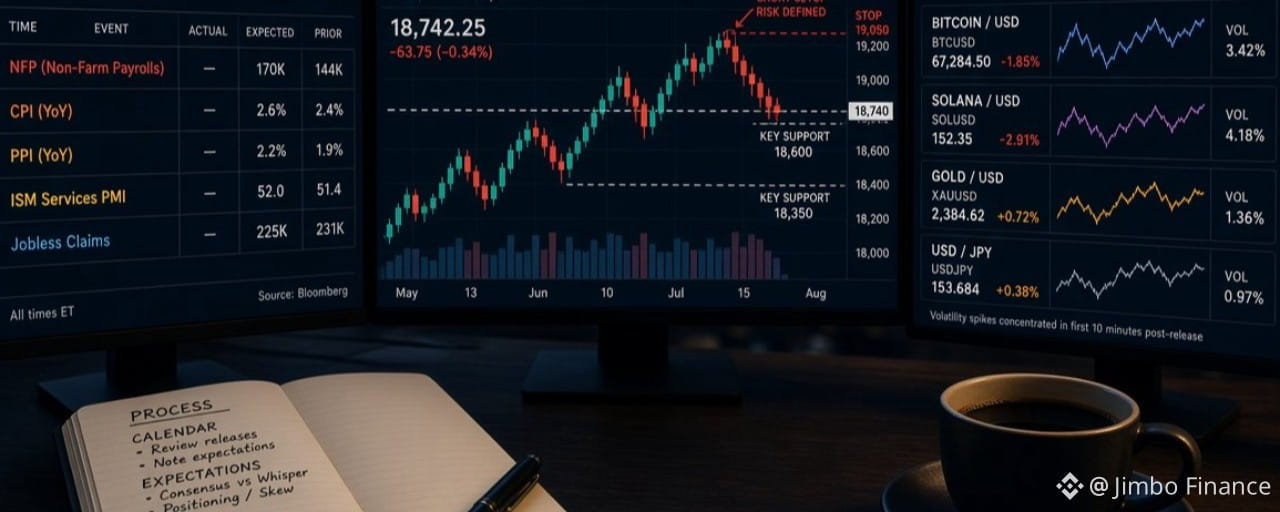
1. Start with the calendar
Before I look for an entry, I look at the week.
NFP. CPI. PPI. ISM. Jobless claims. Central-bank decisions. Treasury auctions. Geopolitics.
I do not want to discover a major release after I am already in a position. I want to know when the market has a reason to move.
The print itself is not enough. Markets trade actual versus expected. A “good” number can still sell off if it was supposed to be better. The surprise is what creates the volume.
I also do not treat every event the same way. There are three different jobs:
Position before the event — you have a thesis and you accept event risk.Trade the reaction — you wait to see how price responds, then participate.Trade the volatility — you are not married to one direction; you are prepared for a large enough move and a level you can manage.
The trades below are examples of those three jobs. Not every winner belongs in one combined scorecard.
2. Nasdaq Short — August 31
Building a scenario before the labor data
The first setup came from the backdrop, not from a single headline.
Brent was making higher highs and higher lows. DXY looked ready to firm after a pullback. The market was opening after Jackson Hole. Labor data was ahead.
That mix made a Nasdaq short interesting.
Price was around 29,400–29,420, with a level near 29,397 and lower support around 29,352. I shorted there and treated a move against the thesis as invalidation. At one point I moved the stop to entry.
I do not have a final PnL in my records, so I am not going to invent one.
What the trade is useful for is the timing. The release does not have to happen first. You can build the scenario days ahead and let price action decide whether the market gives you a location.
3. JPY + ISM — Trading the Volatility
Trading the volatility, not the guess
A few days later the focus shifted to Japan and US services data.
USD/JPY had already been violent: from above 160 toward 158.75, then later from around 160.40 toward 156.50. ISM Services printed 55.4 against an expectation near 54.3.
I was not trying to nail the ISM print. I was trading the fact that the event could produce a reaction I could manage.
The positions from that day were small and documented: roughly $200 in total, with individual tickets around +$47 and +$75.
That is a different question from “the number will be X, so price must go Y.” The question was: can this event create a move large enough to trade, with risk I have already defined?
4. The NFP Trade — BTC, SOL, Gold & Nasdaq
The number was wrong. The process still worked.
This was the main lesson of the period.
Before the release I built a basket: Bitcoin, Solana, gold, and Nasdaq. The idea was to be in position before the print rather than chase the first candle after it.
Approximate results from the posts:
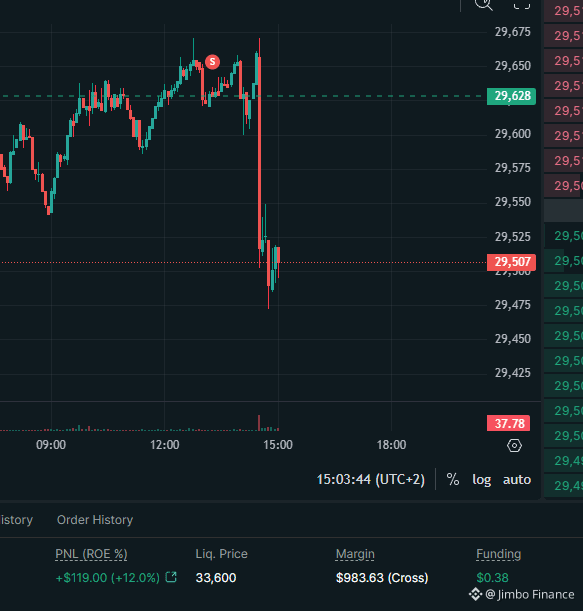
Nasdaq: +$119SOL: +$140Gold: +$175BTC: +$185
About $600 in total.
The four names were not a single identical bet. Soft labor can ease rate expectations, weigh on the dollar, and support gold. Risk assets can catch the liquidity and the first directional impulse around the print. I wanted participation in that event-move, with risk split across expressions instead of one all-in ticker. If one leg failed the thesis, I still wanted a defined exit on each name. I did not treat them as one fused position.
Now the honest part.
The payrolls number was not what I had described beforehand. It came in at +55K versus +162K expected. I am not going to pretend I predicted the data. I didn’t.
The trade still worked because I had a scenario, an invalidation, defined risk, and a plan for the reaction. The market produced a sharp move. I was already in it. That is a different activity from inventing a strategy five seconds after the candle has gone.
5. The PPI Trade — Preparing Before the Number
A directional thesis, placed before the print
Then came inflation.
I was leaning hotter based on the macro picture I had been following:
Hotter inflation → more pressure on yields and Fed expectations → downside pressure on risk.
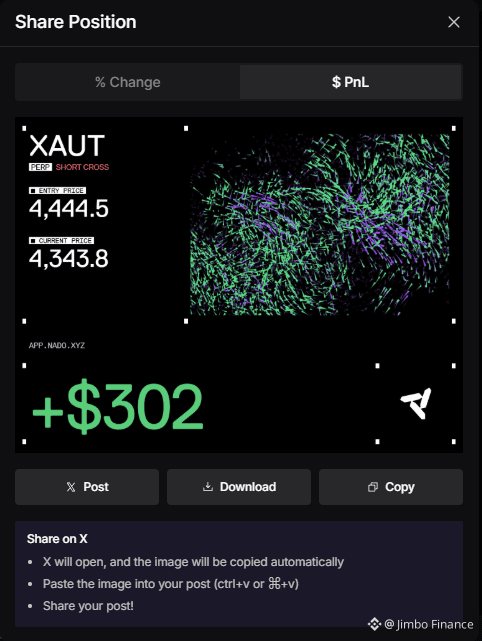
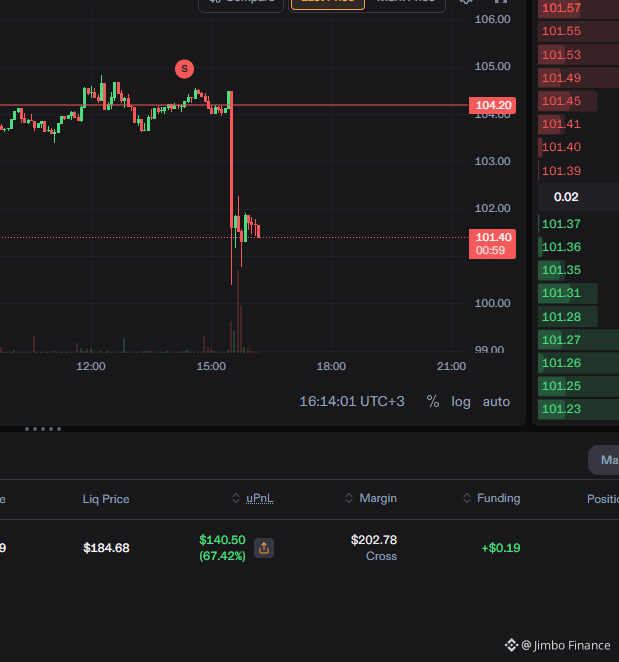
I positioned before the release. One SOL short was opened around 104.52; price later traded near 101.30, about +33.9% on that position. I also traded an XAUT short (about +$302) and BTC with 25x (about +$371). The posts put the PPI set of trades around +$600.
PPI printed 5.4% YoY versus 5.3% expected. That is a small beat, not a shock. I am not going to dress it up as a perfect call. It did land on the hotter side of what the market was holding, which was the side I had prepared for.
This is the version of macro I actually like. Not staring at a random candle. Asking:
What is the market waiting for?What happens if the data is hotter?What happens if it is cooler?Where am I wrong?
6. What I will not do with the scorecard
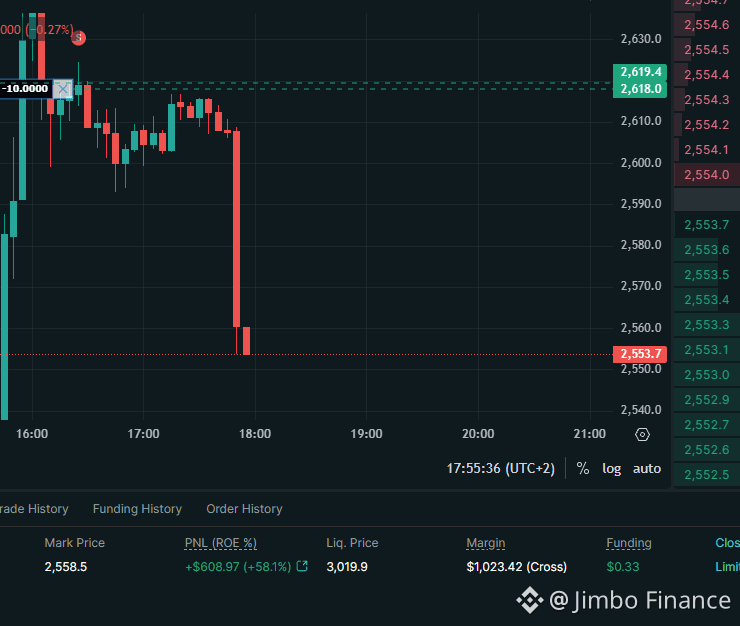
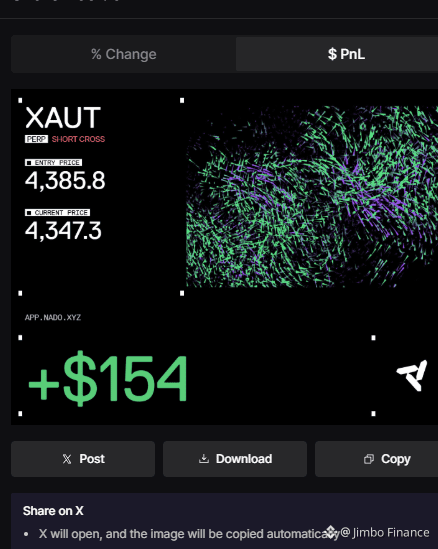
After PPI I kept trading the same environment. One later position made about +$609 as price moved from around 2,618 toward 2,554. A separate XAUT short from about 4,385.8 to 4,347.3 made about +$154.
Those were different trades. I am not folding them into the PPI result to make one week look cleaner than it was.
Track the tickets as they happened. Do not build a “perfect trade” out of unrelated fills.
7. The Framework
1. Find the catalyst.
What can force a decision this week? NFP, CPI, PPI, ISM, BOJ, Fed, a Treasury auction.
2. Read the expectation, not just the number.
The market prices the surprise. Consensus and positioning matter more than whether the headline “looks strong.”
3. Write two scenarios.
Hotter/stronger. Cooler/weaker. Then sketch how BTC, SOL, gold, Nasdaq, DXY, yields, and FX could respond in each case.
4. Take the chart’s location, not the narrative’s.
Macro is the reason to look. Price is the place to act. I do not short because CPI “might be hot.” I short where the risk is defined.
5. Decide invalidation in advance.
If the thesis is wrong, I am out. Sometimes that is a tight stop. Sometimes it is stop-to-entry. Sometimes it is cutting size. The point is that the exit is chosen before the number forces an emotional one.
6. Do not overstay the news move.
These trades can travel quickly. I do not need the entire candle. If the market pays the scenario, I take it.
I was not running a stack of indicators. The stack was:
Macro → liquidity → yields → DXY → expectations → price → risk.
That is enough.
8. The lesson
The lesson is not “macro works.”
Most people see the sequence as: print → candle → “why is BTC dumping?”
I want the questions asked earlier:
What is expected?
What would surprise?
What happens if it does?
Where is the entry?
Where am I wrong?
How much am I willing to lose?
Some of the calls in this period were right. Some were not. The job is not to predict every release. The job is to already have a plan when the market starts moving.
Don’t wait for the tape to explain what just happened.
Study what it is waiting for. Then write the plan first.
The Macro Trading Playbook: Data Thesis Trade
Most traders wait for the number.
I want a plan before it hits.
Over a stretch of about two weeks I traded around NFP, PPI, ISM, JPY volatility, Nasdaq, Bitcoin, Solana, and gold. The point was not to call every candle. It was to know what the market was waiting for, how a surprise could move it, and where I wanted to be if volatility showed up.
The sequence I use is simple:
Calendar → expectations → scenario → level → invalidation.
1. Start with the calendar
Before I look for an entry, I look at the week.
NFP. CPI. PPI. ISM. Jobless claims. Central-bank decisions. Treasury auctions. Geopolitics.
I do not want to discover a major release after I am already in a position. I want to know when the market has a reason to move.
The print itself is not enough. Markets trade actual versus expected. A “good” number can still sell off if it was supposed to be better. The surprise is what creates the volume.
I also do not treat every event the same way. There are three different jobs:
Position before the event — you have a thesis and you accept event risk.Trade the reaction — you wait to see how price responds, then participate.Trade the volatility — you are not married to one direction; you are prepared for a large enough move and a level you can manage.
The trades below are examples of those three jobs. Not every winner belongs in one combined scorecard.
2. Nasdaq Short — August 31
Building a scenario before the labor data
The first setup came from the backdrop, not from a single headline.
Brent was making higher highs and higher lows. DXY looked ready to firm after a pullback. The market was opening after Jackson Hole. Labor data was ahead.
That mix made a Nasdaq short interesting.
Price was around 29,400–29,420, with a level near 29,397 and lower support around 29,352. I shorted there and treated a move against the thesis as invalidation. At one point I moved the stop to entry.
I do not have a final PnL in my records, so I am not going to invent one.
What the trade is useful for is the timing. The release does not have to happen first. You can build the scenario days ahead and let price action decide whether the market gives you a location.
3. JPY + ISM — Trading the Volatility
Trading the volatility, not the guess
A few days later the focus shifted to Japan and US services data.
USD/JPY had already been violent: from above 160 toward 158.75, then later from around 160.40 toward 156.50. ISM Services printed 55.4 against an expectation near 54.3.
I was not trying to nail the ISM print. I was trading the fact that the event could produce a reaction I could manage.
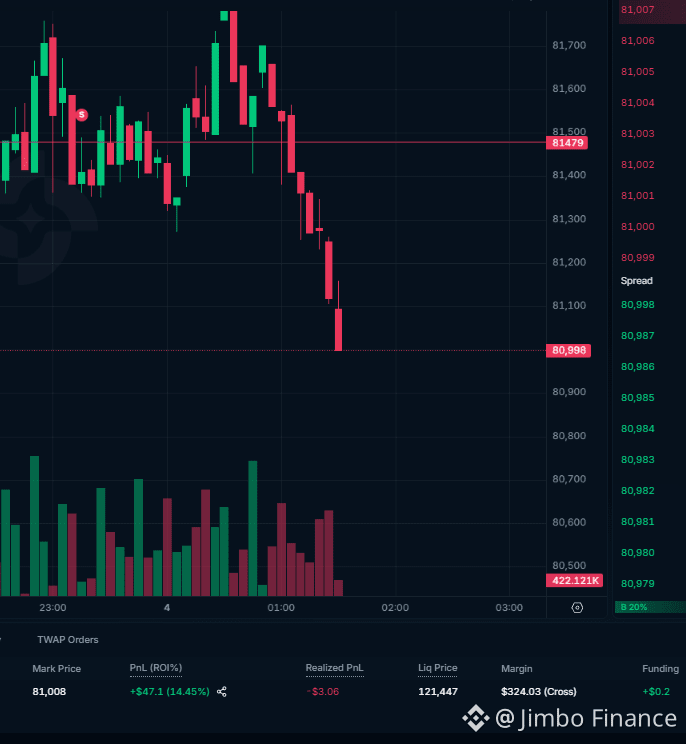
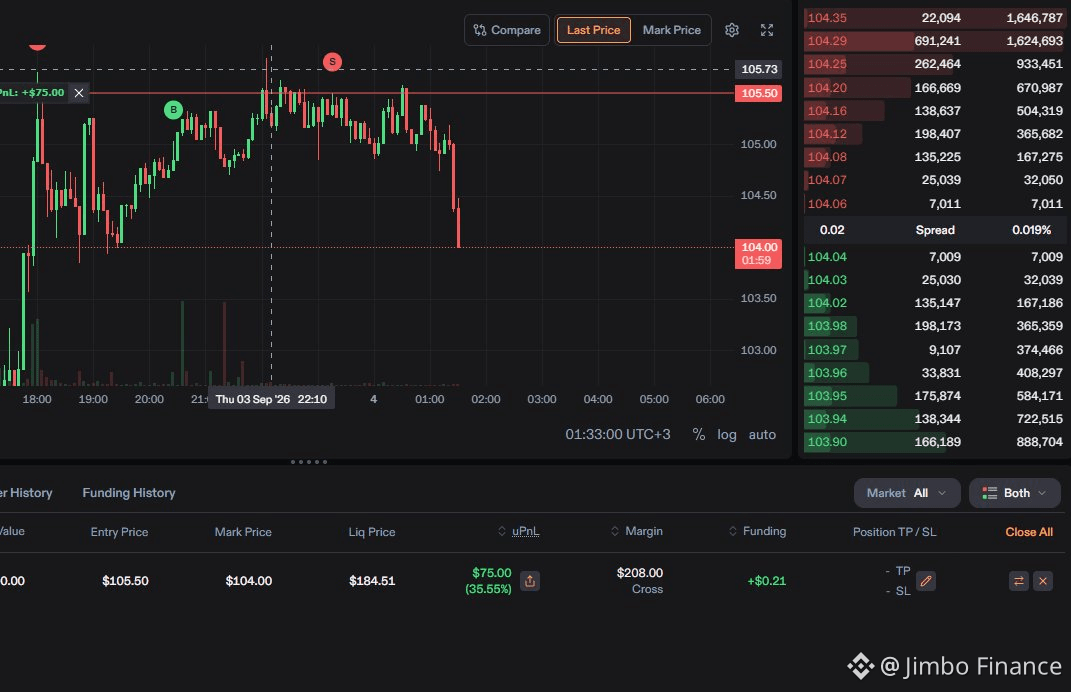
The positions from that day were small and documented: roughly $200 in total, with individual tickets around +$47 and +$75.
That is a different question from “the number will be X, so price must go Y.” The question was: can this event create a move large enough to trade, with risk I have already defined?
4. The NFP Trade — BTC, SOL, Gold & Nasdaq
The number was wrong. The process still worked.
This was the main lesson of the period.
Before the release I built a basket: Bitcoin, Solana, gold, and Nasdaq. The idea was to be in position before the print rather than chase the first candle after it.
Approximate results from the posts:
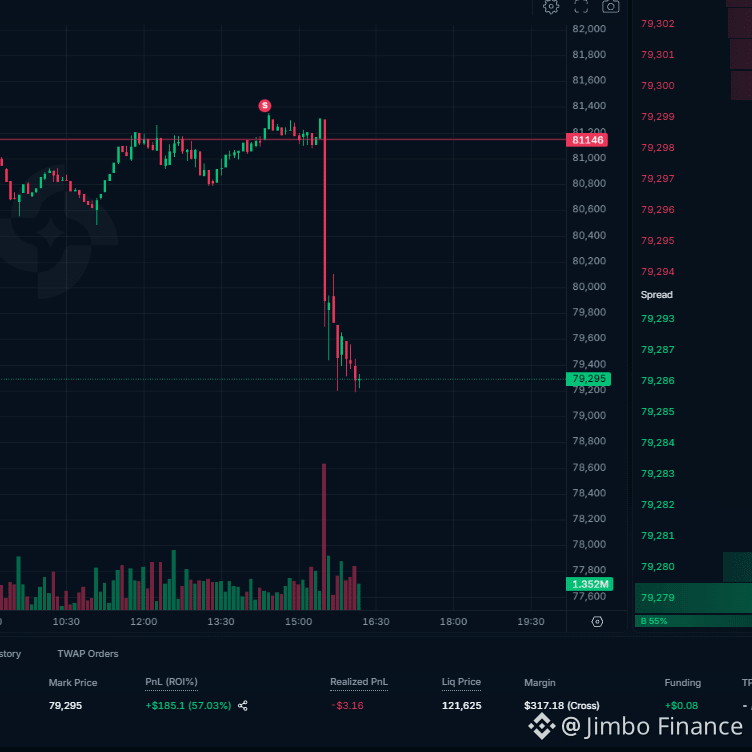
Nasdaq: +$119SOL: +$140Gold: +$175BTC: +$185
About $600 in total.
The four names were not a single identical bet. Soft labor can ease rate expectations, weigh on the dollar, and support gold. Risk assets can catch the liquidity and the first directional impulse around the print. I wanted participation in that event-move, with risk split across expressions instead of one all-in ticker. If one leg failed the thesis, I still wanted a defined exit on each name. I did not treat them as one fused position.
Now the honest part.
The payrolls number was not what I had described beforehand. It came in at +55K versus +162K expected. I am not going to pretend I predicted the data. I didn’t.
The trade still worked because I had a scenario, an invalidation, defined risk, and a plan for the reaction. The market produced a sharp move. I was already in it. That is a different activity from inventing a strategy five seconds after the candle has gone.
5. The PPI Trade — Preparing Before the Number
A directional thesis, placed before the print
Then came inflation.
I was leaning hotter based on the macro picture I had been following:
Hotter inflation → more pressure on yields and Fed expectations → downside pressure on risk.
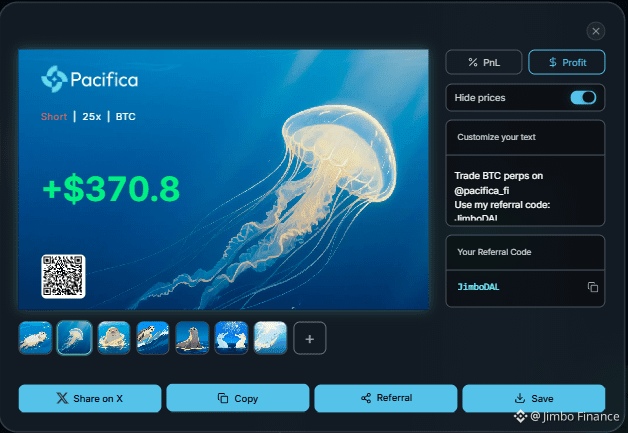
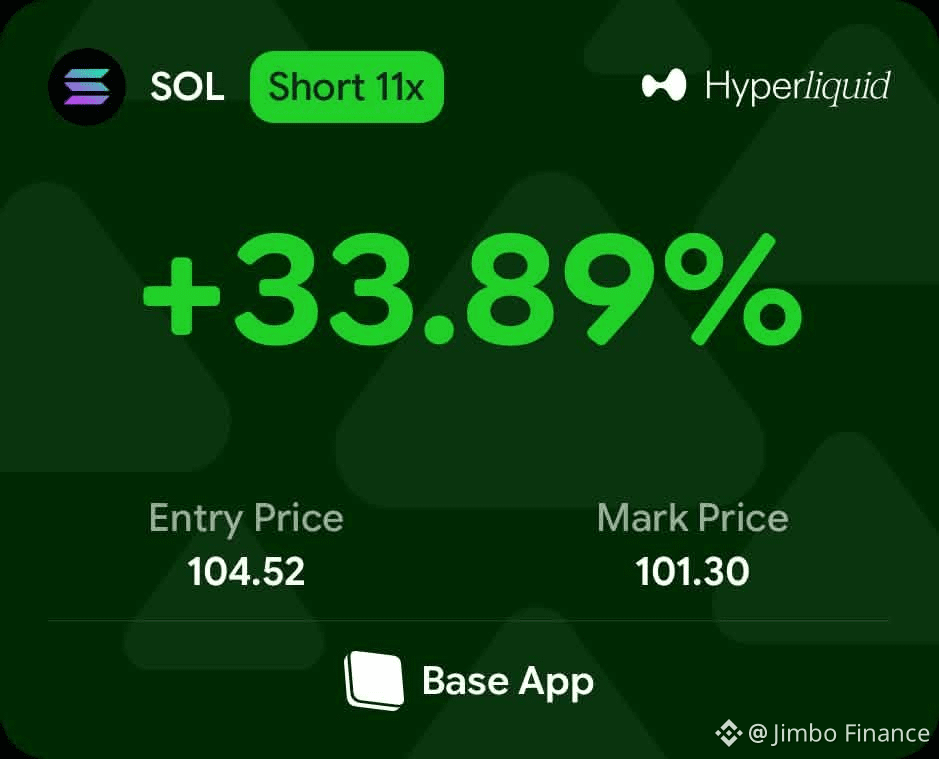
I positioned before the release. One SOL short was opened around 104.52; price later traded near 101.30, about +33.9% on that position. I also traded an XAUT short (about +$302) and BTC with 25x (about +$371). The posts put the PPI set of trades around +$600.
PPI printed 5.4% YoY versus 5.3% expected. That is a small beat, not a shock. I am not going to dress it up as a perfect call. It did land on the hotter side of what the market was holding, which was the side I had prepared for.
This is the version of macro I actually like. Not staring at a random candle. Asking:
What is the market waiting for?What happens if the data is hotter?What happens if it is cooler?Where am I wrong?
6. What I will not do with the scorecard
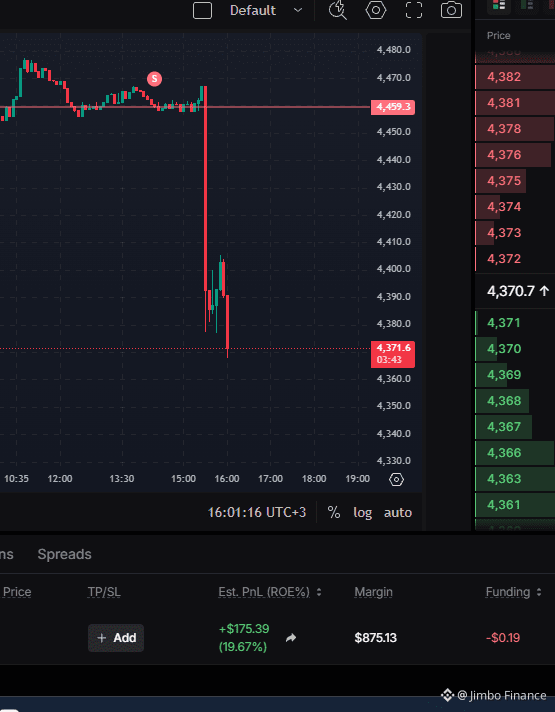
After PPI I kept trading the same environment. One later position made about +$609 as price moved from around 2,618 toward 2,554. A separate XAUT short from about 4,385.8 to 4,347.3 made about +$154.
Those were different trades. I am not folding them into the PPI result to make one week look cleaner than it was.
Track the tickets as they happened. Do not build a “perfect trade” out of unrelated fills.
7. The Framework
1. Find the catalyst.
What can force a decision this week? NFP, CPI, PPI, ISM, BOJ, Fed, a Treasury auction.
2. Read the expectation, not just the number.
The market prices the surprise. Consensus and positioning matter more than whether the headline “looks strong.”
3. Write two scenarios.
Hotter/stronger. Cooler/weaker. Then sketch how BTC, SOL, gold, Nasdaq, DXY, yields, and FX could respond in each case.
4. Take the chart’s location, not the narrative’s.
Macro is the reason to look. Price is the place to act. I do not short because CPI “might be hot.” I short where the risk is defined.
5. Decide invalidation in advance.
If the thesis is wrong, I am out. Sometimes that is a tight stop. Sometimes it is stop-to-entry. Sometimes it is cutting size. The point is that the exit is chosen before the number forces an emotional one.
6. Do not overstay the news move.
These trades can travel quickly. I do not need the entire candle. If the market pays the scenario, I take it.
I was not running a stack of indicators. The stack was:
Macro → liquidity → yields → DXY → expectations → price → risk.
That is enough.
8. The lesson
The lesson is not “macro works.”
Most people see the sequence as: print → candle → “why is BTC dumping?”
I want the questions asked earlier:
What is expected?
What would surprise?
What happens if it does?
Where is the entry?
Where am I wrong?
How much am I willing to lose?
Some of the calls in this period were right. Some were not. The job is not to predict every release. The job is to already have a plan when the market starts moving.
Don’t wait for the tape to explain what just happened.
Study what it is waiting for. Then write the plan first.
I want a plan before it hits.
Over a stretch of about two weeks I traded around NFP, PPI, ISM, JPY volatility, Nasdaq, Bitcoin, Solana, and gold. The point was not to call every candle. It was to know what the market was waiting for, how a surprise could move it, and where I wanted to be if volatility showed up.
The sequence I use is simple:
Calendar → expectations → scenario → level → invalidation.
1. Start with the calendar
Before I look for an entry, I look at the week.
NFP. CPI. PPI. ISM. Jobless claims. Central-bank decisions. Treasury auctions. Geopolitics.
I do not want to discover a major release after I am already in a position. I want to know when the market has a reason to move.
The print itself is not enough. Markets trade actual versus expected. A “good” number can still sell off if it was supposed to be better. The surprise is what creates the volume.
I also do not treat every event the same way. There are three different jobs:
Position before the event — you have a thesis and you accept event risk.Trade the reaction — you wait to see how price responds, then participate.Trade the volatility — you are not married to one direction; you are prepared for a large enough move and a level you can manage.
The trades below are examples of those three jobs. Not every winner belongs in one combined scorecard.
2. Nasdaq Short — August 31
Building a scenario before the labor data
The first setup came from the backdrop, not from a single headline.
Brent was making higher highs and higher lows. DXY looked ready to firm after a pullback. The market was opening after Jackson Hole. Labor data was ahead.
That mix made a Nasdaq short interesting.
Price was around 29,400–29,420, with a level near 29,397 and lower support around 29,352. I shorted there and treated a move against the thesis as invalidation. At one point I moved the stop to entry.
I do not have a final PnL in my records, so I am not going to invent one.
What the trade is useful for is the timing. The release does not have to happen first. You can build the scenario days ahead and let price action decide whether the market gives you a location.
3. JPY + ISM — Trading the Volatility
Trading the volatility, not the guess
A few days later the focus shifted to Japan and US services data.
USD/JPY had already been violent: from above 160 toward 158.75, then later from around 160.40 toward 156.50. ISM Services printed 55.4 against an expectation near 54.3.
I was not trying to nail the ISM print. I was trading the fact that the event could produce a reaction I could manage.
The positions from that day were small and documented: roughly $200 in total, with individual tickets around +$47 and +$75.
That is a different question from “the number will be X, so price must go Y.” The question was: can this event create a move large enough to trade, with risk I have already defined?
4. The NFP Trade — BTC, SOL, Gold & Nasdaq
The number was wrong. The process still worked.
This was the main lesson of the period.
Before the release I built a basket: Bitcoin, Solana, gold, and Nasdaq. The idea was to be in position before the print rather than chase the first candle after it.
Approximate results from the posts:
Nasdaq: +$119SOL: +$140Gold: +$175BTC: +$185
About $600 in total.
The four names were not a single identical bet. Soft labor can ease rate expectations, weigh on the dollar, and support gold. Risk assets can catch the liquidity and the first directional impulse around the print. I wanted participation in that event-move, with risk split across expressions instead of one all-in ticker. If one leg failed the thesis, I still wanted a defined exit on each name. I did not treat them as one fused position.
Now the honest part.
The payrolls number was not what I had described beforehand. It came in at +55K versus +162K expected. I am not going to pretend I predicted the data. I didn’t.
The trade still worked because I had a scenario, an invalidation, defined risk, and a plan for the reaction. The market produced a sharp move. I was already in it. That is a different activity from inventing a strategy five seconds after the candle has gone.
5. The PPI Trade — Preparing Before the Number
A directional thesis, placed before the print
Then came inflation.
I was leaning hotter based on the macro picture I had been following:
Hotter inflation → more pressure on yields and Fed expectations → downside pressure on risk.
I positioned before the release. One SOL short was opened around 104.52; price later traded near 101.30, about +33.9% on that position. I also traded an XAUT short (about +$302) and BTC with 25x (about +$371). The posts put the PPI set of trades around +$600.
PPI printed 5.4% YoY versus 5.3% expected. That is a small beat, not a shock. I am not going to dress it up as a perfect call. It did land on the hotter side of what the market was holding, which was the side I had prepared for.
This is the version of macro I actually like. Not staring at a random candle. Asking:
What is the market waiting for?What happens if the data is hotter?What happens if it is cooler?Where am I wrong?
6. What I will not do with the scorecard
After PPI I kept trading the same environment. One later position made about +$609 as price moved from around 2,618 toward 2,554. A separate XAUT short from about 4,385.8 to 4,347.3 made about +$154.
Those were different trades. I am not folding them into the PPI result to make one week look cleaner than it was.
Track the tickets as they happened. Do not build a “perfect trade” out of unrelated fills.
7. The Framework
1. Find the catalyst.
What can force a decision this week? NFP, CPI, PPI, ISM, BOJ, Fed, a Treasury auction.
2. Read the expectation, not just the number.
The market prices the surprise. Consensus and positioning matter more than whether the headline “looks strong.”
3. Write two scenarios.
Hotter/stronger. Cooler/weaker. Then sketch how BTC, SOL, gold, Nasdaq, DXY, yields, and FX could respond in each case.
4. Take the chart’s location, not the narrative’s.
Macro is the reason to look. Price is the place to act. I do not short because CPI “might be hot.” I short where the risk is defined.
5. Decide invalidation in advance.
If the thesis is wrong, I am out. Sometimes that is a tight stop. Sometimes it is stop-to-entry. Sometimes it is cutting size. The point is that the exit is chosen before the number forces an emotional one.
6. Do not overstay the news move.
These trades can travel quickly. I do not need the entire candle. If the market pays the scenario, I take it.
I was not running a stack of indicators. The stack was:
Macro → liquidity → yields → DXY → expectations → price → risk.
That is enough.
8. The lesson
The lesson is not “macro works.”
Most people see the sequence as: print → candle → “why is BTC dumping?”
I want the questions asked earlier:
What is expected?
What would surprise?
What happens if it does?
Where is the entry?
Where am I wrong?
How much am I willing to lose?
Some of the calls in this period were right. Some were not. The job is not to predict every release. The job is to already have a plan when the market starts moving.
Don’t wait for the tape to explain what just happened.
Study what it is waiting for. Then write the plan first.
115
Bom fim de semana
☕️
Esta semana foi agitada, fizemos muitas negociações
As notícias macro ajudaram bastante, então tivemos lucro !!!
Você fez alguma negociação?
🤔
Bom fim de semana
☕️
Esta semana foi agitada, fizemos muitas negociações
As notícias macro ajudaram bastante, então tivemos lucro !!!
Você fez alguma negociação?
🤔
☕️
Esta semana foi agitada, fizemos muitas negociações
As notícias macro ajudaram bastante, então tivemos lucro !!!
Você fez alguma negociação?
🤔
1
1.9k
🚨
RAFFLE DE USDC 10.000$ NA BASE
jumperapp
+ A Merkl está recompensando usuários que trocam RWAs da Coinbase na Base.
Veja como se qualificar
👇
• Faça swap de pelo menos US$ 250 em RWAs elegíveis da Coinbase
• Use apenas a página de RWA do Jumper
• Conclua todas as tarefas necessárias
• A missão termina em 21 de setembro
🎟️
O seu nível do Jumper Pass determina seus ingressos base.
E seu volume adiciona um multiplicador:
US$ 250+ → 1x
US$ 1K+ → 2x
US$ 10K+ → 3x
US$ 100K+ → 5x
40 vencedores × US$ 250 USDC = pool de prêmios de US$ 10K
Apenas jurisdições elegíveis.
Se você já está usando RWAs da Coinbase na Base, vale a pena conferir esta.
🚨
RAFFLE DE USDC 10.000$ NA BASE
jumperapp
+ A Merkl está recompensando usuários que trocam RWAs da Coinbase na Base.
Veja como se qualificar
👇
• Faça swap de pelo menos US$ 250 em RWAs elegíveis da Coinbase
• Use apenas a página de RWA do Jumper
• Conclua todas as tarefas necessárias
• A missão termina em 21 de setembro
🎟️
O seu nível do Jumper Pass determina seus ingressos base.
E seu volume adiciona um multiplicador:
US$ 250+ → 1x
US$ 1K+ → 2x
US$ 10K+ → 3x
US$ 100K+ → 5x
40 vencedores × US$ 250 USDC = pool de prêmios de US$ 10K
Apenas jurisdições elegíveis.
Se você já está usando RWAs da Coinbase na Base, vale a pena conferir esta.
RAFFLE DE USDC 10.000$ NA BASE
jumperapp
+ A Merkl está recompensando usuários que trocam RWAs da Coinbase na Base.
Veja como se qualificar
👇
• Faça swap de pelo menos US$ 250 em RWAs elegíveis da Coinbase
• Use apenas a página de RWA do Jumper
• Conclua todas as tarefas necessárias
• A missão termina em 21 de setembro
🎟️
O seu nível do Jumper Pass determina seus ingressos base.
E seu volume adiciona um multiplicador:
US$ 250+ → 1x
US$ 1K+ → 2x
US$ 10K+ → 3x
US$ 100K+ → 5x
40 vencedores × US$ 250 USDC = pool de prêmios de US$ 10K
Apenas jurisdições elegíveis.
Se você já está usando RWAs da Coinbase na Base, vale a pena conferir esta.

408
🚨
O CPI ESTÁ EM
A inflação dos EUA veio mista:
• CPI core m/m: 0,3% vs 0,2% esperado
🔥
• CPI core a/a: 2,4% vs 2,4% esperado
• CPI m/m: 0,4% vs 0,4% esperado
• CPI a/a: 3,4% vs 3,4% esperado
A inflação mensal do núcleo veio mais quente do que o esperado, enquanto os números anuais corresponderam às expectativas.
Agora acompanhando as expectativas do Fed + juros + reação do Cripto/Nasdaq.
👀
Volatilidade a caminho.
🚨
O CPI ESTÁ EM
A inflação dos EUA veio mista:
• CPI core m/m: 0,3% vs 0,2% esperado
🔥
• CPI core a/a: 2,4% vs 2,4% esperado
• CPI m/m: 0,4% vs 0,4% esperado
• CPI a/a: 3,4% vs 3,4% esperado
A inflação mensal do núcleo veio mais quente do que o esperado, enquanto os números anuais corresponderam às expectativas.
Agora acompanhando as expectativas do Fed + juros + reação do Cripto/Nasdaq.
👀
Volatilidade a caminho.
O CPI ESTÁ EM
A inflação dos EUA veio mista:
• CPI core m/m: 0,3% vs 0,2% esperado
🔥
• CPI core a/a: 2,4% vs 2,4% esperado
• CPI m/m: 0,4% vs 0,4% esperado
• CPI a/a: 3,4% vs 3,4% esperado
A inflação mensal do núcleo veio mais quente do que o esperado, enquanto os números anuais corresponderam às expectativas.
Agora acompanhando as expectativas do Fed + juros + reação do Cripto/Nasdaq.
👀
Volatilidade a caminho.
474
Verificado
🚨
DIA DO CPI
O CPI dos EUA cai hoje, com o mercado esperando 3,4% YoY.
A reação pode ser simples:
🔥
Acima de 3,4% → mais pressão sobre o Fed, expectativas de alta de juros aumentam.
🧊
3,4% ou abaixo → o mercado pode se inclinar para uma pausa do Fed.
CPI → expectativas do Fed → volatilidade em Cripto, Ouro e Nasdaq.
O número importa. A reação do mercado importa ainda mais.
👀
🚨
DIA DO CPI
O CPI dos EUA cai hoje, com o mercado esperando 3,4% YoY.
A reação pode ser simples:
🔥
Acima de 3,4% → mais pressão sobre o Fed, expectativas de alta de juros aumentam.
🧊
3,4% ou abaixo → o mercado pode se inclinar para uma pausa do Fed.
CPI → expectativas do Fed → volatilidade em Cripto, Ouro e Nasdaq.
O número importa. A reação do mercado importa ainda mais.
👀
DIA DO CPI
O CPI dos EUA cai hoje, com o mercado esperando 3,4% YoY.
A reação pode ser simples:
🔥
Acima de 3,4% → mais pressão sobre o Fed, expectativas de alta de juros aumentam.
🧊
3,4% ou abaixo → o mercado pode se inclinar para uma pausa do Fed.
CPI → expectativas do Fed → volatilidade em Cripto, Ouro e Nasdaq.
O número importa. A reação do mercado importa ainda mais.
👀

1
1
1.3k
Verificado
🚨
ALERTA: O PPI dos EUA CHEGA MAIS QUENTE
Inflação do PPI de agosto: 5,4% YoY vs 5,3% esperado.
É isso que eu quis dizer quando falei para você se posicionar!
+600$
🤑🤑🤑
🚨
ALERTA: O PPI dos EUA CHEGA MAIS QUENTE
Inflação do PPI de agosto: 5,4% YoY vs 5,3% esperado.
É isso que eu quis dizer quando falei para você se posicionar!
+600$
🤑🤑🤑
ALERTA: O PPI dos EUA CHEGA MAIS QUENTE
Inflação do PPI de agosto: 5,4% YoY vs 5,3% esperado.
É isso que eu quis dizer quando falei para você se posicionar!
+600$
🤑🤑🤑
1
1
5
7.5k
34% das posições em SOL estão atualmente vendidas.
👀
Faltam 2 horas para os dados do PMI.
Se a inflação vier acima do esperado → o Short continua vencendo
Se a inflação vier mais amena → SL no ponto de equilíbrio
Vamos ver quem está do lado certo.
🧐
34% das posições em SOL estão atualmente vendidas.
👀
Faltam 2 horas para os dados do PMI.
Se a inflação vier acima do esperado → o Short continua vencendo
Se a inflação vier mais amena → SL no ponto de equilíbrio
Vamos ver quem está do lado certo.
🧐
👀
Faltam 2 horas para os dados do PMI.
Se a inflação vier acima do esperado → o Short continua vencendo
Se a inflação vier mais amena → SL no ponto de equilíbrio
Vamos ver quem está do lado certo.
🧐
2.6k
🚨
Meu foco para o resto desta semana é a inflação.
PPI e CPI estão por vir, e, na minha opinião, a reação aos dados pode gerar uma volatilidade bem interessante ao longo dos mercados.
Depois de observar:
• Dados macro recentes
• Força do mercado de trabalho
• Movimentos no mercado de títulos
• Expectativas do banco central
• Expectativas de inflação
Eu, pessoalmente, estou inclinado a um cenário em que a inflação venha mais quente do que o mercado atualmente espera.
Se a inflação vier acima do esperado, os mercados podem reprecificar rapidamente.
Isso afeta tudo: Cripto, Tecnologia, Ouro e Ações.
Nada é garantido.
Mas é por isso que a preparação macro é importante.
O trade não começa quando os dados saem.
Ele começa antes.
👀
🚨
Meu foco para o resto desta semana é a inflação.
PPI e CPI estão por vir, e, na minha opinião, a reação aos dados pode gerar uma volatilidade bem interessante ao longo dos mercados.
Depois de observar:
• Dados macro recentes
• Força do mercado de trabalho
• Movimentos no mercado de títulos
• Expectativas do banco central
• Expectativas de inflação
Eu, pessoalmente, estou inclinado a um cenário em que a inflação venha mais quente do que o mercado atualmente espera.
Se a inflação vier acima do esperado, os mercados podem reprecificar rapidamente.
Isso afeta tudo: Cripto, Tecnologia, Ouro e Ações.
Nada é garantido.
Mas é por isso que a preparação macro é importante.
O trade não começa quando os dados saem.
Ele começa antes.
👀
Meu foco para o resto desta semana é a inflação.
PPI e CPI estão por vir, e, na minha opinião, a reação aos dados pode gerar uma volatilidade bem interessante ao longo dos mercados.
Depois de observar:
• Dados macro recentes
• Força do mercado de trabalho
• Movimentos no mercado de títulos
• Expectativas do banco central
• Expectativas de inflação
Eu, pessoalmente, estou inclinado a um cenário em que a inflação venha mais quente do que o mercado atualmente espera.
Se a inflação vier acima do esperado, os mercados podem reprecificar rapidamente.
Isso afeta tudo: Cripto, Tecnologia, Ouro e Ações.
Nada é garantido.
Mas é por isso que a preparação macro é importante.
O trade não começa quando os dados saem.
Ele começa antes.
👀
315
Verificado
🚨
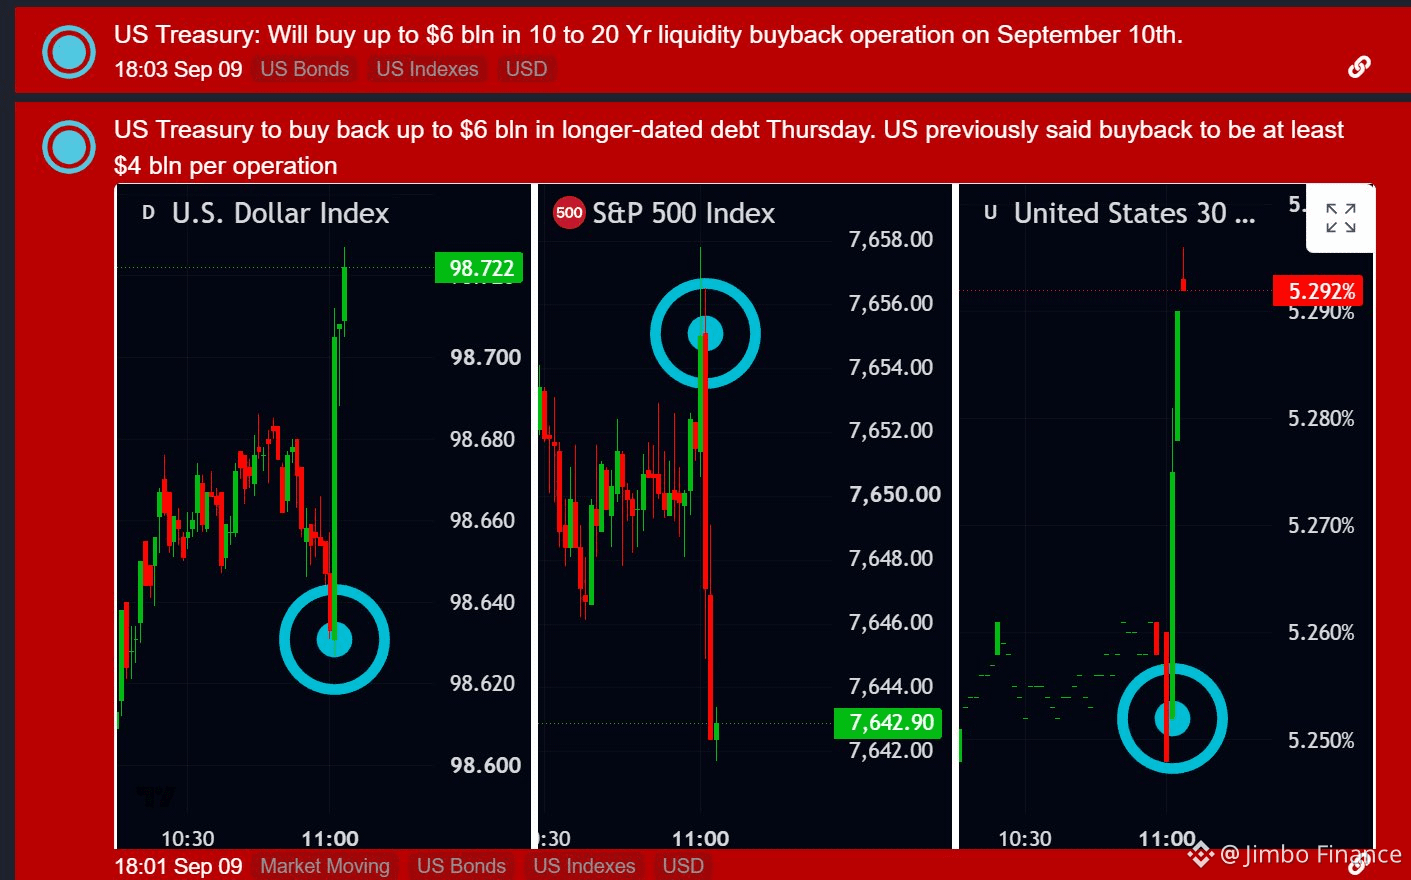
Os mercados estão reagindo à mais recente operação de recompra de liquidez do Tesouro dos EUA.
O Tesouro está previsto para recomprar até US$ 6B em dívida norte-americana com vencimentos mais longos.
E a reação foi imediata:
📈
USD subiu
📉
S&P 500 caiu
📈
Os rendimentos dos Treasuries de longo prazo dispararam
Liquidez, mercados de títulos e fluxos macro estão movendo os mercados em tempo real.
Nunca subestime o mercado de títulos.
👀
🚨
Os mercados estão reagindo à mais recente operação de recompra de liquidez do Tesouro dos EUA.
O Tesouro está previsto para recomprar até US$ 6B em dívida norte-americana com vencimentos mais longos.
E a reação foi imediata:
📈
USD subiu
📉
S&P 500 caiu
📈
Os rendimentos dos Treasuries de longo prazo dispararam
Liquidez, mercados de títulos e fluxos macro estão movendo os mercados em tempo real.
Nunca subestime o mercado de títulos.
👀
Os mercados estão reagindo à mais recente operação de recompra de liquidez do Tesouro dos EUA.
O Tesouro está previsto para recomprar até US$ 6B em dívida norte-americana com vencimentos mais longos.
E a reação foi imediata:
📈
USD subiu
📉
S&P 500 caiu
📈
Os rendimentos dos Treasuries de longo prazo dispararam
Liquidez, mercados de títulos e fluxos macro estão movendo os mercados em tempo real.
Nunca subestime o mercado de títulos.
👀
2
2
7.4k
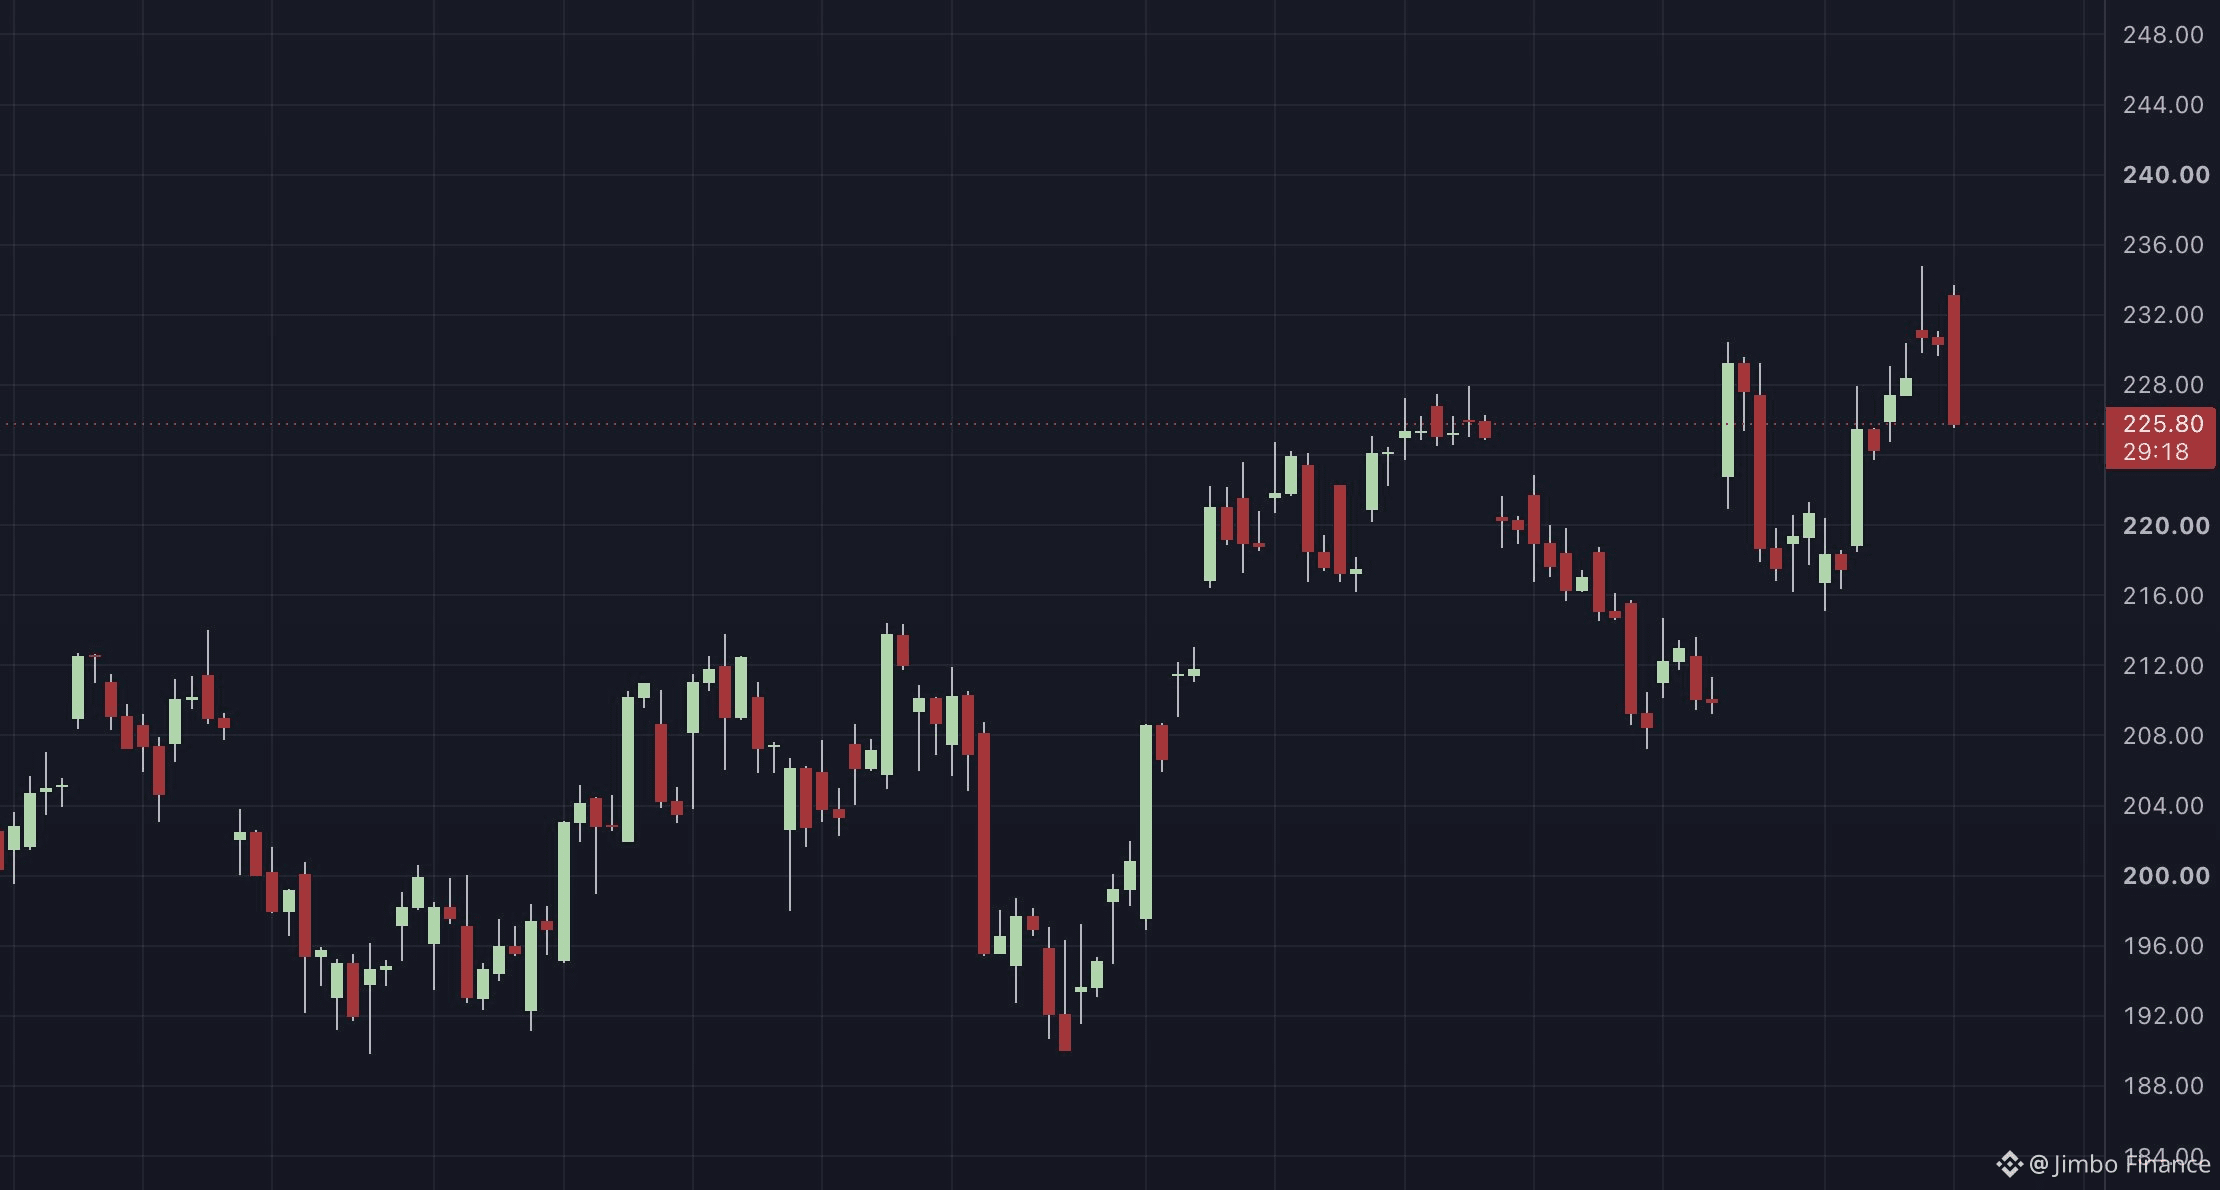
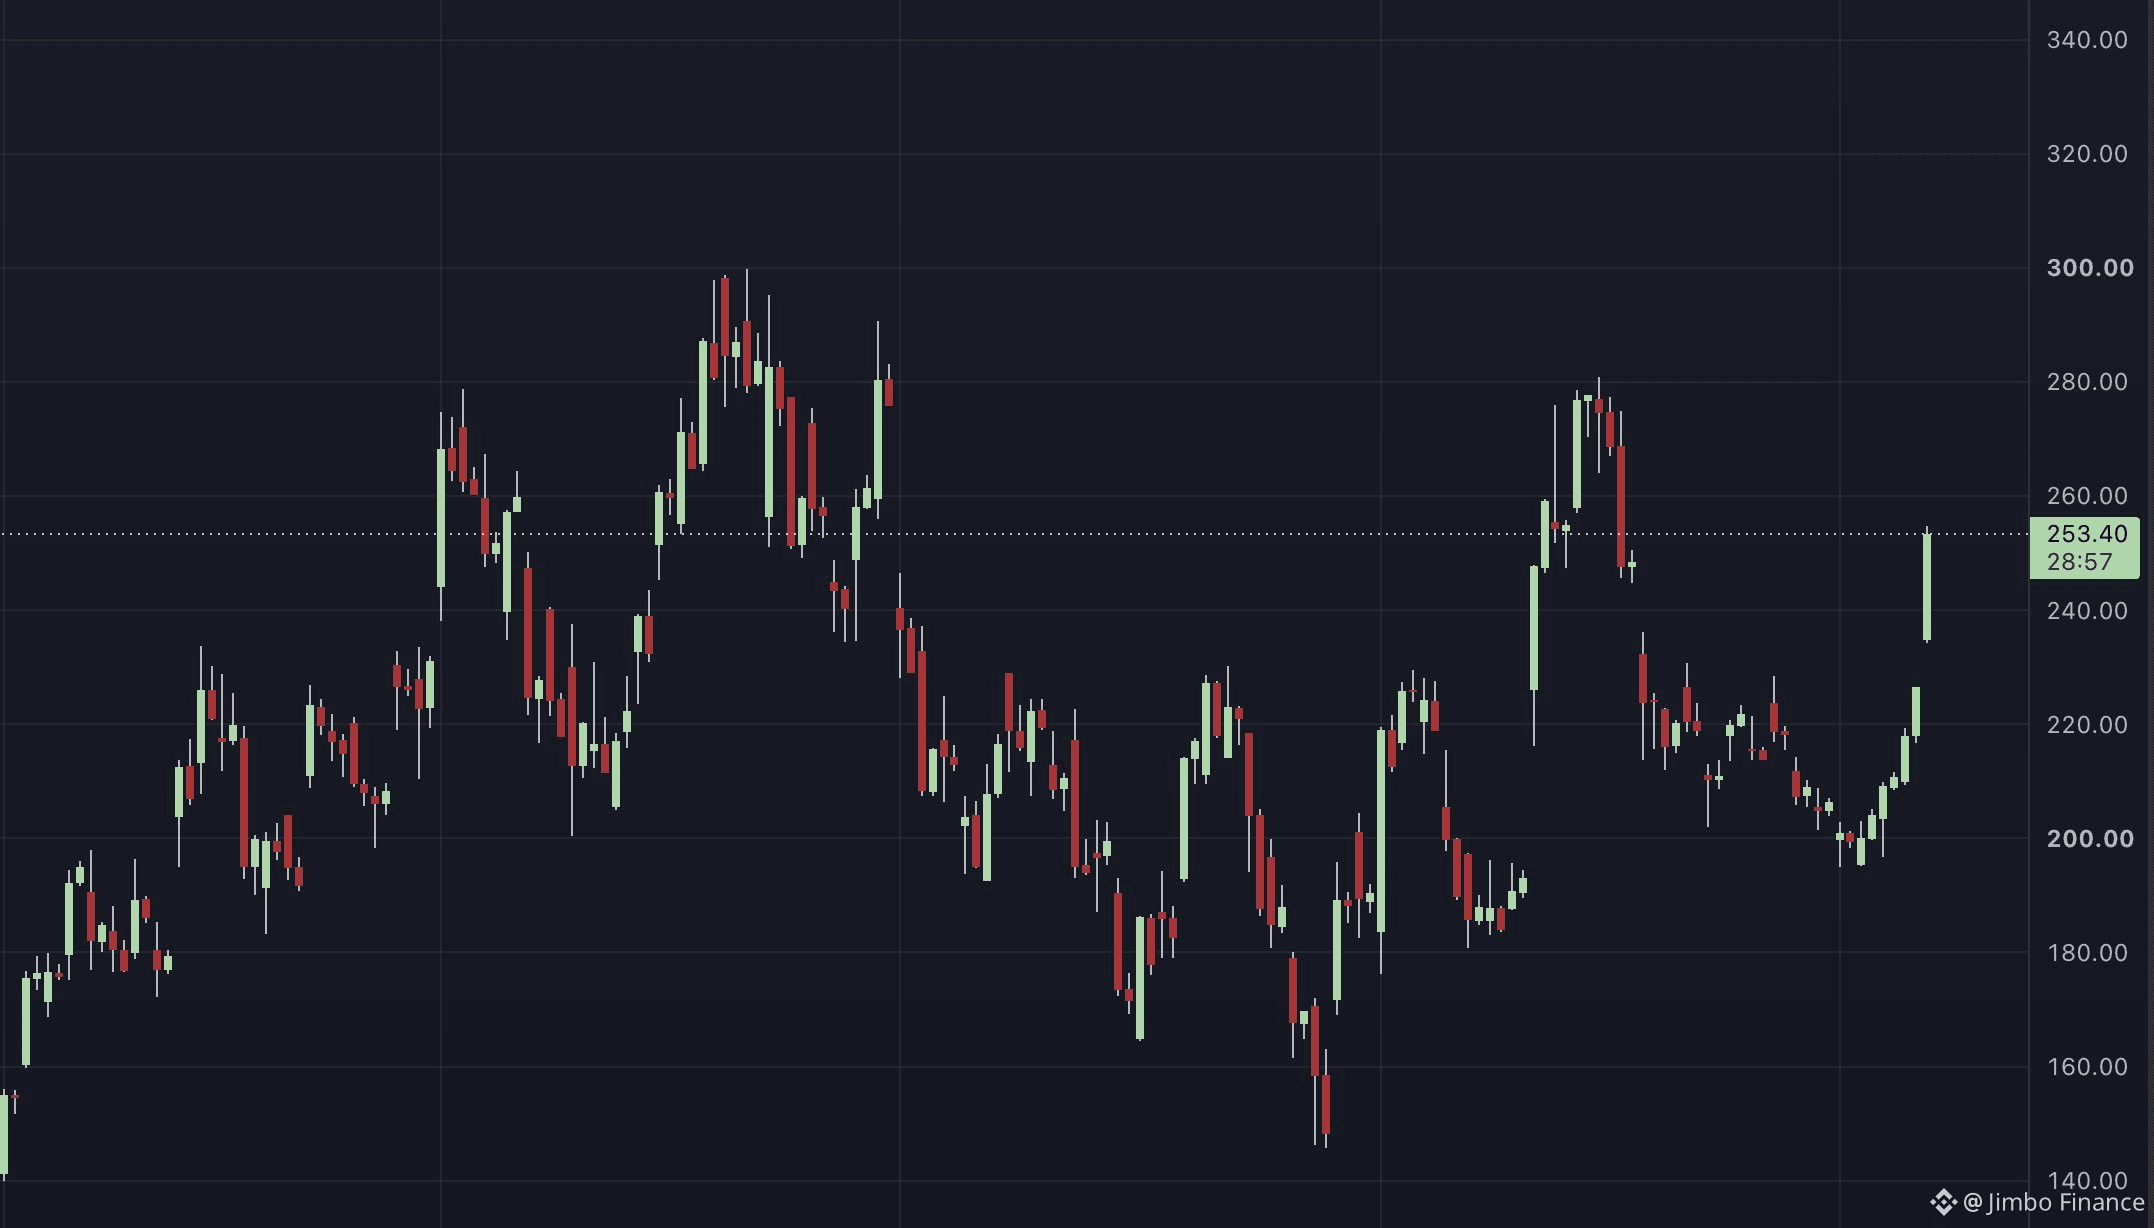
As pessoas ainda estão tratando a IA como uma tendência.
Elas não entendem o que realmente está acontecendo.
Estamos acompanhando a OpenAI, a Google, a Anthropic e a xAI competindo em um nível em que as empresas mais valiosas do mundo podem perder a liderança em IA e recuperá-la em questão de semanas.
Pense na escala dessa corrida:
🤖 Modelos melhorando em ritmo exponencial
🏗️ Centenas de bilhões fluindo para data centers
⚡ Demanda massiva por energia e computação
🖥️ Indústrias inteiras sendo reconstruídas em torno da infraestrutura de IA
💰 Trilhões de dólares esperados para serem investidos
Isso não é mais um aplicativo.
Isso não é mais um ciclo de hype tecnológico.
A IA está se tornando a camada de infraestrutura para a próxima geração da economia global.
E a parte mais absurda?
Talvez ainda estejamos no começo. 📈🤖
As pessoas ainda estão tratando a IA como uma tendência.
Elas não entendem o que realmente está acontecendo.
Estamos acompanhando a OpenAI, a Google, a Anthropic e a xAI competindo em um nível em que as empresas mais valiosas do mundo podem perder a liderança em IA e recuperá-la em questão de semanas.
Pense na escala dessa corrida:
🤖 Modelos melhorando em ritmo exponencial
🏗️ Centenas de bilhões fluindo para data centers
⚡ Demanda massiva por energia e computação
🖥️ Indústrias inteiras sendo reconstruídas em torno da infraestrutura de IA
💰 Trilhões de dólares esperados para serem investidos
Isso não é mais um aplicativo.
Isso não é mais um ciclo de hype tecnológico.
A IA está se tornando a camada de infraestrutura para a próxima geração da economia global.
E a parte mais absurda?
Talvez ainda estejamos no começo. 📈🤖
Elas não entendem o que realmente está acontecendo.
Estamos acompanhando a OpenAI, a Google, a Anthropic e a xAI competindo em um nível em que as empresas mais valiosas do mundo podem perder a liderança em IA e recuperá-la em questão de semanas.
Pense na escala dessa corrida:
🤖 Modelos melhorando em ritmo exponencial
🏗️ Centenas de bilhões fluindo para data centers
⚡ Demanda massiva por energia e computação
🖥️ Indústrias inteiras sendo reconstruídas em torno da infraestrutura de IA
💰 Trilhões de dólares esperados para serem investidos
Isso não é mais um aplicativo.
Isso não é mais um ciclo de hype tecnológico.
A IA está se tornando a camada de infraestrutura para a próxima geração da economia global.
E a parte mais absurda?
Talvez ainda estejamos no começo. 📈🤖
336
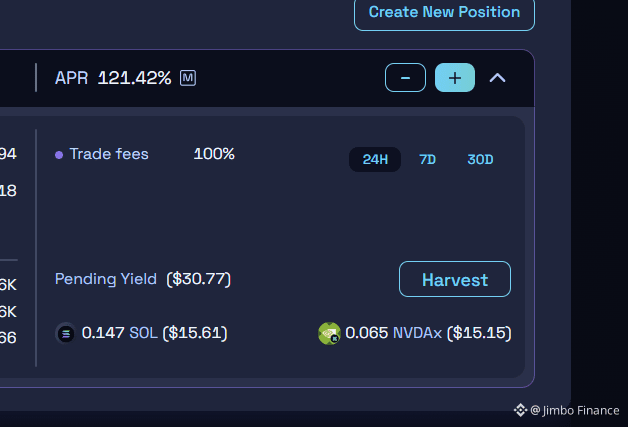
Mesmo enquanto toca grama em Mykonos… as pools de liquidez ainda estão gerando lucro. 😂💰🌊
Os mercados podem estar fechados, mas DeFi nunca dorme.
Renda passiva > ficar encarando gráficos o dia todo.
+30$ em uma noite 🫡
Mesmo enquanto toca grama em Mykonos… as pools de liquidez ainda estão gerando lucro. 😂💰🌊
Os mercados podem estar fechados, mas DeFi nunca dorme.
Renda passiva > ficar encarando gráficos o dia todo.
+30$ em uma noite 🫡
Os mercados podem estar fechados, mas DeFi nunca dorme.
Renda passiva > ficar encarando gráficos o dia todo.
+30$ em uma noite 🫡
1
1.1k
É isso que estou fazendo enquanto os mercados estão fechados hoje:
> Tirar um tempo para sair um pouco, tocar na grama e limpar a mente
> Treinar e fortalecer meu corpo
> Fazer minhas tarefas diárias de airdrop para projetos diferentes
> Criar conteúdo para o Youtube / X / comunidade no Discord
E você? 🤔
É isso que estou fazendo enquanto os mercados estão fechados hoje:
> Tirar um tempo para sair um pouco, tocar na grama e limpar a mente
> Treinar e fortalecer meu corpo
> Fazer minhas tarefas diárias de airdrop para projetos diferentes
> Criar conteúdo para o Youtube / X / comunidade no Discord
E você? 🤔
> Tirar um tempo para sair um pouco, tocar na grama e limpar a mente
> Treinar e fortalecer meu corpo
> Fazer minhas tarefas diárias de airdrop para projetos diferentes
> Criar conteúdo para o Youtube / X / comunidade no Discord
E você? 🤔

4
1.8k
Como fiz US$600 negociando em apenas alguns minutos?
Não foi sorte.
Foi preparação, macro e execução.
Ao longo da semana, eu estava acompanhando os dados que chegavam, a comunicação do Fed em Jackson Hole e, mais importante, como o mercado de títulos estava se movendo.
Tudo isso construiu minha tese.
Antes de o dado de Variação do Emprego Não Agrícola ser divulgado, eu esperava que o número viesse significativamente acima das expectativas, então me posicionei de acordo e compartilhei minha tese antecipadamente.
A operação era de alto risco? Sim.
É exatamente por isso que a gestão de risco importa.
SL apertado.
Risco definido.
Invalidação clara.
Então os dados foram divulgados.
Deixei os vencedores correrem, gerenciei as posições e realizei meus lucros.
+US$600 em minutos.
E não, não foi por causa de alguma mágica:
❌ EMA 200
❌ EMA 20
❌ nível de Fibonacci
❌ Topo triplo
❌ padrão de Cabeça & Ombros
A operação foi impulsionada por macro, posicionamento de mercado, níveis de suporte/demanda e execução.
Não estou postando isso para me exibir com uma operação vencedora.
Estou postando porque gente demais acha que precisa pagar milhares por um curso de "guru" cheio de indicadores e padrões sofisticados para aprender como os mercados se movem.
Aprenda a construir uma tese.
Entenda macro.
Entenda risco.
Entenda por que os mercados reagem.
Então execute.
Preparação vence a sorte. Sempre. 🫡
Fique safu.
Como fiz US$600 negociando em apenas alguns minutos?
Não foi sorte.
Foi preparação, macro e execução.
Ao longo da semana, eu estava acompanhando os dados que chegavam, a comunicação do Fed em Jackson Hole e, mais importante, como o mercado de títulos estava se movendo.
Tudo isso construiu minha tese.
Antes de o dado de Variação do Emprego Não Agrícola ser divulgado, eu esperava que o número viesse significativamente acima das expectativas, então me posicionei de acordo e compartilhei minha tese antecipadamente.
A operação era de alto risco? Sim.
É exatamente por isso que a gestão de risco importa.
SL apertado.
Risco definido.
Invalidação clara.
Então os dados foram divulgados.
Deixei os vencedores correrem, gerenciei as posições e realizei meus lucros.
+US$600 em minutos.
E não, não foi por causa de alguma mágica:
❌ EMA 200
❌ EMA 20
❌ nível de Fibonacci
❌ Topo triplo
❌ padrão de Cabeça & Ombros
A operação foi impulsionada por macro, posicionamento de mercado, níveis de suporte/demanda e execução.
Não estou postando isso para me exibir com uma operação vencedora.
Estou postando porque gente demais acha que precisa pagar milhares por um curso de "guru" cheio de indicadores e padrões sofisticados para aprender como os mercados se movem.
Aprenda a construir uma tese.
Entenda macro.
Entenda risco.
Entenda por que os mercados reagem.
Então execute.
Preparação vence a sorte. Sempre. 🫡
Fique safu.
Não foi sorte.
Foi preparação, macro e execução.
Ao longo da semana, eu estava acompanhando os dados que chegavam, a comunicação do Fed em Jackson Hole e, mais importante, como o mercado de títulos estava se movendo.
Tudo isso construiu minha tese.
Antes de o dado de Variação do Emprego Não Agrícola ser divulgado, eu esperava que o número viesse significativamente acima das expectativas, então me posicionei de acordo e compartilhei minha tese antecipadamente.
A operação era de alto risco? Sim.
É exatamente por isso que a gestão de risco importa.
SL apertado.
Risco definido.
Invalidação clara.
Então os dados foram divulgados.
Deixei os vencedores correrem, gerenciei as posições e realizei meus lucros.
+US$600 em minutos.
E não, não foi por causa de alguma mágica:
❌ EMA 200
❌ EMA 20
❌ nível de Fibonacci
❌ Topo triplo
❌ padrão de Cabeça & Ombros
A operação foi impulsionada por macro, posicionamento de mercado, níveis de suporte/demanda e execução.
Não estou postando isso para me exibir com uma operação vencedora.
Estou postando porque gente demais acha que precisa pagar milhares por um curso de "guru" cheio de indicadores e padrões sofisticados para aprender como os mercados se movem.
Aprenda a construir uma tese.
Entenda macro.
Entenda risco.
Entenda por que os mercados reagem.
Então execute.
Preparação vence a sorte. Sempre. 🫡
Fique safu.
1
3
2.7k
🚨 QUEBROU: Dados importantes de emprego acabaram de sair.
🇺🇸 Folha de Pagamentos Não Agrícolas dos EUA: +55K vs +162K esperado
🇺🇸 Taxa de Desemprego: 4.1% — em linha com as expectativas
🇺🇸 Ganhos Médios por Hora: +0.3% — em linha
O grande desapontamento está claramente na criação de empregos. Apenas 55K empregos foram adicionados, contra 162K esperados. 👀
Volatilidade a caminho. 👀🔥
Setembro promete ser interessante. 👀
Muita coisa está acontecendo ao mesmo tempo:
• Os dados on-chain do Bitcoin estão melhorando
• Os fluxos de ETF voltaram
• Solana continua crescendo
• A IA continua superando as expectativas
• Enquanto isso, o cenário macro está ficando perigoso
Aqui está o que estou observando 🧵👇
2/ BITCOIN
A correção da área de $82K era esperada.
Os holders de longo prazo realizaram alguns lucros, o que é completamente normal após uma forte alta.
Mas aqui está a parte importante:
A distribuição deles está longe dos níveis que vimos durante os grandes períodos de venda desde janeiro de 2024.
Por enquanto, nada sugere capitulação agressiva dos holders de longo prazo.
🚨 QUEBROU: Dados importantes de emprego acabaram de sair.
🇺🇸 Folha de Pagamentos Não Agrícolas dos EUA: +55K vs +162K esperado
🇺🇸 Taxa de Desemprego: 4.1% — em linha com as expectativas
🇺🇸 Ganhos Médios por Hora: +0.3% — em linha
O grande desapontamento está claramente na criação de empregos. Apenas 55K empregos foram adicionados, contra 162K esperados. 👀
Volatilidade a caminho. 👀🔥
Setembro promete ser interessante. 👀
Muita coisa está acontecendo ao mesmo tempo:
• Os dados on-chain do Bitcoin estão melhorando
• Os fluxos de ETF voltaram
• Solana continua crescendo
• A IA continua superando as expectativas
• Enquanto isso, o cenário macro está ficando perigoso
Aqui está o que estou observando 🧵👇
2/ BITCOIN
A correção da área de $82K era esperada.
Os holders de longo prazo realizaram alguns lucros, o que é completamente normal após uma forte alta.
Mas aqui está a parte importante:
A distribuição deles está longe dos níveis que vimos durante os grandes períodos de venda desde janeiro de 2024.
Por enquanto, nada sugere capitulação agressiva dos holders de longo prazo.
🇺🇸 Folha de Pagamentos Não Agrícolas dos EUA: +55K vs +162K esperado
🇺🇸 Taxa de Desemprego: 4.1% — em linha com as expectativas
🇺🇸 Ganhos Médios por Hora: +0.3% — em linha
O grande desapontamento está claramente na criação de empregos. Apenas 55K empregos foram adicionados, contra 162K esperados. 👀
Volatilidade a caminho. 👀🔥
Setembro promete ser interessante. 👀
Muita coisa está acontecendo ao mesmo tempo:
• Os dados on-chain do Bitcoin estão melhorando
• Os fluxos de ETF voltaram
• Solana continua crescendo
• A IA continua superando as expectativas
• Enquanto isso, o cenário macro está ficando perigoso
Aqui está o que estou observando 🧵👇
2/ BITCOIN
A correção da área de $82K era esperada.
Os holders de longo prazo realizaram alguns lucros, o que é completamente normal após uma forte alta.
Mas aqui está a parte importante:
A distribuição deles está longe dos níveis que vimos durante os grandes períodos de venda desde janeiro de 2024.
Por enquanto, nada sugere capitulação agressiva dos holders de longo prazo.
3
1.5k
Bom dia ☕️
Ontem foi um bom dia de trading + 200$ 🤑
Aproveitei o movimento
JPYUSD e a reação ao ISM Services PMI. 🫡
Um bom lembrete de que você não precisa operar todos os movimentos.
De volta hoje. 👀
Bom dia ☕️
Ontem foi um bom dia de trading + 200$ 🤑
Aproveitei o movimento
JPYUSD e a reação ao ISM Services PMI. 🫡
Um bom lembrete de que você não precisa operar todos os movimentos.
De volta hoje. 👀
Ontem foi um bom dia de trading + 200$ 🤑
Aproveitei o movimento
JPYUSD e a reação ao ISM Services PMI. 🫡
Um bom lembrete de que você não precisa operar todos os movimentos.
De volta hoje. 👀
895
Verificado
🚨 NOTÍCIA EM TEMPO REAL: O PMI de Serviços do ISM dos EUA acabou de sair mais forte do que o esperado.
🇺🇸 Resultado: 55,4
📊 Esperado: ~54,3
O setor de serviços dos EUA continua em expansão, com uma leitura acima de 50 sinalizando crescimento.
A economia dos EUA ainda mostra força. 👀
🚨 NOTÍCIA EM TEMPO REAL: O PMI de Serviços do ISM dos EUA acabou de sair mais forte do que o esperado.
🇺🇸 Resultado: 55,4
📊 Esperado: ~54,3
O setor de serviços dos EUA continua em expansão, com uma leitura acima de 50 sinalizando crescimento.
A economia dos EUA ainda mostra força. 👀
🇺🇸 Resultado: 55,4
📊 Esperado: ~54,3
O setor de serviços dos EUA continua em expansão, com uma leitura acima de 50 sinalizando crescimento.
A economia dos EUA ainda mostra força. 👀

1
1.7k
🚨 Lembre do meu vídeo sobre o Japão e o iene?
É exatamente por isso que eu disse que o Japão é algo que todo o mercado deveria estar observando. 👀
Por anos, dava para tomar dinheiro emprestado em ienes japoneses baratos e direcioná-lo para ativos com maior rendimento:
→ Títulos do Tesouro dos EUA
→ Nasdaq e ações de tecnologia
→ Imóveis
→ Cripto
Esse financiamento barato passou a fazer parte da máquina global de liquidez.
Agora olhe para USDJPY.
De cerca de 160,40 → 156,50 em um período bem curto. 🇯🇵
Se esse movimento é intervenção, expectativas de aumentos de taxa do BOJ, ou ambos, uma coisa é importante:
Um iene mais forte torna o carry trade menos atraente.
E quando essa enorme operação de liquidez global começa a se desfazer, não afeta apenas o Japão.
Pode afetar os títulos dos EUA.
Ações dos EUA.
Tecnologia.
E Cripto.
É por isso que eu continuo acompanhando o Japão. 👀🇯🇵
O iene pode ser um dos gráficos mais importantes nos mercados globais agora.
🚨 Lembre do meu vídeo sobre o Japão e o iene?
É exatamente por isso que eu disse que o Japão é algo que todo o mercado deveria estar observando. 👀
Por anos, dava para tomar dinheiro emprestado em ienes japoneses baratos e direcioná-lo para ativos com maior rendimento:
→ Títulos do Tesouro dos EUA
→ Nasdaq e ações de tecnologia
→ Imóveis
→ Cripto
Esse financiamento barato passou a fazer parte da máquina global de liquidez.
Agora olhe para USDJPY.
De cerca de 160,40 → 156,50 em um período bem curto. 🇯🇵
Se esse movimento é intervenção, expectativas de aumentos de taxa do BOJ, ou ambos, uma coisa é importante:
Um iene mais forte torna o carry trade menos atraente.
E quando essa enorme operação de liquidez global começa a se desfazer, não afeta apenas o Japão.
Pode afetar os títulos dos EUA.
Ações dos EUA.
Tecnologia.
E Cripto.
É por isso que eu continuo acompanhando o Japão. 👀🇯🇵
O iene pode ser um dos gráficos mais importantes nos mercados globais agora.
É exatamente por isso que eu disse que o Japão é algo que todo o mercado deveria estar observando. 👀
Por anos, dava para tomar dinheiro emprestado em ienes japoneses baratos e direcioná-lo para ativos com maior rendimento:
→ Títulos do Tesouro dos EUA
→ Nasdaq e ações de tecnologia
→ Imóveis
→ Cripto
Esse financiamento barato passou a fazer parte da máquina global de liquidez.
Agora olhe para USDJPY.
De cerca de 160,40 → 156,50 em um período bem curto. 🇯🇵
Se esse movimento é intervenção, expectativas de aumentos de taxa do BOJ, ou ambos, uma coisa é importante:
Um iene mais forte torna o carry trade menos atraente.
E quando essa enorme operação de liquidez global começa a se desfazer, não afeta apenas o Japão.
Pode afetar os títulos dos EUA.
Ações dos EUA.
Tecnologia.
E Cripto.
É por isso que eu continuo acompanhando o Japão. 👀🇯🇵
O iene pode ser um dos gráficos mais importantes nos mercados globais agora.
451
Verificado
🚨
Trump acabou de comentar sobre o Irã.
Ele diz que a campanha renovada contra o Irã não vai continuar por muito tempo.
O risco da manchete ainda está muito alto agora.
Mantenha-se atento às posições e não faça overleverage.
👀
🚨
Trump acabou de comentar sobre o Irã.
Ele diz que a campanha renovada contra o Irã não vai continuar por muito tempo.
O risco da manchete ainda está muito alto agora.
Mantenha-se atento às posições e não faça overleverage.
👀
Trump acabou de comentar sobre o Irã.
Ele diz que a campanha renovada contra o Irã não vai continuar por muito tempo.
O risco da manchete ainda está muito alto agora.
Mantenha-se atento às posições e não faça overleverage.
👀

2k
Bom dia
☕️
Novo dia. Mantenha o foco. Faça trading limpo. Não force nada.
Fique de olho.
🫡
O que você está assistindo hoje?
👀
Bom dia
☕️
Novo dia. Mantenha o foco. Faça trading limpo. Não force nada.
Fique de olho.
🫡
O que você está assistindo hoje?
👀
☕️
Novo dia. Mantenha o foco. Faça trading limpo. Não force nada.
Fique de olho.
🫡
O que você está assistindo hoje?
👀
332
Verificado
🚨
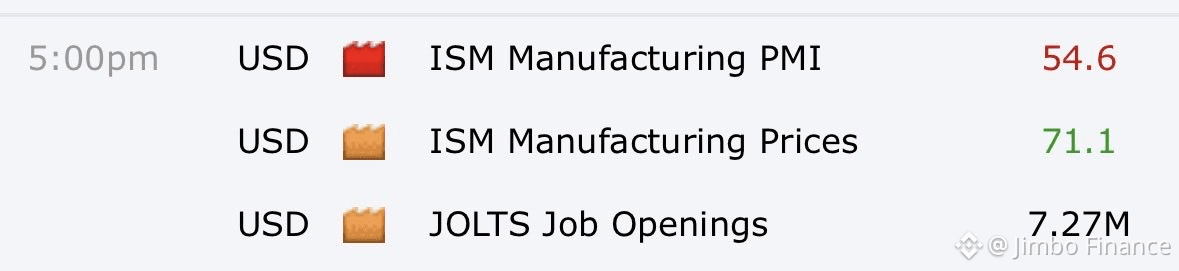
A ECONOMIA DOS EUA ESTÁ ARREFECENDO, MAS NÃO QUEBRANDO.
Os dados de hoje nos mostram um quadro misto:
🇺🇸
ISM Manufatura: 54,6 vs 55,2 esperados
👷
JOLTS: 7,27M vs 7,33M esperados
🏭
Emprego na indústria: 51,2 vs 52,8
O crescimento ainda se sustenta, mas o ritmo está esfriando.
Não é um colapso. Mas também não é um sinal verde.
E é exatamente isso que torna a decisão do Fed de setembro interessante.
O teste real vem mais tarde nesta semana:
ADP → ISM de Serviços na quinta → Relatório de Empregos na sexta.
Estou acompanhando de perto o mercado de trabalho.
👀
🚨
A ECONOMIA DOS EUA ESTÁ ARREFECENDO, MAS NÃO QUEBRANDO.
Os dados de hoje nos mostram um quadro misto:
🇺🇸
ISM Manufatura: 54,6 vs 55,2 esperados
👷
JOLTS: 7,27M vs 7,33M esperados
🏭
Emprego na indústria: 51,2 vs 52,8
O crescimento ainda se sustenta, mas o ritmo está esfriando.
Não é um colapso. Mas também não é um sinal verde.
E é exatamente isso que torna a decisão do Fed de setembro interessante.
O teste real vem mais tarde nesta semana:
ADP → ISM de Serviços na quinta → Relatório de Empregos na sexta.
Estou acompanhando de perto o mercado de trabalho.
👀
A ECONOMIA DOS EUA ESTÁ ARREFECENDO, MAS NÃO QUEBRANDO.
Os dados de hoje nos mostram um quadro misto:
🇺🇸
ISM Manufatura: 54,6 vs 55,2 esperados
👷
JOLTS: 7,27M vs 7,33M esperados
🏭
Emprego na indústria: 51,2 vs 52,8
O crescimento ainda se sustenta, mas o ritmo está esfriando.
Não é um colapso. Mas também não é um sinal verde.
E é exatamente isso que torna a decisão do Fed de setembro interessante.
O teste real vem mais tarde nesta semana:
ADP → ISM de Serviços na quinta → Relatório de Empregos na sexta.
Estou acompanhando de perto o mercado de trabalho.
👀
1
1.2k
Inicia sessão para explorar mais conteúdos
Junta-te a utilizadores de criptomoedas de todo o mundo na Binance Square
⚡️ Obtém informações úteis e recentes sobre criptomoedas.
💬 Com a confiança da maior exchange de criptomoedas do mundo.
👍 Descobre perspetivas reais de criadores verificados.
E-mail/Número de telefone
Tópicos em Tendência
SECReceivesGrayscaleLitecoinTrustETFFiling
49,625 visualizações
1,009 a discutir
#secreceivesgrayscalelitecointrustetffiling
A SEC RECEBE O PROCESSO DO ETF DE LITECOIN DA GRAYSCALE: LTC ACABOU DE GANHAR MAIS DESTAQUE 🚨
O mercado se movia em silêncio quando mais um título sobre Litecoin apareceu. Para traders que observam de fora, era o tipo de processo que faz você pausar e pensar: o acesso institucional está ficando mais perto?
O Grayscale’s Litecoin Trust deu mais um passo em direção a uma estrutura de ETF, com novas documentações ligadas à transição proposta e ao processo de listagem na NYSE Arca. O registro da SEC mostra procedimentos anteriores em torno da proposta de Litecoin da Grayscale, enquanto as atividades mais recentes mantêm a história em evidência.
O ponto importante é que um processo não é uma aprovação. Investidores devem separar o avanço regulatório das expectativas de um lançamento imediato de ETF.
Minha leitura: a história maior é a acessibilidade. Uma estrutura de ETF pode, potencialmente, tornar a exposição ao LTC mais fácil para investidores tradicionais que preferem produtos de mercado regulamentados em vez de manter criptomoedas diretamente.
O Litecoin atualmente é negociado por volta de US$ 53,69 na Binance, com o ativo mostrando um movimento moderado nas últimas 24 horas. Isso torna o desenvolvimento regulatório mais interessante do que apenas correr atrás de uma reação de preço baseada em manchetes.
O teste real vem agora: decisões regulatórias, demanda do mercado, liquidez e se o interesse institucional de fato acompanha a documentação.
Um processo pode abrir a porta, mas a demanda é que decide o que acontece depois que ela se abre.
❓Você acha que um ETF de Litecoin da Grayscale poderia mudar materialmente a demanda institucional por LTC?
Aviso: isto é apenas para fins informativos e não constitui aconselhamento financeiro. Ativos cripto são voláteis, e os resultados regulatórios são incertos.
#Litecoin #CryptoETF #GrowWithSAC $LTC $ETH $SOL
#SECReceivesGrayscaleLitecoinTrustETFFiling
Sienna Leo-你真棒-带我走
·2 gostos
·1.3k visualizações
ClarityActFacesProceduralVoteSept15
169,076 visualizações
1,931 a discutir
US10YearTreasuryYieldNears5%
57,533 visualizações
1,053 a discutir