
AQA992
819 Publicações

AQA992
Denunciar
Bloquear Utilizador
Crypto Analyst | Market Insights | Technical Analysis | Binance Square Creator 📈
Aberto ao trading
Trader Ocasional
4.1 ano(s)
18 A seguir
30 Seguidores
129 Gostaram
Publicações
Portfólio
·
--
Em Baixa
Ver tradução
$XRP
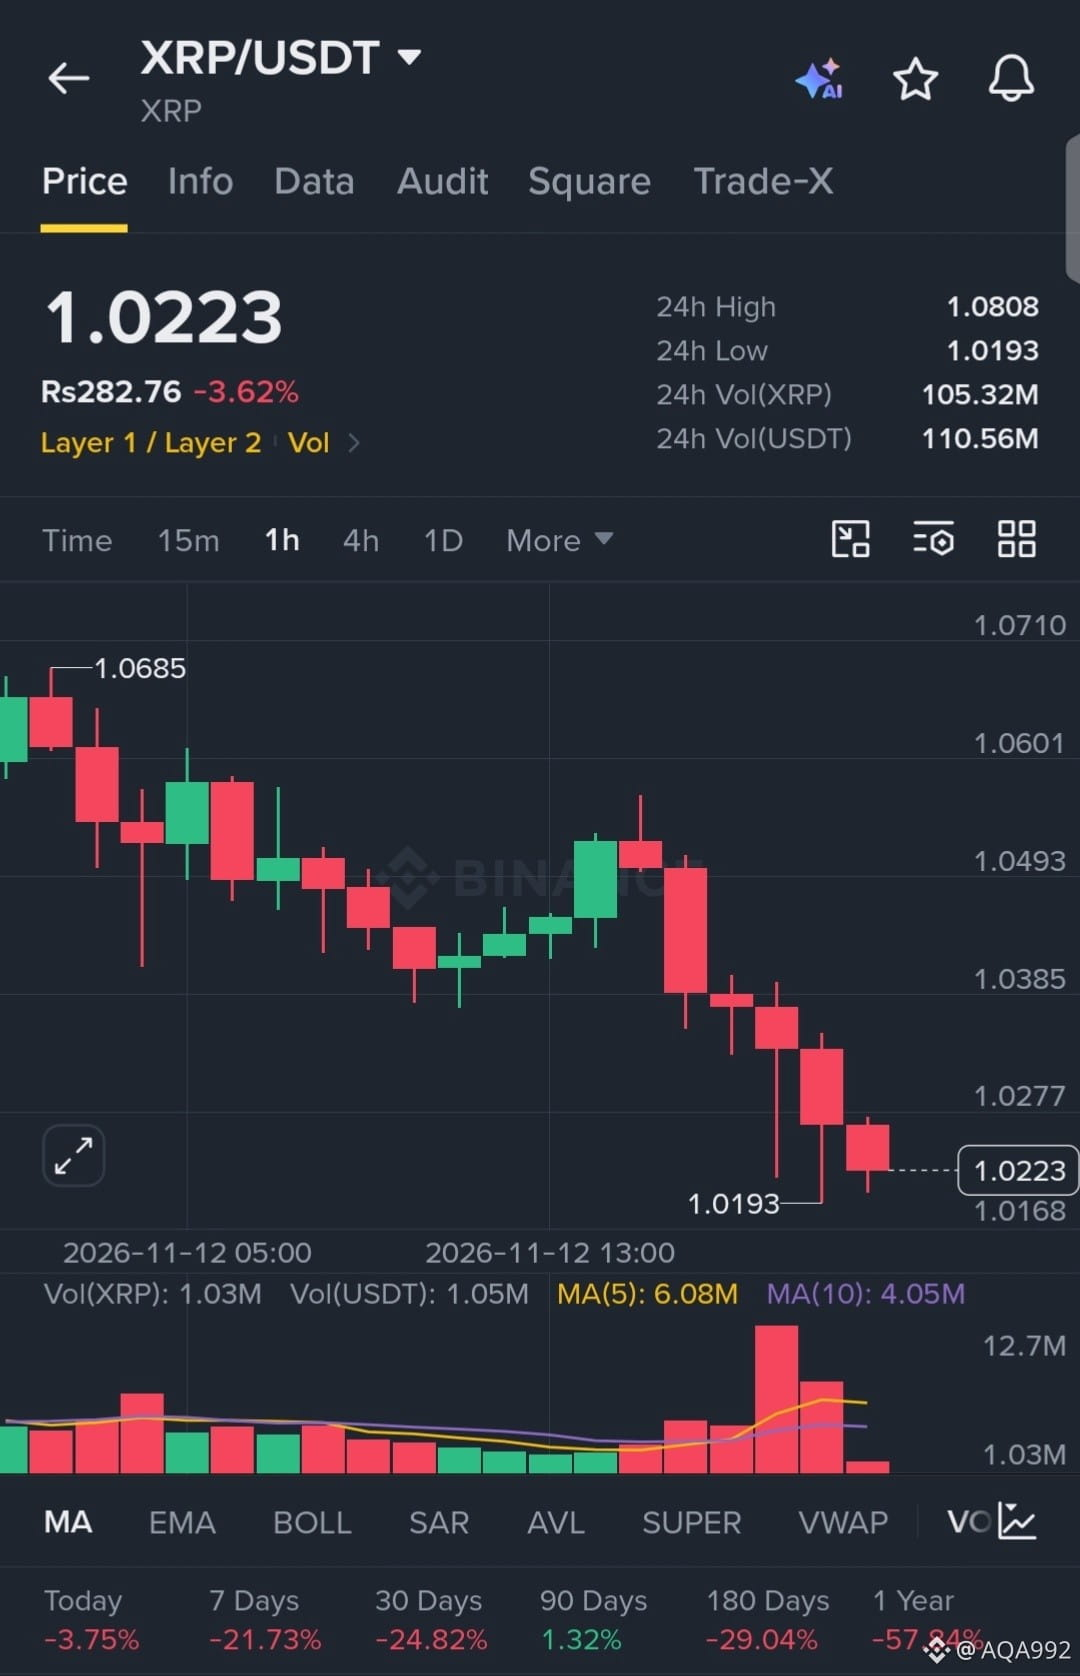
is in a severe downtrend, aggressively slicing through support levels with heavy, relentless sell volume. The 1H chart shows absolute seller dominance with zero signs of buyer absorption at the lows, indicating intense bearish momentum for a clean continuation short.
EP: 1.0223
TP: 1.0100, 0.9950, 0.9800
SL: 1.0450
$XRP
#HuangExitNvidiaStrategyInFocus
#AnthropicRejectsIPODelayValuationinQuestion
#CoreWeaveJumps10%On168%RevenueGrowth
#MSCIRemovalMayCurbStrategy’sBitcoinBuying
#USJoblessClaimsRise
{future}(XRPUSDT)
$XRP
is in a severe downtrend, aggressively slicing through support levels with heavy, relentless sell volume. The 1H chart shows absolute seller dominance with zero signs of buyer absorption at the lows, indicating intense bearish momentum for a clean continuation short.
EP: 1.0223
TP: 1.0100, 0.9950, 0.9800
SL: 1.0450
$XRP
#HuangExitNvidiaStrategyInFocus
#AnthropicRejectsIPODelayValuationinQuestion
#CoreWeaveJumps10%On168%RevenueGrowth
#MSCIRemovalMayCurbStrategy’sBitcoinBuying
#USJoblessClaimsRise
is in a severe downtrend, aggressively slicing through support levels with heavy, relentless sell volume. The 1H chart shows absolute seller dominance with zero signs of buyer absorption at the lows, indicating intense bearish momentum for a clean continuation short.
EP: 1.0223
TP: 1.0100, 0.9950, 0.9800
SL: 1.0450
$XRP
#HuangExitNvidiaStrategyInFocus
#AnthropicRejectsIPODelayValuationinQuestion
#CoreWeaveJumps10%On168%RevenueGrowth
#MSCIRemovalMayCurbStrategy’sBitcoinBuying
#USJoblessClaimsRise
2
·
--
Em Baixa
Trading de $SOL de 30 dias no valor de 8.7 USDT
Ver tradução
$SOL
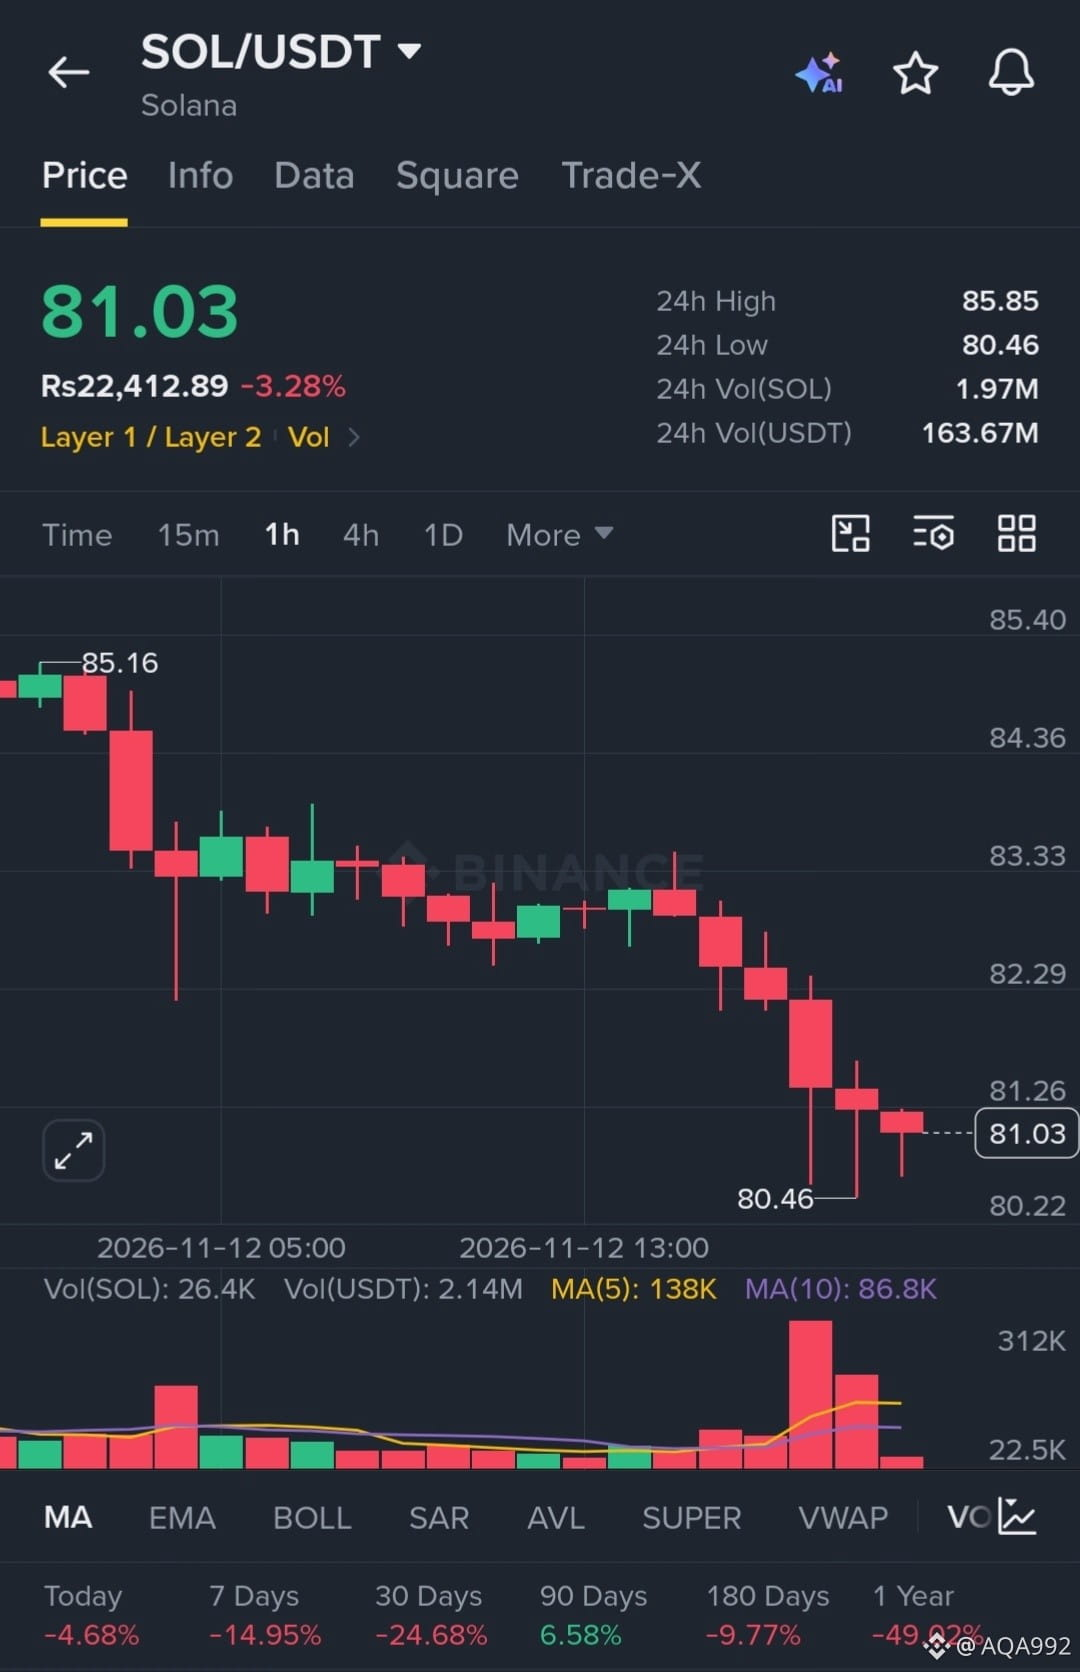
is in a heavy downtrend, aggressively printing lower highs and slicing through support levels with expanding sell volume. The 1H chart shows absolute seller control with no signs of buyer absorption at the lows, signaling intense bearish momentum for a continuation short.
EP: 81.03
TP: 79.00, 77.50, 75.00
SL: 83.50
$SOL
#HuangExitNvidiaStrategyInFocus
#AnthropicRejectsIPODelayValuationinQuestion
#CoreWeaveJumps10%On168%RevenueGrowth
#MSCIRemovalMayCurbStrategy’sBitcoinBuying
#TradFiForBeginners
{future}(SOLUSDT)
$SOL
is in a heavy downtrend, aggressively printing lower highs and slicing through support levels with expanding sell volume. The 1H chart shows absolute seller control with no signs of buyer absorption at the lows, signaling intense bearish momentum for a continuation short.
EP: 81.03
TP: 79.00, 77.50, 75.00
SL: 83.50
$SOL
#HuangExitNvidiaStrategyInFocus
#AnthropicRejectsIPODelayValuationinQuestion
#CoreWeaveJumps10%On168%RevenueGrowth
#MSCIRemovalMayCurbStrategy’sBitcoinBuying
#TradFiForBeginners
is in a heavy downtrend, aggressively printing lower highs and slicing through support levels with expanding sell volume. The 1H chart shows absolute seller control with no signs of buyer absorption at the lows, signaling intense bearish momentum for a continuation short.
EP: 81.03
TP: 79.00, 77.50, 75.00
SL: 83.50
$SOL
#HuangExitNvidiaStrategyInFocus
#AnthropicRejectsIPODelayValuationinQuestion
#CoreWeaveJumps10%On168%RevenueGrowth
#MSCIRemovalMayCurbStrategy’sBitcoinBuying
#TradFiForBeginners
2
·
--
Em Baixa
Ver tradução
$PEPE
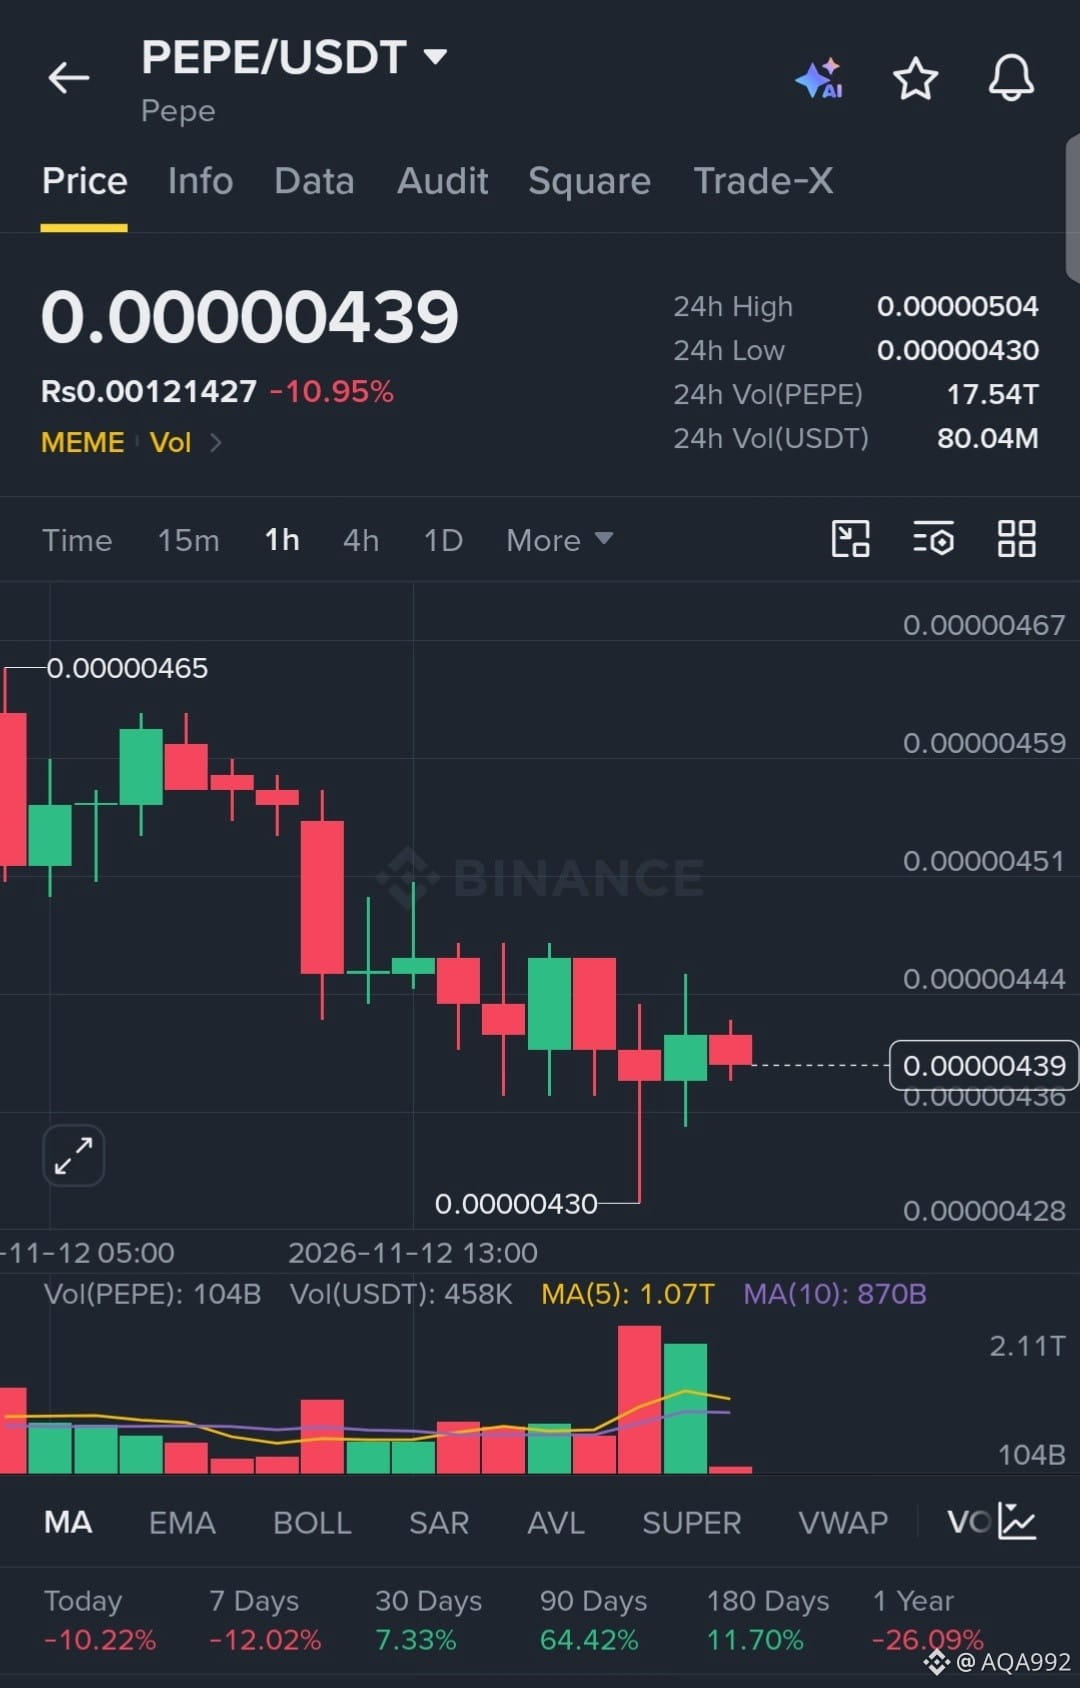
is bleeding aggressively, printing relentless lower highs as sellers smash through support. The 1H chart shows heavy distribution with zero buyer absorption, indicating intense bearish momentum driving a clean continuation short.
EP: 0.00000439
TP: 0.00000428, 0.00000415, 0.00000400
SL: 0.00000455
$PEPE
#HuangExitNvidiaStrategyInFocus
#AnthropicRejectsIPODelayValuationinQuestion
#CoreWeaveJumps10%On168%RevenueGrowth
#MSCIRemovalMayCurbStrategy’sBitcoinBuying
#TradFiForBeginners
{spot}(PEPEUSDT)
$PEPE
is bleeding aggressively, printing relentless lower highs as sellers smash through support. The 1H chart shows heavy distribution with zero buyer absorption, indicating intense bearish momentum driving a clean continuation short.
EP: 0.00000439
TP: 0.00000428, 0.00000415, 0.00000400
SL: 0.00000455
$PEPE
#HuangExitNvidiaStrategyInFocus
#AnthropicRejectsIPODelayValuationinQuestion
#CoreWeaveJumps10%On168%RevenueGrowth
#MSCIRemovalMayCurbStrategy’sBitcoinBuying
#TradFiForBeginners
is bleeding aggressively, printing relentless lower highs as sellers smash through support. The 1H chart shows heavy distribution with zero buyer absorption, indicating intense bearish momentum driving a clean continuation short.
EP: 0.00000439
TP: 0.00000428, 0.00000415, 0.00000400
SL: 0.00000455
$PEPE
#HuangExitNvidiaStrategyInFocus
#AnthropicRejectsIPODelayValuationinQuestion
#CoreWeaveJumps10%On168%RevenueGrowth
#MSCIRemovalMayCurbStrategy’sBitcoinBuying
#TradFiForBeginners
3
·
--
Em Baixa
Ver tradução
$MSFTB
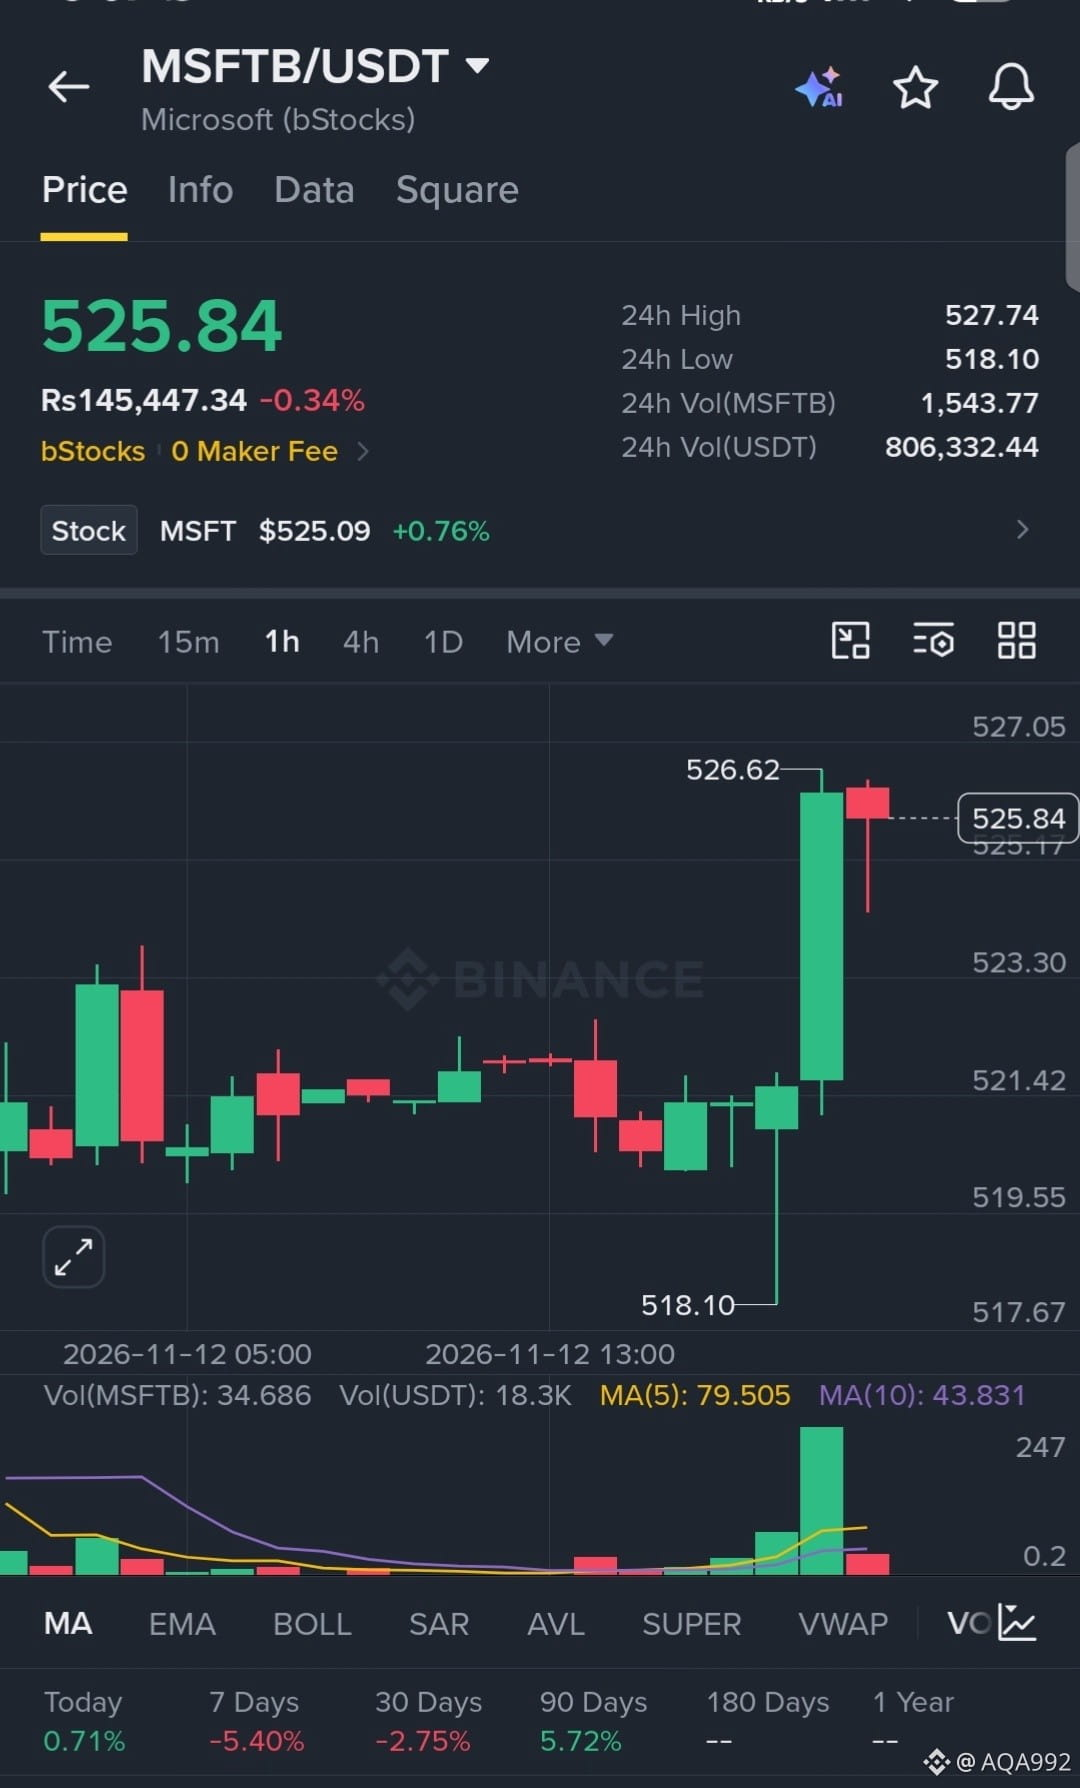
has aggressively swept downside liquidity, printing a sharp capitulation wick to 518.10 before staging a violent V-shaped reversal. The 1H chart shows a massive surge in buy volume reclaiming the local range, signaling heavy momentum for a swift continuation push toward the local high.
EP: 525.84
TP: 531.00, 538.50, 546.00
SL: 517.50
$MSFTB
#HuangExitNvidiaStrategyInFocus
#AnthropicRejectsIPODelayValuationinQuestion
#ChipStocksExtendLossesAfterNvidiaCEOChange
#MSCIRemovalMayCurbStrategy’sBitcoinBuying
#TradFiForBeginners
{spot}(MSFTBUSDT)
$MSFTB
has aggressively swept downside liquidity, printing a sharp capitulation wick to 518.10 before staging a violent V-shaped reversal. The 1H chart shows a massive surge in buy volume reclaiming the local range, signaling heavy momentum for a swift continuation push toward the local high.
EP: 525.84
TP: 531.00, 538.50, 546.00
SL: 517.50
$MSFTB
#HuangExitNvidiaStrategyInFocus
#AnthropicRejectsIPODelayValuationinQuestion
#ChipStocksExtendLossesAfterNvidiaCEOChange
#MSCIRemovalMayCurbStrategy’sBitcoinBuying
#TradFiForBeginners
has aggressively swept downside liquidity, printing a sharp capitulation wick to 518.10 before staging a violent V-shaped reversal. The 1H chart shows a massive surge in buy volume reclaiming the local range, signaling heavy momentum for a swift continuation push toward the local high.
EP: 525.84
TP: 531.00, 538.50, 546.00
SL: 517.50
$MSFTB
#HuangExitNvidiaStrategyInFocus
#AnthropicRejectsIPODelayValuationinQuestion
#ChipStocksExtendLossesAfterNvidiaCEOChange
#MSCIRemovalMayCurbStrategy’sBitcoinBuying
#TradFiForBeginners
2
·
--
Em Alta
Ver tradução
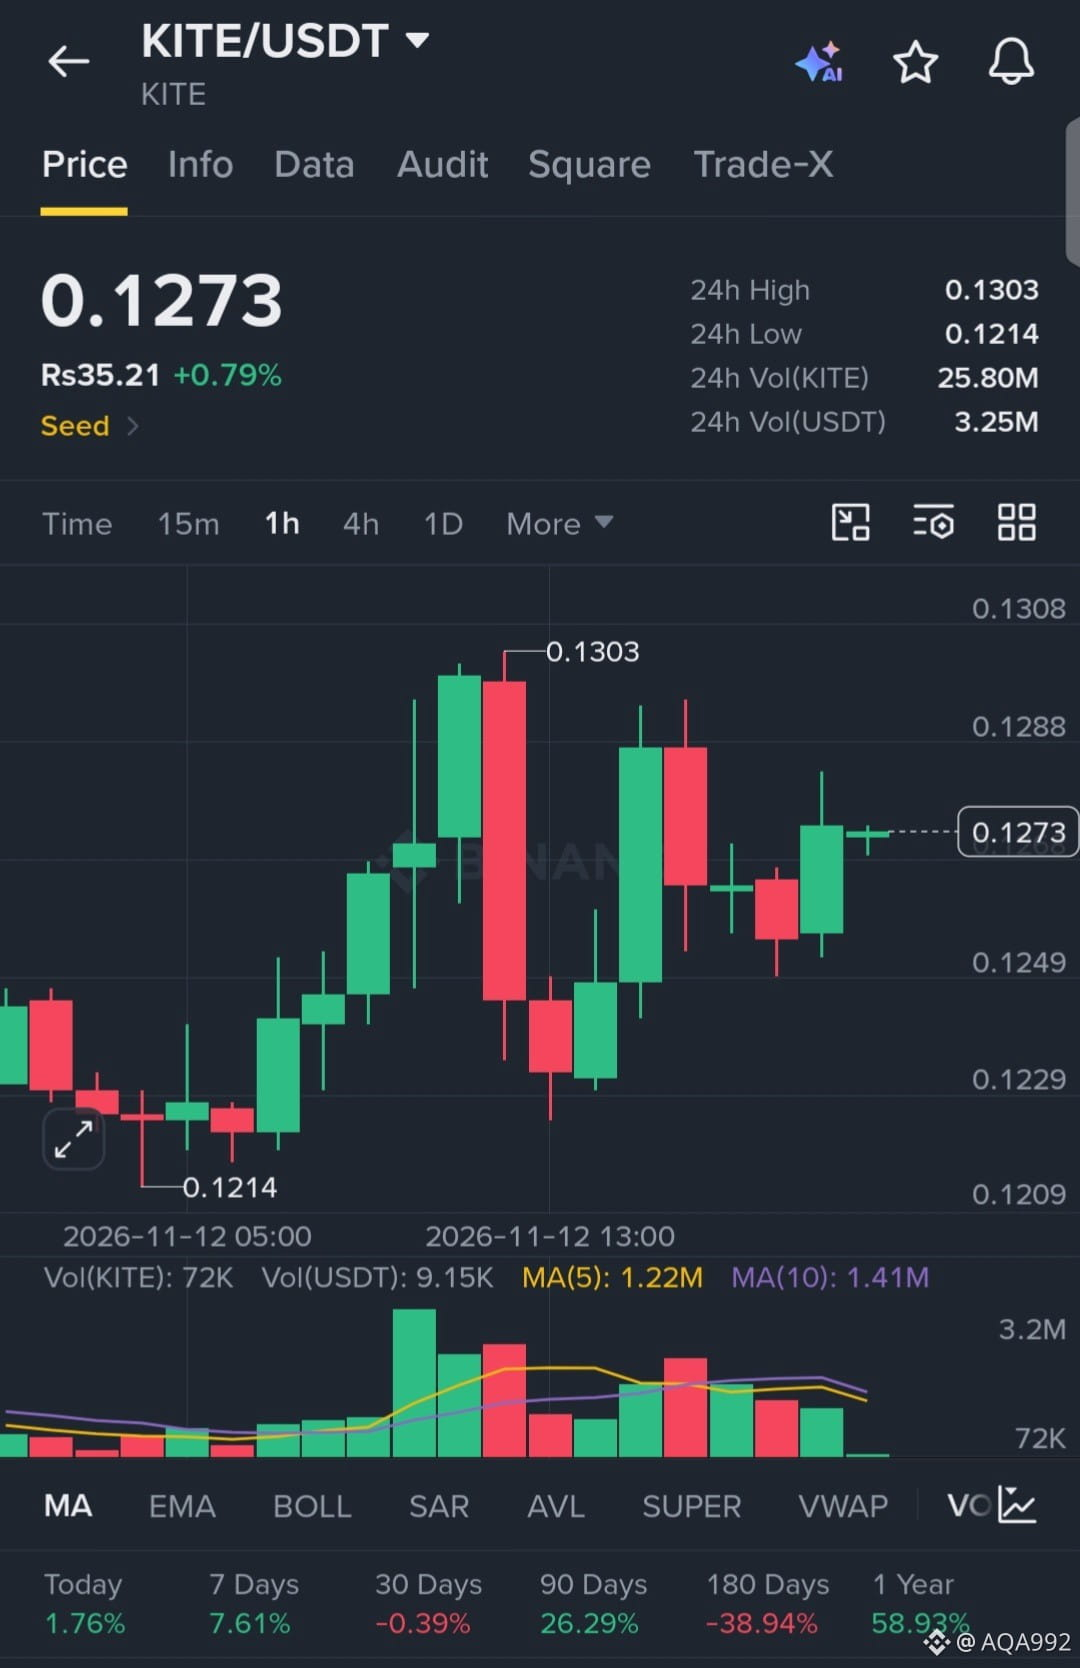
$KITE
is showing intense volatility and aggressive liquidity sweeps, violently rejecting the 0.1214 low to establish a higher-low structure. The 1H chart reveals heavy buyer absorption on dips with volume expanding, signaling coiled momentum ready to smash through local resistance.
EP: 0.1273
TP: 0.1305, 0.1340, 0.1390
SL: 0.1210
$KITE
#HuangExitNvidiaStrategyInFocus
#AnthropicRejectsIPODelayValuationinQuestion #ChipStocksExtendLossesAfterNvidiaCEOChange
#CoreWeaveJumps10%On168%RevenueGrowth
#TradFiForBeginners
{future}(KITEUSDT)
$KITE
is showing intense volatility and aggressive liquidity sweeps, violently rejecting the 0.1214 low to establish a higher-low structure. The 1H chart reveals heavy buyer absorption on dips with volume expanding, signaling coiled momentum ready to smash through local resistance.
EP: 0.1273
TP: 0.1305, 0.1340, 0.1390
SL: 0.1210
$KITE
#HuangExitNvidiaStrategyInFocus
#AnthropicRejectsIPODelayValuationinQuestion #ChipStocksExtendLossesAfterNvidiaCEOChange
#CoreWeaveJumps10%On168%RevenueGrowth
#TradFiForBeginners
is showing intense volatility and aggressive liquidity sweeps, violently rejecting the 0.1214 low to establish a higher-low structure. The 1H chart reveals heavy buyer absorption on dips with volume expanding, signaling coiled momentum ready to smash through local resistance.
EP: 0.1273
TP: 0.1305, 0.1340, 0.1390
SL: 0.1210
$KITE
#HuangExitNvidiaStrategyInFocus
#AnthropicRejectsIPODelayValuationinQuestion #ChipStocksExtendLossesAfterNvidiaCEOChange
#CoreWeaveJumps10%On168%RevenueGrowth
#TradFiForBeginners
2
·
--
Em Baixa
Ver tradução
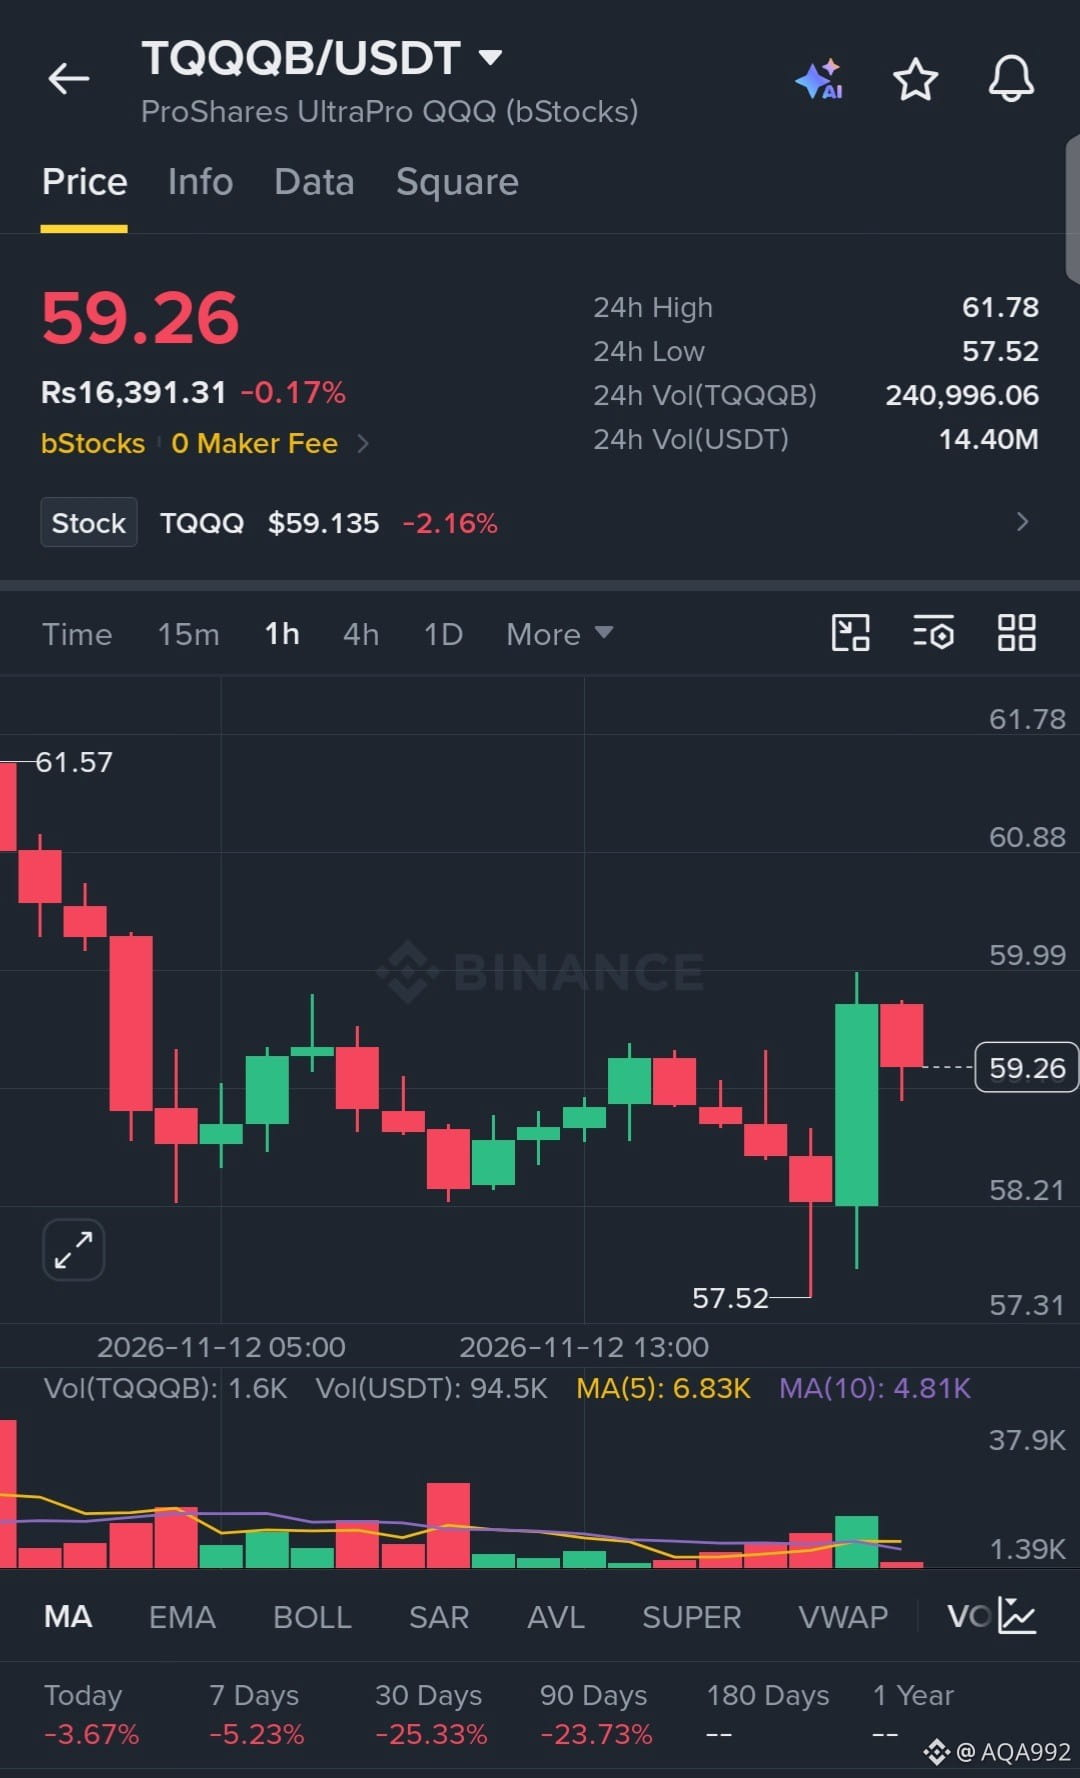
$TQQQB
has aggressively swept downside liquidity, printing a sharp capitulation wick to 57.52 before staging a violent V-shaped reversal. The 1H chart shows intense buyer absorption with volume expanding as the price reclaims the local range, signaling heavy momentum for a swift relief rally.
EP: 59.26
TP: 60.80, 61.80, 63.00
SL: 57.20
$TQQQB
#HuangExitNvidiaStrategyInFocus
#ChipStocksExtendLossesAfterNvidiaCEOChange
#AnthropicRejectsIPODelayValuationinQuestion
#CoreWeaveJumps10%On168%RevenueGrowth
#MSCIRemovalMayCurbStrategy’sBitcoinBuying
{spot}(TQQQBUSDT)
$TQQQB
has aggressively swept downside liquidity, printing a sharp capitulation wick to 57.52 before staging a violent V-shaped reversal. The 1H chart shows intense buyer absorption with volume expanding as the price reclaims the local range, signaling heavy momentum for a swift relief rally.
EP: 59.26
TP: 60.80, 61.80, 63.00
SL: 57.20
$TQQQB
#HuangExitNvidiaStrategyInFocus
#ChipStocksExtendLossesAfterNvidiaCEOChange
#AnthropicRejectsIPODelayValuationinQuestion
#CoreWeaveJumps10%On168%RevenueGrowth
#MSCIRemovalMayCurbStrategy’sBitcoinBuying
has aggressively swept downside liquidity, printing a sharp capitulation wick to 57.52 before staging a violent V-shaped reversal. The 1H chart shows intense buyer absorption with volume expanding as the price reclaims the local range, signaling heavy momentum for a swift relief rally.
EP: 59.26
TP: 60.80, 61.80, 63.00
SL: 57.20
$TQQQB
#HuangExitNvidiaStrategyInFocus
#ChipStocksExtendLossesAfterNvidiaCEOChange
#AnthropicRejectsIPODelayValuationinQuestion
#CoreWeaveJumps10%On168%RevenueGrowth
#MSCIRemovalMayCurbStrategy’sBitcoinBuying
2
·
--
Em Baixa
Ver tradução
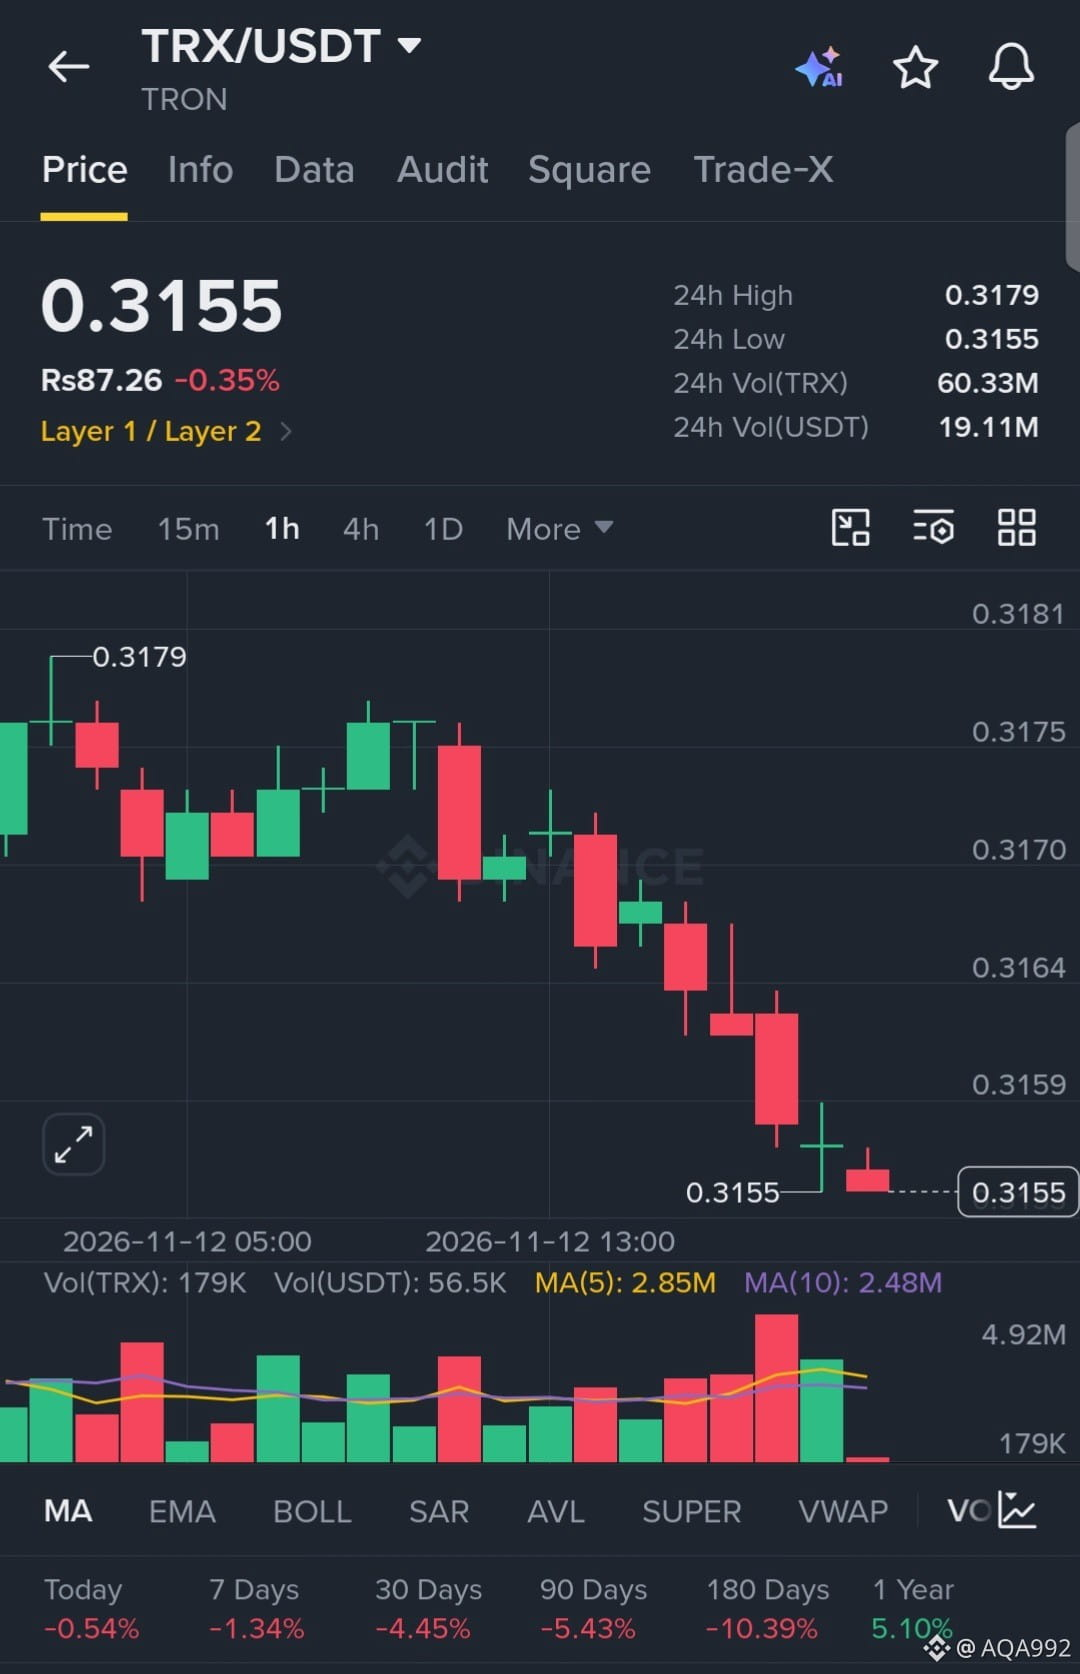
$TRX
is bleeding aggressively, printing relentless lower highs as sellers smash through local support. The 1H chart shows steady distribution with absolutely zero signs of buyer absorption, indicating heavy bearish momentum driving a clean continuation short.
EP: 0.3155
TP: 0.3130, 0.3105, 0.3080
SL: 0.3190
$TRX
#HuangExitNvidiaStrategyInFocus
#ChipStocksExtendLossesAfterNvidiaCEOChange
#AnthropicRejectsIPODelayValuationinQuestion
#MSCIRemovalMayCurbStrategy’sBitcoinBuying
#TradFiForBeginners
{future}(TRXUSDT)
$TRX
is bleeding aggressively, printing relentless lower highs as sellers smash through local support. The 1H chart shows steady distribution with absolutely zero signs of buyer absorption, indicating heavy bearish momentum driving a clean continuation short.
EP: 0.3155
TP: 0.3130, 0.3105, 0.3080
SL: 0.3190
$TRX
#HuangExitNvidiaStrategyInFocus
#ChipStocksExtendLossesAfterNvidiaCEOChange
#AnthropicRejectsIPODelayValuationinQuestion
#MSCIRemovalMayCurbStrategy’sBitcoinBuying
#TradFiForBeginners
is bleeding aggressively, printing relentless lower highs as sellers smash through local support. The 1H chart shows steady distribution with absolutely zero signs of buyer absorption, indicating heavy bearish momentum driving a clean continuation short.
EP: 0.3155
TP: 0.3130, 0.3105, 0.3080
SL: 0.3190
$TRX
#HuangExitNvidiaStrategyInFocus
#ChipStocksExtendLossesAfterNvidiaCEOChange
#AnthropicRejectsIPODelayValuationinQuestion
#MSCIRemovalMayCurbStrategy’sBitcoinBuying
#TradFiForBeginners
4
·
--
Em Alta
Ver tradução
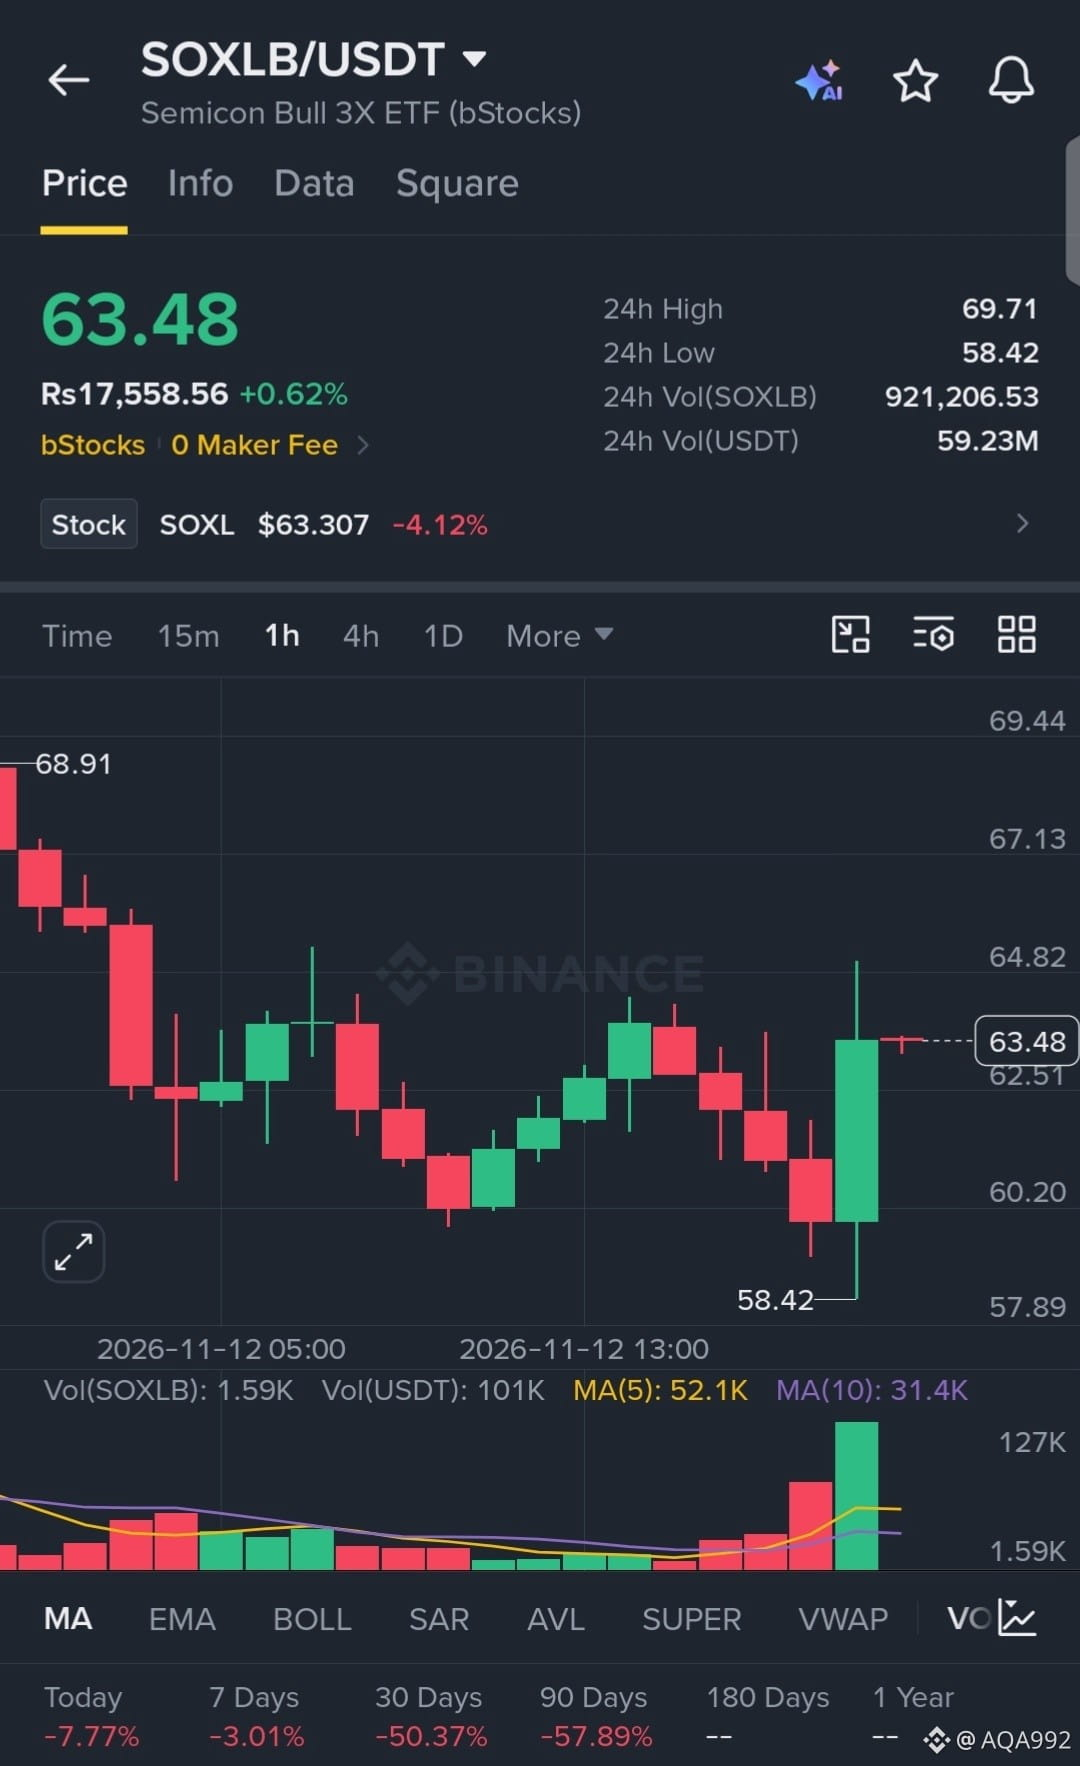
$SOXLB
has aggressively swept downside liquidity, printing a sharp capitulation wick to 58.42 before staging a violent V-shaped reversal. The 1H chart shows a massive surge in buy volume reclaiming the local range, signaling intense momentum for a swift relief rally.
EP: 63.48
TP: 65.50, 68.00, 70.50
SL: 58.00
$SOXLB
#HuangExitNvidiaStrategyInFocus
#ChipStocksExtendLossesAfterNvidiaCEOChange
#AnthropicRejectsIPODelayValuationinQuestion
#CoreWeaveJumps10%On168%RevenueGrowth
#MSCIRemovalMayCurbStrategy’sBitcoinBuying
{spot}(SOXLBUSDT)
$SOXLB
has aggressively swept downside liquidity, printing a sharp capitulation wick to 58.42 before staging a violent V-shaped reversal. The 1H chart shows a massive surge in buy volume reclaiming the local range, signaling intense momentum for a swift relief rally.
EP: 63.48
TP: 65.50, 68.00, 70.50
SL: 58.00
$SOXLB
#HuangExitNvidiaStrategyInFocus
#ChipStocksExtendLossesAfterNvidiaCEOChange
#AnthropicRejectsIPODelayValuationinQuestion
#CoreWeaveJumps10%On168%RevenueGrowth
#MSCIRemovalMayCurbStrategy’sBitcoinBuying
has aggressively swept downside liquidity, printing a sharp capitulation wick to 58.42 before staging a violent V-shaped reversal. The 1H chart shows a massive surge in buy volume reclaiming the local range, signaling intense momentum for a swift relief rally.
EP: 63.48
TP: 65.50, 68.00, 70.50
SL: 58.00
$SOXLB
#HuangExitNvidiaStrategyInFocus
#ChipStocksExtendLossesAfterNvidiaCEOChange
#AnthropicRejectsIPODelayValuationinQuestion
#CoreWeaveJumps10%On168%RevenueGrowth
#MSCIRemovalMayCurbStrategy’sBitcoinBuying
3
·
--
Em Baixa
$KAVA
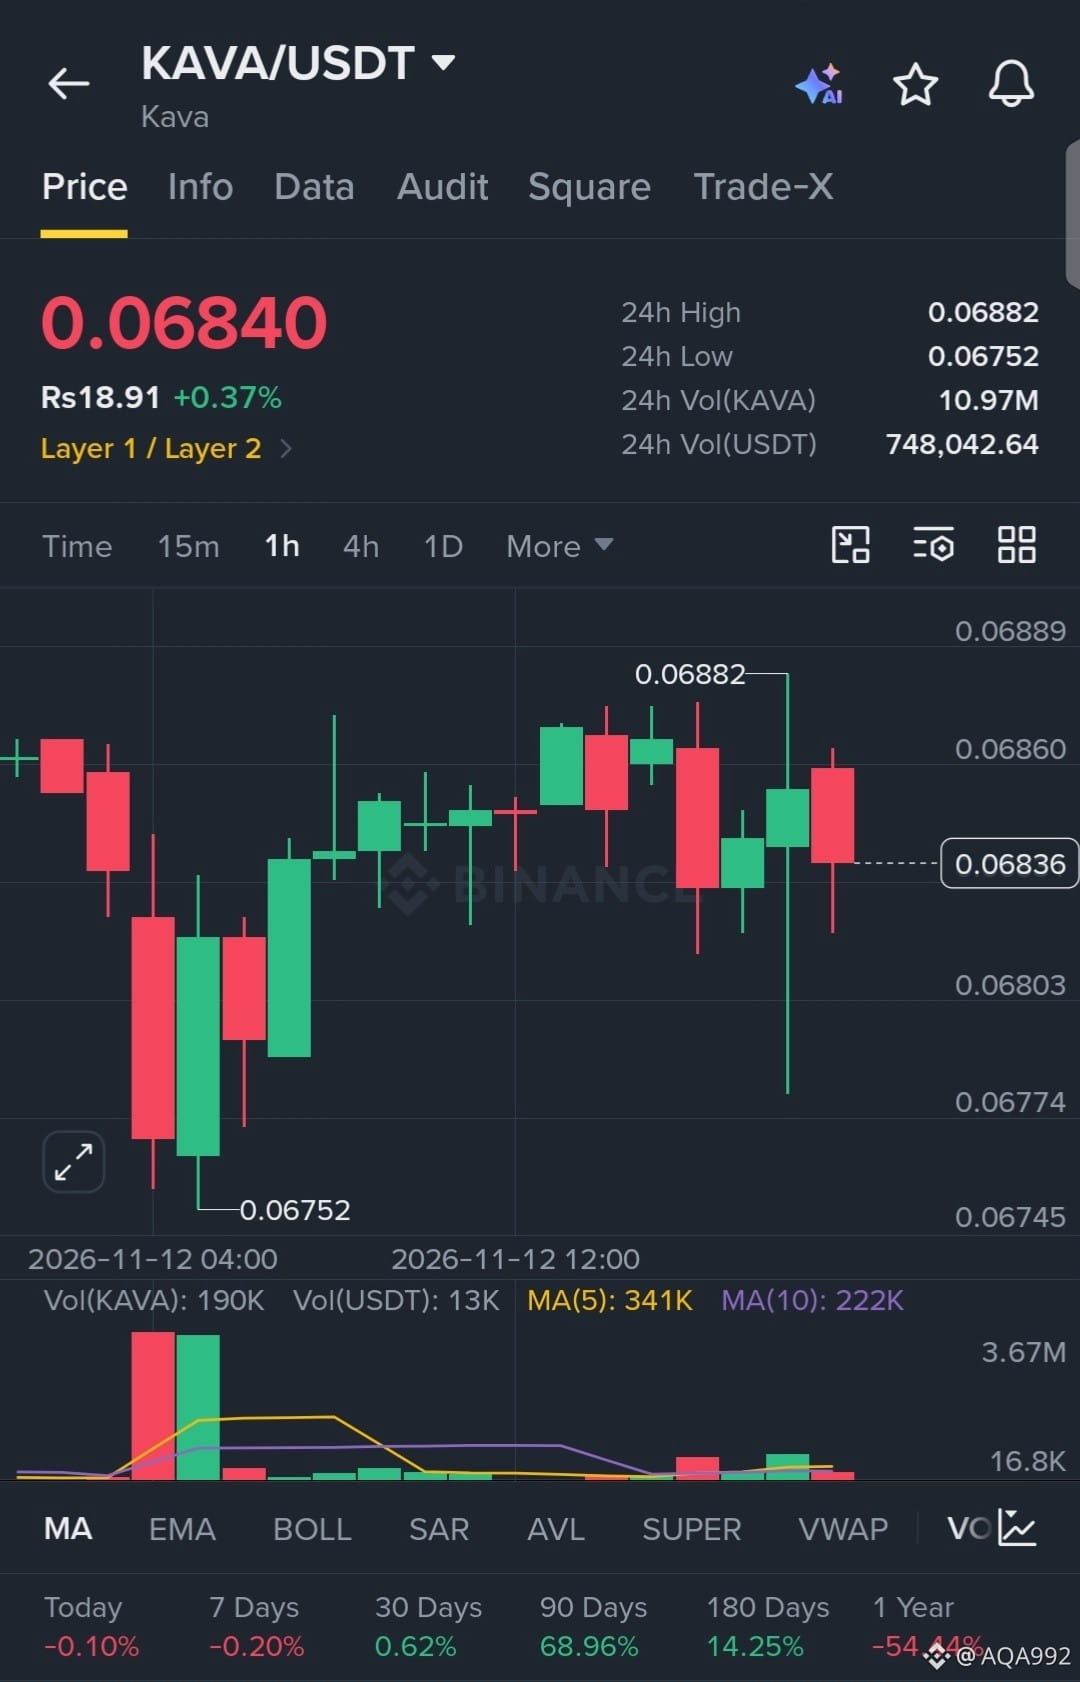
está se comprimindo perto das máximas locais, defendendo agressivamente a zona de suporte de 0.0680 após uma forte varrida de liquidez. O gráfico de 1H revela intensa absorção compradora em cada queda, sinalizando forte acumulação e um impulso contido, pronto para romper a resistência de 0.06882.
EP: 0.06840
TP: 0.06950, 0.07050, 0.07200
SL: 0.06720
$KAVA
#HuangExitNvidiaStrategyInFocus
#ChipStocksExtendLossesAfterNvidiaCEOChange
#AnthropicRejectsIPODelayValuationinQuestion
#CoreWeaveJumps10%On168%RevenueGrowth
#MSCIRemovalMayCurbStrategy’sBitcoinBuying
{future}(KAVAUSDT)
$KAVA
está se comprimindo perto das máximas locais, defendendo agressivamente a zona de suporte de 0.0680 após uma forte varrida de liquidez. O gráfico de 1H revela intensa absorção compradora em cada queda, sinalizando forte acumulação e um impulso contido, pronto para romper a resistência de 0.06882.
EP: 0.06840
TP: 0.06950, 0.07050, 0.07200
SL: 0.06720
$KAVA
#HuangExitNvidiaStrategyInFocus
#ChipStocksExtendLossesAfterNvidiaCEOChange
#AnthropicRejectsIPODelayValuationinQuestion
#CoreWeaveJumps10%On168%RevenueGrowth
#MSCIRemovalMayCurbStrategy’sBitcoinBuying
está se comprimindo perto das máximas locais, defendendo agressivamente a zona de suporte de 0.0680 após uma forte varrida de liquidez. O gráfico de 1H revela intensa absorção compradora em cada queda, sinalizando forte acumulação e um impulso contido, pronto para romper a resistência de 0.06882.
EP: 0.06840
TP: 0.06950, 0.07050, 0.07200
SL: 0.06720
$KAVA
#HuangExitNvidiaStrategyInFocus
#ChipStocksExtendLossesAfterNvidiaCEOChange
#AnthropicRejectsIPODelayValuationinQuestion
#CoreWeaveJumps10%On168%RevenueGrowth
#MSCIRemovalMayCurbStrategy’sBitcoinBuying
4
·
--
Em Alta
$AAPLB
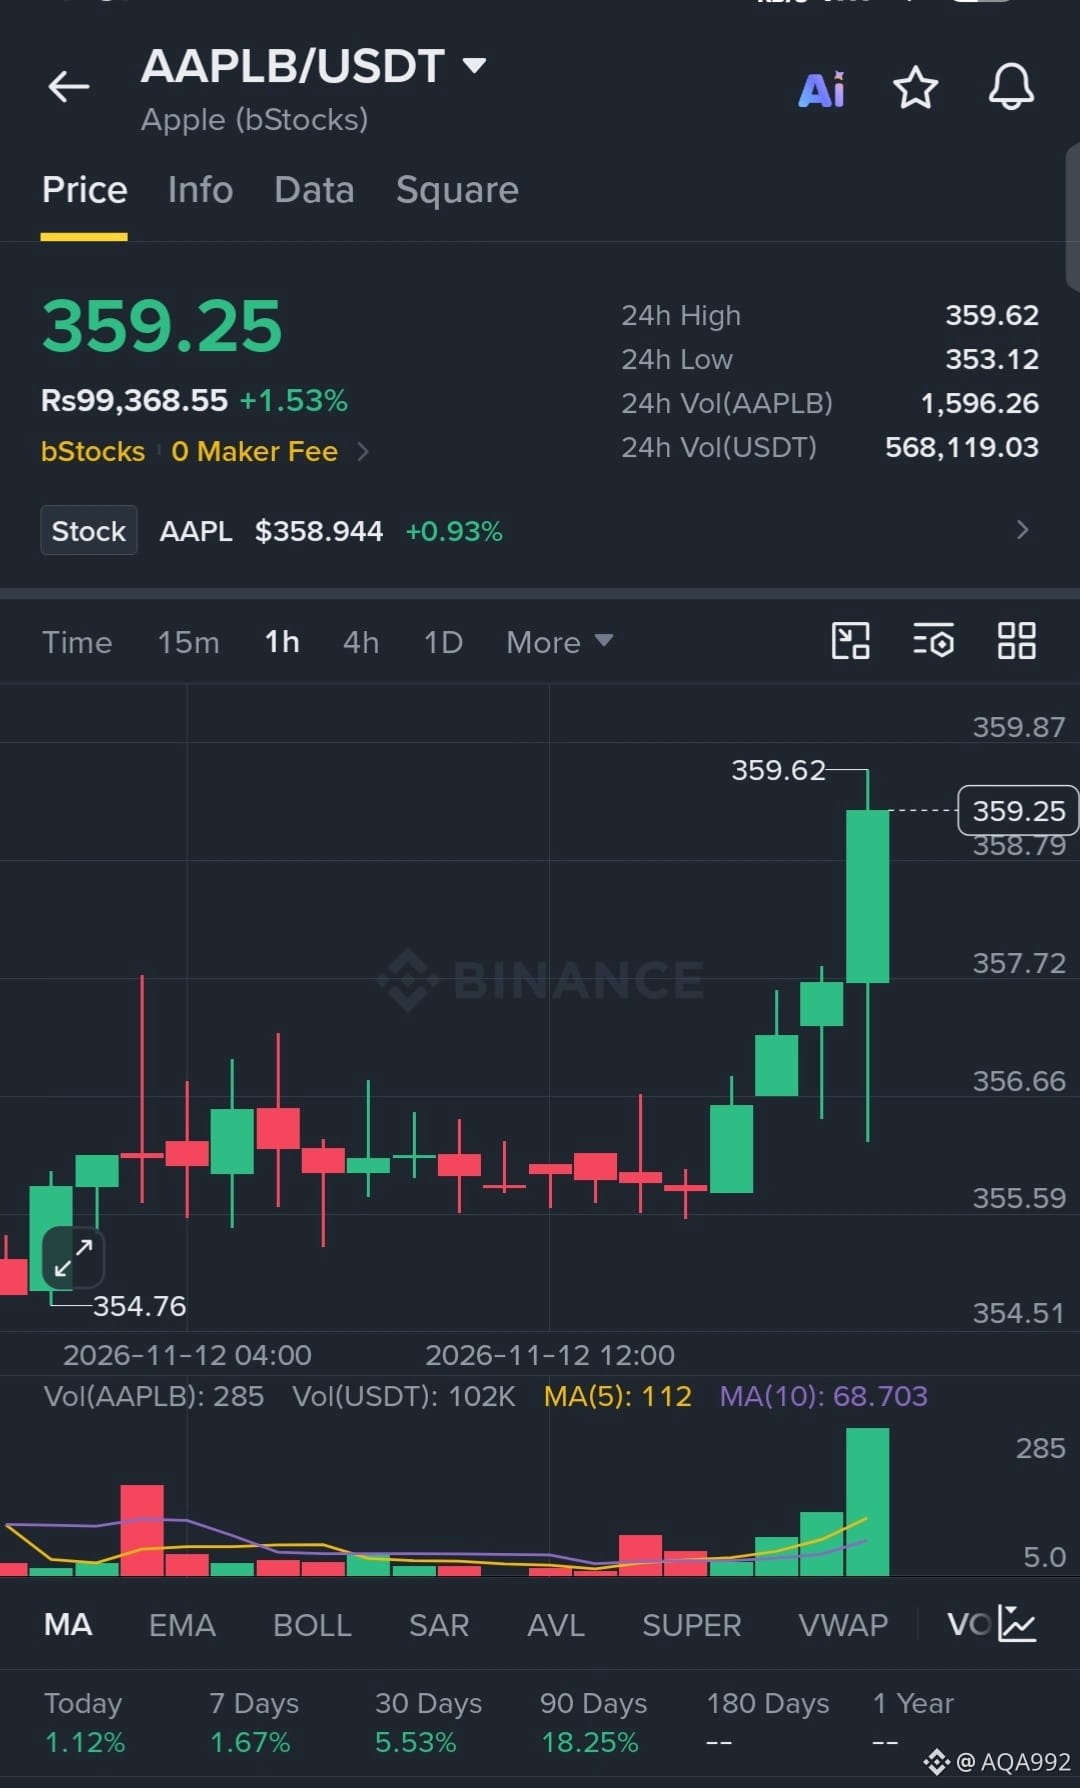
está demonstrando uma continuação de alta clássica, estabelecendo uma forte sequência de fundos ascendentes e rompendo a resistência local com um aumento expressivo no volume. O gráfico de 1H mostra uma absorção agressiva por parte dos compradores a cada recuo, sinalizando um forte momentum, pronto para superar a máxima imediata em 359.62.
EP: 359.25
TP: 362.50, 366.00, 370.00
SL: 353.50
$AAPLB
#HuangExitNvidiaStrategyInFocus
#ChipStocksExtendLossesAfterNvidiaCEOChange
#AnthropicRejectsIPODelayValuationinQuestion
#CoreWeaveJumps10%On168%RevenueGrowth
#MSCIRemovalMayCurbStrategy’sBitcoinBuying
{spot}(AAPLBUSDT)
$AAPLB
está demonstrando uma continuação de alta clássica, estabelecendo uma forte sequência de fundos ascendentes e rompendo a resistência local com um aumento expressivo no volume. O gráfico de 1H mostra uma absorção agressiva por parte dos compradores a cada recuo, sinalizando um forte momentum, pronto para superar a máxima imediata em 359.62.
EP: 359.25
TP: 362.50, 366.00, 370.00
SL: 353.50
$AAPLB
#HuangExitNvidiaStrategyInFocus
#ChipStocksExtendLossesAfterNvidiaCEOChange
#AnthropicRejectsIPODelayValuationinQuestion
#CoreWeaveJumps10%On168%RevenueGrowth
#MSCIRemovalMayCurbStrategy’sBitcoinBuying
está demonstrando uma continuação de alta clássica, estabelecendo uma forte sequência de fundos ascendentes e rompendo a resistência local com um aumento expressivo no volume. O gráfico de 1H mostra uma absorção agressiva por parte dos compradores a cada recuo, sinalizando um forte momentum, pronto para superar a máxima imediata em 359.62.
EP: 359.25
TP: 362.50, 366.00, 370.00
SL: 353.50
$AAPLB
#HuangExitNvidiaStrategyInFocus
#ChipStocksExtendLossesAfterNvidiaCEOChange
#AnthropicRejectsIPODelayValuationinQuestion
#CoreWeaveJumps10%On168%RevenueGrowth
#MSCIRemovalMayCurbStrategy’sBitcoinBuying
5
·
--
Em Alta
$AVGOB
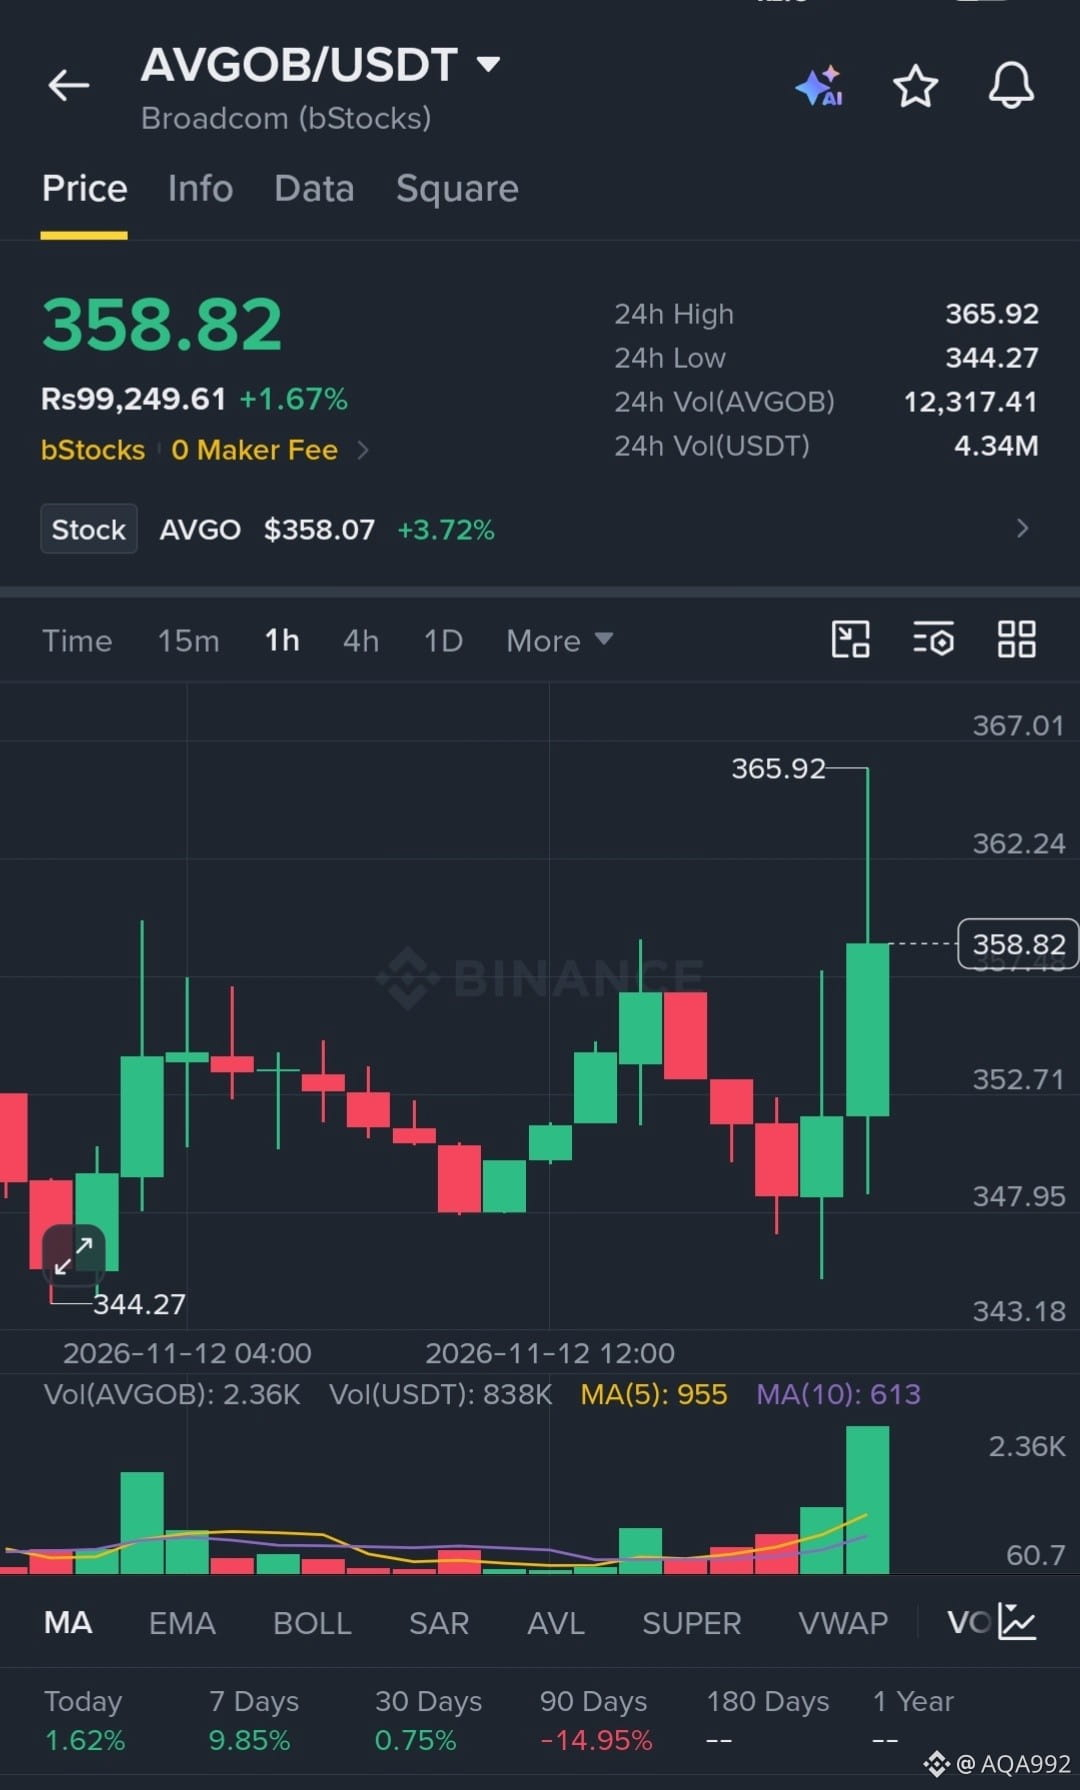
está apresentando uma estrutura fortemente altista, defendendo agressivamente a zona de rompimento recente após uma forte varredura de liquidez até 344.27. O gráfico de 1H revela forte absorção de volume nas quedas e rejeição da máxima local em 365.92, sinalizando um momentum acumulado, pronto para um rompimento de continuação.
Entrada: 358.82
Alvos: 366.00, 374.50, 385.00
Stop Loss: 346.00
$AVGOB
#HuangExitNvidiaStrategyInFocus
#ChipStocksExtendLossesAfterNvidiaCEOChange
#AnthropicRejectsIPODelayValuationinQuestion
#MSCIRemovalMayCurbStrategy’sBitcoinBuying
#TradFiForBeginners
{spot}(AVGOBUSDT)
$AVGOB
está apresentando uma estrutura fortemente altista, defendendo agressivamente a zona de rompimento recente após uma forte varredura de liquidez até 344.27. O gráfico de 1H revela forte absorção de volume nas quedas e rejeição da máxima local em 365.92, sinalizando um momentum acumulado, pronto para um rompimento de continuação.
Entrada: 358.82
Alvos: 366.00, 374.50, 385.00
Stop Loss: 346.00
$AVGOB
#HuangExitNvidiaStrategyInFocus
#ChipStocksExtendLossesAfterNvidiaCEOChange
#AnthropicRejectsIPODelayValuationinQuestion
#MSCIRemovalMayCurbStrategy’sBitcoinBuying
#TradFiForBeginners
está apresentando uma estrutura fortemente altista, defendendo agressivamente a zona de rompimento recente após uma forte varredura de liquidez até 344.27. O gráfico de 1H revela forte absorção de volume nas quedas e rejeição da máxima local em 365.92, sinalizando um momentum acumulado, pronto para um rompimento de continuação.
Entrada: 358.82
Alvos: 366.00, 374.50, 385.00
Stop Loss: 346.00
$AVGOB
#HuangExitNvidiaStrategyInFocus
#ChipStocksExtendLossesAfterNvidiaCEOChange
#AnthropicRejectsIPODelayValuationinQuestion
#MSCIRemovalMayCurbStrategy’sBitcoinBuying
#TradFiForBeginners
3
·
--
Em Alta
$AMZNB
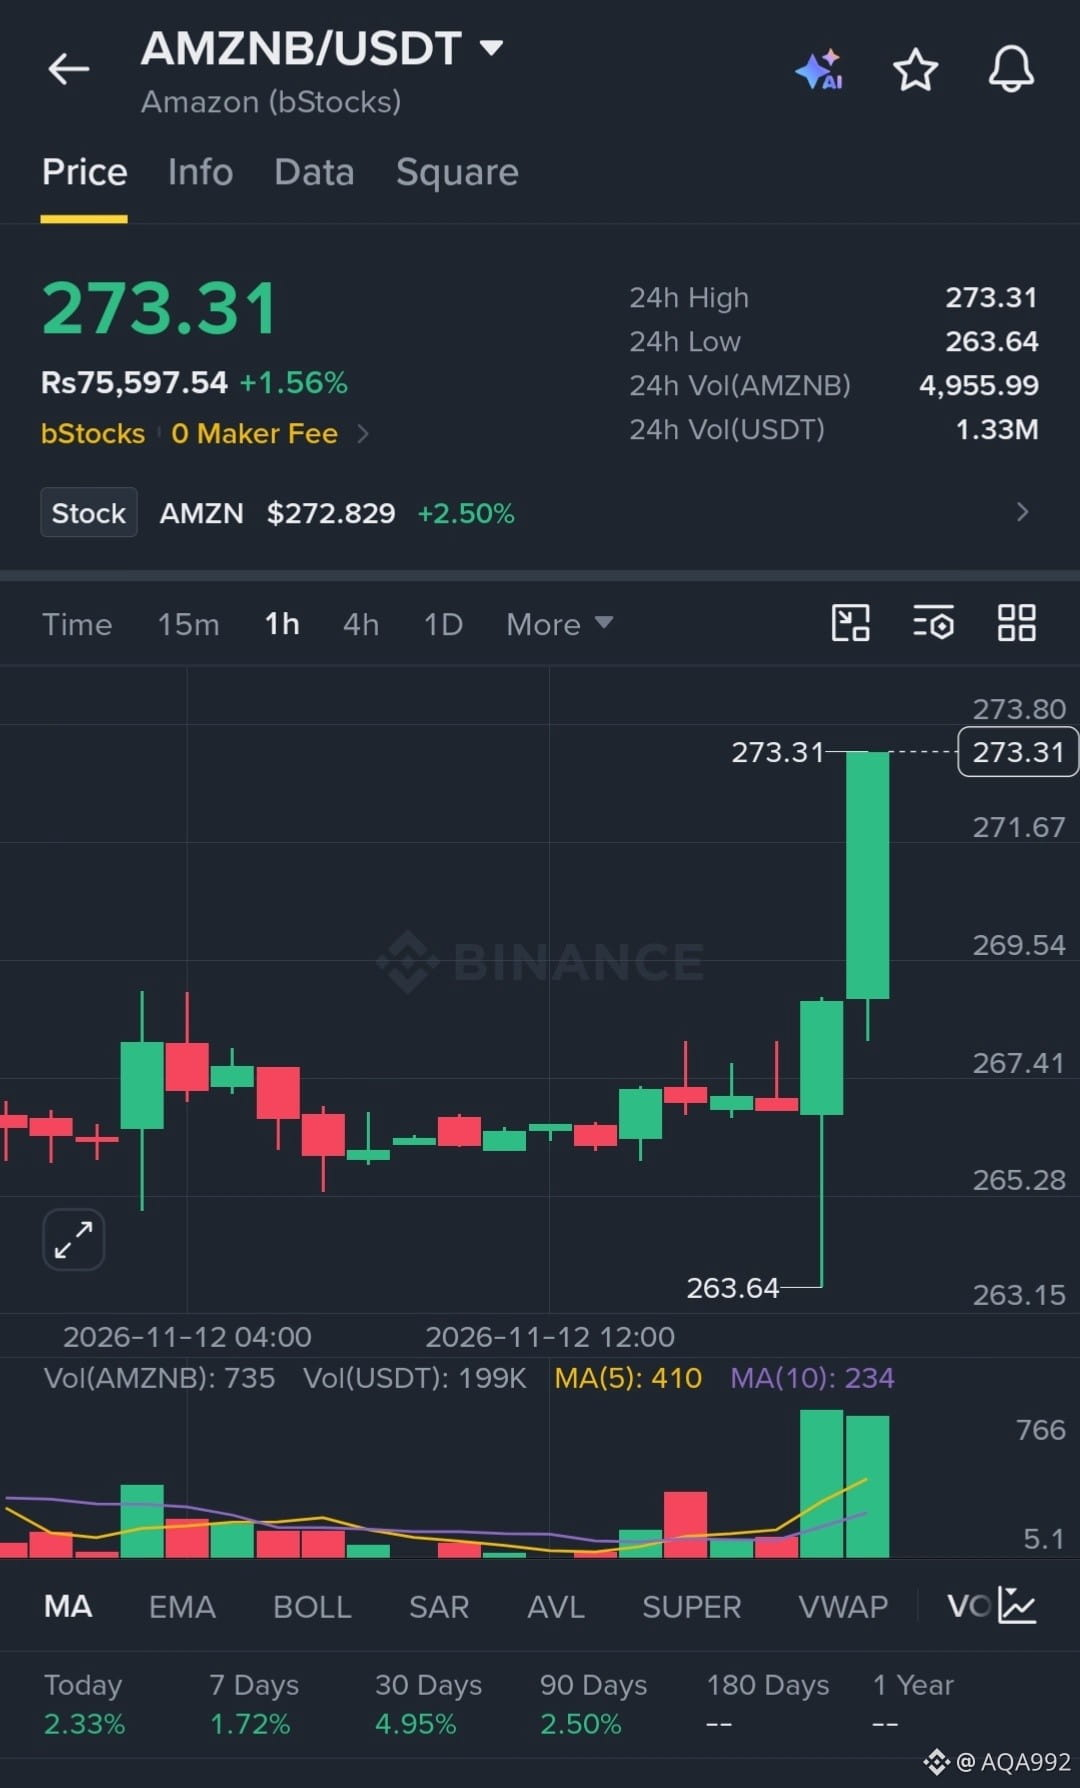
desencadeou uma forte ruptura de alta, superando agressivamente a resistência local com um enorme pico de volume de alta convicção. O gráfico de 1H mostra domínio absoluto dos compradores, estabelecendo uma recuperação acentuada em V a partir da mínima de 263.64. O momentum está totalmente preparado para uma continuação imediata rumo à descoberta de preços.
EP: 273.31
TP: 278.00, 284.50, 292.00
SL: 265.00
$AMZNB
#HuangExitNvidiaStrategyInFocus
#ChipStocksExtendLossesAfterNvidiaCEOChange
#AnthropicRejectsIPODelayValuationinQuestion
#CoreWeaveJumps10%On168%RevenueGrowth
#TradFiForBeginners
{spot}(AMZNBUSDT)
$AMZNB
desencadeou uma forte ruptura de alta, superando agressivamente a resistência local com um enorme pico de volume de alta convicção. O gráfico de 1H mostra domínio absoluto dos compradores, estabelecendo uma recuperação acentuada em V a partir da mínima de 263.64. O momentum está totalmente preparado para uma continuação imediata rumo à descoberta de preços.
EP: 273.31
TP: 278.00, 284.50, 292.00
SL: 265.00
$AMZNB
#HuangExitNvidiaStrategyInFocus
#ChipStocksExtendLossesAfterNvidiaCEOChange
#AnthropicRejectsIPODelayValuationinQuestion
#CoreWeaveJumps10%On168%RevenueGrowth
#TradFiForBeginners
desencadeou uma forte ruptura de alta, superando agressivamente a resistência local com um enorme pico de volume de alta convicção. O gráfico de 1H mostra domínio absoluto dos compradores, estabelecendo uma recuperação acentuada em V a partir da mínima de 263.64. O momentum está totalmente preparado para uma continuação imediata rumo à descoberta de preços.
EP: 273.31
TP: 278.00, 284.50, 292.00
SL: 265.00
$AMZNB
#HuangExitNvidiaStrategyInFocus
#ChipStocksExtendLossesAfterNvidiaCEOChange
#AnthropicRejectsIPODelayValuationinQuestion
#CoreWeaveJumps10%On168%RevenueGrowth
#TradFiForBeginners
4
·
--
Em Alta
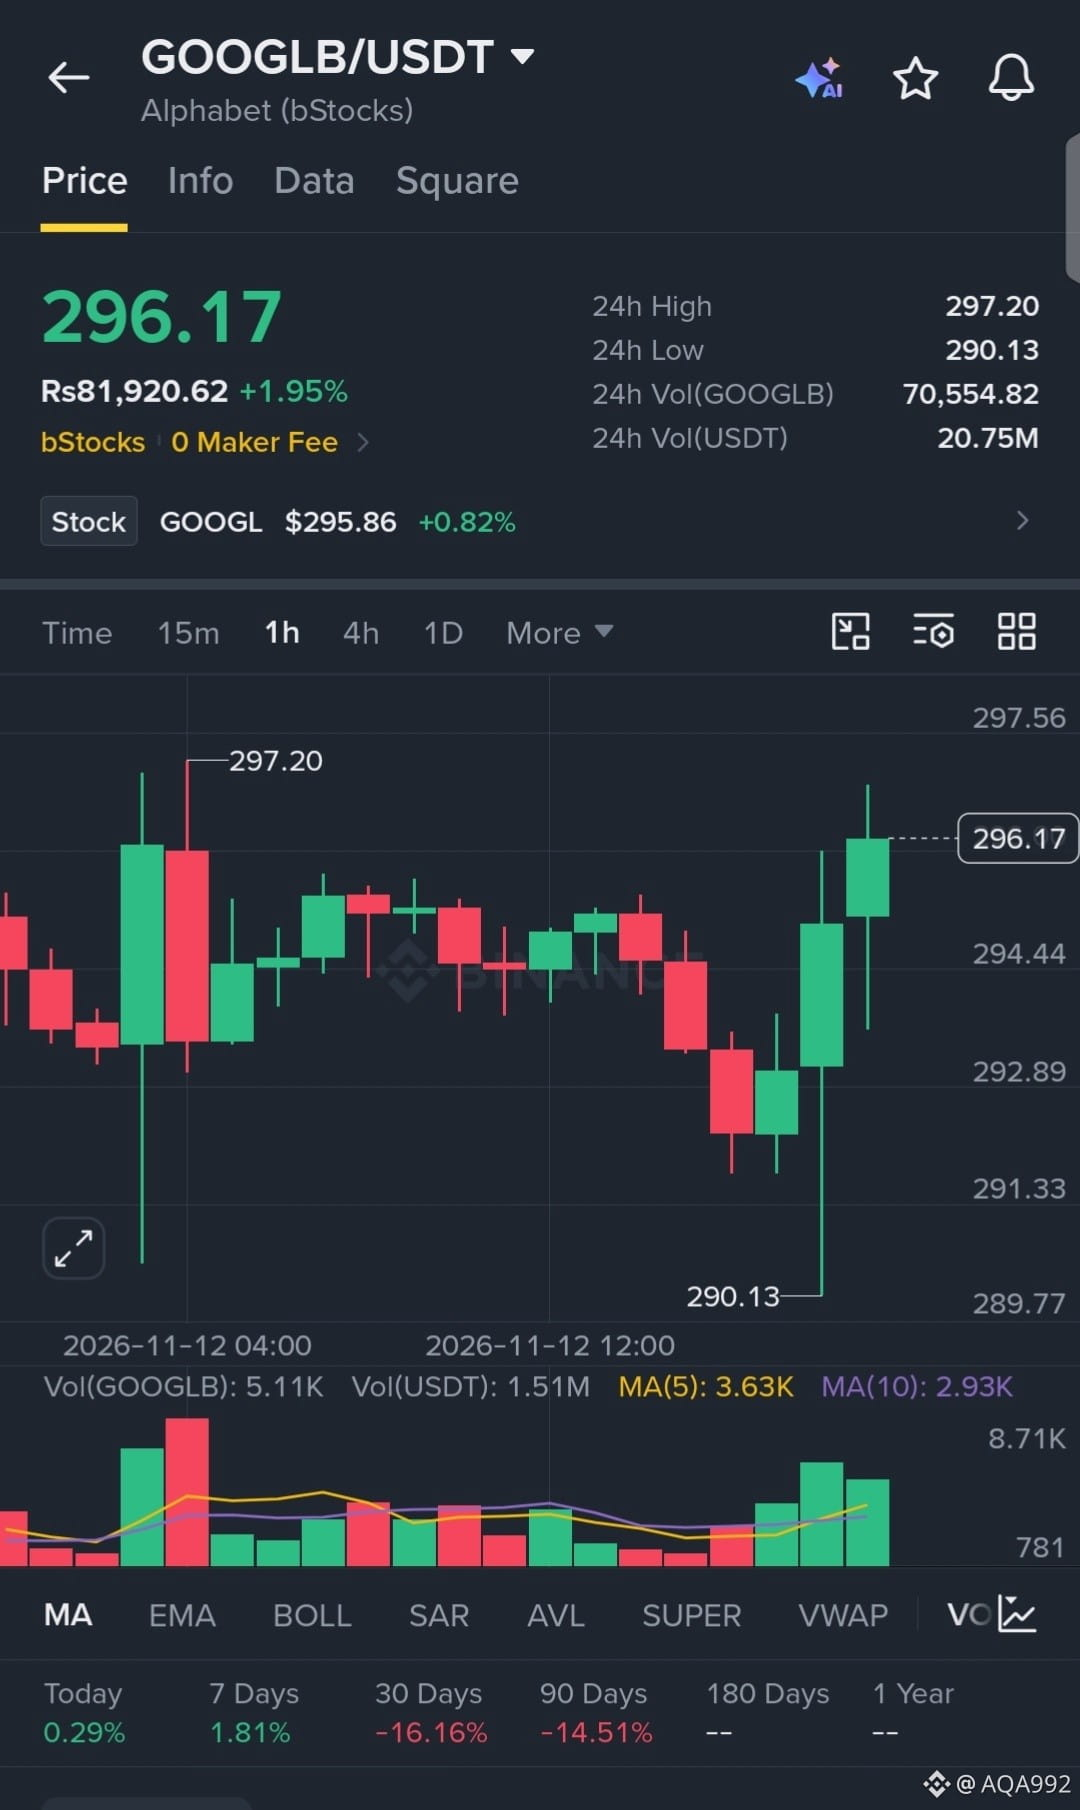
$GOOGLB
varreu agressivamente a liquidez abaixo, formando um longo pavio de capitulação até 290.13 antes de protagonizar uma violenta reversão em V. O gráfico de 1H mostra absorção imediata pelos compradores, com um pico de volume recuperando a faixa local e sinalizando forte momentum para uma nova alta em direção às máximas anteriores.
EP: 296.17
TP: 300.00, 305.50, 312.00
SL: 289.00
$GOOGLB
#HuangExitNvidiaStrategyInFocus
#ChipStocksExtendLossesAfterNvidiaCEOChange
#AnthropicRejectsIPODelayValuationinQuestion
#CoreWeaveJumps10%On168%RevenueGrowth
#MSCIRemovalMayCurbStrategy’sBitcoinBuying
{spot}(GOOGLBUSDT)
$GOOGLB
varreu agressivamente a liquidez abaixo, formando um longo pavio de capitulação até 290.13 antes de protagonizar uma violenta reversão em V. O gráfico de 1H mostra absorção imediata pelos compradores, com um pico de volume recuperando a faixa local e sinalizando forte momentum para uma nova alta em direção às máximas anteriores.
EP: 296.17
TP: 300.00, 305.50, 312.00
SL: 289.00
$GOOGLB
#HuangExitNvidiaStrategyInFocus
#ChipStocksExtendLossesAfterNvidiaCEOChange
#AnthropicRejectsIPODelayValuationinQuestion
#CoreWeaveJumps10%On168%RevenueGrowth
#MSCIRemovalMayCurbStrategy’sBitcoinBuying
varreu agressivamente a liquidez abaixo, formando um longo pavio de capitulação até 290.13 antes de protagonizar uma violenta reversão em V. O gráfico de 1H mostra absorção imediata pelos compradores, com um pico de volume recuperando a faixa local e sinalizando forte momentum para uma nova alta em direção às máximas anteriores.
EP: 296.17
TP: 300.00, 305.50, 312.00
SL: 289.00
$GOOGLB
#HuangExitNvidiaStrategyInFocus
#ChipStocksExtendLossesAfterNvidiaCEOChange
#AnthropicRejectsIPODelayValuationinQuestion
#CoreWeaveJumps10%On168%RevenueGrowth
#MSCIRemovalMayCurbStrategy’sBitcoinBuying
2
·
--
Em Baixa
Ver tradução
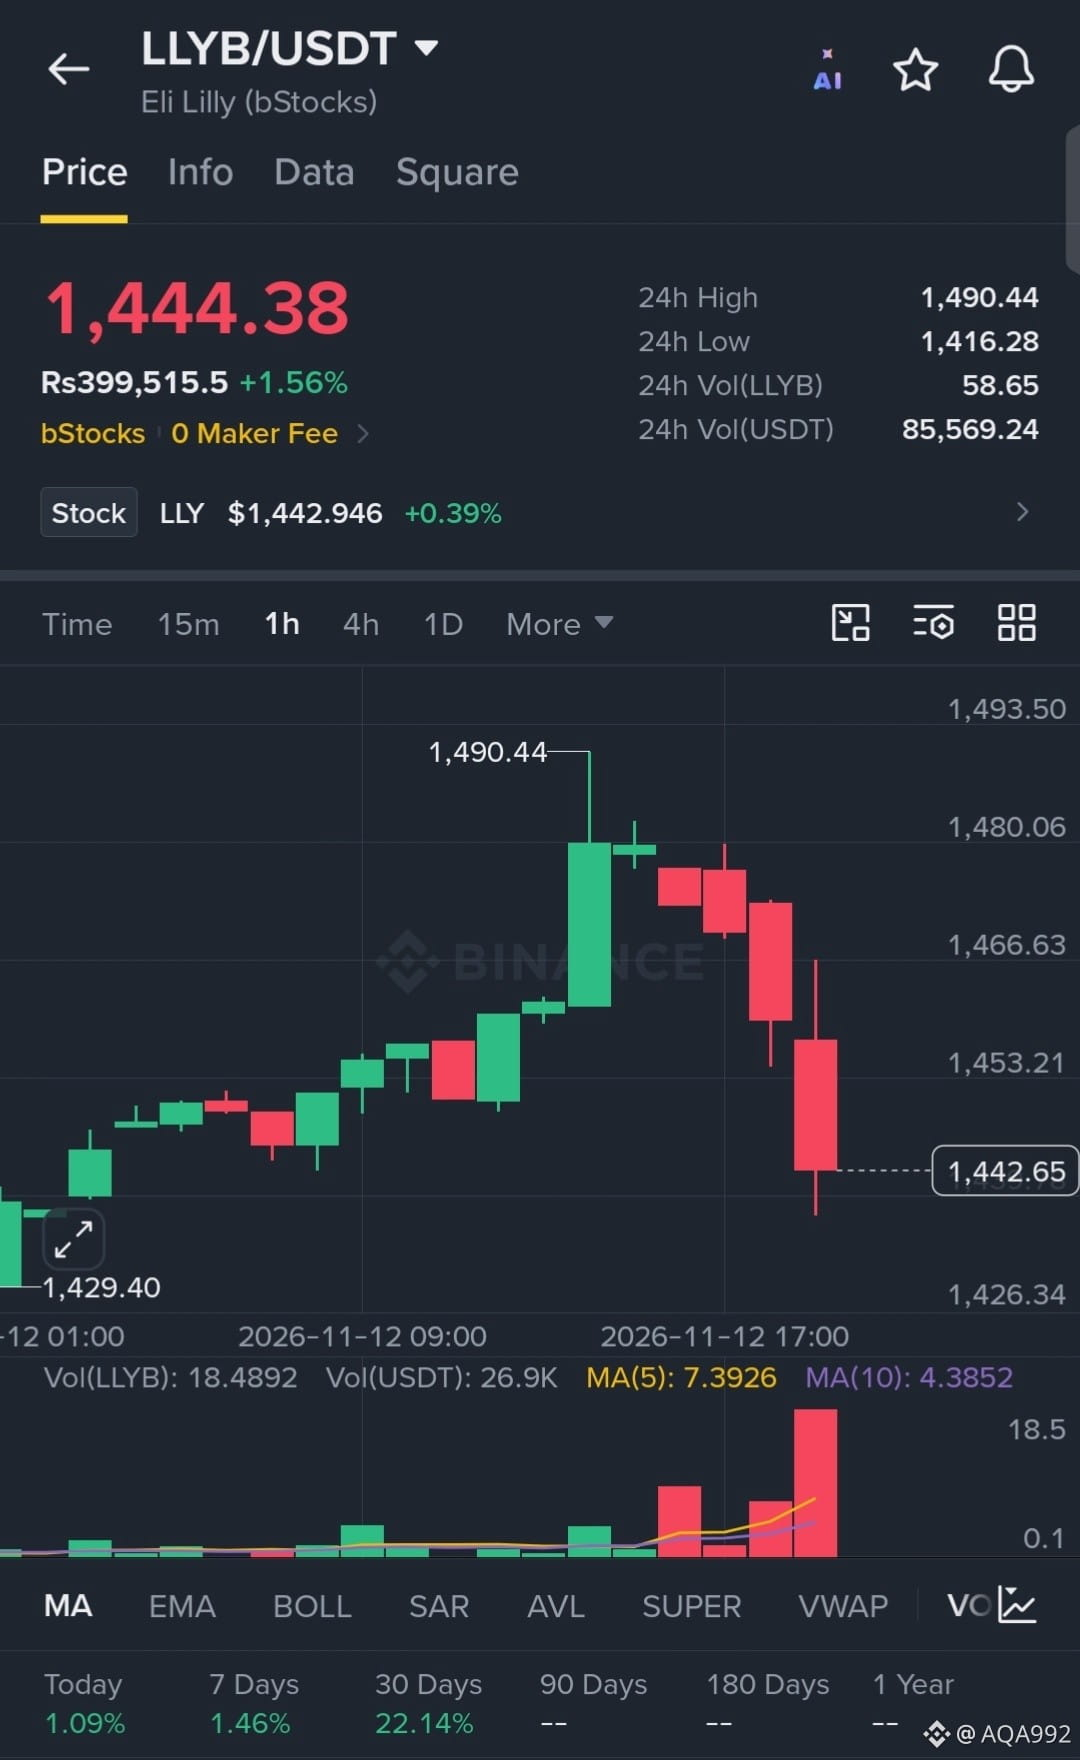
$LLYB
has aggressively rejected the 1,490 local high, triggering a sharp cascade of selling pressure with expanding volume. The 1H chart shows heavy distribution and a clear breakdown of market structure, signaling intense bearish momentum driving toward lower support levels.
EP: 1444.38
TP: 1425.00, 1410.00, 1395.00
SL: 1478.00
$LLYB
#HuangExitNvidiaStrategyInFocus
#ChipStocksExtendLossesAfterNvidiaCEOChange
#AnthropicRejectsIPODelayValuationinQuestion
#CoreWeaveJumps10%On168%RevenueGrowth
#MSCIRemovalMayCurbStrategy’sBitcoinBuying
{spot}(LLYBUSDT)
$LLYB
has aggressively rejected the 1,490 local high, triggering a sharp cascade of selling pressure with expanding volume. The 1H chart shows heavy distribution and a clear breakdown of market structure, signaling intense bearish momentum driving toward lower support levels.
EP: 1444.38
TP: 1425.00, 1410.00, 1395.00
SL: 1478.00
$LLYB
#HuangExitNvidiaStrategyInFocus
#ChipStocksExtendLossesAfterNvidiaCEOChange
#AnthropicRejectsIPODelayValuationinQuestion
#CoreWeaveJumps10%On168%RevenueGrowth
#MSCIRemovalMayCurbStrategy’sBitcoinBuying
has aggressively rejected the 1,490 local high, triggering a sharp cascade of selling pressure with expanding volume. The 1H chart shows heavy distribution and a clear breakdown of market structure, signaling intense bearish momentum driving toward lower support levels.
EP: 1444.38
TP: 1425.00, 1410.00, 1395.00
SL: 1478.00
$LLYB
#HuangExitNvidiaStrategyInFocus
#ChipStocksExtendLossesAfterNvidiaCEOChange
#AnthropicRejectsIPODelayValuationinQuestion
#CoreWeaveJumps10%On168%RevenueGrowth
#MSCIRemovalMayCurbStrategy’sBitcoinBuying
4
·
--
Em Alta
Ver tradução
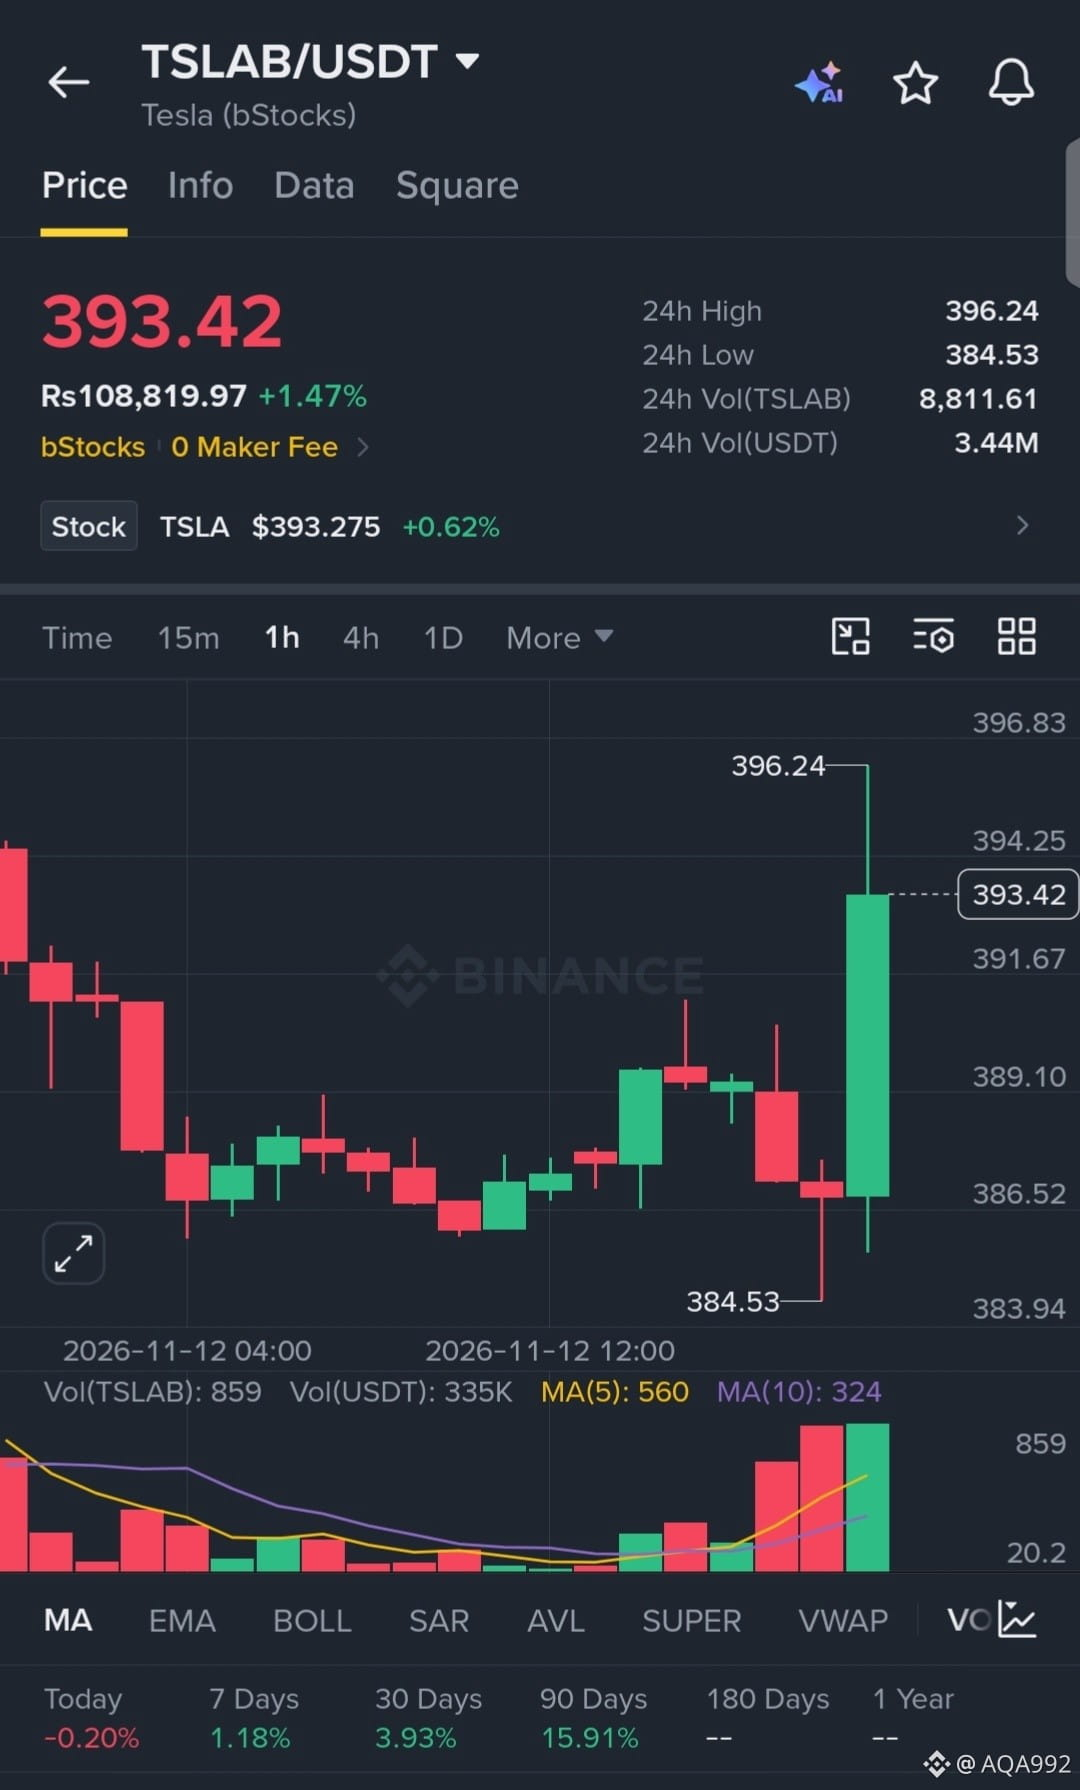
$TSLAB
has aggressively swept downside liquidity, printing a sharp capitulation wick to 384.53 before staging a violent V-shaped reversal. The 1H chart shows a massive surge in buy volume reclaiming the local range, signaling intense momentum for a swift continuation rally.
EP: 393.42
TP: 400.00, 407.50, 415.00
SL: 382.00
$TSLAB
#HuangExitNvidiaStrategyInFocus
#ChipStocksExtendLossesAfterNvidiaCEOChange
#AnthropicRejectsIPODelayValuationinQuestion
#CoreWeaveJumps10%On168%RevenueGrowth
#MSCIRemovalMayCurbStrategy’sBitcoinBuying
{spot}(TSLABUSDT)
$TSLAB
has aggressively swept downside liquidity, printing a sharp capitulation wick to 384.53 before staging a violent V-shaped reversal. The 1H chart shows a massive surge in buy volume reclaiming the local range, signaling intense momentum for a swift continuation rally.
EP: 393.42
TP: 400.00, 407.50, 415.00
SL: 382.00
$TSLAB
#HuangExitNvidiaStrategyInFocus
#ChipStocksExtendLossesAfterNvidiaCEOChange
#AnthropicRejectsIPODelayValuationinQuestion
#CoreWeaveJumps10%On168%RevenueGrowth
#MSCIRemovalMayCurbStrategy’sBitcoinBuying
has aggressively swept downside liquidity, printing a sharp capitulation wick to 384.53 before staging a violent V-shaped reversal. The 1H chart shows a massive surge in buy volume reclaiming the local range, signaling intense momentum for a swift continuation rally.
EP: 393.42
TP: 400.00, 407.50, 415.00
SL: 382.00
$TSLAB
#HuangExitNvidiaStrategyInFocus
#ChipStocksExtendLossesAfterNvidiaCEOChange
#AnthropicRejectsIPODelayValuationinQuestion
#CoreWeaveJumps10%On168%RevenueGrowth
#MSCIRemovalMayCurbStrategy’sBitcoinBuying
3
·
--
Em Alta
Ver tradução
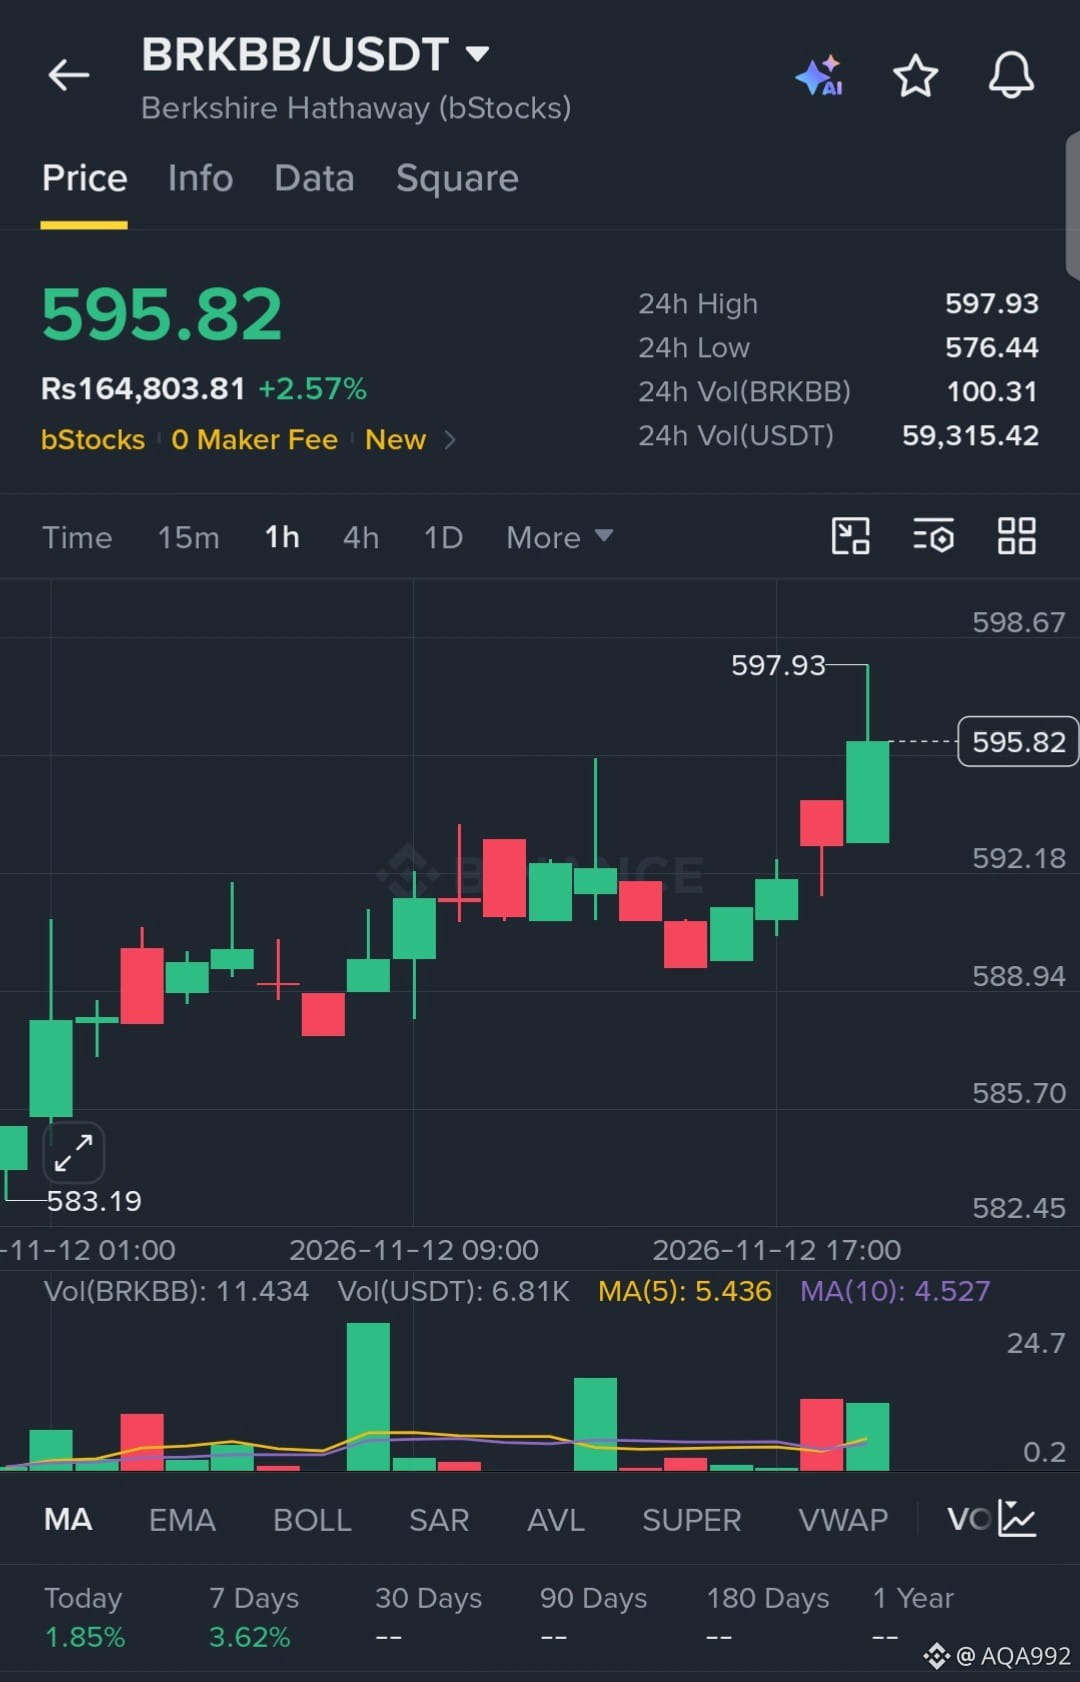
$BRKBB
is maintaining a relentless bullish structure, printing consecutive higher lows and pressing hard against local resistance at 597.93. The 1H chart shows steady volume accumulation with zero signs of heavy selling pressure, indicating a highly coiled setup ready for a breakout continuation.
EP: 595.82
TP: 602.00, 610.00, 620.00
SL: 584.00
$BRKBB
#HuangExitNvidiaStrategyInFocus
#ChipStocksExtendLossesAfterNvidiaCEOChange
#AnthropicRejectsIPODelayValuationinQuestion
#CoreWeaveJumps10%On168%RevenueGrowth
#MSCIRemovalMayCurbStrategy’sBitcoinBuying
{spot}(BRKBBUSDT)
$BRKBB
is maintaining a relentless bullish structure, printing consecutive higher lows and pressing hard against local resistance at 597.93. The 1H chart shows steady volume accumulation with zero signs of heavy selling pressure, indicating a highly coiled setup ready for a breakout continuation.
EP: 595.82
TP: 602.00, 610.00, 620.00
SL: 584.00
$BRKBB
#HuangExitNvidiaStrategyInFocus
#ChipStocksExtendLossesAfterNvidiaCEOChange
#AnthropicRejectsIPODelayValuationinQuestion
#CoreWeaveJumps10%On168%RevenueGrowth
#MSCIRemovalMayCurbStrategy’sBitcoinBuying
is maintaining a relentless bullish structure, printing consecutive higher lows and pressing hard against local resistance at 597.93. The 1H chart shows steady volume accumulation with zero signs of heavy selling pressure, indicating a highly coiled setup ready for a breakout continuation.
EP: 595.82
TP: 602.00, 610.00, 620.00
SL: 584.00
$BRKBB
#HuangExitNvidiaStrategyInFocus
#ChipStocksExtendLossesAfterNvidiaCEOChange
#AnthropicRejectsIPODelayValuationinQuestion
#CoreWeaveJumps10%On168%RevenueGrowth
#MSCIRemovalMayCurbStrategy’sBitcoinBuying
3
·
--
Em Alta
Ver tradução
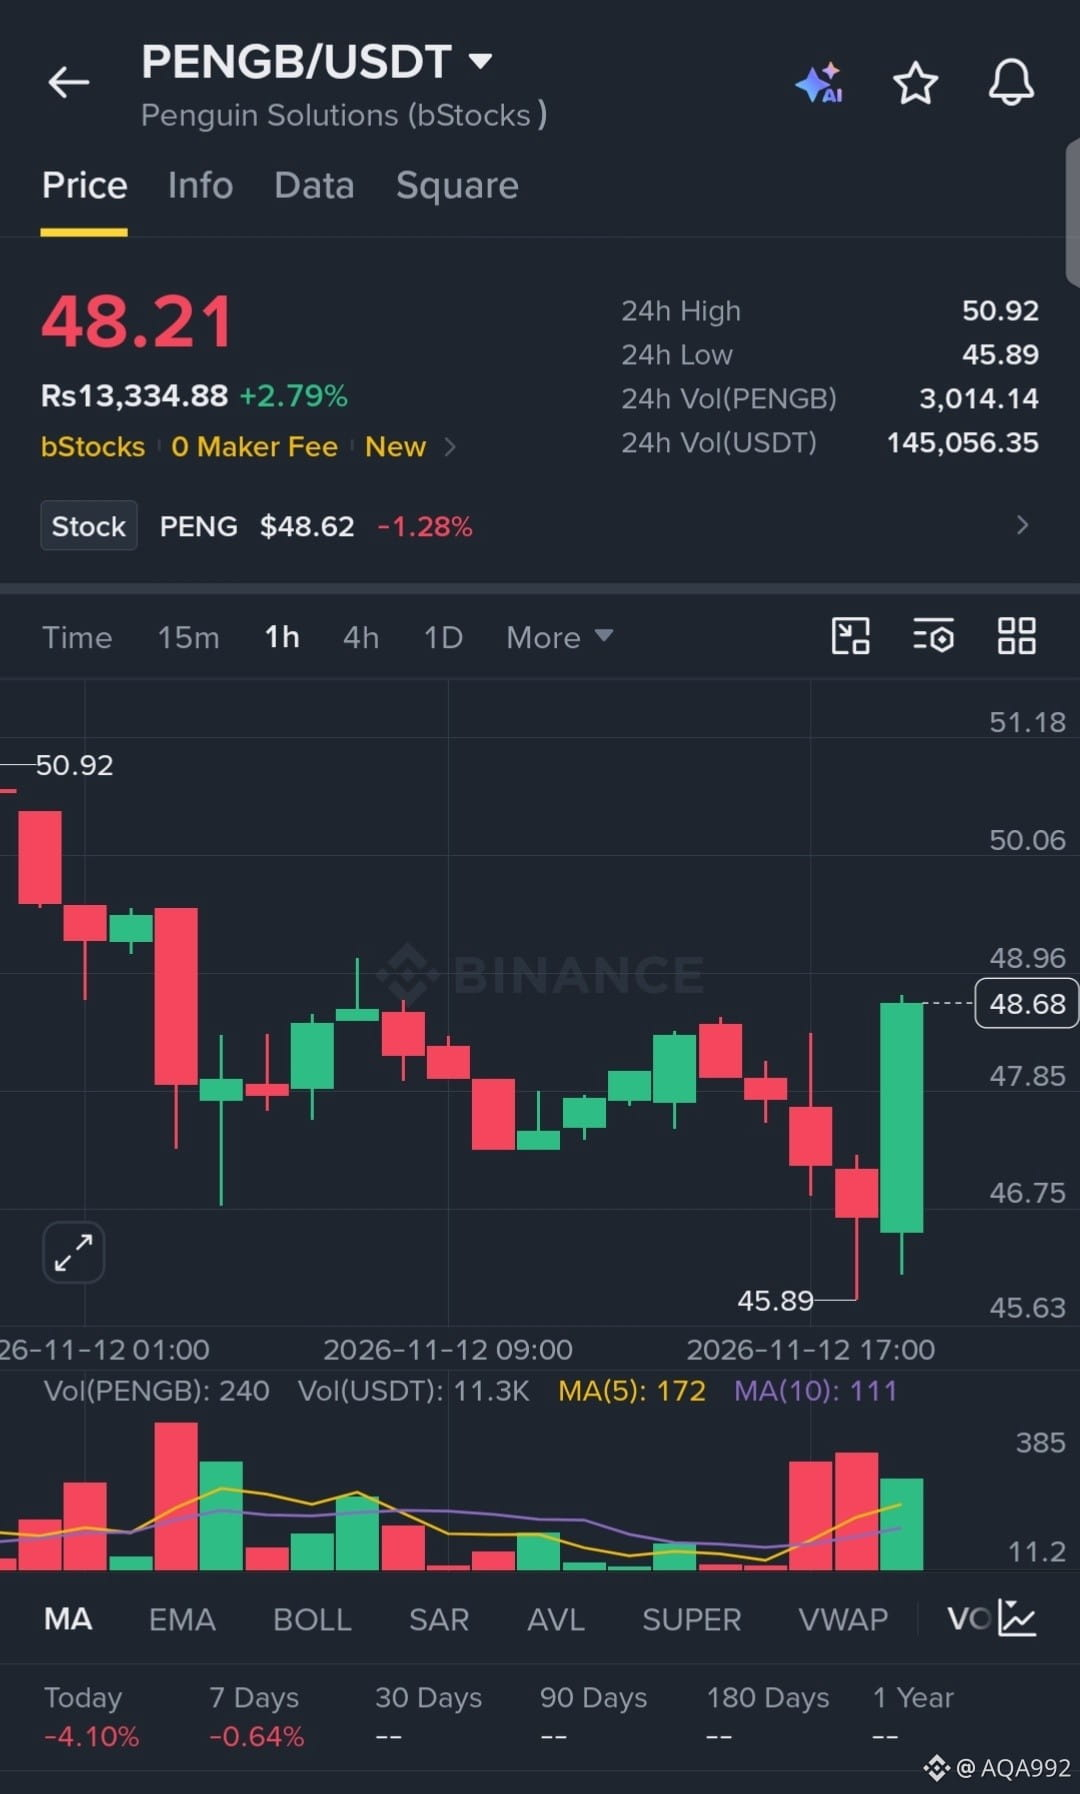
$PENGB
has aggressively swept downside liquidity, printing a sharp capitulation wick to 45.89 before staging a violent V-shaped reversal. The 1H chart shows a massive surge in buy volume reclaiming the local range, signaling intense momentum for a swift relief rally.
EP: 48.21
TP: 49.50, 50.90, 52.50
SL: 45.50
$PENGB
#HuangExitNvidiaStrategyInFocus
#ChipStocksExtendLossesAfterNvidiaCEOChange
#AnthropicRejectsIPODelayValuationinQuestion
#CoreWeaveJumps10%On168%RevenueGrowth
#MSCIRemovalMayCurbStrategy’sBitcoinBuying
{spot}(PENGBUSDT)
$PENGB
has aggressively swept downside liquidity, printing a sharp capitulation wick to 45.89 before staging a violent V-shaped reversal. The 1H chart shows a massive surge in buy volume reclaiming the local range, signaling intense momentum for a swift relief rally.
EP: 48.21
TP: 49.50, 50.90, 52.50
SL: 45.50
$PENGB
#HuangExitNvidiaStrategyInFocus
#ChipStocksExtendLossesAfterNvidiaCEOChange
#AnthropicRejectsIPODelayValuationinQuestion
#CoreWeaveJumps10%On168%RevenueGrowth
#MSCIRemovalMayCurbStrategy’sBitcoinBuying
has aggressively swept downside liquidity, printing a sharp capitulation wick to 45.89 before staging a violent V-shaped reversal. The 1H chart shows a massive surge in buy volume reclaiming the local range, signaling intense momentum for a swift relief rally.
EP: 48.21
TP: 49.50, 50.90, 52.50
SL: 45.50
$PENGB
#HuangExitNvidiaStrategyInFocus
#ChipStocksExtendLossesAfterNvidiaCEOChange
#AnthropicRejectsIPODelayValuationinQuestion
#CoreWeaveJumps10%On168%RevenueGrowth
#MSCIRemovalMayCurbStrategy’sBitcoinBuying
3
·
--
Ver tradução
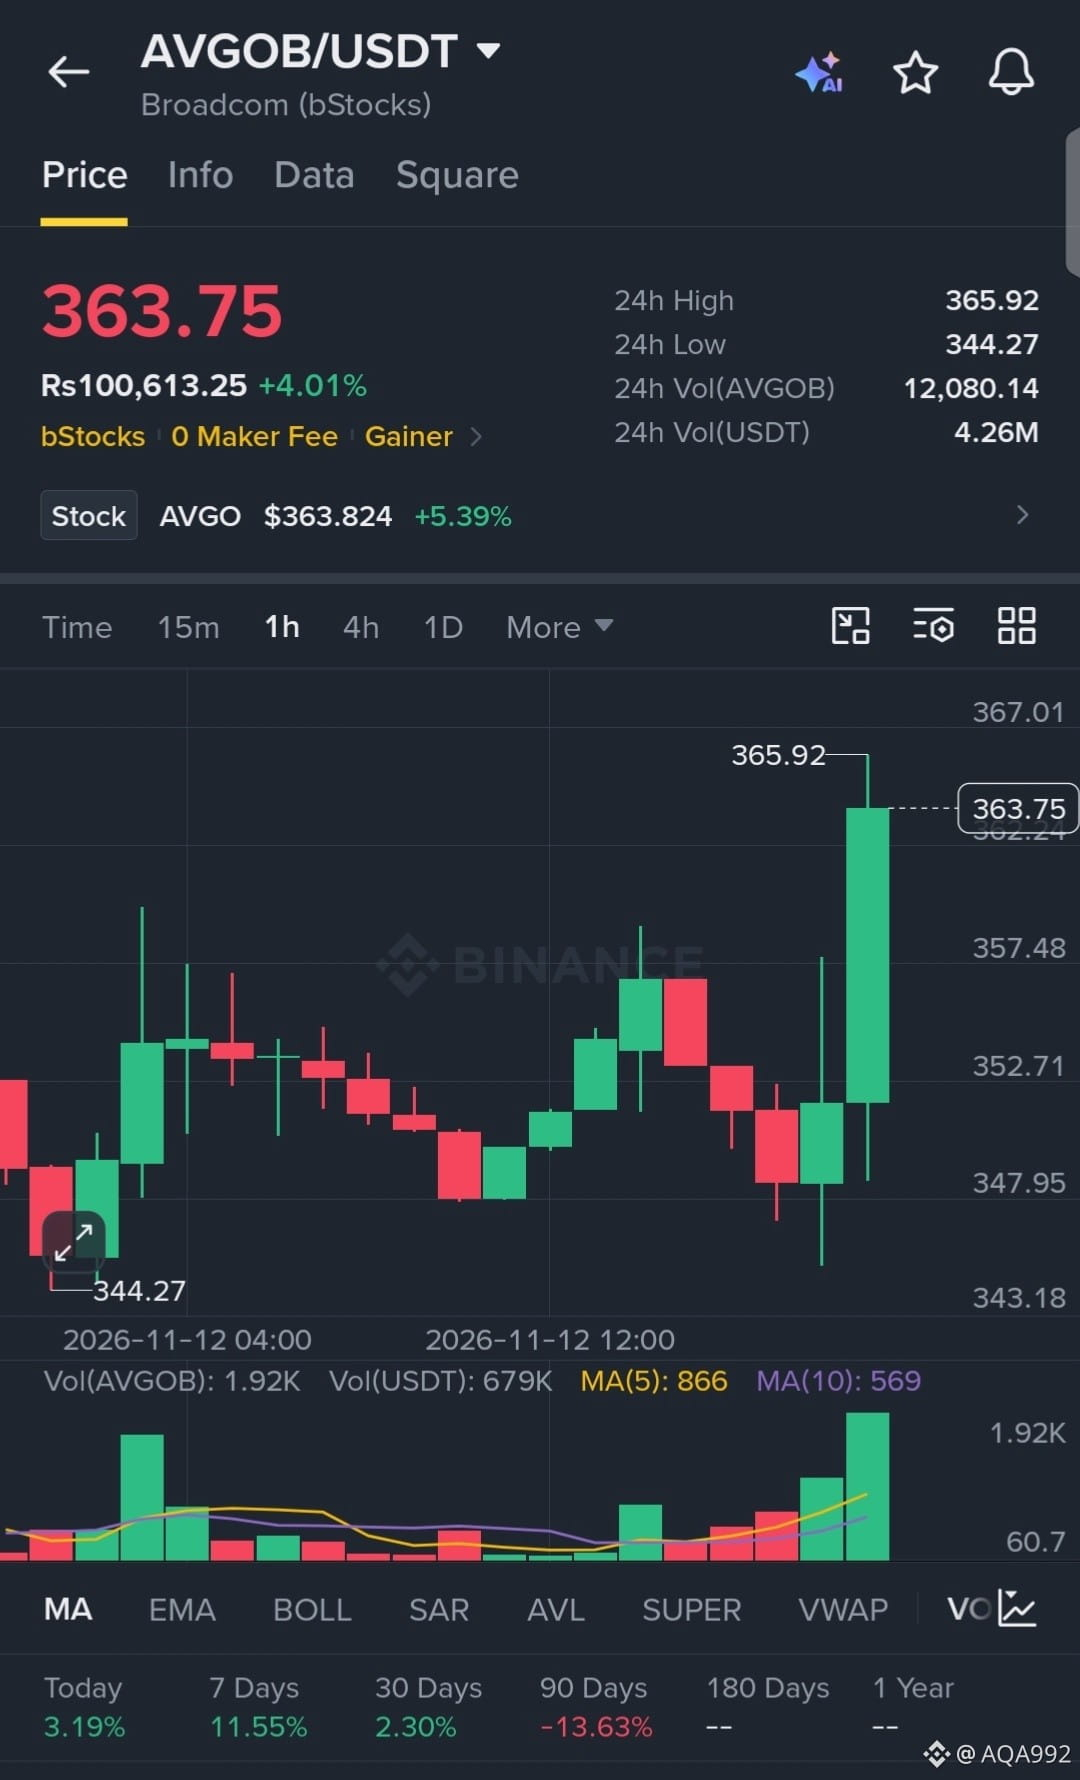
$AVGOB
is displaying aggressive bullish momentum, blasting through local resistance with a massive volume expansion. The 1H chart reveals intense buyer absorption, establishing a strong higher-low structure. Momentum is heavily skewed to the upside, primed for a continuation push.
EP: 363.75
TP: 370.00, 378.50, 388.00
SL: 348.00
$AVGOB
#HuangExitNvidiaStrategyInFocus
#ChipStocksExtendLossesAfterNvidiaCEOChange
#AnthropicRejectsIPODelayValuationinQuestion
#CoreWeaveJumps10%On168%RevenueGrowth
#MSCIRemovalMayCurbStrategy’sBitcoinBuying
{spot}(AVGOBUSDT)
$AVGOB
is displaying aggressive bullish momentum, blasting through local resistance with a massive volume expansion. The 1H chart reveals intense buyer absorption, establishing a strong higher-low structure. Momentum is heavily skewed to the upside, primed for a continuation push.
EP: 363.75
TP: 370.00, 378.50, 388.00
SL: 348.00
$AVGOB
#HuangExitNvidiaStrategyInFocus
#ChipStocksExtendLossesAfterNvidiaCEOChange
#AnthropicRejectsIPODelayValuationinQuestion
#CoreWeaveJumps10%On168%RevenueGrowth
#MSCIRemovalMayCurbStrategy’sBitcoinBuying
is displaying aggressive bullish momentum, blasting through local resistance with a massive volume expansion. The 1H chart reveals intense buyer absorption, establishing a strong higher-low structure. Momentum is heavily skewed to the upside, primed for a continuation push.
EP: 363.75
TP: 370.00, 378.50, 388.00
SL: 348.00
$AVGOB
#HuangExitNvidiaStrategyInFocus
#ChipStocksExtendLossesAfterNvidiaCEOChange
#AnthropicRejectsIPODelayValuationinQuestion
#CoreWeaveJumps10%On168%RevenueGrowth
#MSCIRemovalMayCurbStrategy’sBitcoinBuying
2
·
--
Em Alta
Ver tradução
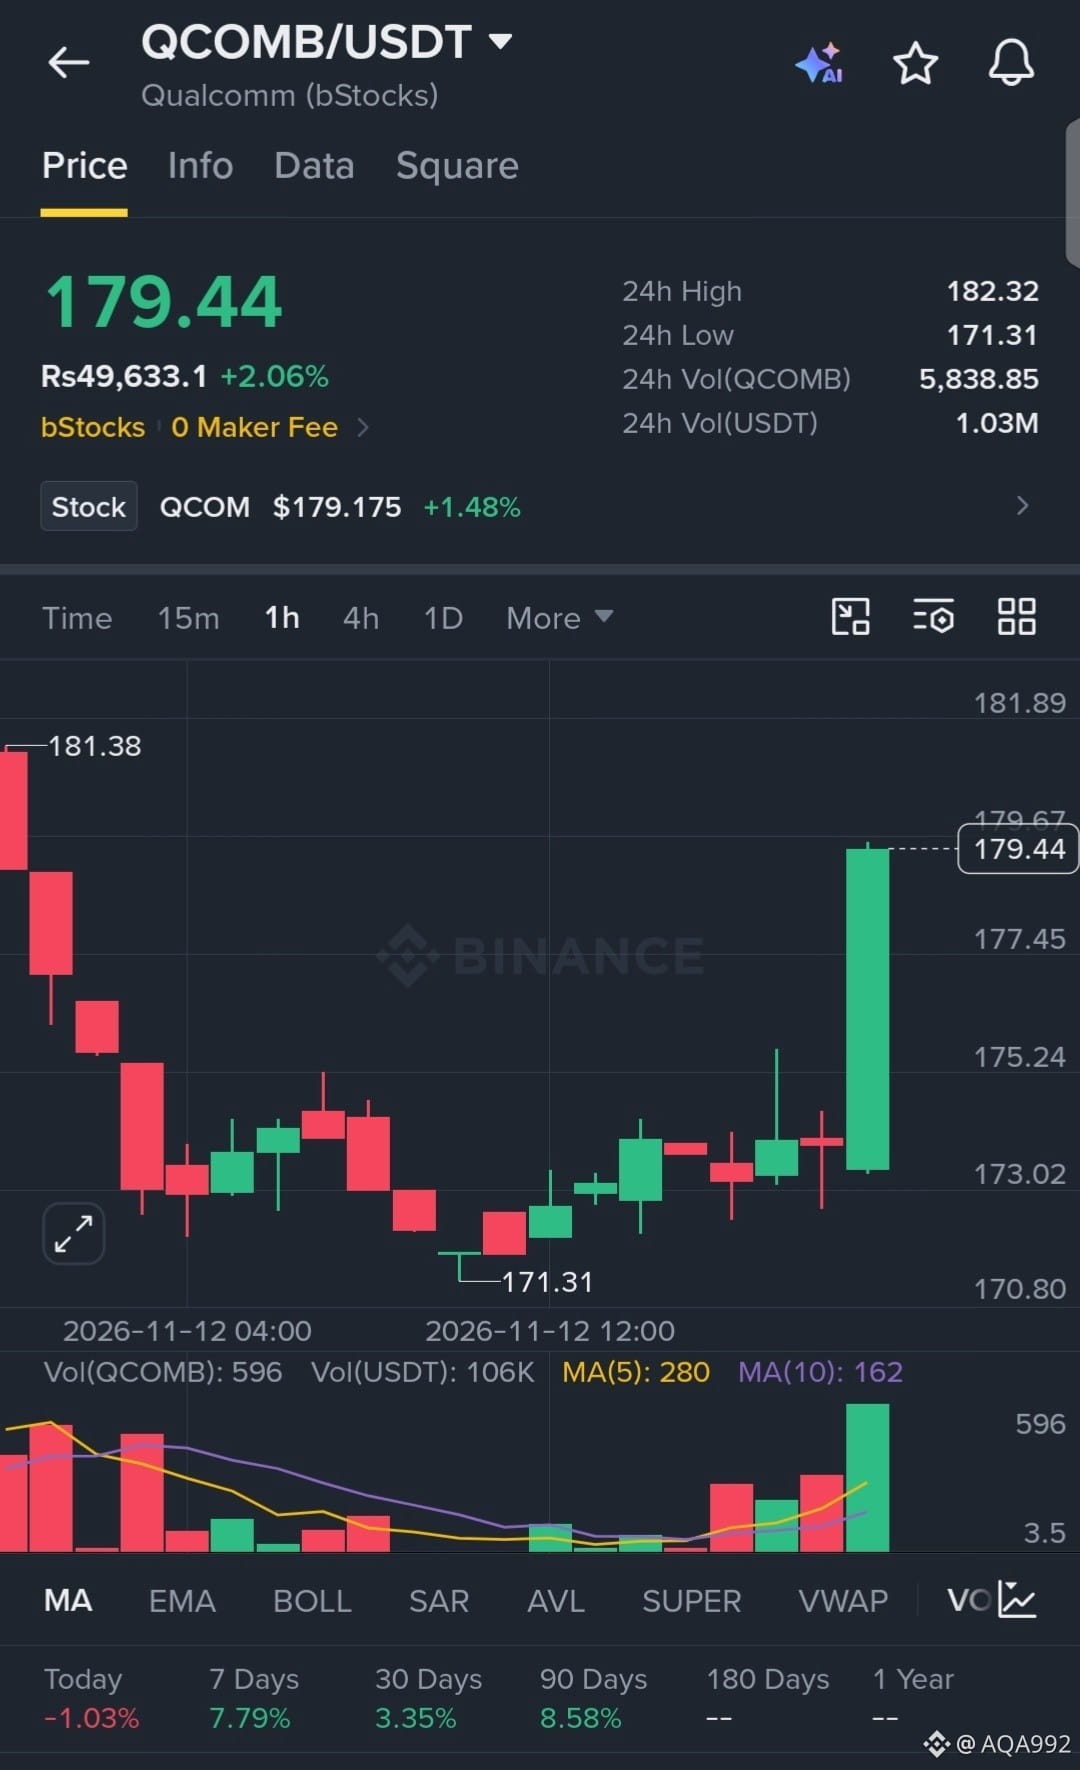
$QCOMB
has aggressively reversed from its local bottom at 171.31, igniting a massive volume expansion that slices straight through resistance. The 1H chart shows intense buyer absorption and a sudden surge in momentum, signaling a high-conviction breakout ready to reclaim previous highs.
EP: 179.44
TP: 182.50, 186.00, 190.00
SL: 172.00
$QCOMB
#HuangExitNvidiaStrategyInFocus
#ChipStocksExtendLossesAfterNvidiaCEOChange
#AnthropicRejectsIPODelayValuationinQuestion
#CoreWeaveJumps10%On168%RevenueGrowth
#MSCIRemovalMayCurbStrategy’sBitcoinBuying
{spot}(QCOMBUSDT)
$QCOMB
has aggressively reversed from its local bottom at 171.31, igniting a massive volume expansion that slices straight through resistance. The 1H chart shows intense buyer absorption and a sudden surge in momentum, signaling a high-conviction breakout ready to reclaim previous highs.
EP: 179.44
TP: 182.50, 186.00, 190.00
SL: 172.00
$QCOMB
#HuangExitNvidiaStrategyInFocus
#ChipStocksExtendLossesAfterNvidiaCEOChange
#AnthropicRejectsIPODelayValuationinQuestion
#CoreWeaveJumps10%On168%RevenueGrowth
#MSCIRemovalMayCurbStrategy’sBitcoinBuying
has aggressively reversed from its local bottom at 171.31, igniting a massive volume expansion that slices straight through resistance. The 1H chart shows intense buyer absorption and a sudden surge in momentum, signaling a high-conviction breakout ready to reclaim previous highs.
EP: 179.44
TP: 182.50, 186.00, 190.00
SL: 172.00
$QCOMB
#HuangExitNvidiaStrategyInFocus
#ChipStocksExtendLossesAfterNvidiaCEOChange
#AnthropicRejectsIPODelayValuationinQuestion
#CoreWeaveJumps10%On168%RevenueGrowth
#MSCIRemovalMayCurbStrategy’sBitcoinBuying
1
·
--
Em Alta
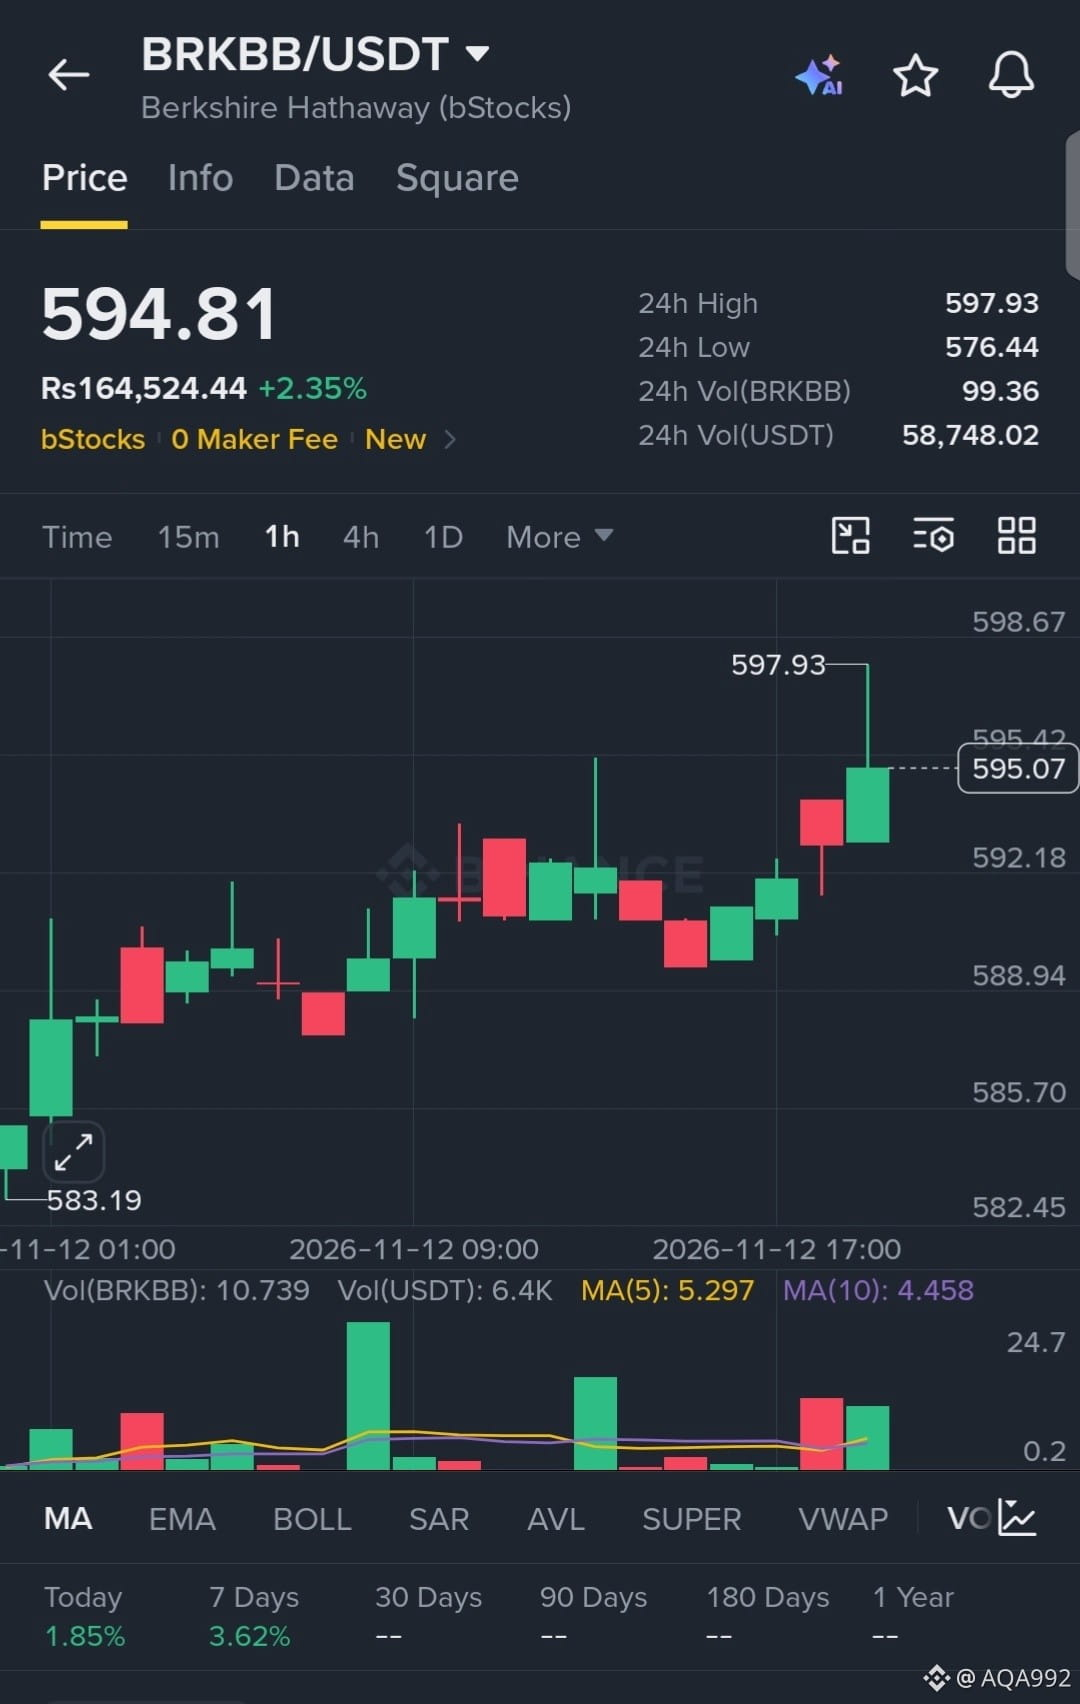
$BRKBB
está formando uma estrutura de alta exemplar, registrando máximas e mínimas cada vez mais altas, com suporte constante do volume. O gráfico de 1H mostra uma absorção agressiva dos compradores a cada pequena correção, sinalizando um forte impulso pronto para romper a máxima local em 597.93.
EP: 594.81
TP: 600.00, 607.50, 615.00
SL: 582.00
$BRKBB
#HuangExitNvidiaStrategyInFocus
#ChipStocksExtendLossesAfterNvidiaCEOChange
#AnthropicRejectsIPODelayValuationinQuestion
#CoreWeaveJumps10%On168%RevenueGrowth
#MSCIRemovalMayCurbStrategy’sBitcoinBuying
{spot}(BRKBBUSDT)
$BRKBB
está formando uma estrutura de alta exemplar, registrando máximas e mínimas cada vez mais altas, com suporte constante do volume. O gráfico de 1H mostra uma absorção agressiva dos compradores a cada pequena correção, sinalizando um forte impulso pronto para romper a máxima local em 597.93.
EP: 594.81
TP: 600.00, 607.50, 615.00
SL: 582.00
$BRKBB
#HuangExitNvidiaStrategyInFocus
#ChipStocksExtendLossesAfterNvidiaCEOChange
#AnthropicRejectsIPODelayValuationinQuestion
#CoreWeaveJumps10%On168%RevenueGrowth
#MSCIRemovalMayCurbStrategy’sBitcoinBuying
está formando uma estrutura de alta exemplar, registrando máximas e mínimas cada vez mais altas, com suporte constante do volume. O gráfico de 1H mostra uma absorção agressiva dos compradores a cada pequena correção, sinalizando um forte impulso pronto para romper a máxima local em 597.93.
EP: 594.81
TP: 600.00, 607.50, 615.00
SL: 582.00
$BRKBB
#HuangExitNvidiaStrategyInFocus
#ChipStocksExtendLossesAfterNvidiaCEOChange
#AnthropicRejectsIPODelayValuationinQuestion
#CoreWeaveJumps10%On168%RevenueGrowth
#MSCIRemovalMayCurbStrategy’sBitcoinBuying
2
Inicia sessão para explorar mais conteúdos
Junta-te a utilizadores de criptomoedas de todo o mundo na Binance Square
⚡️ Obtém informações úteis e recentes sobre criptomoedas.
💬 Com a confiança da maior exchange de criptomoedas do mundo.
👍 Descobre perspetivas reais de criadores verificados.
E-mail/Número de telefone
Tópicos em Tendência
HuangExitNvidiaStrategyInFocus
2,133 visualizações
164 a discutir
AÇÕES | Jensen Huang, da Nvidia, renuncia; Colette Kress é nomeada CEO interina
Binance News
·2 gostos
·5k visualizações
AnthropicRejectsIPODelayValuationinQuestion
556,623 visualizações
4,588 a discutir
BitMineReports$6.3BNetLossForFiscal2026
1,141 visualizações
52 a discutir