

CryptonewsCom
11.9k Publicações

CryptonewsCom
 Square verificado+
Denunciar
Bloquear Utilizador
Latest cryptocurrency news from cryptonews.com
0 A seguir
3.8K+ Seguidores
7.5K+ Gostaram
Publicações
Artigo
Ver tradução
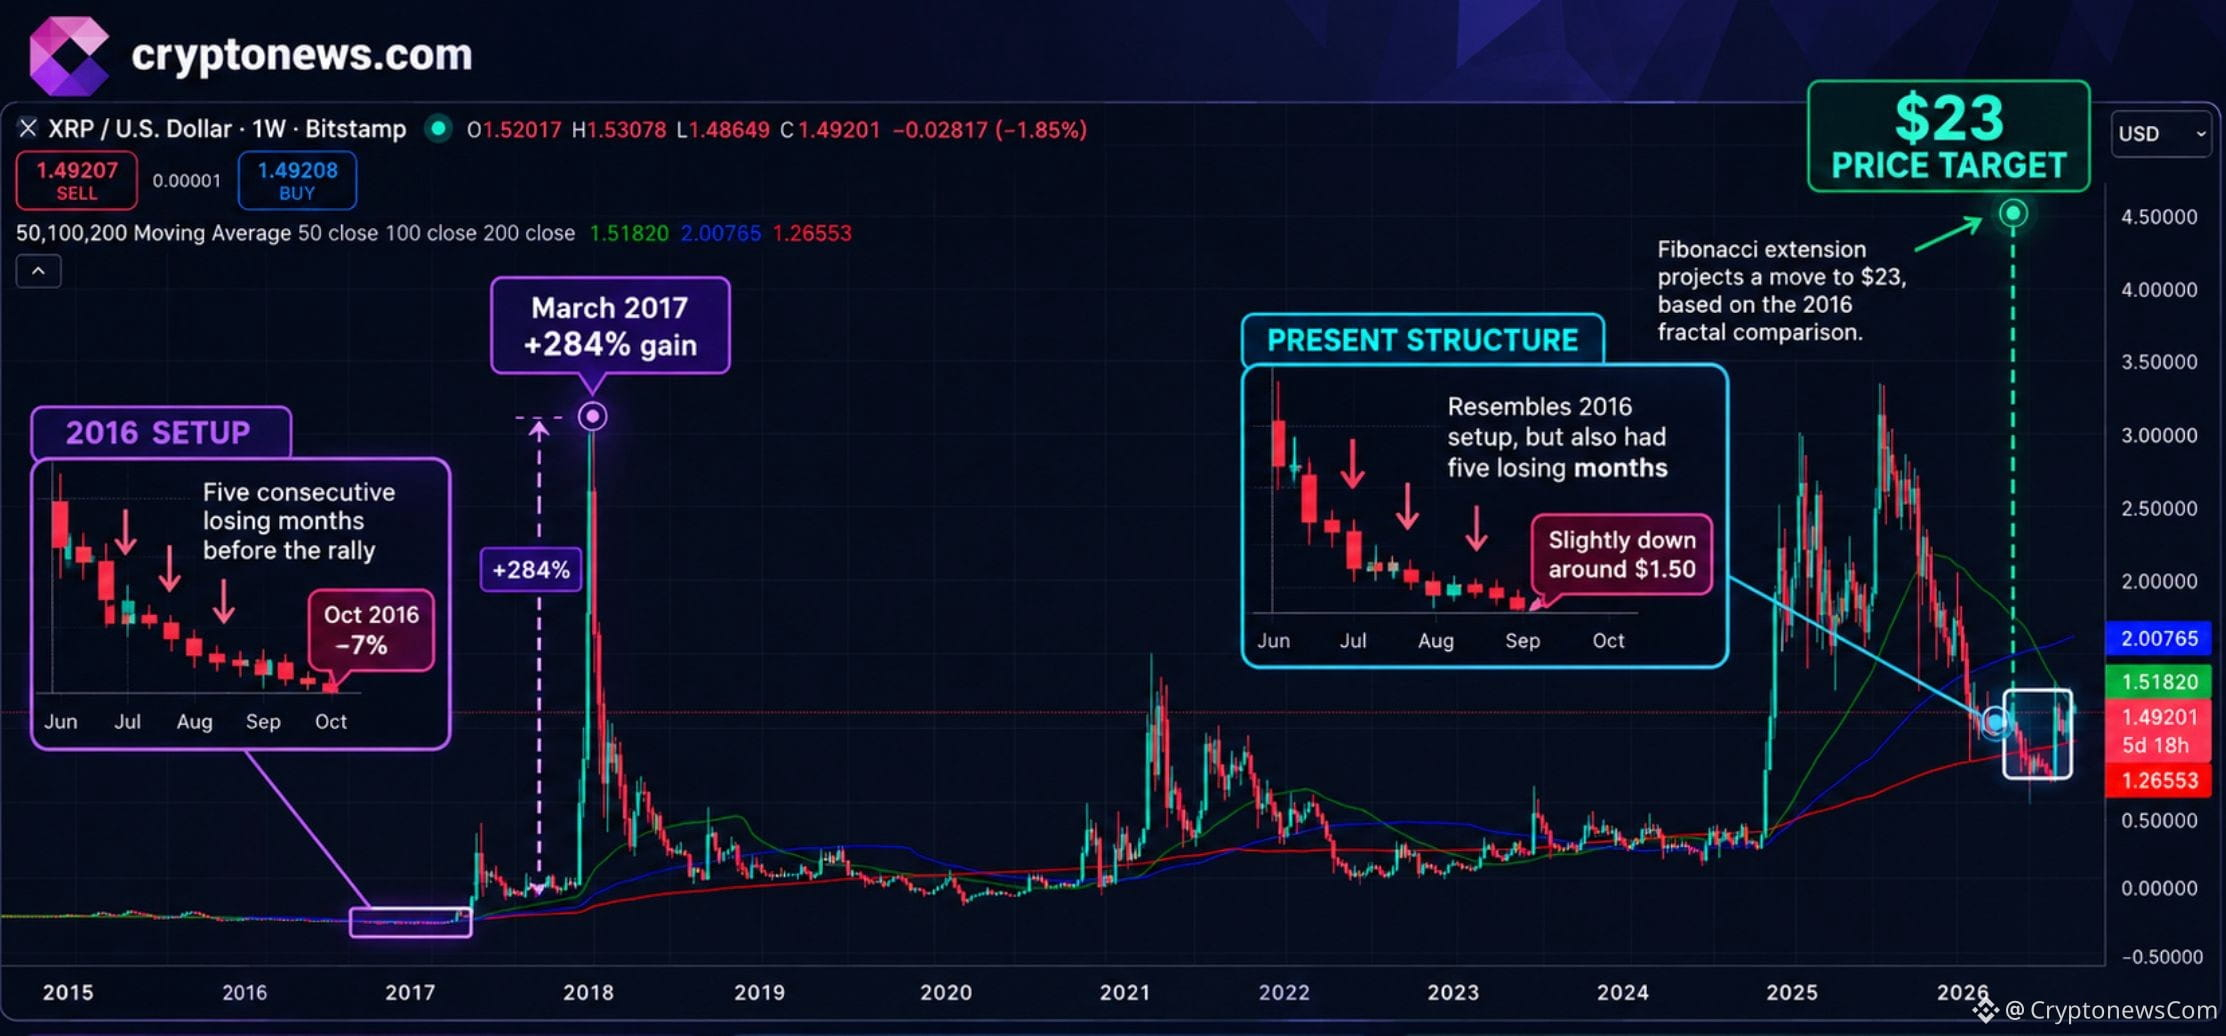
XRP Price Prediction: Chart Mirroring 2016, Targeting $23XRP trades at around the $1.50 price level, slightly down, but a long-range chart comparison points to a $23 prediction. The resemblance to 2016 is striking, but that historical setup began with five consecutive losing months, a detail that changes the risk profile of the call.
Analyst maps XRP’s current structure onto its 2016 chart and uses a Fibonacci extension to project the target. The comparison points to a 284% gain in March 2017 after an extended decline; in October 2016, XRP fell 7%, then lost ground in each of the next four months.
For the near-term setup, the question is less whether the pattern looks familiar than whether buyers can reclaim resistance while broader market pressure persists. South Korean trading activity has reportedly put XRP ahead of Bitcoin and Ethereum by volume, but price remains range-bound.
Earn $50 and Enter $300K Prize Draw on EdgeXXRP Price Prediction: Can Ripple Hit $23 After Reclaiming Key Resistance?
At $1.50, XRP is down 0.3% over 24 hours, with a reported daily range of $1.49–$1.51. The recent seven-day reading in the research is positive at 1.30%.
Immediate support sits around $1.46–$1.48; resistance is clustered near $1.54–$1.56, with $1.60 the broader hurdle. Roughly 2.5 billion XRP reportedly sit around $1.60, potentially adding supply as the price approaches that zone.
XRP itself remains below its September high of $1.65. The chart is still range-bound. Current XRP support, resistance, and ETF-demand context offer another frame for assessing the levels.
Xrp (XRP)
24h7d30d1yAll time
Bull case: A sustained move above $1.60, followed by a close above the cited $1.6572 breakout line, would strengthen the recovery thesis.
Base case: XRP keeps oscillating between support and resistance while traders wait for volume-backed direction.
Bear case: A decisive break below $1.46 would weaken the range structure and put lower support levels in play.
Could the 2016 pattern still matter? Yes, but only if the price confirms the setup. The $23 objective remains speculative, not an established consensus target.
Near-term catalysts include Ripple’s recurring escrow release and the proposed Evernorth transaction, approved by shareholders on September 30, with a treasury plan of approximately 473 million XRP. Neither event guarantees immediate demand: escrow releases do not prove tokens were sold, and a planned treasury is not the same as sustained market buying.
Trade XRP on Bybit and Get a Chance to Win Our $1,000 USDT AirdropMaxi Doge Targets Early-Mover Upside as XRP Tests Key Levels
XRP’s range leaves the large-cap thesis dependent on resistance giving way. That can frustrate traders looking for a sharper move: even a successful breakout from $1.60 would be a very different proposition from a 15-fold target. An early-stage token brings a different risk profile.
Maxi Doge ($MAXI) is an Ethereum ERC-20 meme token built around a 240-lb canine juggernaut and a 1000x-leverage trading-community identity.
pic.twitter.com/Vg6OpDX6Bq
— MaxiDoge (@MaxiDoge_) August 13, 2026
Its presale is priced at $0.0002842, and it has raised close to $5 million. Staking is also offered at a huge 60% APY, only for presale buyers. Holder-only trading competitions with leaderboard rewards and a Maxi Fund treasury for liquidity and partnerships are among its stated features.
Meme-first marketing supplies the gym-bro humor, with the tagline: “Never skip leg-day, never skip a pump.”
Research Maxi Doge and review the project details before the presale ends.
Discover: The Best Token Presales
The post XRP Price Prediction: Chart Mirroring 2016, Targeting $23 appeared first on Cryptonews.
XRP Price Prediction: Chart Mirroring 2016, Targeting $23
XRP trades at around the $1.50 price level, slightly down, but a long-range chart comparison points to a $23 prediction. The resemblance to 2016 is striking, but that historical setup began with five consecutive losing months, a detail that changes the risk profile of the call.
Analyst maps XRP’s current structure onto its 2016 chart and uses a Fibonacci extension to project the target. The comparison points to a 284% gain in March 2017 after an extended decline; in October 2016, XRP fell 7%, then lost ground in each of the next four months.
For the near-term setup, the question is less whether the pattern looks familiar than whether buyers can reclaim resistance while broader market pressure persists. South Korean trading activity has reportedly put XRP ahead of Bitcoin and Ethereum by volume, but price remains range-bound.
Earn $50 and Enter $300K Prize Draw on EdgeXXRP Price Prediction: Can Ripple Hit $23 After Reclaiming Key Resistance?
At $1.50, XRP is down 0.3% over 24 hours, with a reported daily range of $1.49–$1.51. The recent seven-day reading in the research is positive at 1.30%.
Immediate support sits around $1.46–$1.48; resistance is clustered near $1.54–$1.56, with $1.60 the broader hurdle. Roughly 2.5 billion XRP reportedly sit around $1.60, potentially adding supply as the price approaches that zone.
XRP itself remains below its September high of $1.65. The chart is still range-bound. Current XRP support, resistance, and ETF-demand context offer another frame for assessing the levels.
Xrp (XRP)
24h7d30d1yAll time
Bull case: A sustained move above $1.60, followed by a close above the cited $1.6572 breakout line, would strengthen the recovery thesis.
Base case: XRP keeps oscillating between support and resistance while traders wait for volume-backed direction.
Bear case: A decisive break below $1.46 would weaken the range structure and put lower support levels in play.
Could the 2016 pattern still matter? Yes, but only if the price confirms the setup. The $23 objective remains speculative, not an established consensus target.
Near-term catalysts include Ripple’s recurring escrow release and the proposed Evernorth transaction, approved by shareholders on September 30, with a treasury plan of approximately 473 million XRP. Neither event guarantees immediate demand: escrow releases do not prove tokens were sold, and a planned treasury is not the same as sustained market buying.
Trade XRP on Bybit and Get a Chance to Win Our $1,000 USDT AirdropMaxi Doge Targets Early-Mover Upside as XRP Tests Key Levels
XRP’s range leaves the large-cap thesis dependent on resistance giving way. That can frustrate traders looking for a sharper move: even a successful breakout from $1.60 would be a very different proposition from a 15-fold target. An early-stage token brings a different risk profile.
Maxi Doge ($MAXI) is an Ethereum ERC-20 meme token built around a 240-lb canine juggernaut and a 1000x-leverage trading-community identity.
pic.twitter.com/Vg6OpDX6Bq
— MaxiDoge (@MaxiDoge_) August 13, 2026
Its presale is priced at $0.0002842, and it has raised close to $5 million. Staking is also offered at a huge 60% APY, only for presale buyers. Holder-only trading competitions with leaderboard rewards and a Maxi Fund treasury for liquidity and partnerships are among its stated features.
Meme-first marketing supplies the gym-bro humor, with the tagline: “Never skip leg-day, never skip a pump.”
Research Maxi Doge and review the project details before the presale ends.
Discover: The Best Token Presales
The post XRP Price Prediction: Chart Mirroring 2016, Targeting $23 appeared first on Cryptonews.
Analyst maps XRP’s current structure onto its 2016 chart and uses a Fibonacci extension to project the target. The comparison points to a 284% gain in March 2017 after an extended decline; in October 2016, XRP fell 7%, then lost ground in each of the next four months.
For the near-term setup, the question is less whether the pattern looks familiar than whether buyers can reclaim resistance while broader market pressure persists. South Korean trading activity has reportedly put XRP ahead of Bitcoin and Ethereum by volume, but price remains range-bound.
Earn $50 and Enter $300K Prize Draw on EdgeXXRP Price Prediction: Can Ripple Hit $23 After Reclaiming Key Resistance?
At $1.50, XRP is down 0.3% over 24 hours, with a reported daily range of $1.49–$1.51. The recent seven-day reading in the research is positive at 1.30%.
Immediate support sits around $1.46–$1.48; resistance is clustered near $1.54–$1.56, with $1.60 the broader hurdle. Roughly 2.5 billion XRP reportedly sit around $1.60, potentially adding supply as the price approaches that zone.
XRP itself remains below its September high of $1.65. The chart is still range-bound. Current XRP support, resistance, and ETF-demand context offer another frame for assessing the levels.
Xrp (XRP)
24h7d30d1yAll time
Bull case: A sustained move above $1.60, followed by a close above the cited $1.6572 breakout line, would strengthen the recovery thesis.
Base case: XRP keeps oscillating between support and resistance while traders wait for volume-backed direction.
Bear case: A decisive break below $1.46 would weaken the range structure and put lower support levels in play.
Could the 2016 pattern still matter? Yes, but only if the price confirms the setup. The $23 objective remains speculative, not an established consensus target.
Near-term catalysts include Ripple’s recurring escrow release and the proposed Evernorth transaction, approved by shareholders on September 30, with a treasury plan of approximately 473 million XRP. Neither event guarantees immediate demand: escrow releases do not prove tokens were sold, and a planned treasury is not the same as sustained market buying.
Trade XRP on Bybit and Get a Chance to Win Our $1,000 USDT AirdropMaxi Doge Targets Early-Mover Upside as XRP Tests Key Levels
XRP’s range leaves the large-cap thesis dependent on resistance giving way. That can frustrate traders looking for a sharper move: even a successful breakout from $1.60 would be a very different proposition from a 15-fold target. An early-stage token brings a different risk profile.
Maxi Doge ($MAXI) is an Ethereum ERC-20 meme token built around a 240-lb canine juggernaut and a 1000x-leverage trading-community identity.
pic.twitter.com/Vg6OpDX6Bq
— MaxiDoge (@MaxiDoge_) August 13, 2026
Its presale is priced at $0.0002842, and it has raised close to $5 million. Staking is also offered at a huge 60% APY, only for presale buyers. Holder-only trading competitions with leaderboard rewards and a Maxi Fund treasury for liquidity and partnerships are among its stated features.
Meme-first marketing supplies the gym-bro humor, with the tagline: “Never skip leg-day, never skip a pump.”
Research Maxi Doge and review the project details before the presale ends.
Discover: The Best Token Presales
The post XRP Price Prediction: Chart Mirroring 2016, Targeting $23 appeared first on Cryptonews.
6

Artigo
Ver tradução
Bitcoin Price Prediction: Strategy Posts $21B Q3 Gain as Strive Records $169M BTC BuyBitcoin trades at $85,500, down 0.6% over 24 hours, after recently reclaiming $86,000 and testing the area below $87,000, while its price prediction still leans bullish. The retreat puts the breakout attempt back under scrutiny: corporate buying is substantial, but it has not yet cleared nearby resistance.
Strategy reported an estimated $20.91 billion Q3 gain on its bitcoin holdings, while Strive disclosed buying 2,000 BTC for $169 million at an average of $84,422 per coin. Strive’s filing puts its total at 29,462 BTC.
Strategy reports a $21 billion gain on digital assets in Q3 2026. Last week, we acquired 334 $BTC and repurchased $176M of $STRC. As of 10/4/26, we hold 848,000 BTC and $5.7B of USD Assets. $MSTRhttps://t.co/DfKvdQl19R
— Strategy (@Strategy) October 5, 2026
Those headline numbers strengthen the accumulation narrative, but they do not settle the price trend. Bitcoin’s next move depends on whether demand can absorb supply around $87,000, and whether macro data keeps rate expectations supportive.
Earn $50 and Enter $300K Prize Draw on EdgeXBitcoin Price Prediction: Can BTC Reclaim $87,000 This Week?
BTC briefly approached $87,000 on October 5, but has since pulled back. ETF demand and turnover need to persist if the market is to push through resistance rather than revisit the range.
The immediate test is $87,000–$87,400, with $87,570 above it as a broader continuation threshold. On the downside, $82,000–$85,000 is the former consolidation zone, and the first area bulls need to defend.
Bitcoin (BTC)
24h7d30d1yAll time
Bull case: sustained, buying clears $87,400, opening a test of $87,570. Base case: BTC chops between the breakout area and resistance while traders wait for fresh catalysts. Invalidation: a decisive loss of $82,000 would undermine the breakout and put lower support back in view.
The September jobs report showed just 29,000 payroll additions and unemployment at 4.2%; markets took that as reducing near-term rate pressure, a tailwind for risk assets. But can one softer data point carry the move?
The October Bitcoin price outlook maps the resistance and event risks to watch. For now, the chart calls for confirmation, not assumption.
Trade Bitcoin on Bybit and Get a Chance to Win Our $1,000 USDT AirdropBitcoin Hyper Targets Early Mover Upside as Bitcoin Tests Key Levels
Strive’s purchase and Strategy’s reported gain reinforce the case for corporate Bitcoin exposure. Still, those figures are not a floor: treasury demand can support sentiment, but BTC remains exposed to macro repricing and profit-taking near resistance. With spot near $86,000, the upside from here may look more incremental than early-stage investors expect.
Precision matters.$HYPER doesn’t miss. https://t.co/VNG0P4GuDo pic.twitter.com/PZAGiAL00T
— Bitcoin Hyper (@BTC_Hyper2) October 5, 2026
That gap between established-asset exposure and infrastructure bets is where Bitcoin Hyper positions itself. The project is the first Bitcoin Layer 2 with SVM integration, designed to bring fast smart contracts and low-cost execution to Bitcoin while retaining its security and trust model. Its features include low-latency processing and a decentralized canonical bridge for BTC transfers.
The presale price is $0.0136872, and the project has raised $33.1 million so far and is still growing. Staking offers at a high 30% APY, only for early buyers.
Research Bitcoin Hyper before the early buying window closes.
Discover: The Best Token Presales
The post Bitcoin Price Prediction: Strategy Posts $21B Q3 Gain as Strive Records $169M BTC Buy appeared first on Cryptonews.
Bitcoin Price Prediction: Strategy Posts $21B Q3 Gain as Strive Records $169M BTC Buy
Bitcoin trades at $85,500, down 0.6% over 24 hours, after recently reclaiming $86,000 and testing the area below $87,000, while its price prediction still leans bullish. The retreat puts the breakout attempt back under scrutiny: corporate buying is substantial, but it has not yet cleared nearby resistance.
Strategy reported an estimated $20.91 billion Q3 gain on its bitcoin holdings, while Strive disclosed buying 2,000 BTC for $169 million at an average of $84,422 per coin. Strive’s filing puts its total at 29,462 BTC.
Strategy reports a $21 billion gain on digital assets in Q3 2026. Last week, we acquired 334 $BTC and repurchased $176M of $STRC. As of 10/4/26, we hold 848,000 BTC and $5.7B of USD Assets. $MSTRhttps://t.co/DfKvdQl19R
— Strategy (@Strategy) October 5, 2026
Those headline numbers strengthen the accumulation narrative, but they do not settle the price trend. Bitcoin’s next move depends on whether demand can absorb supply around $87,000, and whether macro data keeps rate expectations supportive.
Earn $50 and Enter $300K Prize Draw on EdgeXBitcoin Price Prediction: Can BTC Reclaim $87,000 This Week?
BTC briefly approached $87,000 on October 5, but has since pulled back. ETF demand and turnover need to persist if the market is to push through resistance rather than revisit the range.
The immediate test is $87,000–$87,400, with $87,570 above it as a broader continuation threshold. On the downside, $82,000–$85,000 is the former consolidation zone, and the first area bulls need to defend.
Bitcoin (BTC)
24h7d30d1yAll time
Bull case: sustained, buying clears $87,400, opening a test of $87,570. Base case: BTC chops between the breakout area and resistance while traders wait for fresh catalysts. Invalidation: a decisive loss of $82,000 would undermine the breakout and put lower support back in view.
The September jobs report showed just 29,000 payroll additions and unemployment at 4.2%; markets took that as reducing near-term rate pressure, a tailwind for risk assets. But can one softer data point carry the move?
The October Bitcoin price outlook maps the resistance and event risks to watch. For now, the chart calls for confirmation, not assumption.
Trade Bitcoin on Bybit and Get a Chance to Win Our $1,000 USDT AirdropBitcoin Hyper Targets Early Mover Upside as Bitcoin Tests Key Levels
Strive’s purchase and Strategy’s reported gain reinforce the case for corporate Bitcoin exposure. Still, those figures are not a floor: treasury demand can support sentiment, but BTC remains exposed to macro repricing and profit-taking near resistance. With spot near $86,000, the upside from here may look more incremental than early-stage investors expect.
Precision matters.$HYPER doesn’t miss. https://t.co/VNG0P4GuDo pic.twitter.com/PZAGiAL00T
— Bitcoin Hyper (@BTC_Hyper2) October 5, 2026
That gap between established-asset exposure and infrastructure bets is where Bitcoin Hyper positions itself. The project is the first Bitcoin Layer 2 with SVM integration, designed to bring fast smart contracts and low-cost execution to Bitcoin while retaining its security and trust model. Its features include low-latency processing and a decentralized canonical bridge for BTC transfers.
The presale price is $0.0136872, and the project has raised $33.1 million so far and is still growing. Staking offers at a high 30% APY, only for early buyers.
Research Bitcoin Hyper before the early buying window closes.
Discover: The Best Token Presales
The post Bitcoin Price Prediction: Strategy Posts $21B Q3 Gain as Strive Records $169M BTC Buy appeared first on Cryptonews.
Strategy reported an estimated $20.91 billion Q3 gain on its bitcoin holdings, while Strive disclosed buying 2,000 BTC for $169 million at an average of $84,422 per coin. Strive’s filing puts its total at 29,462 BTC.
Strategy reports a $21 billion gain on digital assets in Q3 2026. Last week, we acquired 334 $BTC and repurchased $176M of $STRC. As of 10/4/26, we hold 848,000 BTC and $5.7B of USD Assets. $MSTRhttps://t.co/DfKvdQl19R
— Strategy (@Strategy) October 5, 2026
Those headline numbers strengthen the accumulation narrative, but they do not settle the price trend. Bitcoin’s next move depends on whether demand can absorb supply around $87,000, and whether macro data keeps rate expectations supportive.
Earn $50 and Enter $300K Prize Draw on EdgeXBitcoin Price Prediction: Can BTC Reclaim $87,000 This Week?
BTC briefly approached $87,000 on October 5, but has since pulled back. ETF demand and turnover need to persist if the market is to push through resistance rather than revisit the range.
The immediate test is $87,000–$87,400, with $87,570 above it as a broader continuation threshold. On the downside, $82,000–$85,000 is the former consolidation zone, and the first area bulls need to defend.
Bitcoin (BTC)
24h7d30d1yAll time
Bull case: sustained, buying clears $87,400, opening a test of $87,570. Base case: BTC chops between the breakout area and resistance while traders wait for fresh catalysts. Invalidation: a decisive loss of $82,000 would undermine the breakout and put lower support back in view.
The September jobs report showed just 29,000 payroll additions and unemployment at 4.2%; markets took that as reducing near-term rate pressure, a tailwind for risk assets. But can one softer data point carry the move?
The October Bitcoin price outlook maps the resistance and event risks to watch. For now, the chart calls for confirmation, not assumption.
Trade Bitcoin on Bybit and Get a Chance to Win Our $1,000 USDT AirdropBitcoin Hyper Targets Early Mover Upside as Bitcoin Tests Key Levels
Strive’s purchase and Strategy’s reported gain reinforce the case for corporate Bitcoin exposure. Still, those figures are not a floor: treasury demand can support sentiment, but BTC remains exposed to macro repricing and profit-taking near resistance. With spot near $86,000, the upside from here may look more incremental than early-stage investors expect.
Precision matters.$HYPER doesn’t miss. https://t.co/VNG0P4GuDo pic.twitter.com/PZAGiAL00T
— Bitcoin Hyper (@BTC_Hyper2) October 5, 2026
That gap between established-asset exposure and infrastructure bets is where Bitcoin Hyper positions itself. The project is the first Bitcoin Layer 2 with SVM integration, designed to bring fast smart contracts and low-cost execution to Bitcoin while retaining its security and trust model. Its features include low-latency processing and a decentralized canonical bridge for BTC transfers.
The presale price is $0.0136872, and the project has raised $33.1 million so far and is still growing. Staking offers at a high 30% APY, only for early buyers.
Research Bitcoin Hyper before the early buying window closes.
Discover: The Best Token Presales
The post Bitcoin Price Prediction: Strategy Posts $21B Q3 Gain as Strive Records $169M BTC Buy appeared first on Cryptonews.
6

Artigo
Microsoft Copilot AI prevê que Chainlink (LINK) pode chegar a US$ 100 em 2026O Microsoft Copilot AI prevê que, em um mundo no qual a Chainlink se torne a espinha dorsal de um importante sistema global de liquidação, como o SWIFT, o LINK poderia disparar para US$ 100 até 1º de janeiro de 2027, uma alta de cerca de 7 vezes em relação aos atuais ~US$ 14,20. Esse é um cenário extremo, que exigiria tanto um mercado de alta de criptomoedas em pleno vapor quanto um catalisador histórico para a Chainlink — algo altamente improvável, mas não impossível.
Imagine que uma das principais redes de infraestrutura financeira do mundo, possivelmente o SWIFT ou outro sistema global de liquidação, anuncie que o Chainlink CCIP se tornará uma camada central de interoperabilidade para transferir ativos tokenizados entre bancos, blockchains e instituições financeiras.
Microsoft Copilot AI prevê que Chainlink (LINK) pode chegar a US$ 100 em 2026
O Microsoft Copilot AI prevê que, em um mundo no qual a Chainlink se torne a espinha dorsal de um importante sistema global de liquidação, como o SWIFT, o LINK poderia disparar para US$ 100 até 1º de janeiro de 2027, uma alta de cerca de 7 vezes em relação aos atuais ~US$ 14,20. Esse é um cenário extremo, que exigiria tanto um mercado de alta de criptomoedas em pleno vapor quanto um catalisador histórico para a Chainlink — algo altamente improvável, mas não impossível.
Imagine que uma das principais redes de infraestrutura financeira do mundo, possivelmente o SWIFT ou outro sistema global de liquidação, anuncie que o Chainlink CCIP se tornará uma camada central de interoperabilidade para transferir ativos tokenizados entre bancos, blockchains e instituições financeiras.
Imagine que uma das principais redes de infraestrutura financeira do mundo, possivelmente o SWIFT ou outro sistema global de liquidação, anuncie que o Chainlink CCIP se tornará uma camada central de interoperabilidade para transferir ativos tokenizados entre bancos, blockchains e instituições financeiras.
159

Artigo
Meta AI de Mark Zuckerberg prevê preço do XRP na casa dos dois dígitos até 2026Atualmente cotado a aproximadamente US$ 1,50, o Meta AI de Mark Zuckerberg prevê que o XRP pode disparar para mais de US$ 10 este ano, uma alta de cerca de 8 vezes, caso ocorra um enorme mercado de alta das criptomoedas, o medo institucional de ficar de fora (FOMO) e um catalisador verdadeiramente transformador.
Aqui está um cenário altamente improvável, mas não impossível, apresentado pelo Meta AI: a Ripple anuncia que o XRP foi oficialmente escolhido como ativo global de liquidação e ativo-ponte por um consórcio de grandes bancos e redes de pagamento, com transações reais começando a ocorrer em vários corredores. Não seria apenas mais um projeto-piloto ou parceria; representaria, em vez disso, liquidações em escala e em ambiente de produção.
Meta AI de Mark Zuckerberg prevê preço do XRP na casa dos dois dígitos até 2026
Atualmente cotado a aproximadamente US$ 1,50, o Meta AI de Mark Zuckerberg prevê que o XRP pode disparar para mais de US$ 10 este ano, uma alta de cerca de 8 vezes, caso ocorra um enorme mercado de alta das criptomoedas, o medo institucional de ficar de fora (FOMO) e um catalisador verdadeiramente transformador.
Aqui está um cenário altamente improvável, mas não impossível, apresentado pelo Meta AI: a Ripple anuncia que o XRP foi oficialmente escolhido como ativo global de liquidação e ativo-ponte por um consórcio de grandes bancos e redes de pagamento, com transações reais começando a ocorrer em vários corredores. Não seria apenas mais um projeto-piloto ou parceria; representaria, em vez disso, liquidações em escala e em ambiente de produção.
Aqui está um cenário altamente improvável, mas não impossível, apresentado pelo Meta AI: a Ripple anuncia que o XRP foi oficialmente escolhido como ativo global de liquidação e ativo-ponte por um consórcio de grandes bancos e redes de pagamento, com transações reais começando a ocorrer em vários corredores. Não seria apenas mais um projeto-piloto ou parceria; representaria, em vez disso, liquidações em escala e em ambiente de produção.
108
Artigo
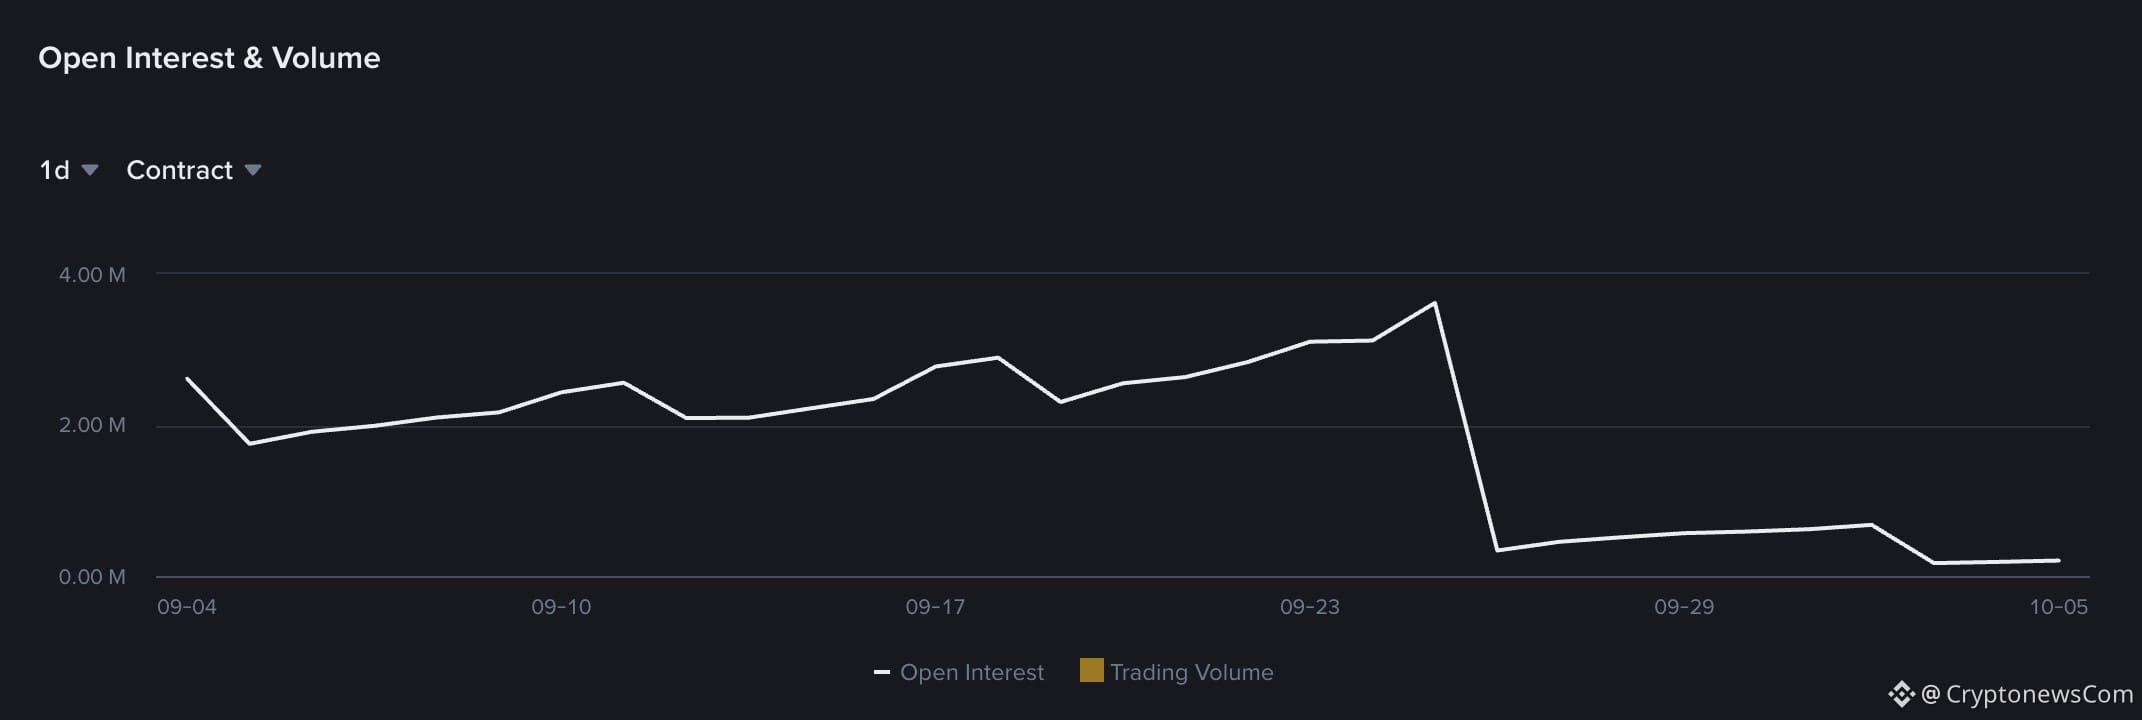
Preço do XRP e interesse em aberto deixam espaço para posicionamento enquanto a faixa se mantémO XRP está sendo negociado em uma faixa estreita de US$ 1,45–US$ 1,55, e um fechamento por hora acima de US$ 1,54–US$ 1,55 pode atrair compradores guiados pelo impulso em direção a US$ 1,63 e, depois, à região de US$ 1,70. O risco oposto é igualmente claro: uma queda abaixo de US$ 1,45 enfraqueceria a recuperação e colocaria em foco a EMA de 50 dias, próxima de US$ 1,38.
Nosso analista descreve a faixa cada vez mais estreita como um gatilho de volatilidade, observando que o interesse em aberto da Binance permanece abaixo dos níveis registrados um ano antes. Esse posicionamento pode deixar espaço para o aumento da alavancagem após um rompimento, mas não indica que um movimento brusco seja iminente.
Preço do XRP e interesse em aberto deixam espaço para posicionamento enquanto a faixa se mantém
O XRP está sendo negociado em uma faixa estreita de US$ 1,45–US$ 1,55, e um fechamento por hora acima de US$ 1,54–US$ 1,55 pode atrair compradores guiados pelo impulso em direção a US$ 1,63 e, depois, à região de US$ 1,70. O risco oposto é igualmente claro: uma queda abaixo de US$ 1,45 enfraqueceria a recuperação e colocaria em foco a EMA de 50 dias, próxima de US$ 1,38.
Nosso analista descreve a faixa cada vez mais estreita como um gatilho de volatilidade, observando que o interesse em aberto da Binance permanece abaixo dos níveis registrados um ano antes. Esse posicionamento pode deixar espaço para o aumento da alavancagem após um rompimento, mas não indica que um movimento brusco seja iminente.
Nosso analista descreve a faixa cada vez mais estreita como um gatilho de volatilidade, observando que o interesse em aberto da Binance permanece abaixo dos níveis registrados um ano antes. Esse posicionamento pode deixar espaço para o aumento da alavancagem após um rompimento, mas não indica que um movimento brusco seja iminente.
3
Artigo
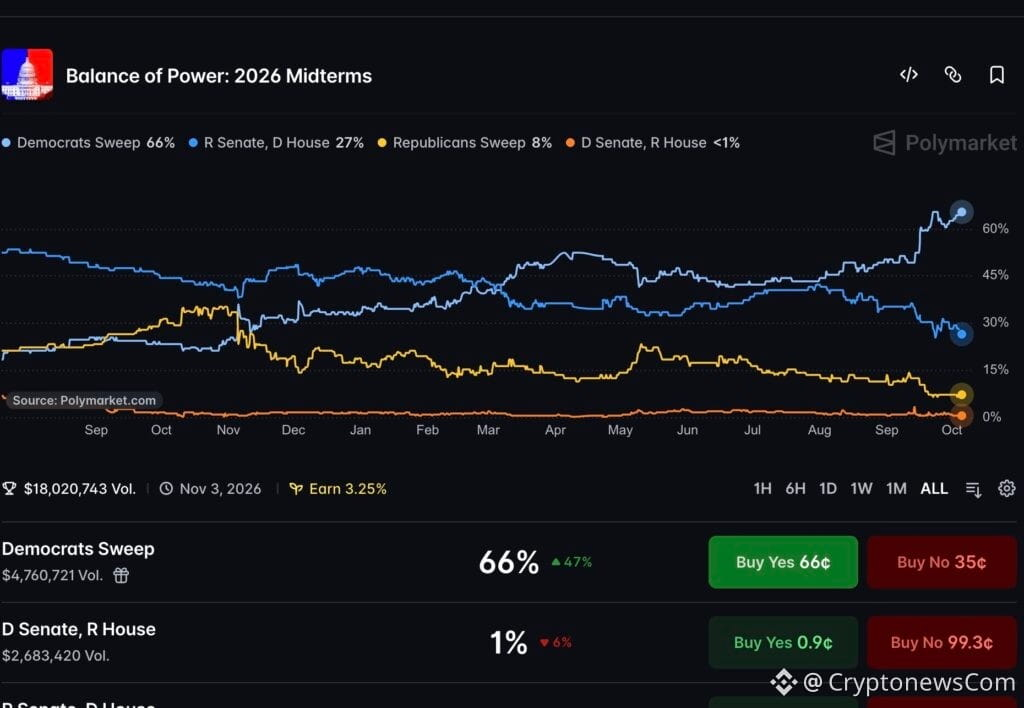
Odds da Polymarket para as eleições intercalares dos EUA: o que significa para a política cripto uma probabilidade de 66,5% de vitória democrataAtualmente, as odds da Polymarket para as eleições intercalares dos EUA indicam uma probabilidade de 66,5% de os democratas conquistarem o controlo de ambas as câmaras do Congresso, a 5 de outubro, com um volume de 17,81 milhões de dólares em apostas no evento e 7,55 milhões de dólares em liquidez. Trata-se de uma probabilidade implícita no mercado, não de uma sondagem nem do resultado das eleições, e não significa que qualquer projeto de lei sobre criptomoedas tenha 66,5% de probabilidade de ser aprovado.
O mercado continua aberto e está previsto que encerre em 4 de novembro de 2026. A sua relevância para os traders de cripto é, por isso, condicional: uma possível mudança no controlo do Congresso poderá alterar as expectativas em relação à regulamentação das criptomoedas, mas os números não mostram que os mercados cripto tenham reagido.
Odds da Polymarket para as eleições intercalares dos EUA: o que significa para a política cripto uma probabilidade de 66,5% de vitória democrata
Atualmente, as odds da Polymarket para as eleições intercalares dos EUA indicam uma probabilidade de 66,5% de os democratas conquistarem o controlo de ambas as câmaras do Congresso, a 5 de outubro, com um volume de 17,81 milhões de dólares em apostas no evento e 7,55 milhões de dólares em liquidez. Trata-se de uma probabilidade implícita no mercado, não de uma sondagem nem do resultado das eleições, e não significa que qualquer projeto de lei sobre criptomoedas tenha 66,5% de probabilidade de ser aprovado.
O mercado continua aberto e está previsto que encerre em 4 de novembro de 2026. A sua relevância para os traders de cripto é, por isso, condicional: uma possível mudança no controlo do Congresso poderá alterar as expectativas em relação à regulamentação das criptomoedas, mas os números não mostram que os mercados cripto tenham reagido.
O mercado continua aberto e está previsto que encerre em 4 de novembro de 2026. A sua relevância para os traders de cripto é, por isso, condicional: uma possível mudança no controlo do Congresso poderá alterar as expectativas em relação à regulamentação das criptomoedas, mas os números não mostram que os mercados cripto tenham reagido.
1
733
Verificado
Artigo
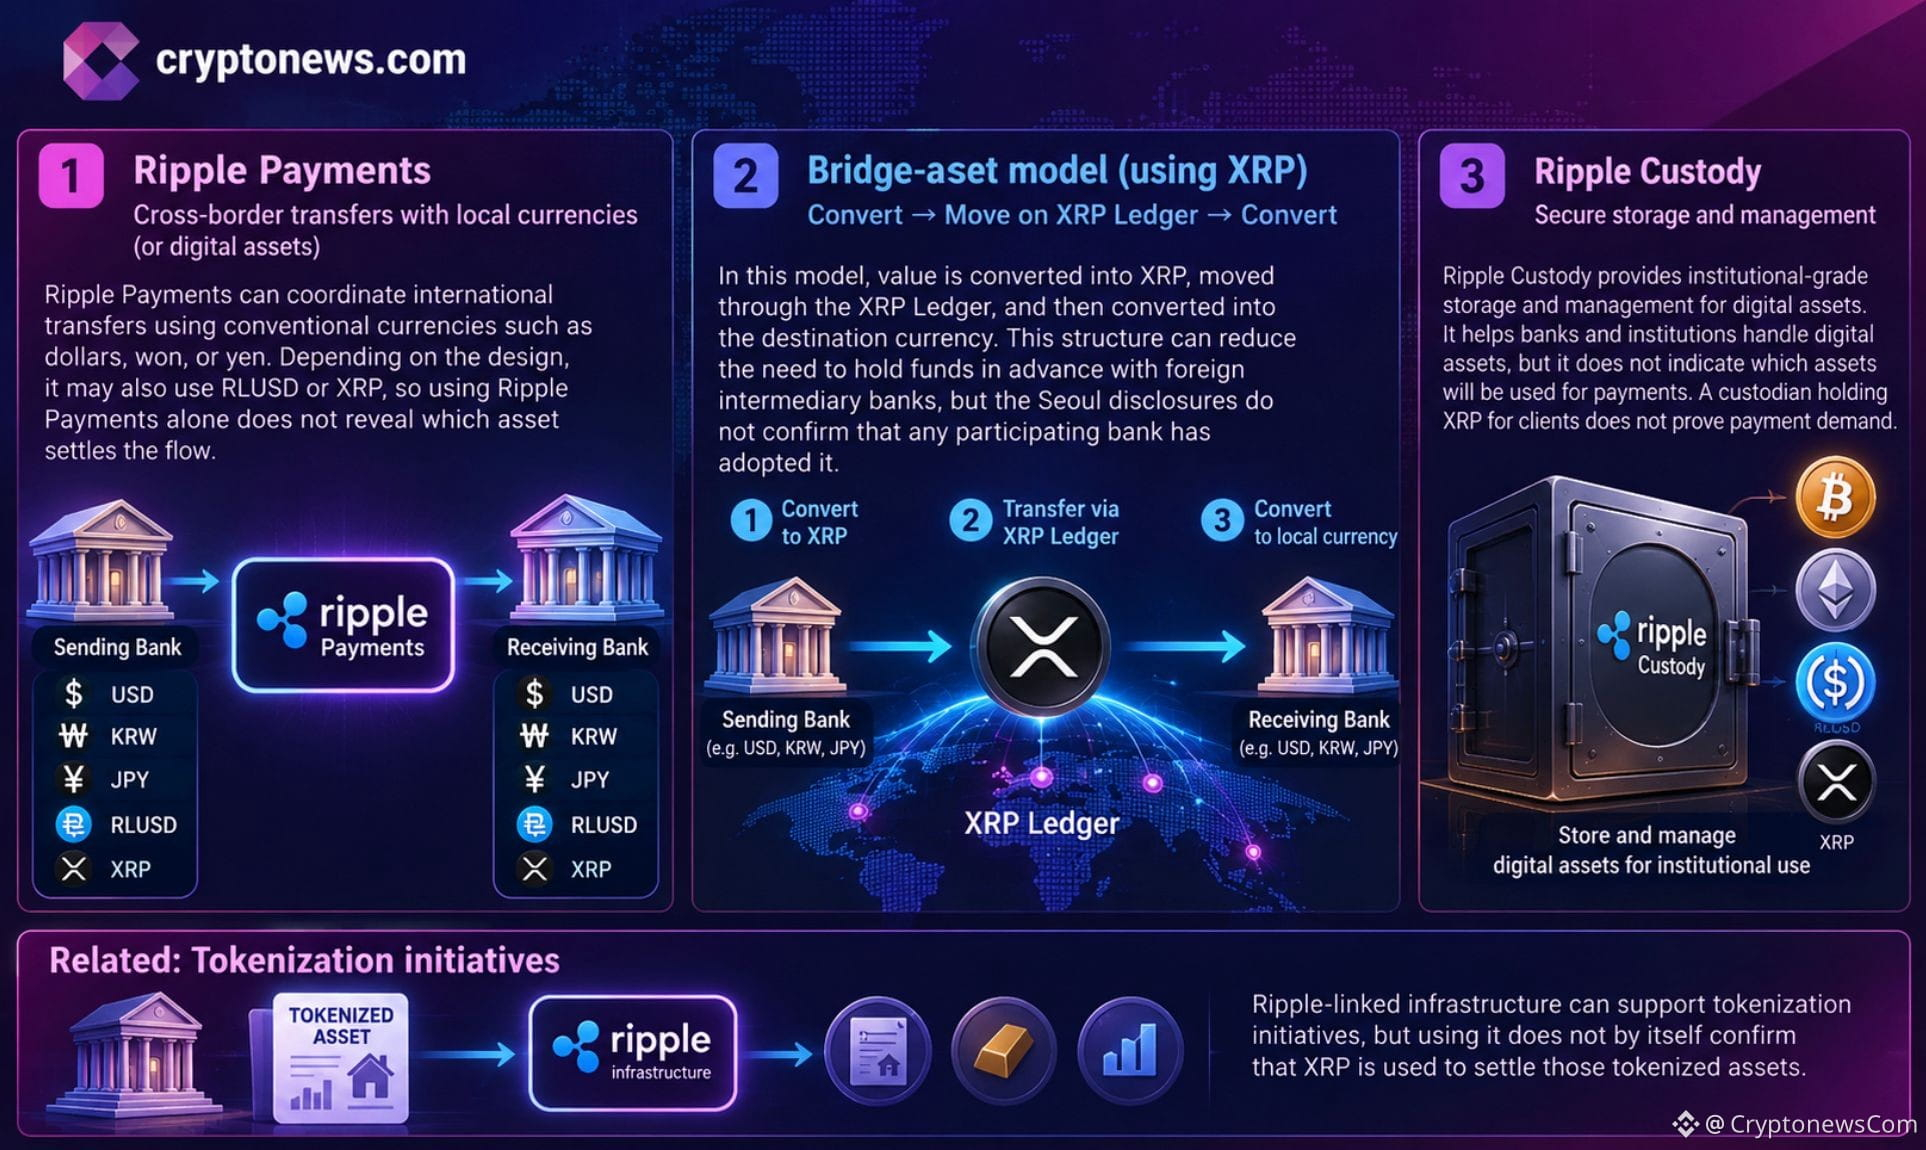
Notícias sobre XRP: evento em Seul mostra o alcance da RippleQuatro instituições financeiras coreanas apareceram ao lado da Ripple no XRP Seoul 2026, gerando notícias e especulações sobre o alcance da empresa. Até hoje, o Jeonbuk Bank planejou a implantação do Ripple Payments, e as iniciativas de custódia e remessas do Kbank estão documentadas.
A Ripple apresentou o XRP Asia no evento de Seul como uma iniciativa regional para promover o XRP Ledger. Em um anúncio de 18 de agosto de 2026, a Ripple informou que o Jeonbuk Bank implantaria o Ripple Payments para remessas empresariais internacionais. A empresa o descreveu como o primeiro banco regional da Coreia a implantar o serviço, que tem como objetivo oferecer liquidação quase em tempo real.
Notícias sobre XRP: evento em Seul mostra o alcance da Ripple
Quatro instituições financeiras coreanas apareceram ao lado da Ripple no XRP Seoul 2026, gerando notícias e especulações sobre o alcance da empresa. Até hoje, o Jeonbuk Bank planejou a implantação do Ripple Payments, e as iniciativas de custódia e remessas do Kbank estão documentadas.
A Ripple apresentou o XRP Asia no evento de Seul como uma iniciativa regional para promover o XRP Ledger. Em um anúncio de 18 de agosto de 2026, a Ripple informou que o Jeonbuk Bank implantaria o Ripple Payments para remessas empresariais internacionais. A empresa o descreveu como o primeiro banco regional da Coreia a implantar o serviço, que tem como objetivo oferecer liquidação quase em tempo real.
A Ripple apresentou o XRP Asia no evento de Seul como uma iniciativa regional para promover o XRP Ledger. Em um anúncio de 18 de agosto de 2026, a Ripple informou que o Jeonbuk Bank implantaria o Ripple Payments para remessas empresariais internacionais. A empresa o descreveu como o primeiro banco regional da Coreia a implantar o serviço, que tem como objetivo oferecer liquidação quase em tempo real.
26
Artigo
Ver tradução
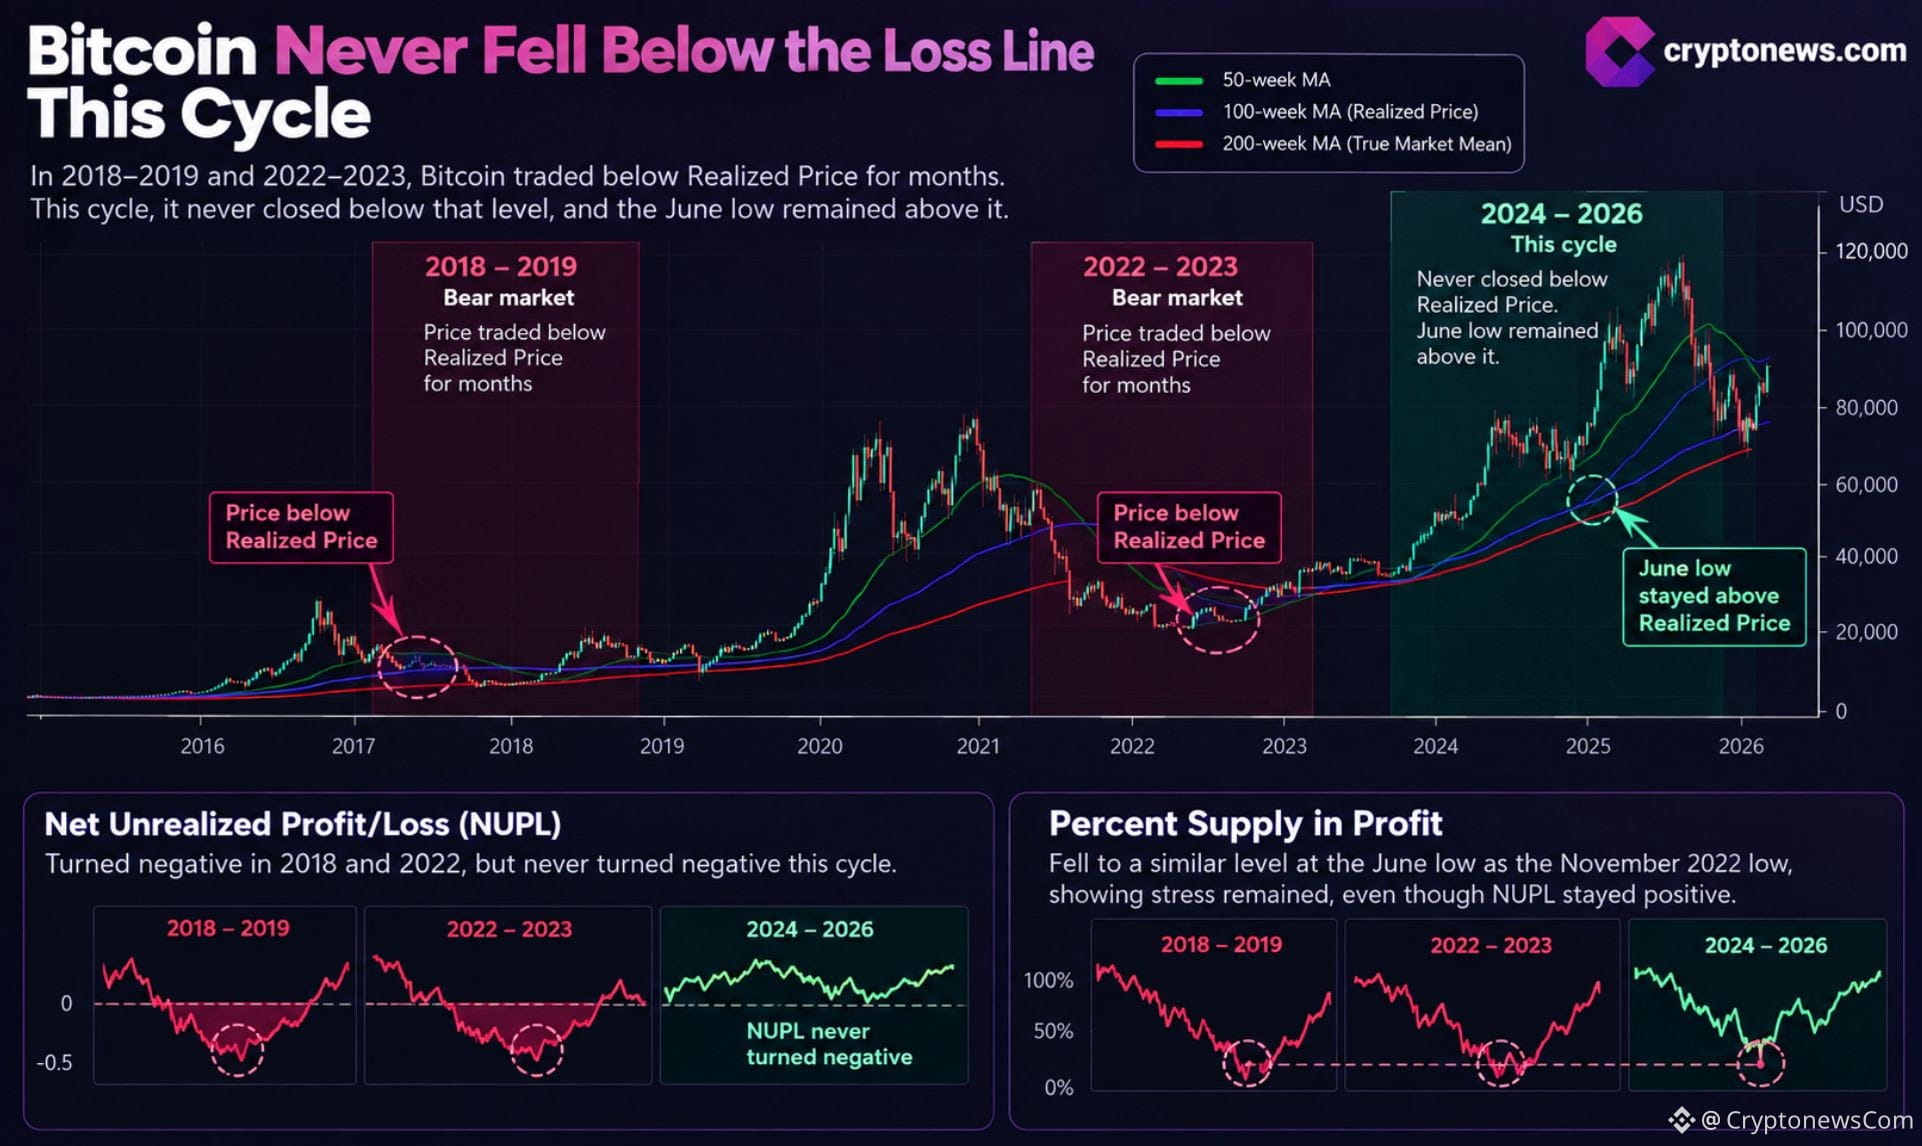
Bitcoin Price Stays Out of the Red as This Bear Market Breaks a Historic PatternBitcoin price drawdown never produced a daily close below realized price this cycle, while aggregate NUPL remained positive throughout the cycle. That is evidence of shallower market-wide stress than in prior bear markets.
In the 2018–2019 and 2022–2023 bear markets, Bitcoin traded at a realized price for months below. This cycle, it never recorded a daily close below that level, and the June low remained above it. Glassnode says that if price holds above the True Market Mean, the June low would be the shallowest of the three bear-market lows shown in its comparison.
At the June low, Percent Supply in Profit fell to approximately the level seen at the November 2022 low, meaning a similarly large share of coins was underwater. The difference was the scale of those losses: Net Unrealized Profit/Loss (NUPL), which measures paper gains and losses across all coins, never turned negative, unlike in 2018 and 2022.
NUPL staying above zero does not mean every coin or every long-term holder remains in profit, just as Bitcoin holding above Realized Price.
Earn $50 and Enter $300K Prize Draw on EdgeXWhat Does Holders Profitability Evidence Show?
Glassnode identifies the largest long-term-holder supply cluster at $84,000–$85,000. That concentration marks a meaningful area of holder supply, but a supply cluster is not proof that those coins are profitable or that their owners will sell.
Above it, the report places the mean MVRV price at $96,700. The measure is the Realized Price multiplied by Bitcoin’s long-term average MVRV, and Glassnode describes it as a level where the average holder’s profit returns to its long-term norm. Buyers from one to two years earlier, who entered near the top of the range, also approach break-even around that price.
Bitcoin Percentage Holders in Profit, Coinglass
On the downside, the True Market Mean at $77,000 is the report’s main support reference. These levels help frame the recovery, and institutional demand is another part of that picture; Bitcoin’s institutional-demand outlook offers related context for assessing the role of inflows.
Data indicated that long-term-holder MVRV stayed above 1 during the current cycle. There is still evidence that selling pressure has been restrained. Weekly realized profit during the current run is a fraction of the amounts recorded at the 2024 and 2025 tops, even though almost all short-term holders are back in profit.
Trade Bitcoin on Bybit and Get a Chance to Win Our $1,000 USDT AirdropBitcoin Price Recovery Faces a Defined Test
The next major test is at $95,000–$97,000, where options positioning and the mean MVRV price converge. Positive gamma around the $95,000 strikes reached its highest reading on the report’s chart, while negative gamma built between spot and $92,000. Dealer hedging can accelerate price moves between spot and $92,000, then tend to dampen them near $95,000.
Demand indicators have improved, but they do not settle the question of continuation. US spot ETFs recorded about $1.3 billion in inflows over the five days after the squeeze began, following two weeks of net outflows. Meanwhile, 24-hour spot volume more than doubled from its August trough, rising 121% since the rally began, although its seven-day average remained about 30% below its level a year earlier.
Bitcoin (BTC)
24h7d30d1yAll time
Those conditions support the recovery narrative. A move below $84,000 would put the $77,000 True Market Mean back in view, while a sustained break through $95,000–$97,000 would test the overhead resistance cluster. Broader October resistance and macro catalysts also shape the market’s risk-reward, as covered in Bitcoin’s October price outlook.
The defensible conclusion is narrower than the headline claim: this cycle avoided a negative aggregate NUPL reading and a daily close below Realized Price, while profit taking remained light and ETF inflows and spot volume recovered.
Holding above $84,000 keeps the path toward $96,700 open in Glassnode’s framework; a move below $84,000 and then $77,000 would put the recovery in doubt.
Discover: The Best Token Presales
The post Bitcoin Price Stays Out of the Red as This Bear Market Breaks a Historic Pattern appeared first on Cryptonews.
Bitcoin Price Stays Out of the Red as This Bear Market Breaks a Historic Pattern
Bitcoin price drawdown never produced a daily close below realized price this cycle, while aggregate NUPL remained positive throughout the cycle. That is evidence of shallower market-wide stress than in prior bear markets.
In the 2018–2019 and 2022–2023 bear markets, Bitcoin traded at a realized price for months below. This cycle, it never recorded a daily close below that level, and the June low remained above it. Glassnode says that if price holds above the True Market Mean, the June low would be the shallowest of the three bear-market lows shown in its comparison.
At the June low, Percent Supply in Profit fell to approximately the level seen at the November 2022 low, meaning a similarly large share of coins was underwater. The difference was the scale of those losses: Net Unrealized Profit/Loss (NUPL), which measures paper gains and losses across all coins, never turned negative, unlike in 2018 and 2022.
NUPL staying above zero does not mean every coin or every long-term holder remains in profit, just as Bitcoin holding above Realized Price.
Earn $50 and Enter $300K Prize Draw on EdgeXWhat Does Holders Profitability Evidence Show?
Glassnode identifies the largest long-term-holder supply cluster at $84,000–$85,000. That concentration marks a meaningful area of holder supply, but a supply cluster is not proof that those coins are profitable or that their owners will sell.
Above it, the report places the mean MVRV price at $96,700. The measure is the Realized Price multiplied by Bitcoin’s long-term average MVRV, and Glassnode describes it as a level where the average holder’s profit returns to its long-term norm. Buyers from one to two years earlier, who entered near the top of the range, also approach break-even around that price.
Bitcoin Percentage Holders in Profit, Coinglass
On the downside, the True Market Mean at $77,000 is the report’s main support reference. These levels help frame the recovery, and institutional demand is another part of that picture; Bitcoin’s institutional-demand outlook offers related context for assessing the role of inflows.
Data indicated that long-term-holder MVRV stayed above 1 during the current cycle. There is still evidence that selling pressure has been restrained. Weekly realized profit during the current run is a fraction of the amounts recorded at the 2024 and 2025 tops, even though almost all short-term holders are back in profit.
Trade Bitcoin on Bybit and Get a Chance to Win Our $1,000 USDT AirdropBitcoin Price Recovery Faces a Defined Test
The next major test is at $95,000–$97,000, where options positioning and the mean MVRV price converge. Positive gamma around the $95,000 strikes reached its highest reading on the report’s chart, while negative gamma built between spot and $92,000. Dealer hedging can accelerate price moves between spot and $92,000, then tend to dampen them near $95,000.
Demand indicators have improved, but they do not settle the question of continuation. US spot ETFs recorded about $1.3 billion in inflows over the five days after the squeeze began, following two weeks of net outflows. Meanwhile, 24-hour spot volume more than doubled from its August trough, rising 121% since the rally began, although its seven-day average remained about 30% below its level a year earlier.
Bitcoin (BTC)
24h7d30d1yAll time
Those conditions support the recovery narrative. A move below $84,000 would put the $77,000 True Market Mean back in view, while a sustained break through $95,000–$97,000 would test the overhead resistance cluster. Broader October resistance and macro catalysts also shape the market’s risk-reward, as covered in Bitcoin’s October price outlook.
The defensible conclusion is narrower than the headline claim: this cycle avoided a negative aggregate NUPL reading and a daily close below Realized Price, while profit taking remained light and ETF inflows and spot volume recovered.
Holding above $84,000 keeps the path toward $96,700 open in Glassnode’s framework; a move below $84,000 and then $77,000 would put the recovery in doubt.
Discover: The Best Token Presales
The post Bitcoin Price Stays Out of the Red as This Bear Market Breaks a Historic Pattern appeared first on Cryptonews.
In the 2018–2019 and 2022–2023 bear markets, Bitcoin traded at a realized price for months below. This cycle, it never recorded a daily close below that level, and the June low remained above it. Glassnode says that if price holds above the True Market Mean, the June low would be the shallowest of the three bear-market lows shown in its comparison.
At the June low, Percent Supply in Profit fell to approximately the level seen at the November 2022 low, meaning a similarly large share of coins was underwater. The difference was the scale of those losses: Net Unrealized Profit/Loss (NUPL), which measures paper gains and losses across all coins, never turned negative, unlike in 2018 and 2022.
NUPL staying above zero does not mean every coin or every long-term holder remains in profit, just as Bitcoin holding above Realized Price.
Earn $50 and Enter $300K Prize Draw on EdgeXWhat Does Holders Profitability Evidence Show?
Glassnode identifies the largest long-term-holder supply cluster at $84,000–$85,000. That concentration marks a meaningful area of holder supply, but a supply cluster is not proof that those coins are profitable or that their owners will sell.
Above it, the report places the mean MVRV price at $96,700. The measure is the Realized Price multiplied by Bitcoin’s long-term average MVRV, and Glassnode describes it as a level where the average holder’s profit returns to its long-term norm. Buyers from one to two years earlier, who entered near the top of the range, also approach break-even around that price.
Bitcoin Percentage Holders in Profit, Coinglass
On the downside, the True Market Mean at $77,000 is the report’s main support reference. These levels help frame the recovery, and institutional demand is another part of that picture; Bitcoin’s institutional-demand outlook offers related context for assessing the role of inflows.
Data indicated that long-term-holder MVRV stayed above 1 during the current cycle. There is still evidence that selling pressure has been restrained. Weekly realized profit during the current run is a fraction of the amounts recorded at the 2024 and 2025 tops, even though almost all short-term holders are back in profit.
Trade Bitcoin on Bybit and Get a Chance to Win Our $1,000 USDT AirdropBitcoin Price Recovery Faces a Defined Test
The next major test is at $95,000–$97,000, where options positioning and the mean MVRV price converge. Positive gamma around the $95,000 strikes reached its highest reading on the report’s chart, while negative gamma built between spot and $92,000. Dealer hedging can accelerate price moves between spot and $92,000, then tend to dampen them near $95,000.
Demand indicators have improved, but they do not settle the question of continuation. US spot ETFs recorded about $1.3 billion in inflows over the five days after the squeeze began, following two weeks of net outflows. Meanwhile, 24-hour spot volume more than doubled from its August trough, rising 121% since the rally began, although its seven-day average remained about 30% below its level a year earlier.
Bitcoin (BTC)
24h7d30d1yAll time
Those conditions support the recovery narrative. A move below $84,000 would put the $77,000 True Market Mean back in view, while a sustained break through $95,000–$97,000 would test the overhead resistance cluster. Broader October resistance and macro catalysts also shape the market’s risk-reward, as covered in Bitcoin’s October price outlook.
The defensible conclusion is narrower than the headline claim: this cycle avoided a negative aggregate NUPL reading and a daily close below Realized Price, while profit taking remained light and ETF inflows and spot volume recovered.
Holding above $84,000 keeps the path toward $96,700 open in Glassnode’s framework; a move below $84,000 and then $77,000 would put the recovery in doubt.
Discover: The Best Token Presales
The post Bitcoin Price Stays Out of the Red as This Bear Market Breaks a Historic Pattern appeared first on Cryptonews.
2
Verificado
Artigo
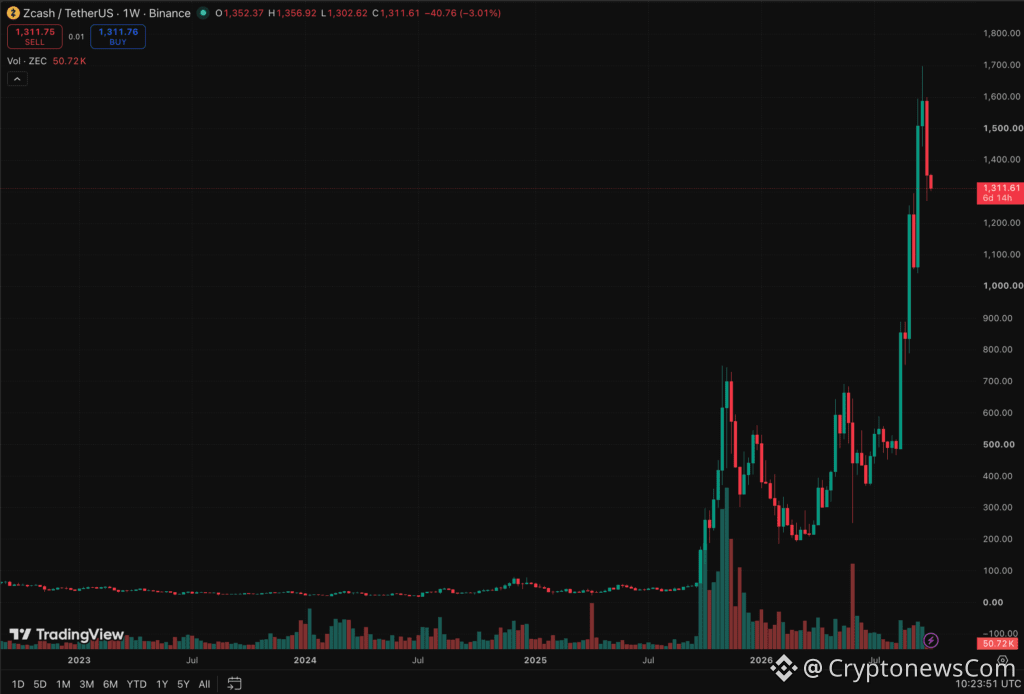
Atualização NU7 da Zcash: ZEC tem como alvo blocos de 25 segundos na rede de testesNas notícias de hoje sobre a Zcash, a rede de privacidade ativou sua atualização NU7 na rede pública de testes no bloco 4.465.026, reduzindo o intervalo-alvo de 75 segundos para 25 segundos. Se os serviços mantiverem uma política de três confirmações, o tempo de espera-alvo cai de 225 para cerca de 75 segundos, mas isso continua sendo um teste na rede de testes, e não uma mudança na rede principal.
O teste usa moedas sem valor para permitir que desenvolvedores e operadores de infraestrutura ensaiem a atualização. A NU7 também redireciona 60% das taxas de transação para uma reserva de recompensas futuras, reduz as recompensas por bloco para preservar o cronograma de emissão de ZEC e desativa as transações Sprout.
Atualização NU7 da Zcash: ZEC tem como alvo blocos de 25 segundos na rede de testes
Nas notícias de hoje sobre a Zcash, a rede de privacidade ativou sua atualização NU7 na rede pública de testes no bloco 4.465.026, reduzindo o intervalo-alvo de 75 segundos para 25 segundos. Se os serviços mantiverem uma política de três confirmações, o tempo de espera-alvo cai de 225 para cerca de 75 segundos, mas isso continua sendo um teste na rede de testes, e não uma mudança na rede principal.
O teste usa moedas sem valor para permitir que desenvolvedores e operadores de infraestrutura ensaiem a atualização. A NU7 também redireciona 60% das taxas de transação para uma reserva de recompensas futuras, reduz as recompensas por bloco para preservar o cronograma de emissão de ZEC e desativa as transações Sprout.
O teste usa moedas sem valor para permitir que desenvolvedores e operadores de infraestrutura ensaiem a atualização. A NU7 também redireciona 60% das taxas de transação para uma reserva de recompensas futuras, reduz as recompensas por bloco para preservar o cronograma de emissão de ZEC e desativa as transações Sprout.
52

Artigo
Previsão de preço do Ethereum: liquidez do ETH cai 45% abaixo da do BTCA previsão de preço do Ethereum está em queda, já que a profundidade do livro de ordens caiu para 35–45% da do Bitcoin. O Ethereum está cotado a US$ 2.725, com alta de 1% em 24 horas, enquanto o BTC está a US$ 86.300, com alta de 1,4%. O problema não é simplesmente a menor liquidez do Ethereum: os livros do Bitcoin ganharam profundidade, enquanto os do Ethereum permaneceram estáveis.
Uma análise da CoinGecko em oito grandes corretoras centralizadas aponta que a profundidade mediana do ETH é de US$ 13–14 milhões. A profundidade mediana do Bitcoin é de US$ 29 milhões nas ofertas de compra e US$ 37 milhões nas de venda, medida a cerca de 0,15% do preço médio. A Binance lidera para ambos os ativos; a MEXC é um caso atípico acentuado, com cerca de US$ 450.000.
Previsão de preço do Ethereum: liquidez do ETH cai 45% abaixo da do BTC
A previsão de preço do Ethereum está em queda, já que a profundidade do livro de ordens caiu para 35–45% da do Bitcoin. O Ethereum está cotado a US$ 2.725, com alta de 1% em 24 horas, enquanto o BTC está a US$ 86.300, com alta de 1,4%. O problema não é simplesmente a menor liquidez do Ethereum: os livros do Bitcoin ganharam profundidade, enquanto os do Ethereum permaneceram estáveis.
Uma análise da CoinGecko em oito grandes corretoras centralizadas aponta que a profundidade mediana do ETH é de US$ 13–14 milhões. A profundidade mediana do Bitcoin é de US$ 29 milhões nas ofertas de compra e US$ 37 milhões nas de venda, medida a cerca de 0,15% do preço médio. A Binance lidera para ambos os ativos; a MEXC é um caso atípico acentuado, com cerca de US$ 450.000.
Uma análise da CoinGecko em oito grandes corretoras centralizadas aponta que a profundidade mediana do ETH é de US$ 13–14 milhões. A profundidade mediana do Bitcoin é de US$ 29 milhões nas ofertas de compra e US$ 37 milhões nas de venda, medida a cerca de 0,15% do preço médio. A Binance lidera para ambos os ativos; a MEXC é um caso atípico acentuado, com cerca de US$ 450.000.
2
Artigo
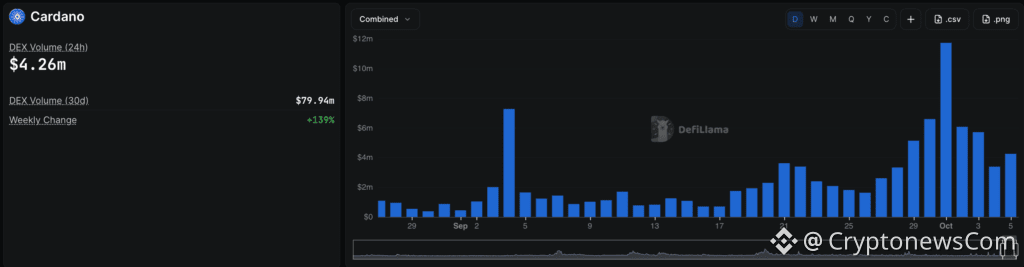
Preço da ADA dispara 11%: por que a Cardano está em alta enquanto a atividade em DEXs cai?Nas notícias de Cardano de hoje, a ADA subiu 11% e chegou a US$ 0,27 nas últimas 24 horas, registrando seu maior ganho percentual em um único dia desde 18 de setembro e elevando a capitalização de mercado da Cardano para US$ 10,2 bilhões.
A alta do preço é contraditória, já que os dados da DefiLlama mostram que o volume de DEXs da Cardano caiu de US$ 11,74 milhões em 1º de outubro para US$ 5,72 milhões em 3 de outubro, uma divergência que põe em dúvida o suporte subjacente à alta.
FONTE: DefiLlama
Notícias da Cardano: por que o momentum do preço da ADA é otimista enquanto a atividade on-chain enfraquece?
A ADA valorizou cerca de 10% em sete dias, enquanto o volume de negociação em 24 horas está em US$ 950 milhões, cerca de 1,5% do volume total de negociações de criptomoedas. Esses números abrangem as negociações de ADA em diferentes mercados; eles não medem as trocas realizadas especificamente em DEXs baseadas na Cardano.
Preço da ADA dispara 11%: por que a Cardano está em alta enquanto a atividade em DEXs cai?
Nas notícias de Cardano de hoje, a ADA subiu 11% e chegou a US$ 0,27 nas últimas 24 horas, registrando seu maior ganho percentual em um único dia desde 18 de setembro e elevando a capitalização de mercado da Cardano para US$ 10,2 bilhões.
A alta do preço é contraditória, já que os dados da DefiLlama mostram que o volume de DEXs da Cardano caiu de US$ 11,74 milhões em 1º de outubro para US$ 5,72 milhões em 3 de outubro, uma divergência que põe em dúvida o suporte subjacente à alta.
FONTE: DefiLlama
Notícias da Cardano: por que o momentum do preço da ADA é otimista enquanto a atividade on-chain enfraquece?
A ADA valorizou cerca de 10% em sete dias, enquanto o volume de negociação em 24 horas está em US$ 950 milhões, cerca de 1,5% do volume total de negociações de criptomoedas. Esses números abrangem as negociações de ADA em diferentes mercados; eles não medem as trocas realizadas especificamente em DEXs baseadas na Cardano.
A alta do preço é contraditória, já que os dados da DefiLlama mostram que o volume de DEXs da Cardano caiu de US$ 11,74 milhões em 1º de outubro para US$ 5,72 milhões em 3 de outubro, uma divergência que põe em dúvida o suporte subjacente à alta.
FONTE: DefiLlama
Notícias da Cardano: por que o momentum do preço da ADA é otimista enquanto a atividade on-chain enfraquece?
A ADA valorizou cerca de 10% em sete dias, enquanto o volume de negociação em 24 horas está em US$ 950 milhões, cerca de 1,5% do volume total de negociações de criptomoedas. Esses números abrangem as negociações de ADA em diferentes mercados; eles não medem as trocas realizadas especificamente em DEXs baseadas na Cardano.
1
2
232

Artigo
Dados da Hyperliquid já estão disponíveis no Bloomberg Terminal enquanto Trump trabalha para trazer a plataforma aos EUAOs contratos perpétuos da Hyperliquid já estão disponíveis no Bloomberg Terminal, integrando dados da exchange descentralizada a um fluxo de trabalho de dados de mercado amplamente utilizado por profissionais. Há apenas algumas horas, os contratos passaram a estar disponíveis no terminal.
A disponibilidade de dados de mercado pode facilitar a descoberta, o monitoramento e a comparação da Hyperliquid com outras plataformas por usuários profissionais, potencialmente atraindo mais atenção de analistas e incentivando pesquisas institucionais sobre criptoativos.
ENORME: os contratos perpétuos da Hyperliquid já estão disponíveis no Bloomberg Terminal.
Dados da Hyperliquid já estão disponíveis no Bloomberg Terminal enquanto Trump trabalha para trazer a plataforma aos EUA
Os contratos perpétuos da Hyperliquid já estão disponíveis no Bloomberg Terminal, integrando dados da exchange descentralizada a um fluxo de trabalho de dados de mercado amplamente utilizado por profissionais. Há apenas algumas horas, os contratos passaram a estar disponíveis no terminal.
A disponibilidade de dados de mercado pode facilitar a descoberta, o monitoramento e a comparação da Hyperliquid com outras plataformas por usuários profissionais, potencialmente atraindo mais atenção de analistas e incentivando pesquisas institucionais sobre criptoativos.
ENORME: os contratos perpétuos da Hyperliquid já estão disponíveis no Bloomberg Terminal.
A disponibilidade de dados de mercado pode facilitar a descoberta, o monitoramento e a comparação da Hyperliquid com outras plataformas por usuários profissionais, potencialmente atraindo mais atenção de analistas e incentivando pesquisas institucionais sobre criptoativos.
ENORME: os contratos perpétuos da Hyperliquid já estão disponíveis no Bloomberg Terminal.
1
510

Artigo
Previsão de preço do XRP: analista prevê que Ripple chegará a US$ 750 no próximo anoO XRP foi negociado a US$ 1,51, registrando alta de 1%, enquanto sua previsão de preço permanecia próxima ao meio de sua faixa recente. Jake Claver continua prevendo US$ 750 até o fim de 2026 ou início de 2027, uma meta que exigiria uma valorização de mais de 400 vezes em relação aos níveis atuais. O gráfico imediato oferece um teste mais útil: o XRP consegue primeiro superar a resistência em torno de US$ 1,52–US$ 1,56?
OTIMISTA
Jake Claver acabou de estabelecer uma meta de preço de US$ 750 para o $XRP — citando comentários da presidente da $Ripple, Monica Long, que disse que veremos uma adoção institucional em grande escala em 2026!#XRP #xrpnews #xrppriceprediction#xrparmy #crypto pic.twitter.com/5c20WUd6xw
Previsão de preço do XRP: analista prevê que Ripple chegará a US$ 750 no próximo ano
O XRP foi negociado a US$ 1,51, registrando alta de 1%, enquanto sua previsão de preço permanecia próxima ao meio de sua faixa recente. Jake Claver continua prevendo US$ 750 até o fim de 2026 ou início de 2027, uma meta que exigiria uma valorização de mais de 400 vezes em relação aos níveis atuais. O gráfico imediato oferece um teste mais útil: o XRP consegue primeiro superar a resistência em torno de US$ 1,52–US$ 1,56?
OTIMISTA
Jake Claver acabou de estabelecer uma meta de preço de US$ 750 para o $XRP — citando comentários da presidente da $Ripple, Monica Long, que disse que veremos uma adoção institucional em grande escala em 2026!#XRP #xrpnews #xrppriceprediction#xrparmy #crypto pic.twitter.com/5c20WUd6xw
OTIMISTA
Jake Claver acabou de estabelecer uma meta de preço de US$ 750 para o $XRP — citando comentários da presidente da $Ripple, Monica Long, que disse que veremos uma adoção institucional em grande escala em 2026!#XRP #xrpnews #xrppriceprediction#xrparmy #crypto pic.twitter.com/5c20WUd6xw
13

Artigo
S&P Global mira mercado de empréstimos em blockchain de US$ 10 bilhões com nova ferramenta de riscoA S&P Global Ratings lançou sua Avaliação de Risco de Cofres (Vault Risk Assessment, VRA), oferecendo uma avaliação prospectiva de seis riscos que poderiam prejudicar as posições dos investidores em cofres de empréstimos baseados em blockchain. A iniciativa ocorre quando os depósitos no mercado chegaram a aproximadamente US$ 10 bilhões em setembro de 2026, acima de US$ 1,5 bilhão dois anos antes.
A estrutura traz uma forma familiar de análise de risco institucional para um segmento de concessão de crédito (lending) em DeFi que cresceu rapidamente. Seu escopo é específico: ela avalia o risco relativo de deterioração (impairment), e não a atratividade do rendimento (yield) de um cofre (vault) nem a capacidade de crédito de um emissor no sentido convencional das classificações.
S&P Global mira mercado de empréstimos em blockchain de US$ 10 bilhões com nova ferramenta de risco
A S&P Global Ratings lançou sua Avaliação de Risco de Cofres (Vault Risk Assessment, VRA), oferecendo uma avaliação prospectiva de seis riscos que poderiam prejudicar as posições dos investidores em cofres de empréstimos baseados em blockchain. A iniciativa ocorre quando os depósitos no mercado chegaram a aproximadamente US$ 10 bilhões em setembro de 2026, acima de US$ 1,5 bilhão dois anos antes.
A estrutura traz uma forma familiar de análise de risco institucional para um segmento de concessão de crédito (lending) em DeFi que cresceu rapidamente. Seu escopo é específico: ela avalia o risco relativo de deterioração (impairment), e não a atratividade do rendimento (yield) de um cofre (vault) nem a capacidade de crédito de um emissor no sentido convencional das classificações.
A estrutura traz uma forma familiar de análise de risco institucional para um segmento de concessão de crédito (lending) em DeFi que cresceu rapidamente. Seu escopo é específico: ela avalia o risco relativo de deterioração (impairment), e não a atratividade do rendimento (yield) de um cofre (vault) nem a capacidade de crédito de um emissor no sentido convencional das classificações.
144

Artigo
Previsão do preço do Bitcoin: até a lua e de volta, rali até US$ 87 mil canceladoA tentativa do BTC de chegar a US$ 87.000 voltou a encontrar vendedores. O Bitcoin está sendo negociado a US$ 85.500, depois de atingir US$ 87.000, o que torna sua previsão de preço otimista. A questão principal agora é se esta é uma rejeição rotineira ou um sinal de que o rali precisa se reajustar antes de outra tentativa.
O Bitcoin chegou a ficar a apenas US$ 500 de sua máxima do fim de setembro, perto de US$ 87.400, mas depois recuou para abaixo de US$ 86.000. É o segundo rali em uma semana a estagnar perto dessa zona; o movimento da última quarta-feira até US$ 85.500 também perdeu força em poucas horas.
Previsão do preço do Bitcoin: até a lua e de volta, rali até US$ 87 mil cancelado
A tentativa do BTC de chegar a US$ 87.000 voltou a encontrar vendedores. O Bitcoin está sendo negociado a US$ 85.500, depois de atingir US$ 87.000, o que torna sua previsão de preço otimista. A questão principal agora é se esta é uma rejeição rotineira ou um sinal de que o rali precisa se reajustar antes de outra tentativa.
O Bitcoin chegou a ficar a apenas US$ 500 de sua máxima do fim de setembro, perto de US$ 87.400, mas depois recuou para abaixo de US$ 86.000. É o segundo rali em uma semana a estagnar perto dessa zona; o movimento da última quarta-feira até US$ 85.500 também perdeu força em poucas horas.
O Bitcoin chegou a ficar a apenas US$ 500 de sua máxima do fim de setembro, perto de US$ 87.400, mas depois recuou para abaixo de US$ 86.000. É o segundo rali em uma semana a estagnar perto dessa zona; o movimento da última quarta-feira até US$ 85.500 também perdeu força em poucas horas.
7

Artigo
Claude AI prevê um encerramento impressionante do ano para o XRPO Claude AI prevê que, até 1º de janeiro de 2027, o XRP USD poderia chegar a US$ 25, com uma meta de topo em rompante (blow-off top) de US$ 35, se um catalisador muito específico cair para o exército da Ripple. O XRP está atualmente sendo negociado a US$ 1,49, em alta de +0,5% nas últimas 24 horas, o que significa que ele precisaria subir aproximadamente 16,8× a partir do preço de hoje, implicando uma capitalização de mercado de cerca de US$ 1,6 trilhão, assumindo aproximadamente 65 bilhões de XRP em circulação.
Isso é enorme, mas, em um cenário real de mania cripto, não seria matematicamente impossível. O absurdo catalisador hipotético que o Claude AI mencionou é uma adoção institucional em estágio avançado.
Claude AI prevê um encerramento impressionante do ano para o XRP
O Claude AI prevê que, até 1º de janeiro de 2027, o XRP USD poderia chegar a US$ 25, com uma meta de topo em rompante (blow-off top) de US$ 35, se um catalisador muito específico cair para o exército da Ripple. O XRP está atualmente sendo negociado a US$ 1,49, em alta de +0,5% nas últimas 24 horas, o que significa que ele precisaria subir aproximadamente 16,8× a partir do preço de hoje, implicando uma capitalização de mercado de cerca de US$ 1,6 trilhão, assumindo aproximadamente 65 bilhões de XRP em circulação.
Isso é enorme, mas, em um cenário real de mania cripto, não seria matematicamente impossível. O absurdo catalisador hipotético que o Claude AI mencionou é uma adoção institucional em estágio avançado.
Isso é enorme, mas, em um cenário real de mania cripto, não seria matematicamente impossível. O absurdo catalisador hipotético que o Claude AI mencionou é uma adoção institucional em estágio avançado.
269
Artigo
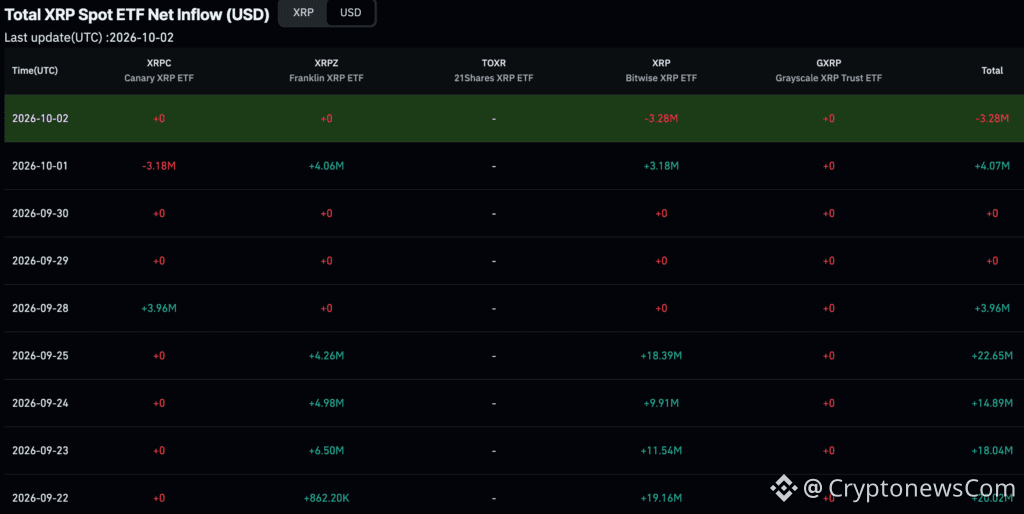
Previsão do Preço do XRP: Ripple em Faixa Entre US$ 1,50, Possível Rompimento em Breve?A previsão de preço do XRP mostra a Ripple entrando em outubro ainda negociando dentro de uma faixa ampla. O XRP está atualmente em torno de US$ 1,50, com resistência-chave entre US$ 1,45 e US$ 1,60. Se romper acima de US$ 1,60, isso pode abrir caminho para uma alta para US$ 1,65–US$ 1,70, dando aos compradores uma oportunidade de impulsionar o token acima da máxima de setembro.
Alguns níveis-chave para monitorar daqui para frente. Se o XRP cair abaixo de US$ 1,45, os próximos níveis de suporte a observar são US$ 1,40–US$ 1,42, seguidos por US$ 1,32–US$ 1,35. Uma queda mais significativa abaixo de US$ 1,27–US$ 1,30 enfraqueceria ainda mais a estrutura de preços atual.
Previsão do Preço do XRP: Ripple em Faixa Entre US$ 1,50, Possível Rompimento em Breve?
A previsão de preço do XRP mostra a Ripple entrando em outubro ainda negociando dentro de uma faixa ampla. O XRP está atualmente em torno de US$ 1,50, com resistência-chave entre US$ 1,45 e US$ 1,60. Se romper acima de US$ 1,60, isso pode abrir caminho para uma alta para US$ 1,65–US$ 1,70, dando aos compradores uma oportunidade de impulsionar o token acima da máxima de setembro.
Alguns níveis-chave para monitorar daqui para frente. Se o XRP cair abaixo de US$ 1,45, os próximos níveis de suporte a observar são US$ 1,40–US$ 1,42, seguidos por US$ 1,32–US$ 1,35. Uma queda mais significativa abaixo de US$ 1,27–US$ 1,30 enfraqueceria ainda mais a estrutura de preços atual.
Alguns níveis-chave para monitorar daqui para frente. Se o XRP cair abaixo de US$ 1,45, os próximos níveis de suporte a observar são US$ 1,40–US$ 1,42, seguidos por US$ 1,32–US$ 1,35. Uma queda mais significativa abaixo de US$ 1,27–US$ 1,30 enfraqueceria ainda mais a estrutura de preços atual.
2
391
Artigo
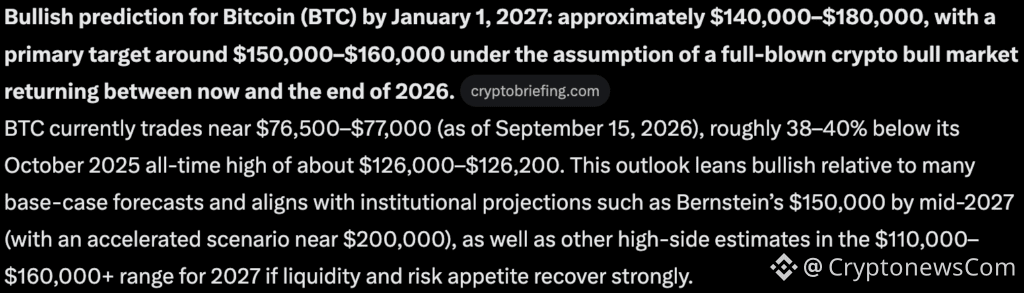
Elon Musk Grok AI prevê um desfecho selvagem de 2026 para o BitcoinO Grok AI, de Elon Musk, prevê que os próximos três meses serão incomumente decisivos, projetando que o Bitcoin poderia ter um retorno impressionante de 2x até 1º de janeiro de 2027.
Hoje (3 de outubro), o BTC/USD está sendo negociado a cerca de US$84.500, e o Grok AI afirma que, no caso de um bull market completo, ele poderia disparar para US$180.000 no melhor cenário, com um cenário base de cerca de US$150.000 a US$160.000.
FONTE: Grok AI prevê Bitcoin
Os fluxos de ETFs dão suporte a essas afirmações, com os dois dias em outubro impulsionando mais de +US$130M em fluxos positivos, elevando o total para US$58Bi desde o lançamento em novembro de 2024.
Elon Musk Grok AI prevê um desfecho selvagem de 2026 para o Bitcoin
O Grok AI, de Elon Musk, prevê que os próximos três meses serão incomumente decisivos, projetando que o Bitcoin poderia ter um retorno impressionante de 2x até 1º de janeiro de 2027.
Hoje (3 de outubro), o BTC/USD está sendo negociado a cerca de US$84.500, e o Grok AI afirma que, no caso de um bull market completo, ele poderia disparar para US$180.000 no melhor cenário, com um cenário base de cerca de US$150.000 a US$160.000.
FONTE: Grok AI prevê Bitcoin
Os fluxos de ETFs dão suporte a essas afirmações, com os dois dias em outubro impulsionando mais de +US$130M em fluxos positivos, elevando o total para US$58Bi desde o lançamento em novembro de 2024.
Hoje (3 de outubro), o BTC/USD está sendo negociado a cerca de US$84.500, e o Grok AI afirma que, no caso de um bull market completo, ele poderia disparar para US$180.000 no melhor cenário, com um cenário base de cerca de US$150.000 a US$160.000.
FONTE: Grok AI prevê Bitcoin
Os fluxos de ETFs dão suporte a essas afirmações, com os dois dias em outubro impulsionando mais de +US$130M em fluxos positivos, elevando o total para US$58Bi desde o lançamento em novembro de 2024.
2
326
Ver tradução
XRP Price, $300M ETF Demand, and 45% Q3 Supply OverhangXRP price rose more than 45% in Q3 as U.S. spot XRP ETFs attracted about $307.9 million, yet the token entered October near $1.50 after repeated failures around $1.70. Cumulative ETF inflows approached $1.8 billion, but that buying has not established a higher clearing price.
The price response shows that fund demand has not yet been strong enough to clear the supply available as XRP rallies. Buyers can support the market while sellers continue to meet bids, leaving the price near $1.50 rather than forcing a break through resistance.
Xrp (XRP)
24h7d30d1yAll time
Seven-day altcoin inflow transactions to exchanges reportedly reached their highest level since October 2025, while CryptoQuant described the increase in deposits as broad rather than concentrated among a few large wallets.
Exchange transfers are not proof of a sale. They do, however, increase the amount of tokens that could become sell-side liquidity, and this matters when traders assess crypto market supply. After a gain above 45% in a quarter, some holders may have an incentive to realize profits near previous highs, even as ETF buyers continue accumulating.
That dynamic can absorb fresh demand without immediately pushing price lower. It can also prevent demand from producing the breakout bulls want until willing sellers become less plentiful. Broader XRP exchange inventory and supply signals provide useful context, but they do not establish who sold into any specific rally.
XRP ETF Flows, Coinglass
XRP ETFs recorded no net flow on September 29 and 30 after stronger buying earlier in the month. One flat session does not overturn the quarterly inflow picture, but it is a reminder that marginal demand can vary. Cumulative flows alone cannot show whether buyers are currently strong enough to absorb each new wave of supply.
Earn $50 and Enter $300K Prize Draw on EdgeXThe $1.54–$1.70 Zone Is the Test for Bulls
The first technical hurdle is an hourly close above $1.54, identified in the primary report as an initial breakout confirmation. A move through that level could open a roughly 10% advance toward $1.70, but it would not by itself confirm that the wider supply overhang has cleared.
XRP has struggled to sustain advances through the mid-$1.50s, and late-September attempts above $1.60 faded. The late-August swing high near $1.70 is the more consequential resistance zone: a sustained move beyond it would suggest that demand is absorbing enough available supply to alter the market structure, rather than merely producing another short-lived rally.
The first support to watch sits around $1.48–$1.50, close to where XRP entered October. A failure to hold that area after another rejection would put the recent base under pressure. Derivatives positioning and leverage can also shape how a move develops, although they do not identify the spot seller; XRP derivatives positioning and funding are part of that market context.
The levels frame the current XRP price analysis without requiring a forecast:
Discover: The Best Token Presales
What Does XRP Need for a Price Break?
If XRP closes above $1.54 on an hourly basis and sustains momentum through the mid-$1.50s, the late-August high near $1.70 becomes the next test. Reclaiming and holding above that zone would support the view that ETF and spot demand are finally overwhelming the supply meeting rallies.
If price rejects again and loses $1.48–$1.50, the alternative interpretation gains weight: sellers remain willing to supply XRP even with fund demand in the background. That would not prove ETF buyers have left or identify the sellers. It would show that the available bid has not yet cleared the market at higher prices.
Ripple’s association with XRP does not change the immediate chart question. The relevant evidence is whether buying can absorb the supply at the levels where previous attempts stalled. Until XRP establishes itself above $1.70, cumulative inflows remain a demand signal, not confirmation that a breakout is imminent.
Trade XRP on Bybit and Get a Chance to Win Our $1,000 USDT Airdrop
The post XRP Price, $300M ETF Demand, and 45% Q3 Supply Overhang appeared first on Cryptonews.
XRP Price, $300M ETF Demand, and 45% Q3 Supply Overhang
XRP price rose more than 45% in Q3 as U.S. spot XRP ETFs attracted about $307.9 million, yet the token entered October near $1.50 after repeated failures around $1.70. Cumulative ETF inflows approached $1.8 billion, but that buying has not established a higher clearing price.
The price response shows that fund demand has not yet been strong enough to clear the supply available as XRP rallies. Buyers can support the market while sellers continue to meet bids, leaving the price near $1.50 rather than forcing a break through resistance.
Xrp (XRP)
24h7d30d1yAll time
Seven-day altcoin inflow transactions to exchanges reportedly reached their highest level since October 2025, while CryptoQuant described the increase in deposits as broad rather than concentrated among a few large wallets.
Exchange transfers are not proof of a sale. They do, however, increase the amount of tokens that could become sell-side liquidity, and this matters when traders assess crypto market supply. After a gain above 45% in a quarter, some holders may have an incentive to realize profits near previous highs, even as ETF buyers continue accumulating.
That dynamic can absorb fresh demand without immediately pushing price lower. It can also prevent demand from producing the breakout bulls want until willing sellers become less plentiful. Broader XRP exchange inventory and supply signals provide useful context, but they do not establish who sold into any specific rally.
XRP ETF Flows, Coinglass
XRP ETFs recorded no net flow on September 29 and 30 after stronger buying earlier in the month. One flat session does not overturn the quarterly inflow picture, but it is a reminder that marginal demand can vary. Cumulative flows alone cannot show whether buyers are currently strong enough to absorb each new wave of supply.
Earn $50 and Enter $300K Prize Draw on EdgeXThe $1.54–$1.70 Zone Is the Test for Bulls
The first technical hurdle is an hourly close above $1.54, identified in the primary report as an initial breakout confirmation. A move through that level could open a roughly 10% advance toward $1.70, but it would not by itself confirm that the wider supply overhang has cleared.
XRP has struggled to sustain advances through the mid-$1.50s, and late-September attempts above $1.60 faded. The late-August swing high near $1.70 is the more consequential resistance zone: a sustained move beyond it would suggest that demand is absorbing enough available supply to alter the market structure, rather than merely producing another short-lived rally.
The first support to watch sits around $1.48–$1.50, close to where XRP entered October. A failure to hold that area after another rejection would put the recent base under pressure. Derivatives positioning and leverage can also shape how a move develops, although they do not identify the spot seller; XRP derivatives positioning and funding are part of that market context.
The levels frame the current XRP price analysis without requiring a forecast:
Discover: The Best Token Presales
What Does XRP Need for a Price Break?
If XRP closes above $1.54 on an hourly basis and sustains momentum through the mid-$1.50s, the late-August high near $1.70 becomes the next test. Reclaiming and holding above that zone would support the view that ETF and spot demand are finally overwhelming the supply meeting rallies.
If price rejects again and loses $1.48–$1.50, the alternative interpretation gains weight: sellers remain willing to supply XRP even with fund demand in the background. That would not prove ETF buyers have left or identify the sellers. It would show that the available bid has not yet cleared the market at higher prices.
Ripple’s association with XRP does not change the immediate chart question. The relevant evidence is whether buying can absorb the supply at the levels where previous attempts stalled. Until XRP establishes itself above $1.70, cumulative inflows remain a demand signal, not confirmation that a breakout is imminent.
Trade XRP on Bybit and Get a Chance to Win Our $1,000 USDT Airdrop
The post XRP Price, $300M ETF Demand, and 45% Q3 Supply Overhang appeared first on Cryptonews.
The price response shows that fund demand has not yet been strong enough to clear the supply available as XRP rallies. Buyers can support the market while sellers continue to meet bids, leaving the price near $1.50 rather than forcing a break through resistance.
Xrp (XRP)
24h7d30d1yAll time
Seven-day altcoin inflow transactions to exchanges reportedly reached their highest level since October 2025, while CryptoQuant described the increase in deposits as broad rather than concentrated among a few large wallets.
Exchange transfers are not proof of a sale. They do, however, increase the amount of tokens that could become sell-side liquidity, and this matters when traders assess crypto market supply. After a gain above 45% in a quarter, some holders may have an incentive to realize profits near previous highs, even as ETF buyers continue accumulating.
That dynamic can absorb fresh demand without immediately pushing price lower. It can also prevent demand from producing the breakout bulls want until willing sellers become less plentiful. Broader XRP exchange inventory and supply signals provide useful context, but they do not establish who sold into any specific rally.
XRP ETF Flows, Coinglass
XRP ETFs recorded no net flow on September 29 and 30 after stronger buying earlier in the month. One flat session does not overturn the quarterly inflow picture, but it is a reminder that marginal demand can vary. Cumulative flows alone cannot show whether buyers are currently strong enough to absorb each new wave of supply.
Earn $50 and Enter $300K Prize Draw on EdgeXThe $1.54–$1.70 Zone Is the Test for Bulls
The first technical hurdle is an hourly close above $1.54, identified in the primary report as an initial breakout confirmation. A move through that level could open a roughly 10% advance toward $1.70, but it would not by itself confirm that the wider supply overhang has cleared.
XRP has struggled to sustain advances through the mid-$1.50s, and late-September attempts above $1.60 faded. The late-August swing high near $1.70 is the more consequential resistance zone: a sustained move beyond it would suggest that demand is absorbing enough available supply to alter the market structure, rather than merely producing another short-lived rally.
The first support to watch sits around $1.48–$1.50, close to where XRP entered October. A failure to hold that area after another rejection would put the recent base under pressure. Derivatives positioning and leverage can also shape how a move develops, although they do not identify the spot seller; XRP derivatives positioning and funding are part of that market context.
The levels frame the current XRP price analysis without requiring a forecast:
Discover: The Best Token Presales
What Does XRP Need for a Price Break?
If XRP closes above $1.54 on an hourly basis and sustains momentum through the mid-$1.50s, the late-August high near $1.70 becomes the next test. Reclaiming and holding above that zone would support the view that ETF and spot demand are finally overwhelming the supply meeting rallies.
If price rejects again and loses $1.48–$1.50, the alternative interpretation gains weight: sellers remain willing to supply XRP even with fund demand in the background. That would not prove ETF buyers have left or identify the sellers. It would show that the available bid has not yet cleared the market at higher prices.
Ripple’s association with XRP does not change the immediate chart question. The relevant evidence is whether buying can absorb the supply at the levels where previous attempts stalled. Until XRP establishes itself above $1.70, cumulative inflows remain a demand signal, not confirmation that a breakout is imminent.
Trade XRP on Bybit and Get a Chance to Win Our $1,000 USDT Airdrop
The post XRP Price, $300M ETF Demand, and 45% Q3 Supply Overhang appeared first on Cryptonews.
34
Artigo
Ações Tokenizadas, Direitos dos Investidores e seu Papel na CriptoAções tokenizadas poderiam dar a investidores nativos de cripto acesso à exposição acionária por meio de plataformas de cripto, mas um token que acompanha o preço de uma ação não é automaticamente uma ação. O argumento da diversificação depende de os detentores receberem direitos legais genuínos, se os ativos ficam em estruturas de custódia reguladas e se os mercados mantêm liquidez confiável.
O cenário do mercado mudou. O rendimento dos Treasury dos EUA de cinco anos subiu acima de 5% em setembro pela primeira vez desde 2007, e o Federal Reserve elevou sua faixa-alvo em 25 pontos-base em 16 de setembro. Rendimentos mais altos oferecem aos investidores uma alternativa mais competitiva aos ativos de risco, tornando as comparações entre ações, cripto e dívida do governo mais nítidas.
Ações Tokenizadas, Direitos dos Investidores e seu Papel na Cripto
Ações tokenizadas poderiam dar a investidores nativos de cripto acesso à exposição acionária por meio de plataformas de cripto, mas um token que acompanha o preço de uma ação não é automaticamente uma ação. O argumento da diversificação depende de os detentores receberem direitos legais genuínos, se os ativos ficam em estruturas de custódia reguladas e se os mercados mantêm liquidez confiável.
O cenário do mercado mudou. O rendimento dos Treasury dos EUA de cinco anos subiu acima de 5% em setembro pela primeira vez desde 2007, e o Federal Reserve elevou sua faixa-alvo em 25 pontos-base em 16 de setembro. Rendimentos mais altos oferecem aos investidores uma alternativa mais competitiva aos ativos de risco, tornando as comparações entre ações, cripto e dívida do governo mais nítidas.
O cenário do mercado mudou. O rendimento dos Treasury dos EUA de cinco anos subiu acima de 5% em setembro pela primeira vez desde 2007, e o Federal Reserve elevou sua faixa-alvo em 25 pontos-base em 16 de setembro. Rendimentos mais altos oferecem aos investidores uma alternativa mais competitiva aos ativos de risco, tornando as comparações entre ações, cripto e dívida do governo mais nítidas.
15
Inicia sessão para explorar mais conteúdos
Junta-te a utilizadores de criptomoedas de todo o mundo na Binance Square
⚡️ Obtém informações úteis e recentes sobre criptomoedas.
💬 Com a confiança da maior exchange de criptomoedas do mundo.
👍 Descobre perspetivas reais de criadores verificados.
E-mail/Número de telefone
Tópicos em Tendência
BinanceLaunchesBinanceIntelligence
62,862 visualizações
827 a discutir
🚨 A BINANCE ACABOU DE INTEGRAR IA DIRETAMENTE NA EXCHANGE — E ISTO PODE MUDAR A FORMA COMO OS INVESTIDORES DE RETALHO NEGOCIAM.
A Binance lançou oficialmente a Binance Intelligence, uma nova camada de IA integrada no ecossistema Binance. Combina três produtos:
Binance AI para utilizadores do dia a dia,
Binance AI Pro para fluxos de trabalho de negociação automatizados,
e Agent OS para programadores que criam agentes financeiros.
O que deve interessar aos traders?
A Binance AI pode apresentar resumos do mercado, alertas inteligentes, resumos de lucros e perdas (PnL) e informações personalizadas, enquanto a AI Pro foi concebida para transformar uma ideia de negociação escrita em linguagem simples num fluxo de trabalho de estratégia visual.
Isto significa que a próxima fase da concorrência entre exchanges talvez já não seja:
taxas mais baixas vs. maior liquidez.
Pode passar a ser:
quem oferece aos traders a melhor camada de execução com IA.
Se a Binance Intelligence realmente levar a uma maior atividade dos utilizadores, a estratégias automatizadas e a uma frequência de negociação mais elevada, fique de olho primeiro na $BNB.
Adoção da IA ↑
→ envolvimento com a Binance ↑
→ atividade de negociação ↑
→ narrativa do ecossistema ganha força.
O catalisador que acompanharia agora:
lançamento global + lançamento da AI Pro + adoção mensurável pelos utilizadores.
Porque quando a IA deixa de apenas dizer o que está a acontecer no mercado…
…e começa a ajudar a construir a própria operação?
É aí que isto se torna muito mais do que apenas mais um chatbot. 👀
#binancelaunchesbinanceintelligence #EvernorthXRPTreasuryCompletesSPACMerger #ADAGains10%Above$0.27 #ETHUp70%InQ3ButLiquidityFalls #EthStakingExitQueueHits2026High
KimHotbae
·21 gostos
·28.8k visualizações
StriveBuys2000BTCFor$169M
170 visualizações
31 a discutir
EvernorthXRPTreasuryCompletesSPACMerger
52,003 visualizações
596 a discutir