
FItraders
109 Publicações
FItraders
Denunciar
Bloquear Utilizador
Hello 👋 WHO IM I
78 A seguir
85 Seguidores
75 Gostaram
Publicações
Tudo
Cotações
Vídeos
·
--
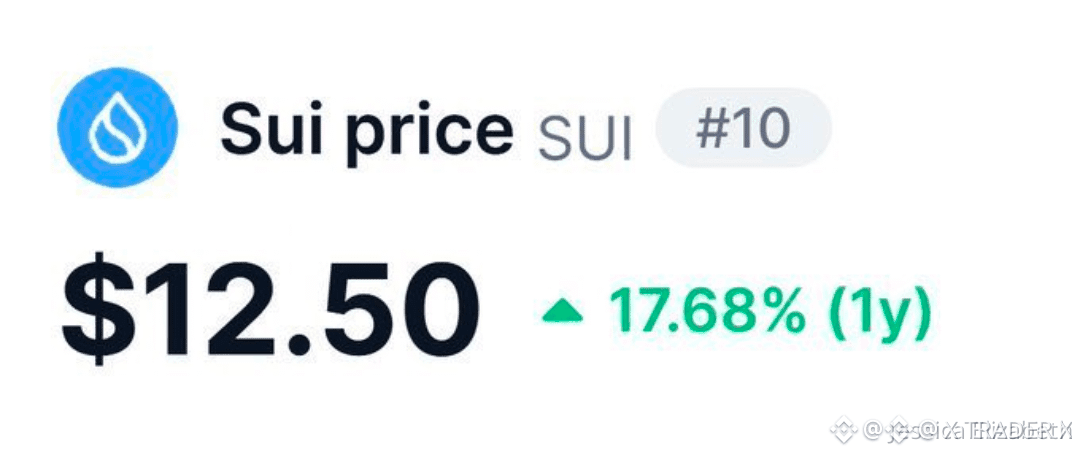
A imagem mostra SUI com preço de US$ 12,50 e ganho de 17,68% em 1 ano. Eu não consigo verificar se esse preço está atual apenas pela imagem, então é melhor não basear uma decisão de investimento somente nisso.
SUI é considerada por muitos investidores como um projeto cripto forte por causa de vários fatores:
Blockchain rápida e escalável: A Sui usa uma arquitetura baseada em objetos e processamento paralelo de transações, o que permite alto desempenho e baixas taxas.
Ecossistema em crescimento: Mais desenvolvedores estão construindo DeFi, jogos, NFTs e outras aplicações na Sui, o que pode aumentar o uso da rede.
Apoio forte: O projeto foi criado pela Mysten Labs, cujos fundadores anteriormente trabalharam no projeto de blockchain Diem da Meta.
Linguagem de programação Move: A Sui usa a linguagem Move, criada para melhorar a segurança dos contratos inteligentes e reduzir certos tipos de falhas.
Interesse institucional e de varejo: À medida que a adoção cresce, a SUI tem recebido mais atenção de exchanges, desenvolvedores e investidores.
No entanto, também existem riscos importantes:
Os mercados de cripto são altamente voláteis, e a SUI pode passar por grandes oscilações de preço.
Desbloqueios de tokens podem aumentar a pressão de venda se mais moedas entrarem em circulação.
Ela enfrenta uma concorrência forte de blockchains como Solana, Ethereum, Aptos e outras.
Se o crescimento do ecossistema desacelerar, a demanda pelo token pode enfraquecer.
Se você está investindo para os próximos 1–3 anos, a SUI é frequentemente vista como um dos projetos de blockchain Layer-1 mais fortes. Ainda assim, em geral é mais sábio diversificar em vez de colocar todo o seu dinheiro em uma única moeda.
Se seu objetivo é ter o crescimento máximo no ciclo de mercado atual, eu também posso .
#SUIUSDT
A imagem mostra SUI com preço de US$ 12,50 e ganho de 17,68% em 1 ano. Eu não consigo verificar se esse preço está atual apenas pela imagem, então é melhor não basear uma decisão de investimento somente nisso.
SUI é considerada por muitos investidores como um projeto cripto forte por causa de vários fatores:
Blockchain rápida e escalável: A Sui usa uma arquitetura baseada em objetos e processamento paralelo de transações, o que permite alto desempenho e baixas taxas.
Ecossistema em crescimento: Mais desenvolvedores estão construindo DeFi, jogos, NFTs e outras aplicações na Sui, o que pode aumentar o uso da rede.
Apoio forte: O projeto foi criado pela Mysten Labs, cujos fundadores anteriormente trabalharam no projeto de blockchain Diem da Meta.
Linguagem de programação Move: A Sui usa a linguagem Move, criada para melhorar a segurança dos contratos inteligentes e reduzir certos tipos de falhas.
Interesse institucional e de varejo: À medida que a adoção cresce, a SUI tem recebido mais atenção de exchanges, desenvolvedores e investidores.
No entanto, também existem riscos importantes:
Os mercados de cripto são altamente voláteis, e a SUI pode passar por grandes oscilações de preço.
Desbloqueios de tokens podem aumentar a pressão de venda se mais moedas entrarem em circulação.
Ela enfrenta uma concorrência forte de blockchains como Solana, Ethereum, Aptos e outras.
Se o crescimento do ecossistema desacelerar, a demanda pelo token pode enfraquecer.
Se você está investindo para os próximos 1–3 anos, a SUI é frequentemente vista como um dos projetos de blockchain Layer-1 mais fortes. Ainda assim, em geral é mais sábio diversificar em vez de colocar todo o seu dinheiro em uma única moeda.
Se seu objetivo é ter o crescimento máximo no ciclo de mercado atual, eu também posso .
#SUIUSDT
SUI é considerada por muitos investidores como um projeto cripto forte por causa de vários fatores:
Blockchain rápida e escalável: A Sui usa uma arquitetura baseada em objetos e processamento paralelo de transações, o que permite alto desempenho e baixas taxas.
Ecossistema em crescimento: Mais desenvolvedores estão construindo DeFi, jogos, NFTs e outras aplicações na Sui, o que pode aumentar o uso da rede.
Apoio forte: O projeto foi criado pela Mysten Labs, cujos fundadores anteriormente trabalharam no projeto de blockchain Diem da Meta.
Linguagem de programação Move: A Sui usa a linguagem Move, criada para melhorar a segurança dos contratos inteligentes e reduzir certos tipos de falhas.
Interesse institucional e de varejo: À medida que a adoção cresce, a SUI tem recebido mais atenção de exchanges, desenvolvedores e investidores.
No entanto, também existem riscos importantes:
Os mercados de cripto são altamente voláteis, e a SUI pode passar por grandes oscilações de preço.
Desbloqueios de tokens podem aumentar a pressão de venda se mais moedas entrarem em circulação.
Ela enfrenta uma concorrência forte de blockchains como Solana, Ethereum, Aptos e outras.
Se o crescimento do ecossistema desacelerar, a demanda pelo token pode enfraquecer.
Se você está investindo para os próximos 1–3 anos, a SUI é frequentemente vista como um dos projetos de blockchain Layer-1 mais fortes. Ainda assim, em geral é mais sábio diversificar em vez de colocar todo o seu dinheiro em uma única moeda.
Se seu objetivo é ter o crescimento máximo no ciclo de mercado atual, eu também posso .
#SUIUSDT
72
·
--
CONCLUÍDO com ✅👍
CONCLUÍDO com ✅👍
FItraders
·
--
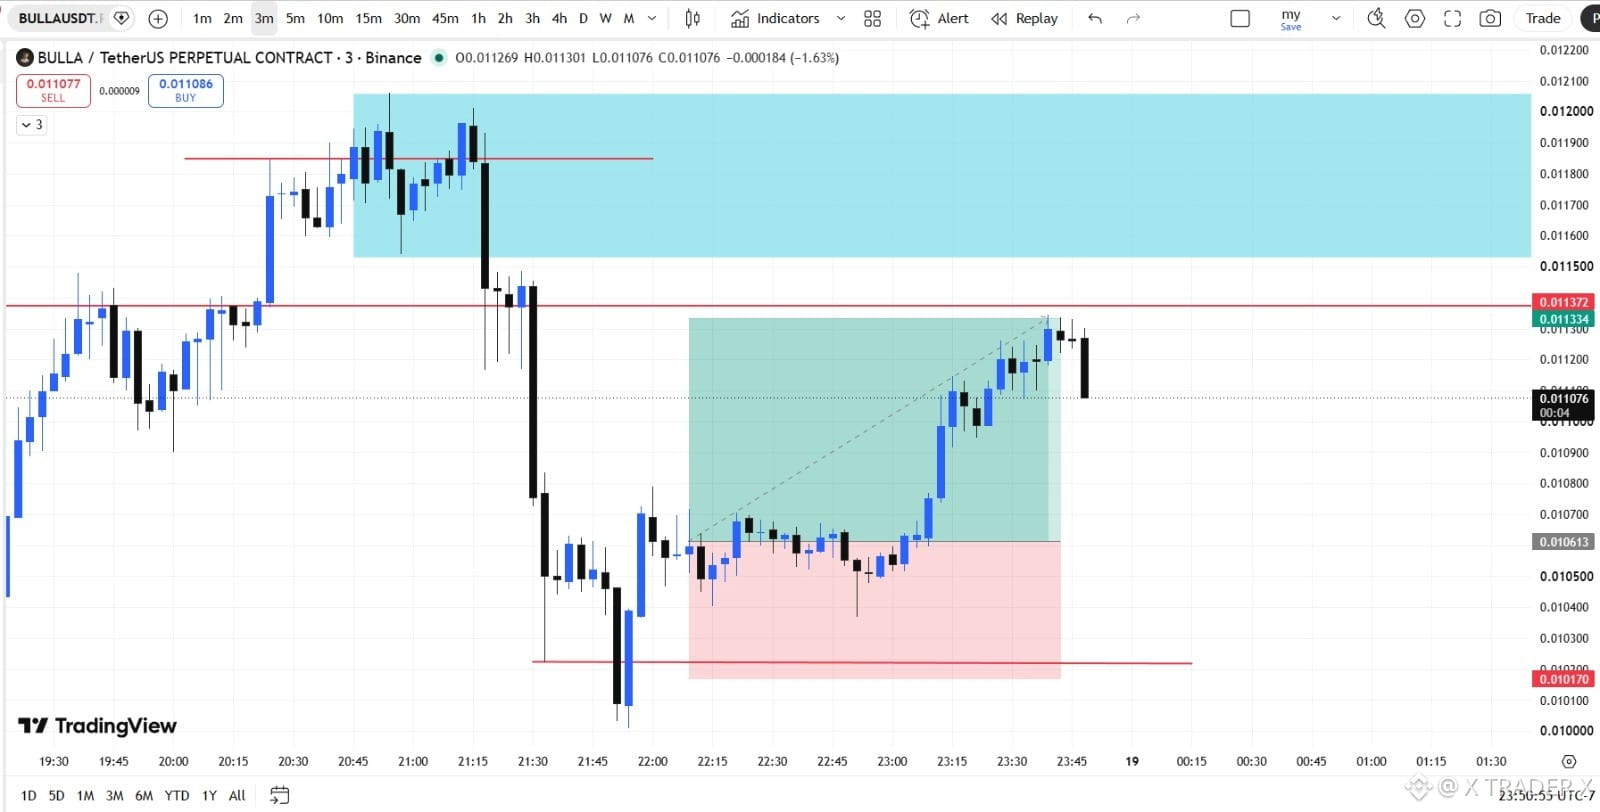
#BULLA/USDT Análise de Negociação: Recuperação em Alta Após uma Venda Forte
69
·
--
#BULLA/USDT Análise de Negociação: Recuperação em Alta Após uma Venda Forte
#BULLA/USDT Análise de Negociação: Recuperação em Alta Após uma Venda Forte
1
74
·
--
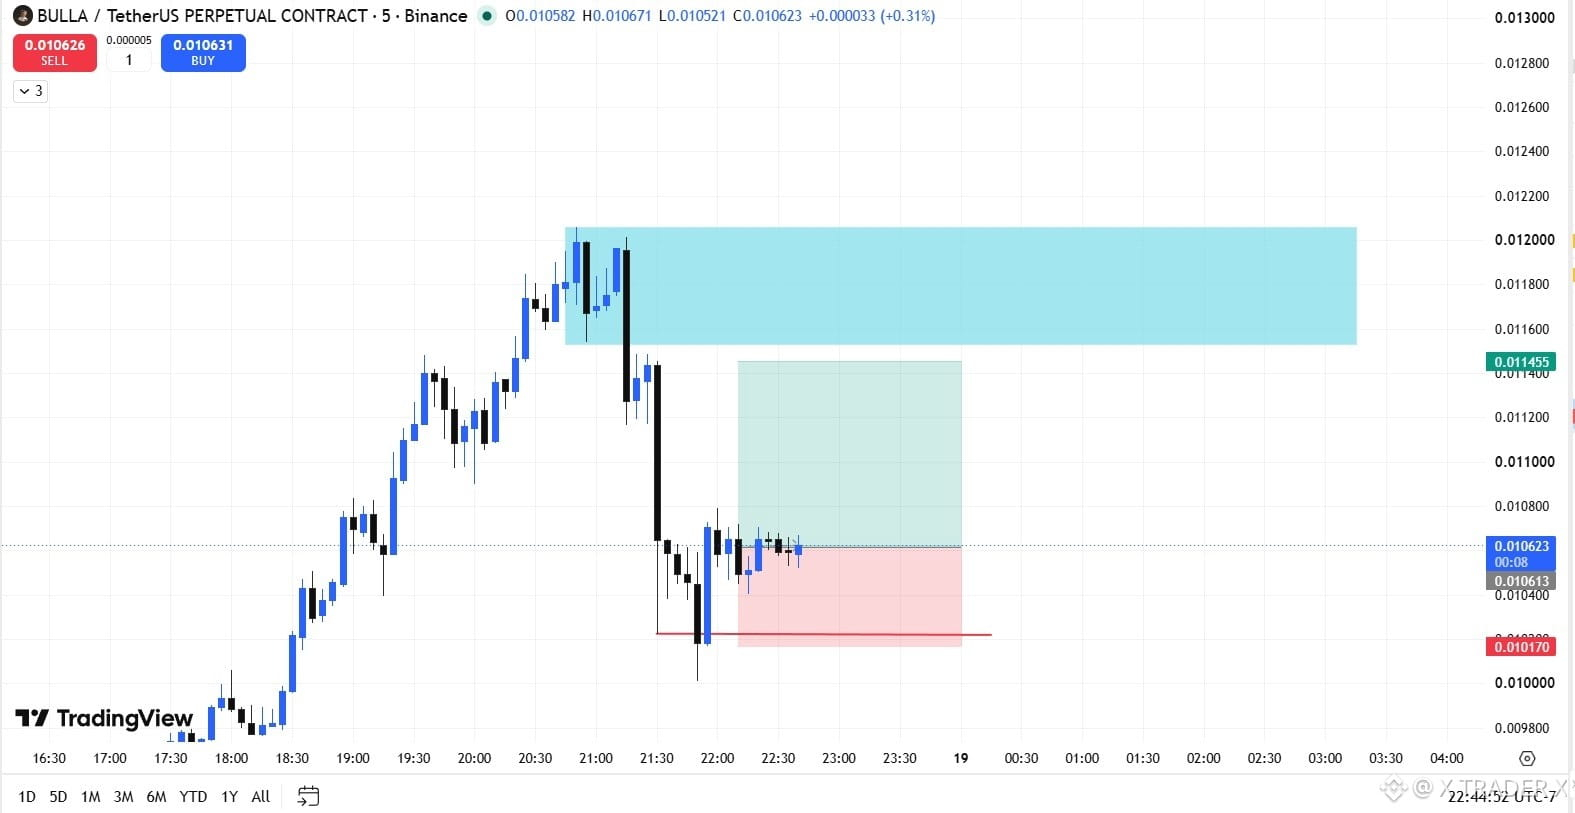
Análise de Negociação de BULLA/USDT: Recuperação Bullish Após uma Venda AgressivaO gráfico de 5 minutos de BULLA/USDT (Contrato Perpétuo na Binance) ilustra um exemplo clássico de volatilidade do mercado seguida por estabilização do preço. Após uma forte alta (rali) bullish, o mercado sofreu uma venda agressiva antes de encontrar suporte e entrar em uma fase de consolidação. Os traders podem usar essa estrutura para identificar possíveis oportunidades de negociação, gerindo o risco de forma eficaz.
## Visão geral do mercado
Inicialmente, BULLA/USDT apresentou forte impulso de compra, com velas consecutivas bullish empurrando o preço para aproximadamente 0,0120 USDT. Essa tendência de alta demonstrou que os compradores estavam firmemente no controle e conseguiram criar topos mais altos e fundos mais altos.
Análise de Negociação de BULLA/USDT: Recuperação Bullish Após uma Venda Agressiva
O gráfico de 5 minutos de BULLA/USDT (Contrato Perpétuo na Binance) ilustra um exemplo clássico de volatilidade do mercado seguida por estabilização do preço. Após uma forte alta (rali) bullish, o mercado sofreu uma venda agressiva antes de encontrar suporte e entrar em uma fase de consolidação. Os traders podem usar essa estrutura para identificar possíveis oportunidades de negociação, gerindo o risco de forma eficaz.
## Visão geral do mercado
Inicialmente, BULLA/USDT apresentou forte impulso de compra, com velas consecutivas bullish empurrando o preço para aproximadamente 0,0120 USDT. Essa tendência de alta demonstrou que os compradores estavam firmemente no controle e conseguiram criar topos mais altos e fundos mais altos.
## Visão geral do mercado
Inicialmente, BULLA/USDT apresentou forte impulso de compra, com velas consecutivas bullish empurrando o preço para aproximadamente 0,0120 USDT. Essa tendência de alta demonstrou que os compradores estavam firmemente no controle e conseguiram criar topos mais altos e fundos mais altos.
117
·
--
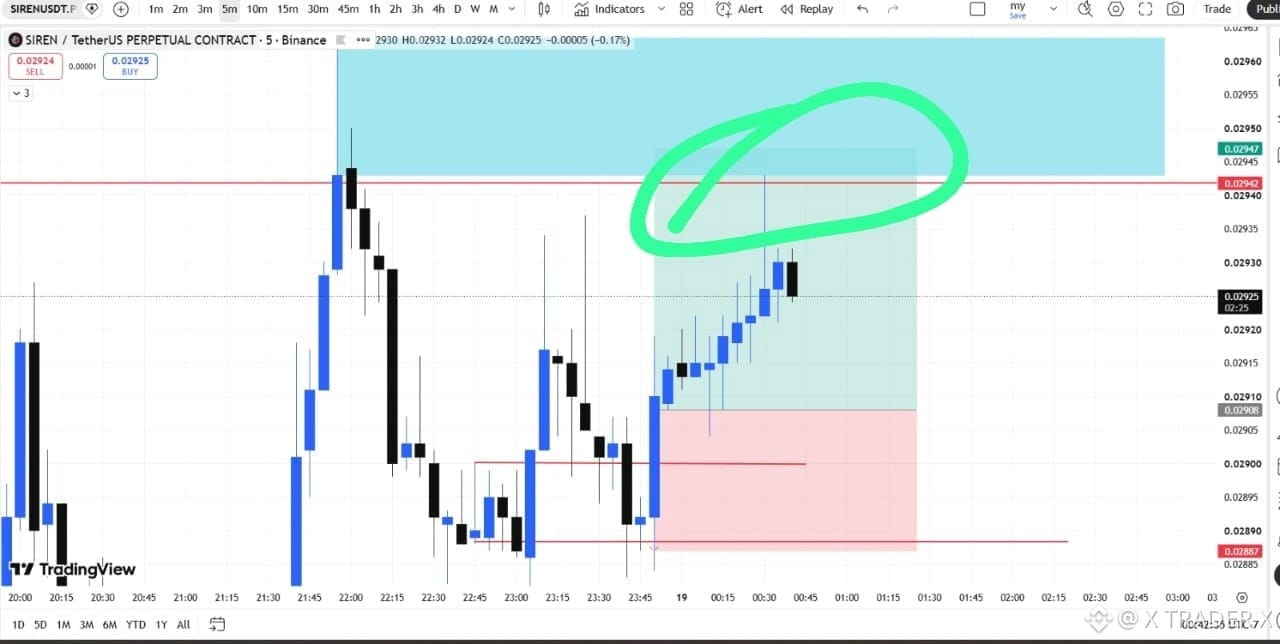
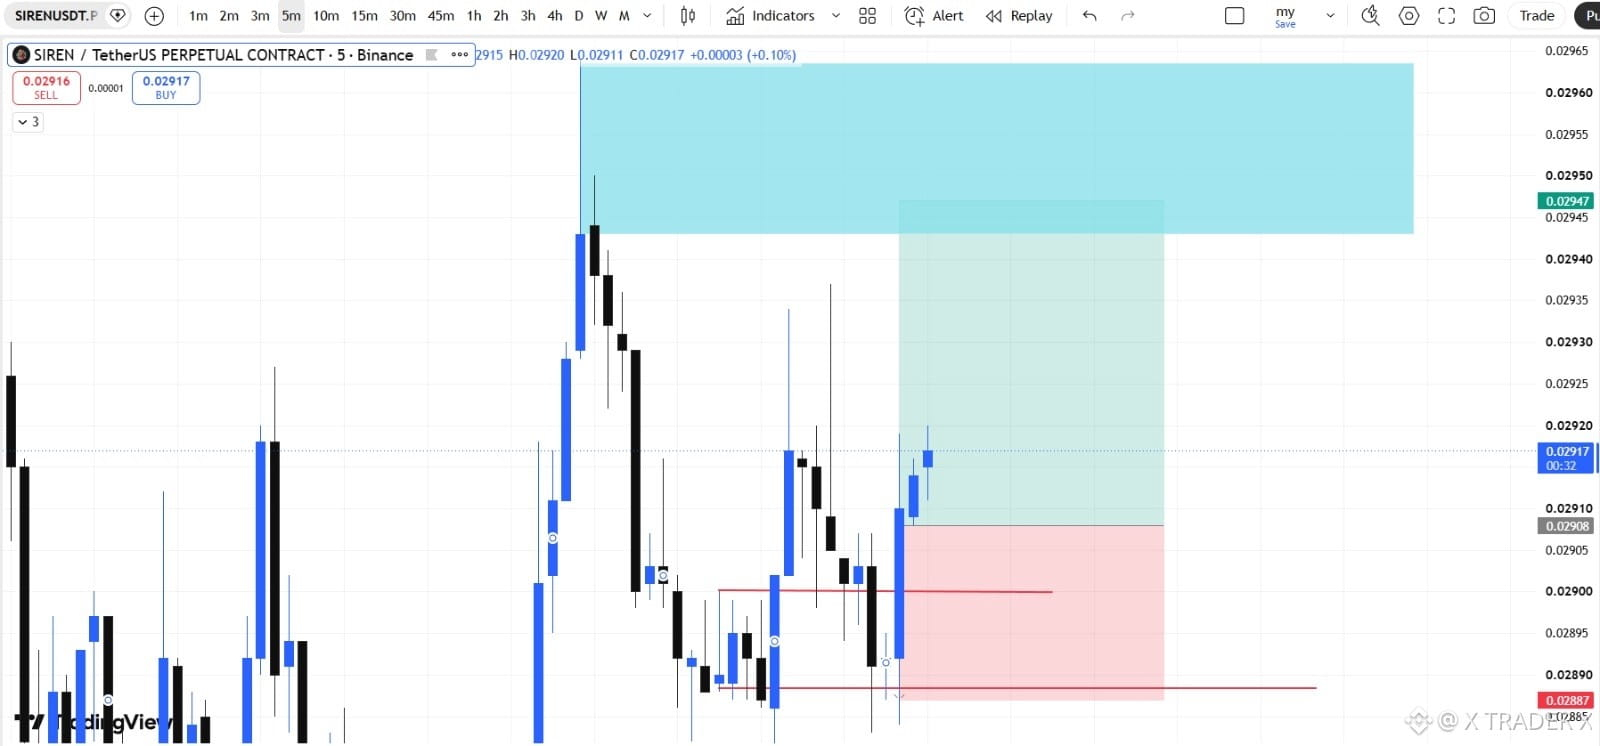
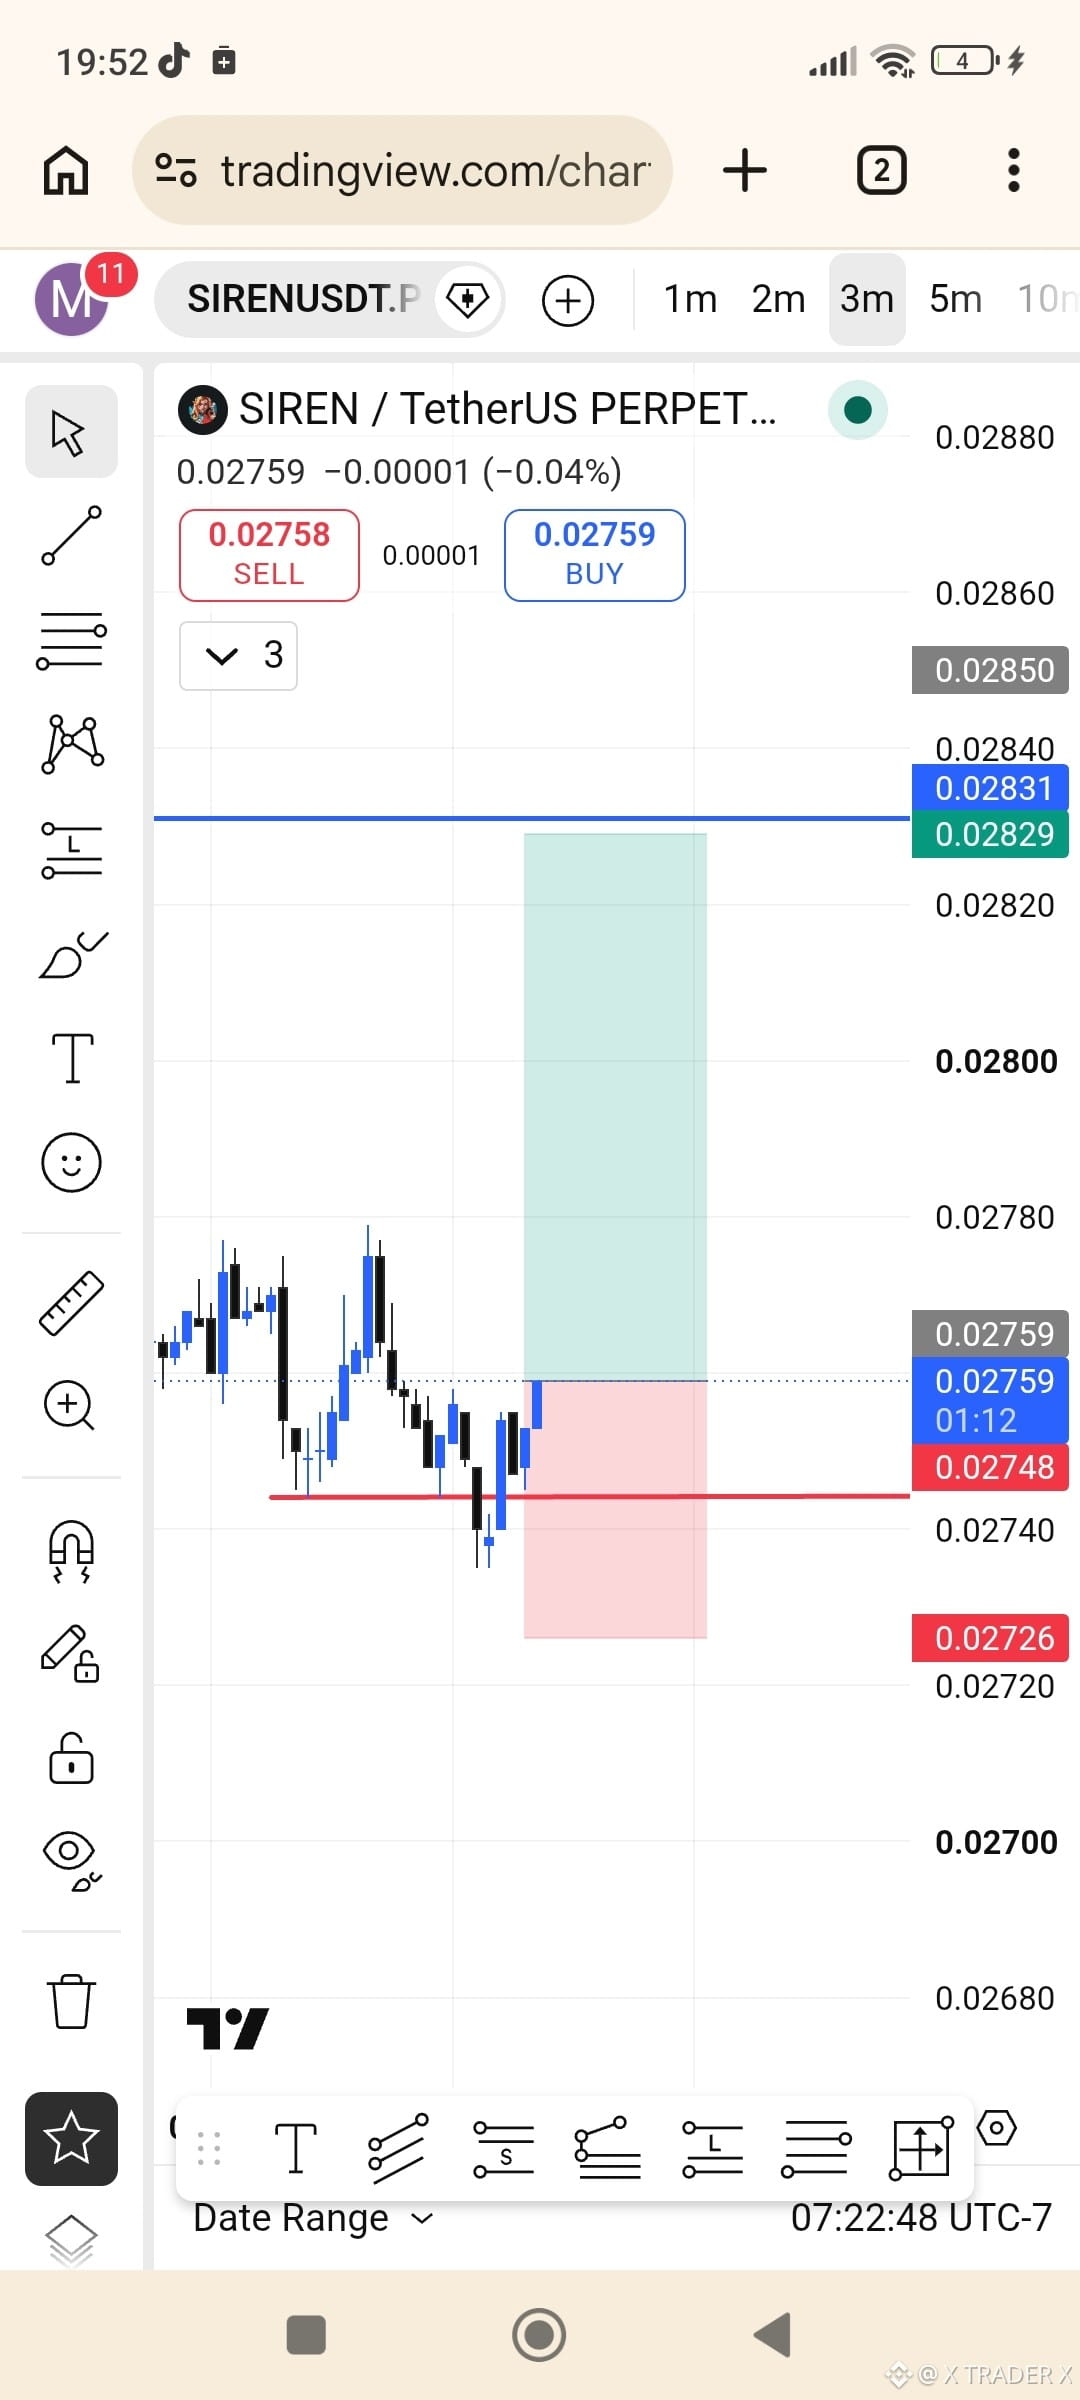
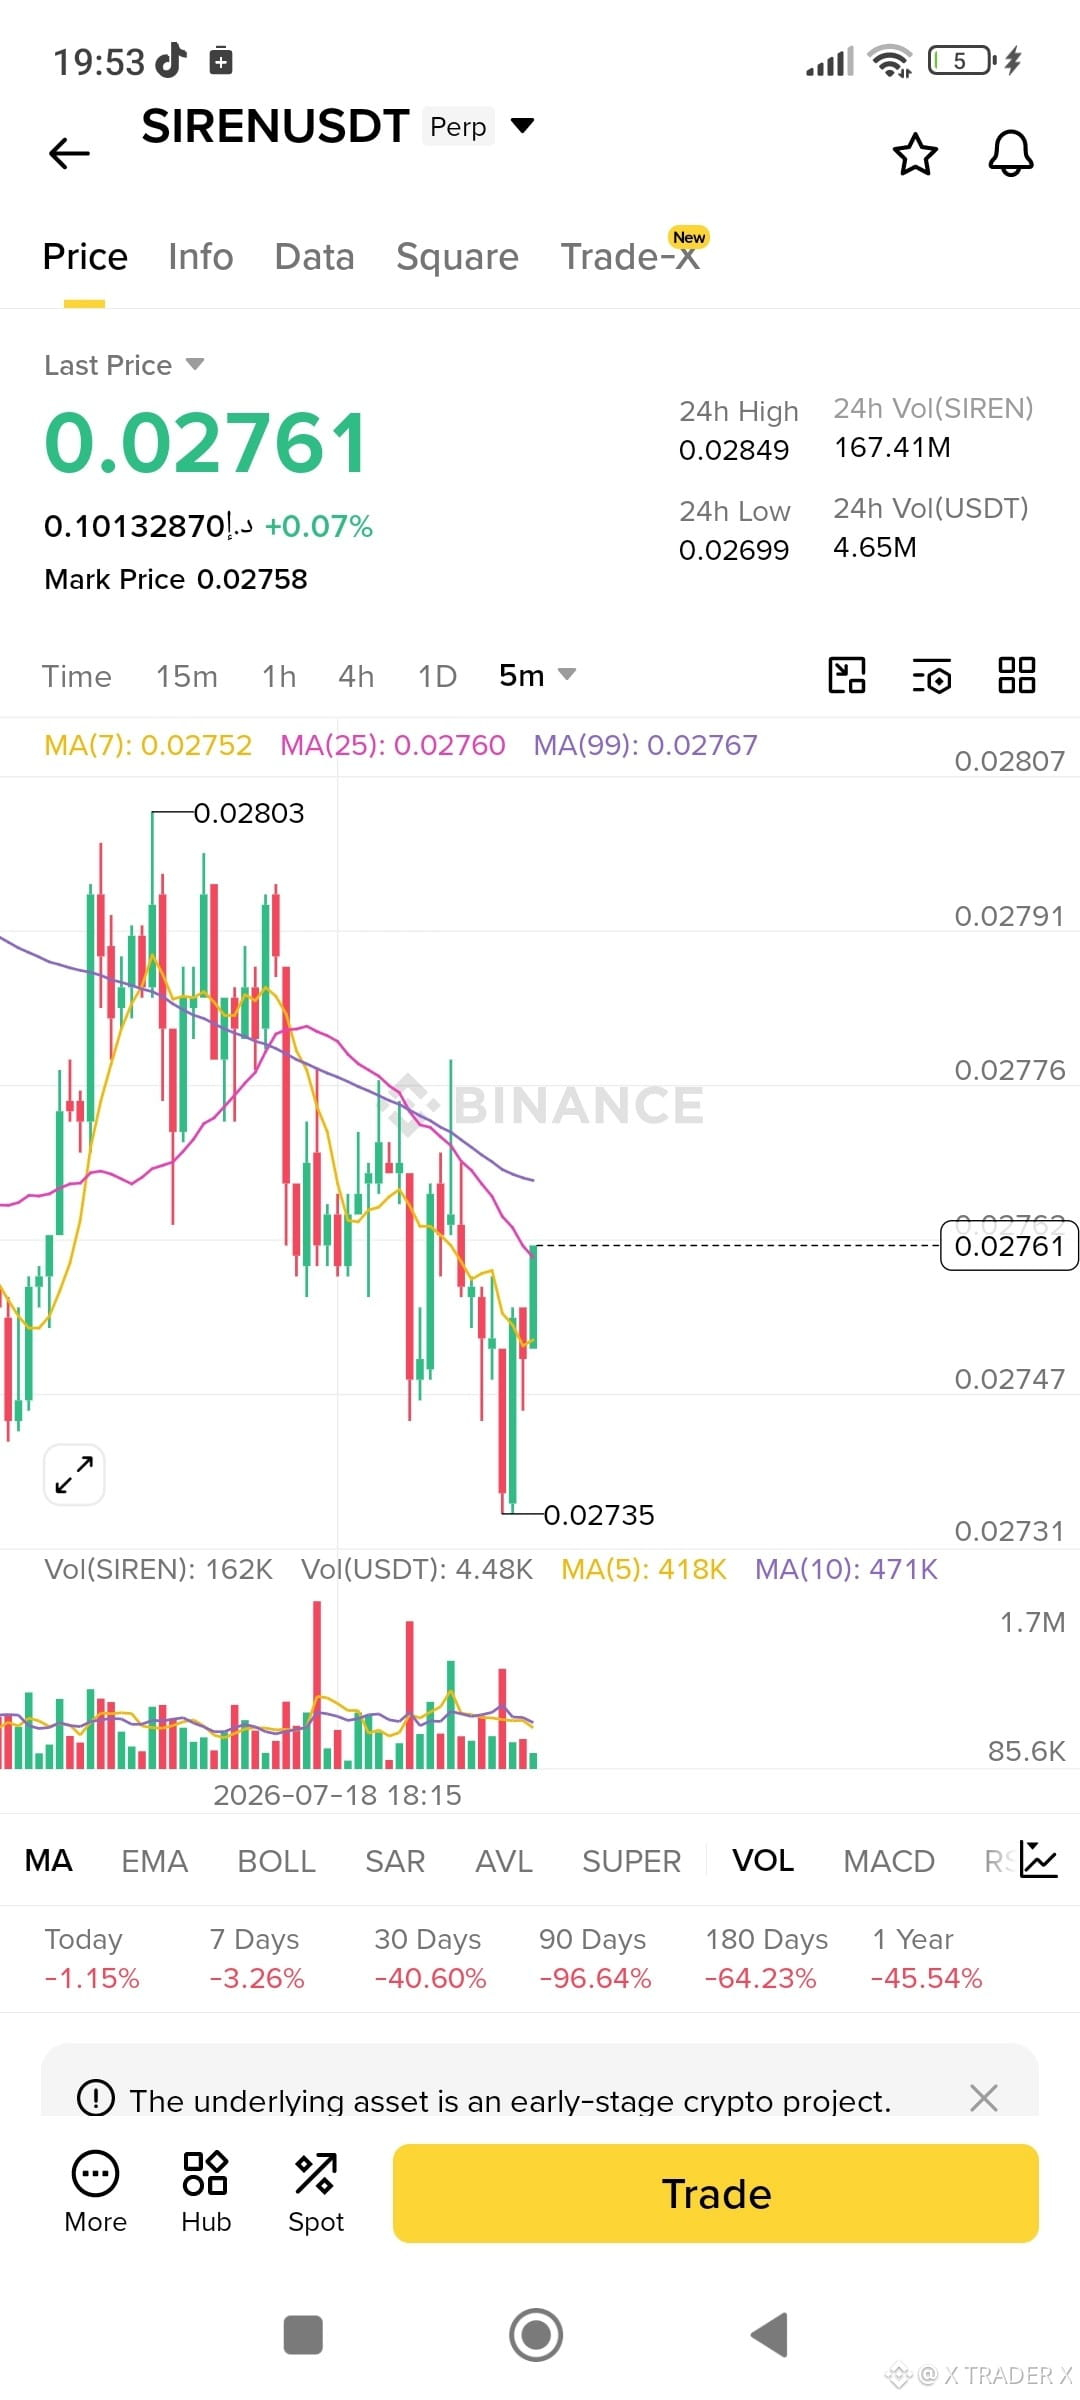
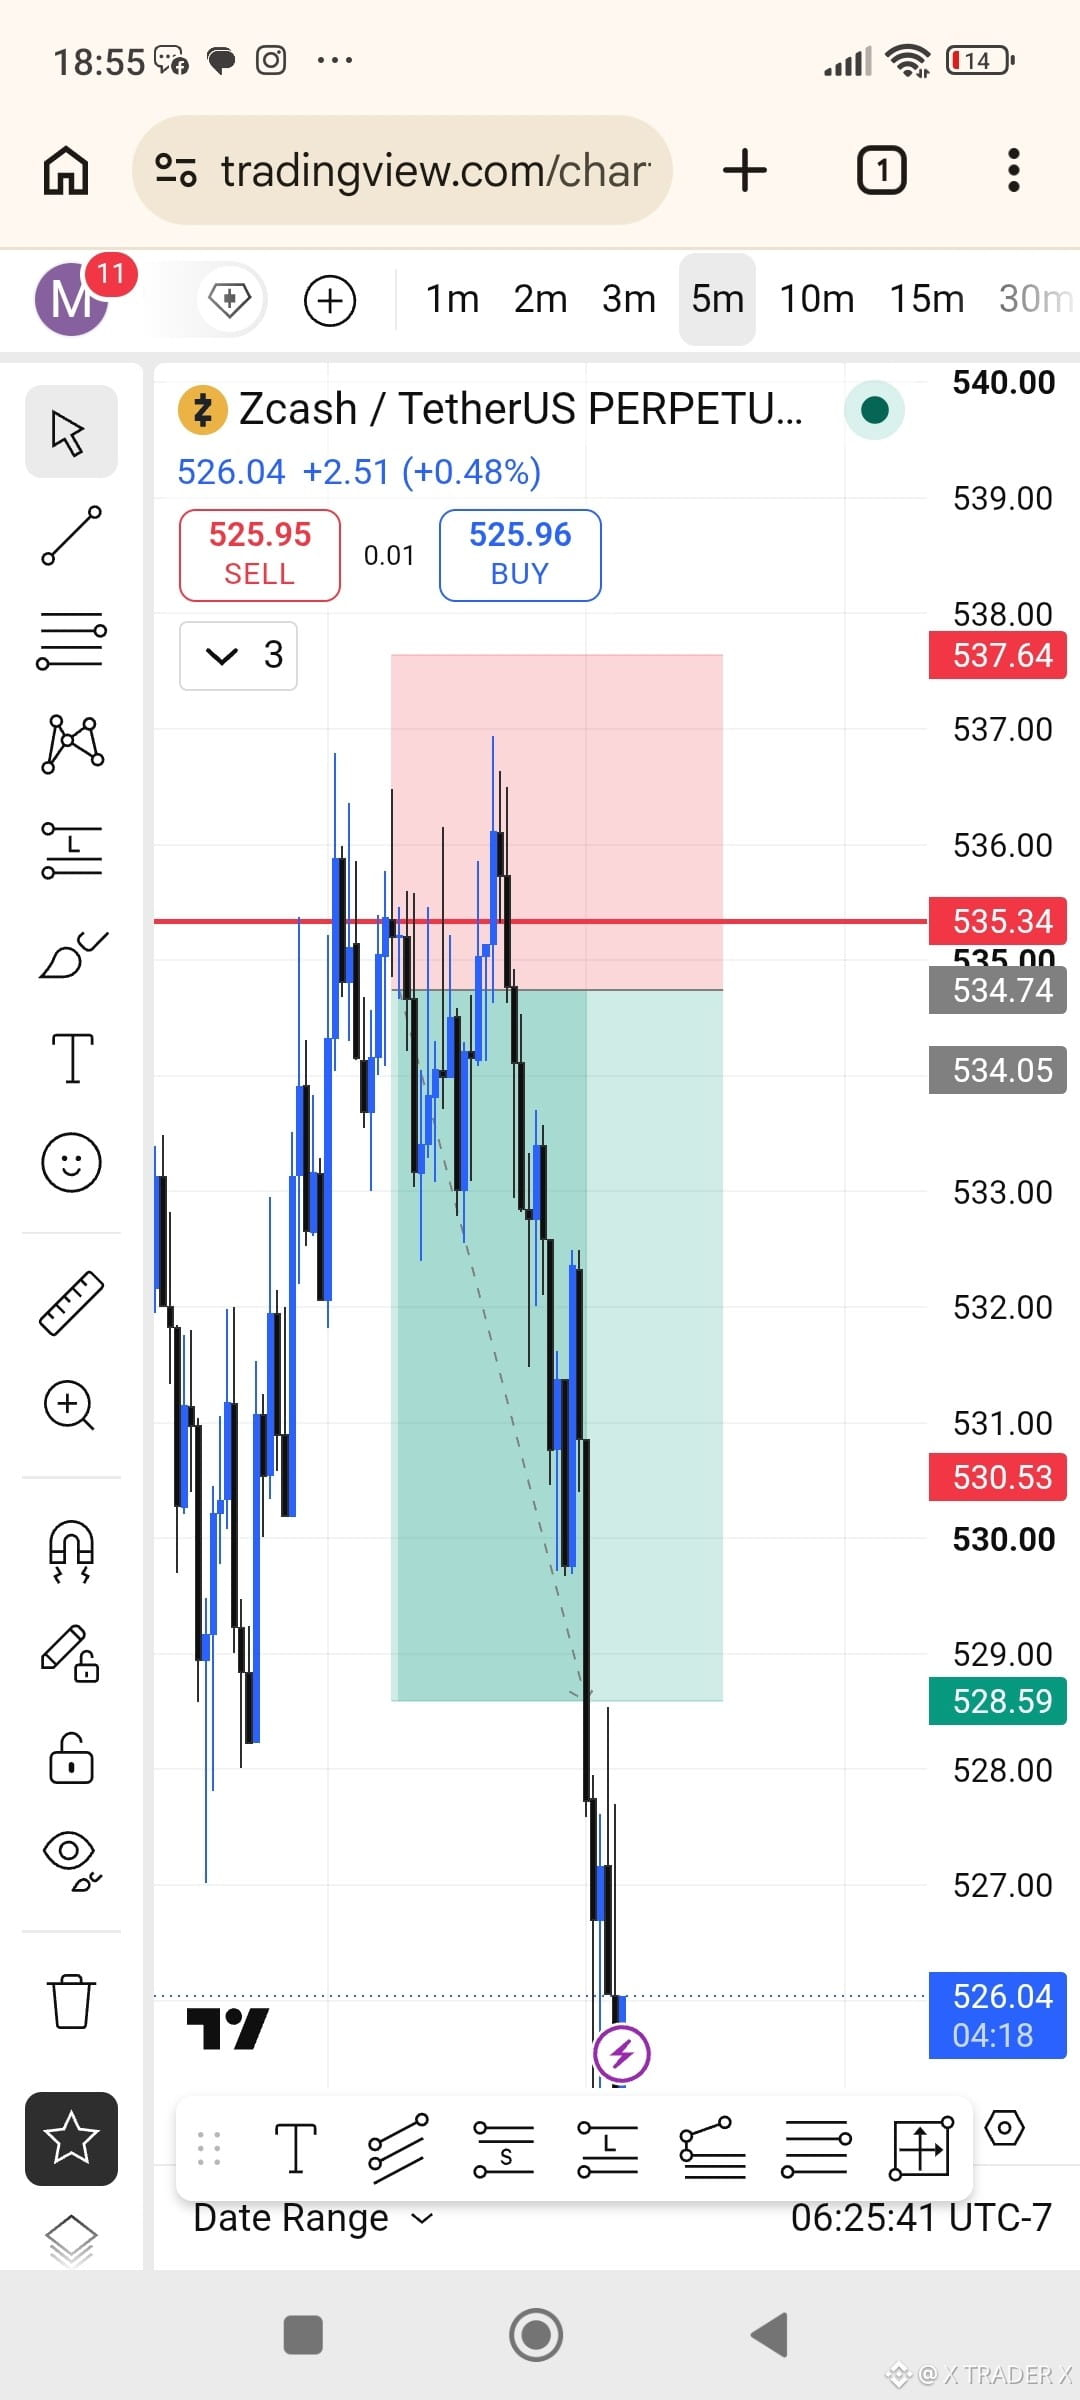
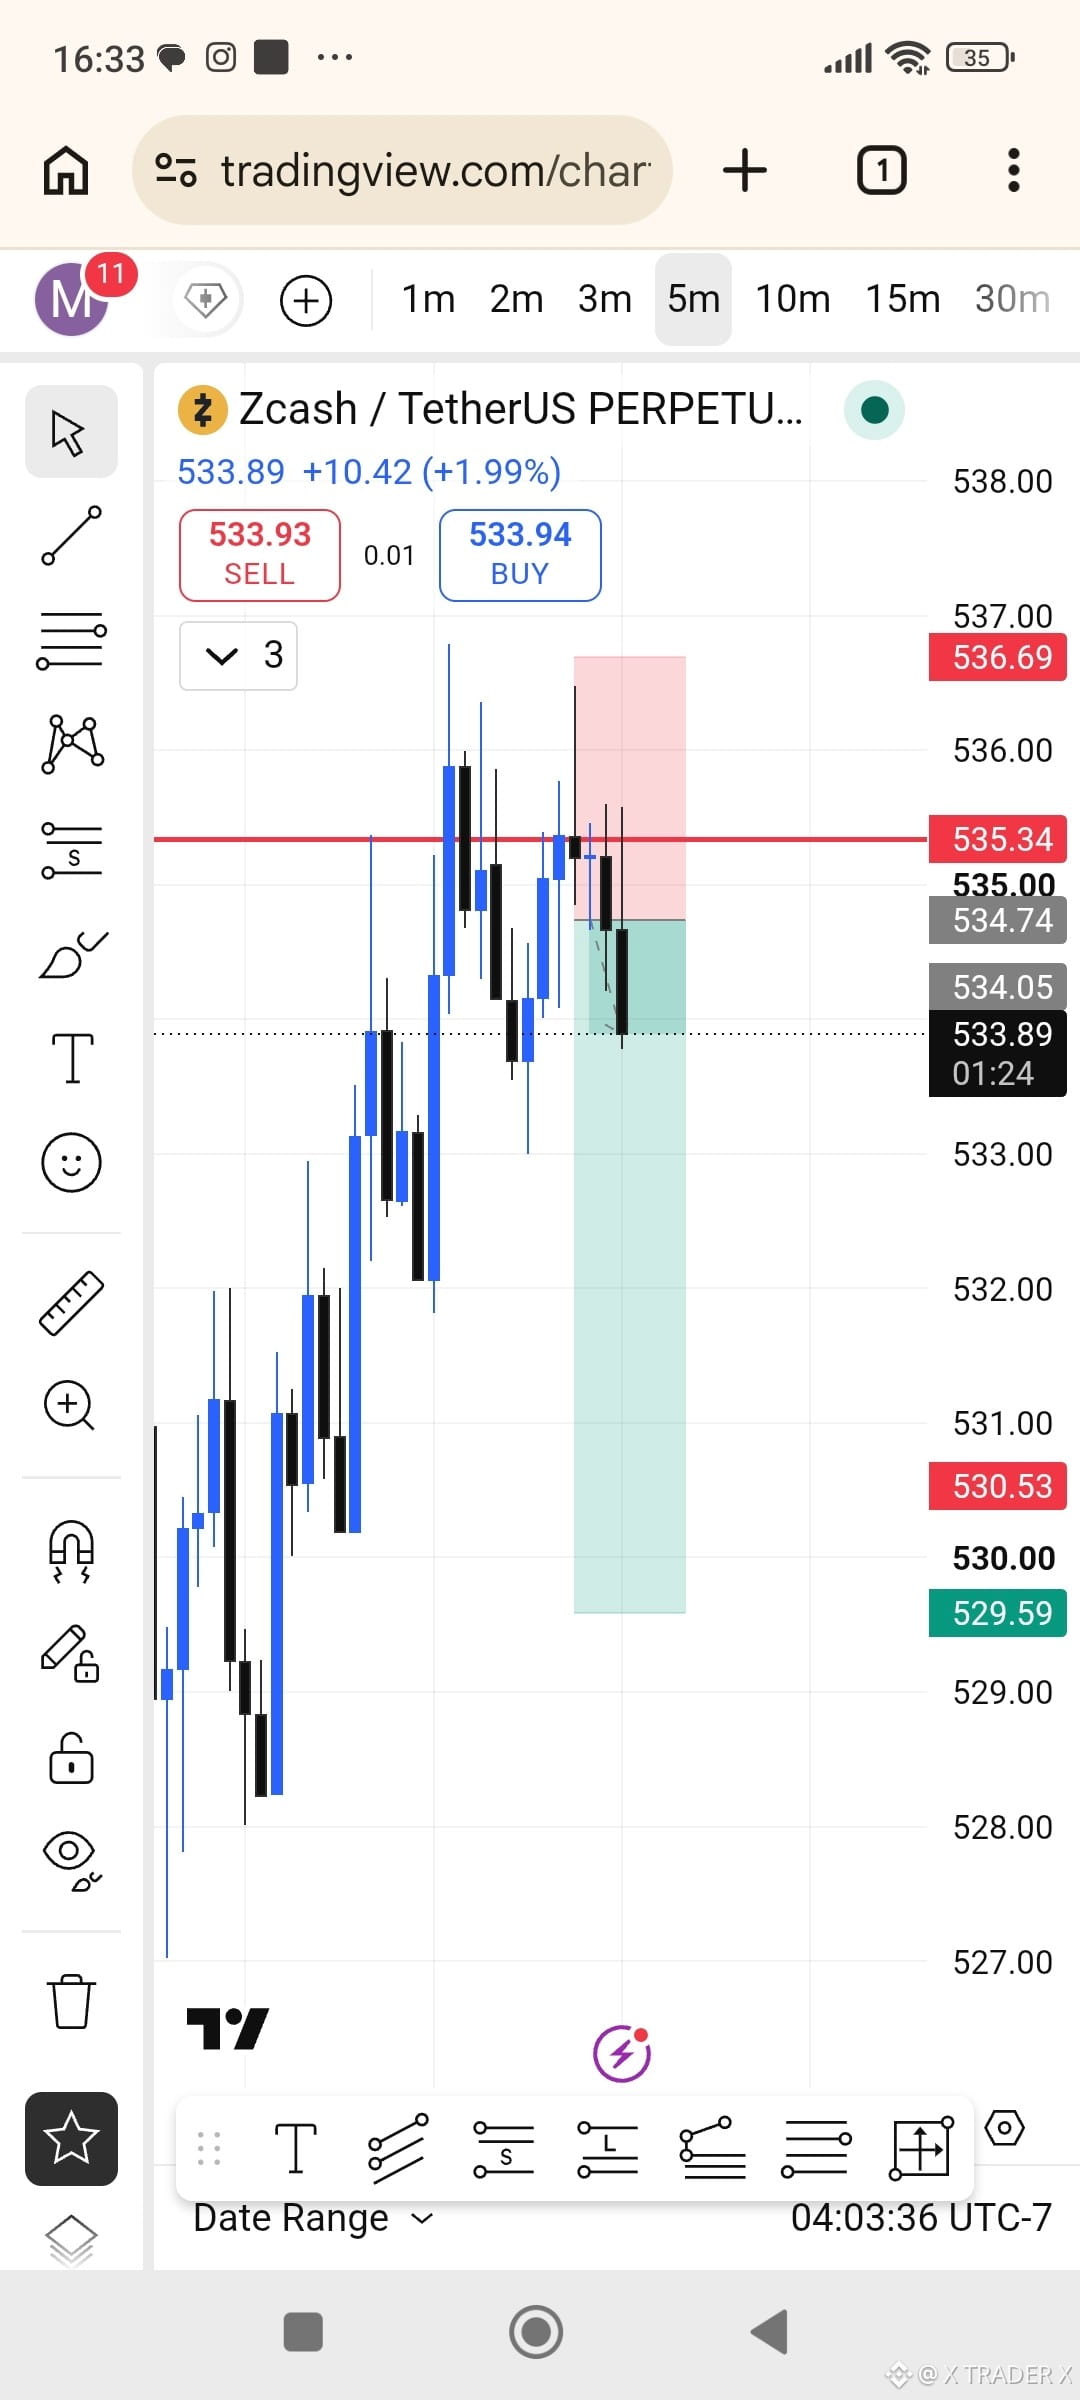
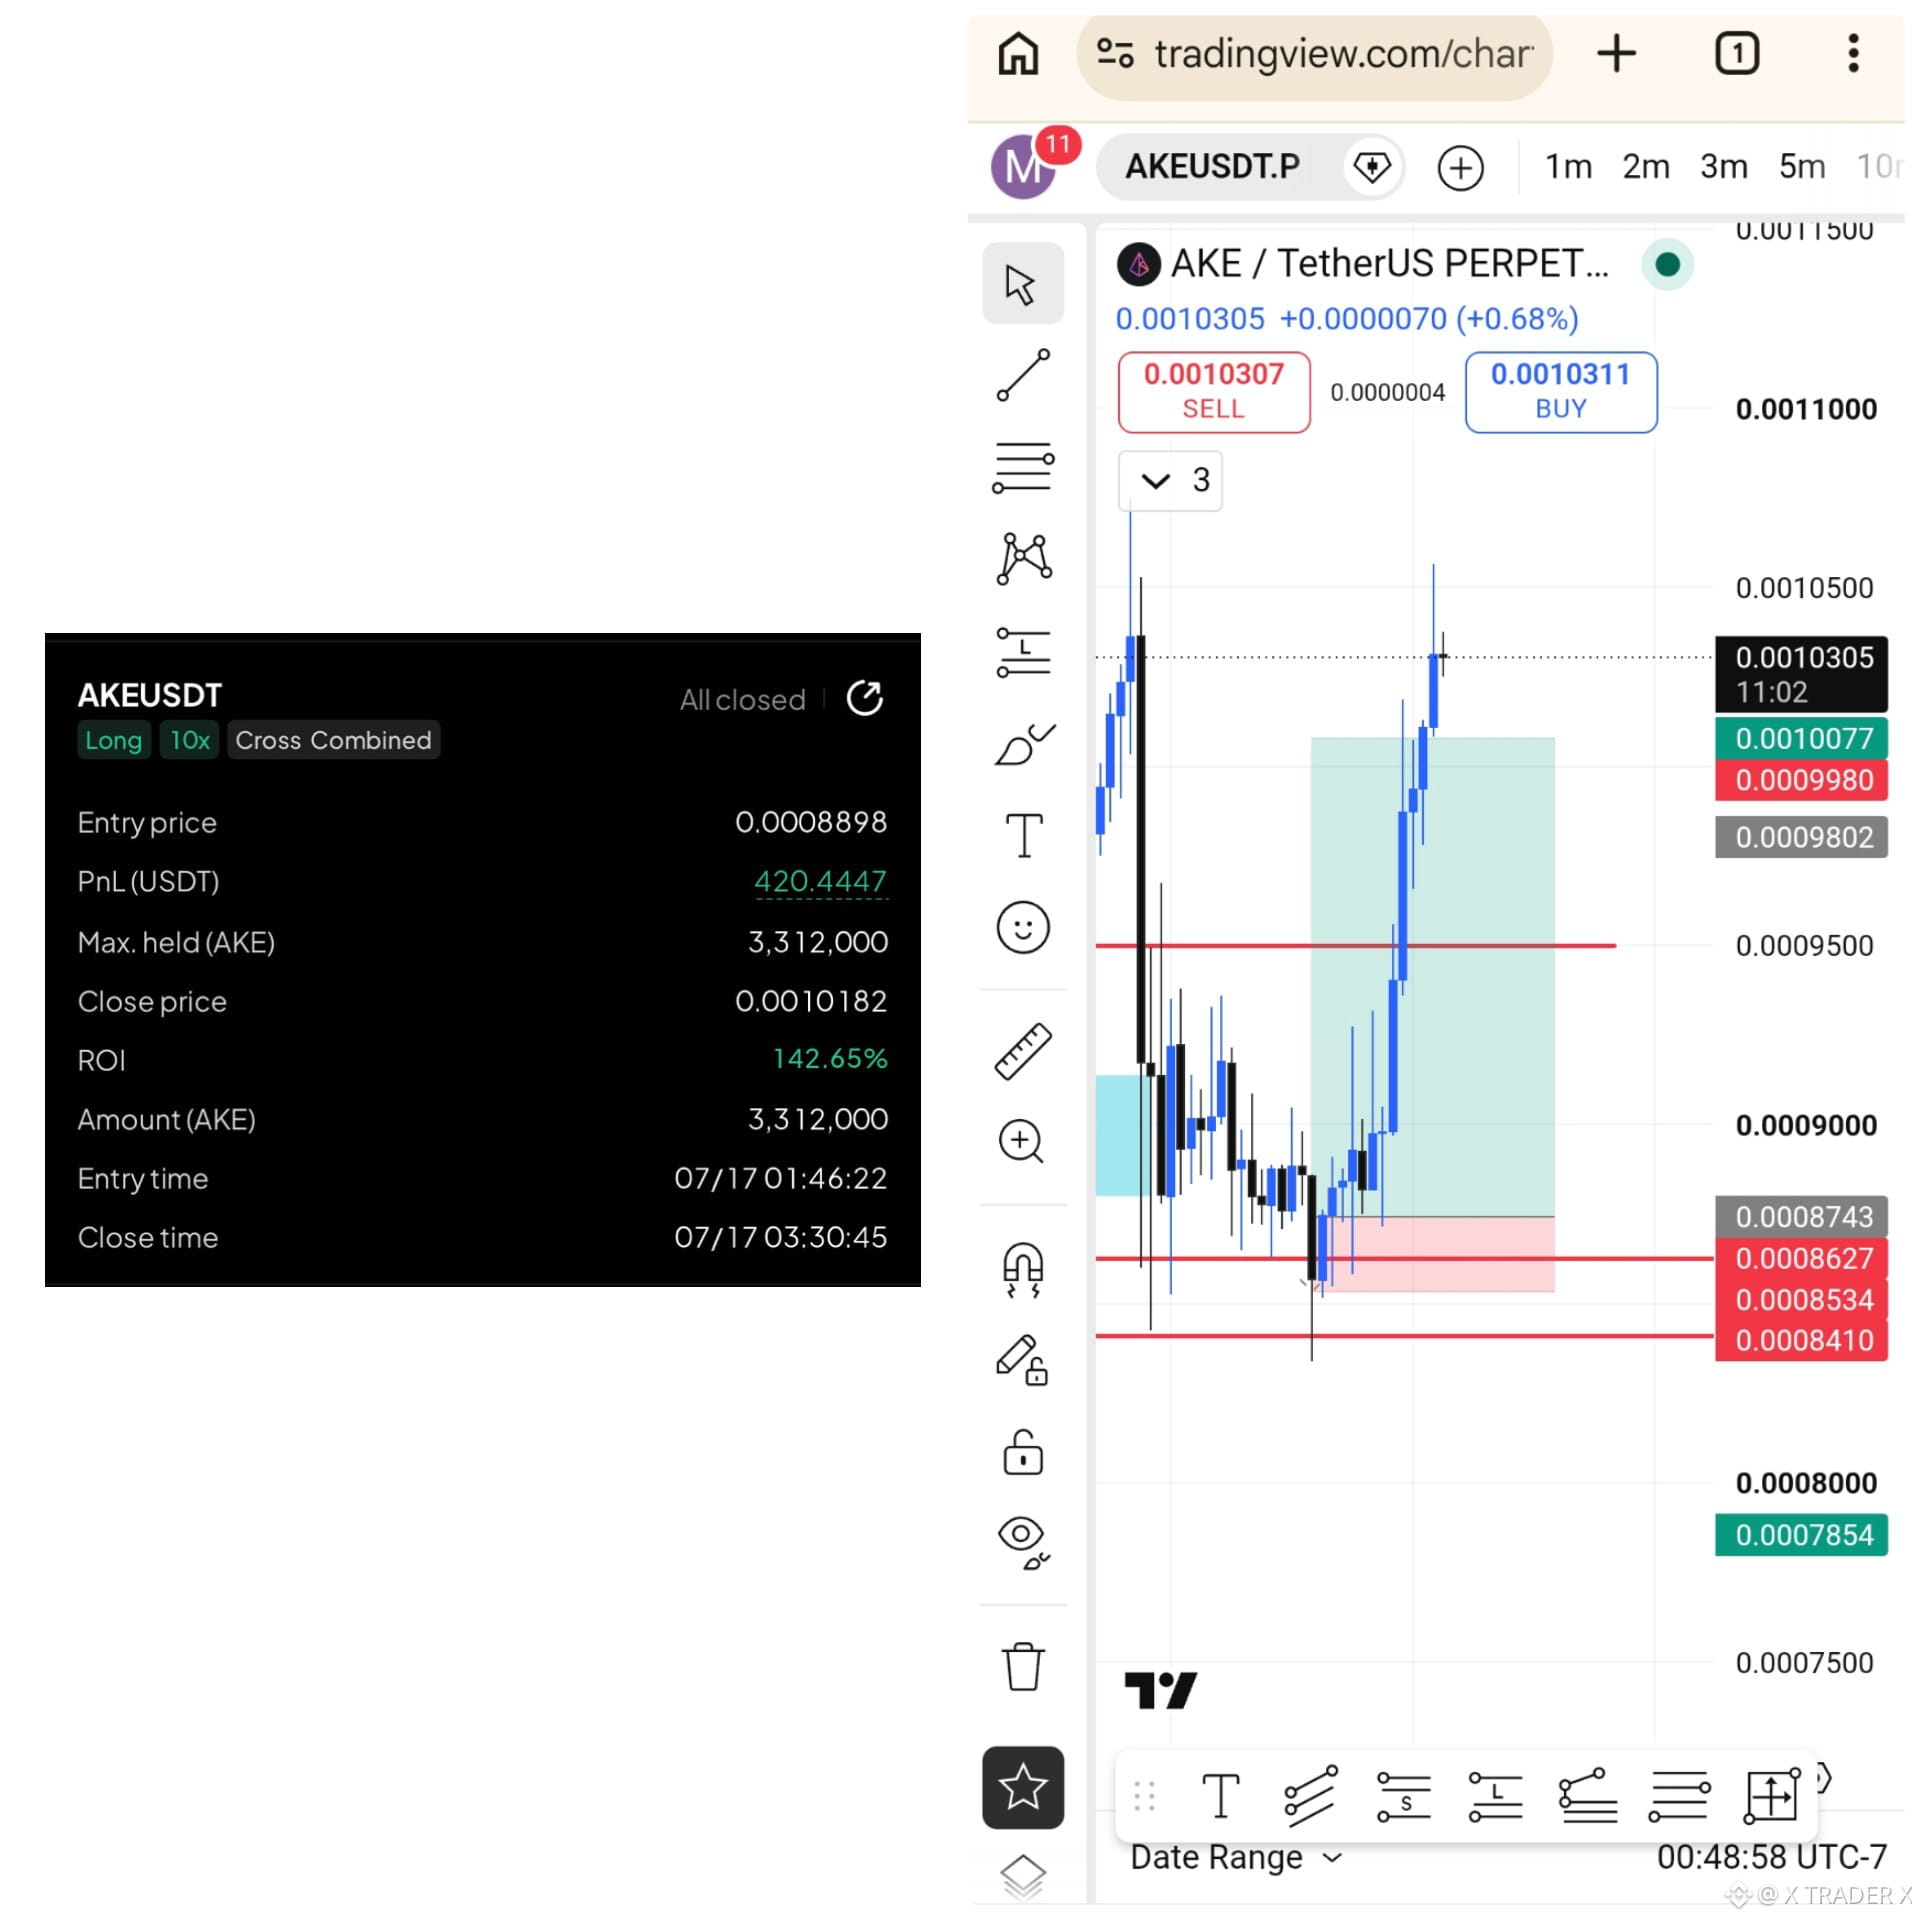
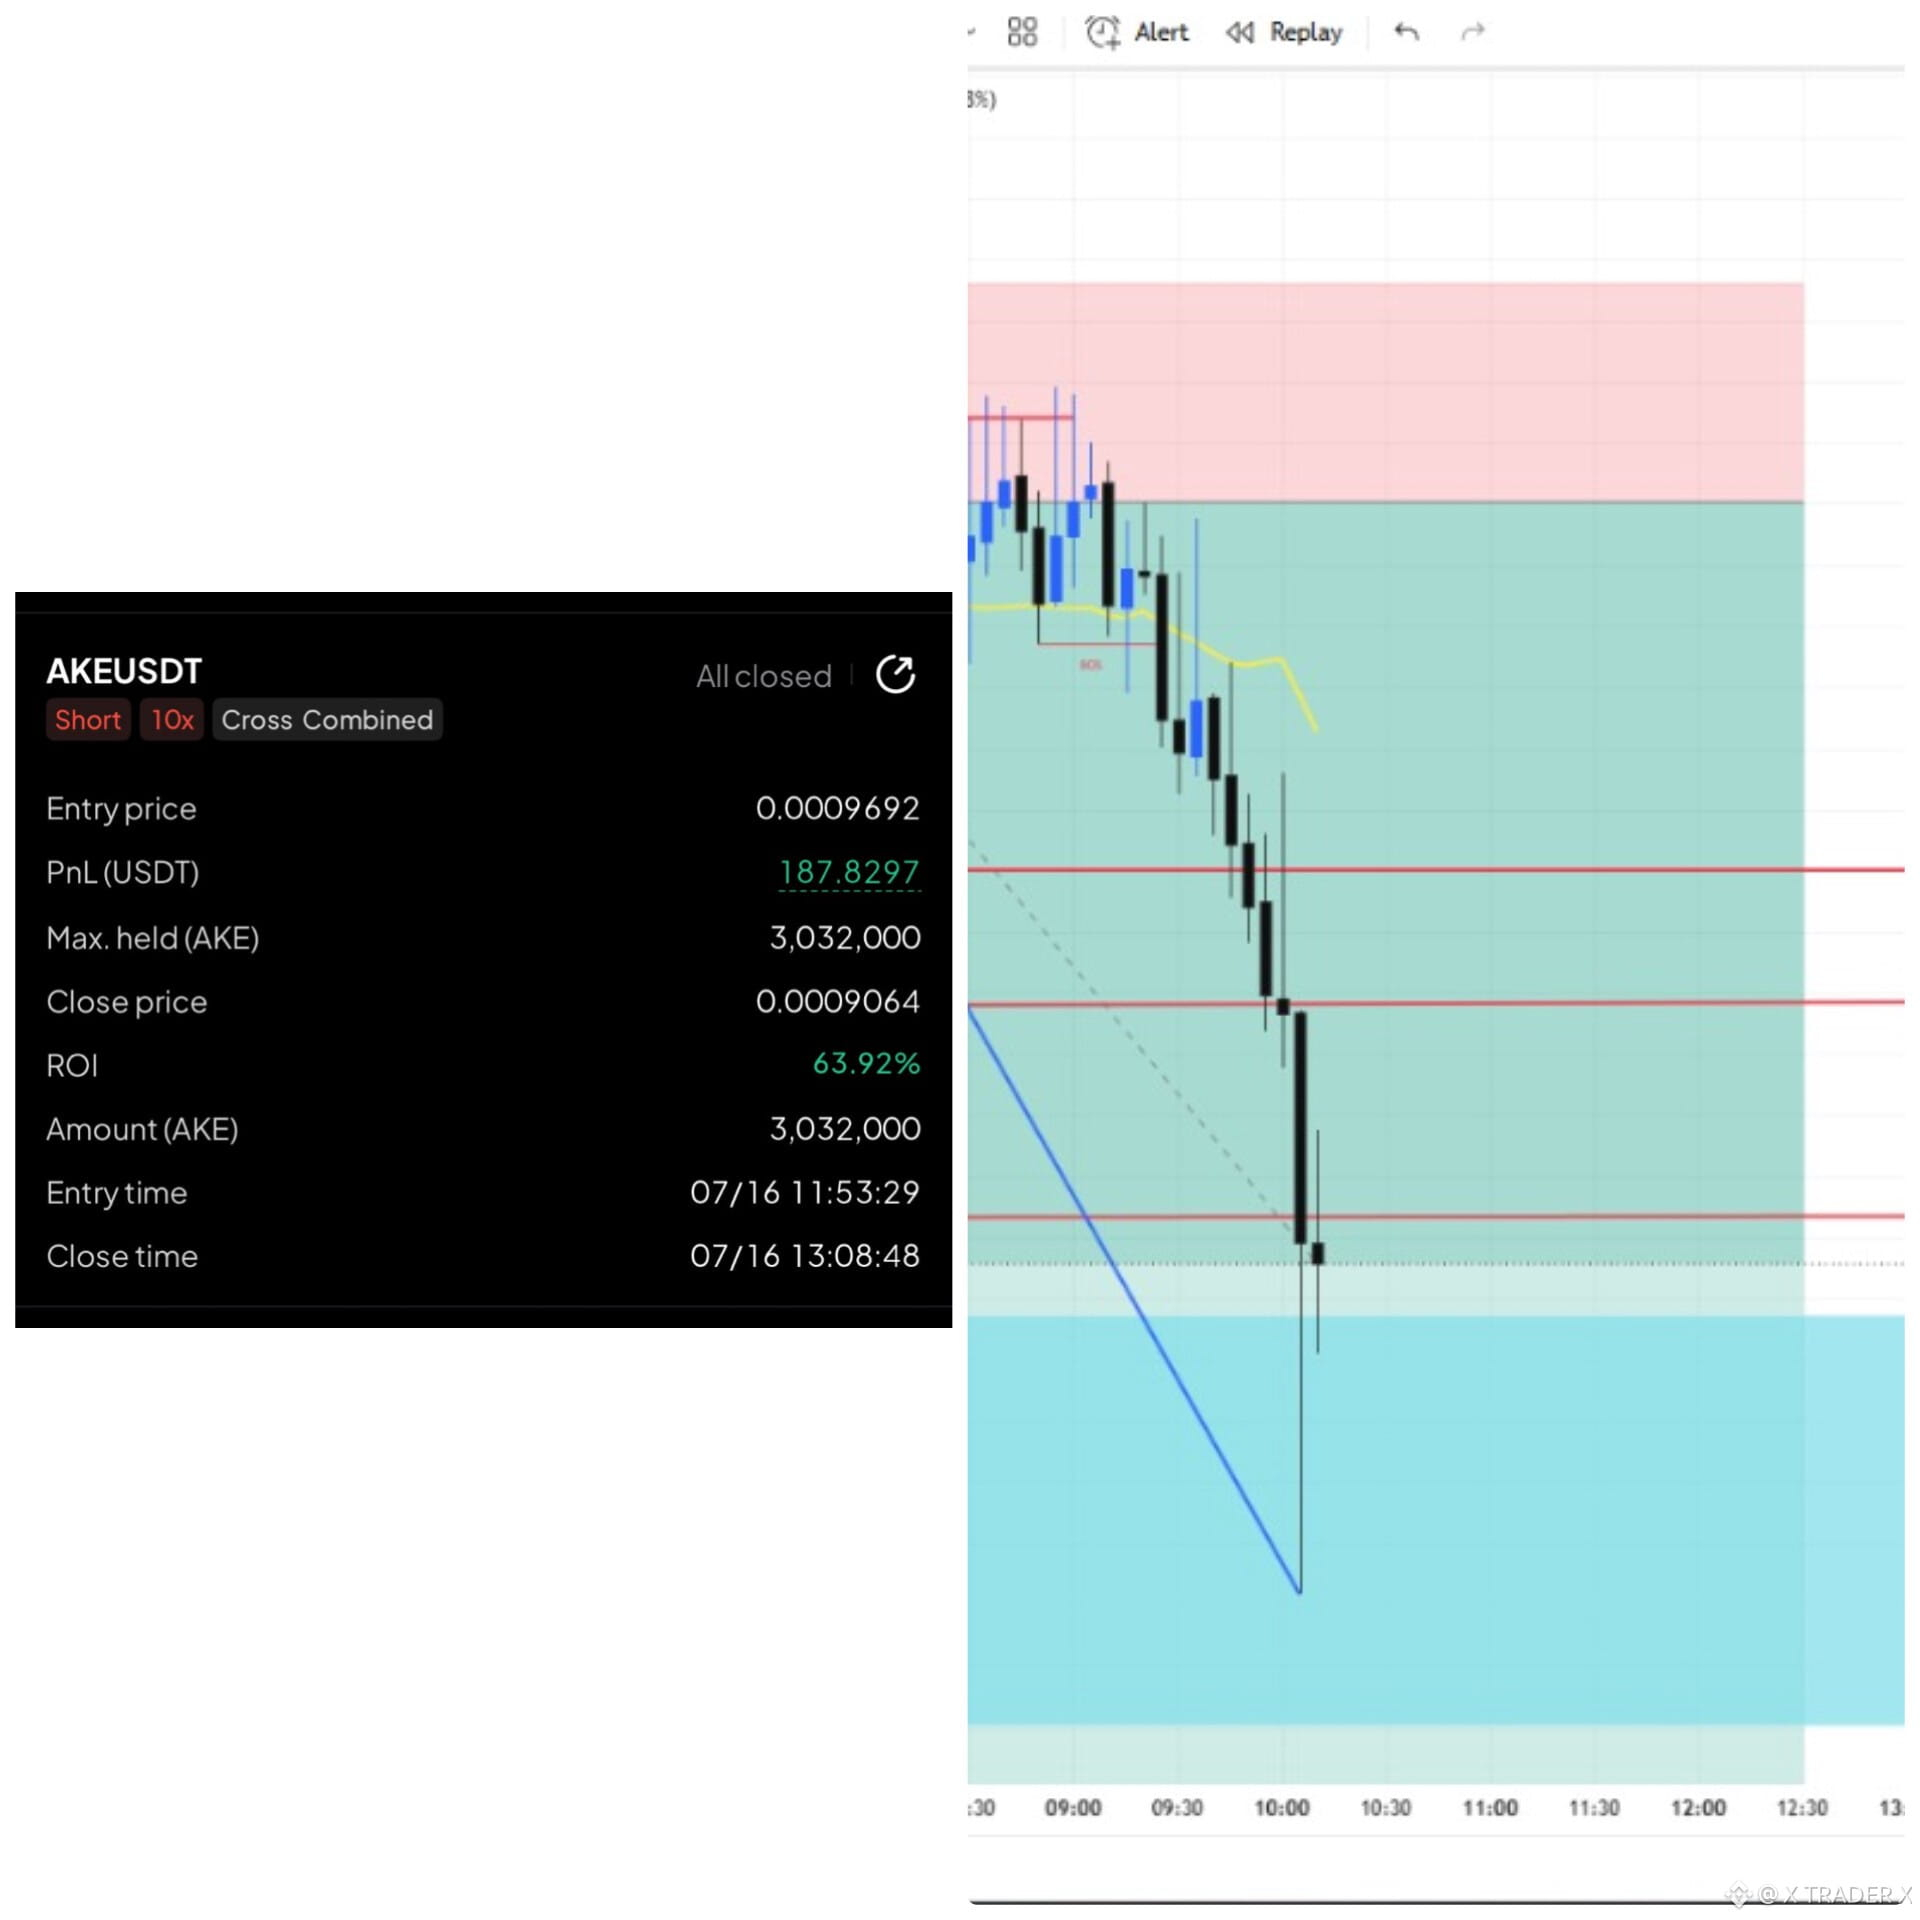
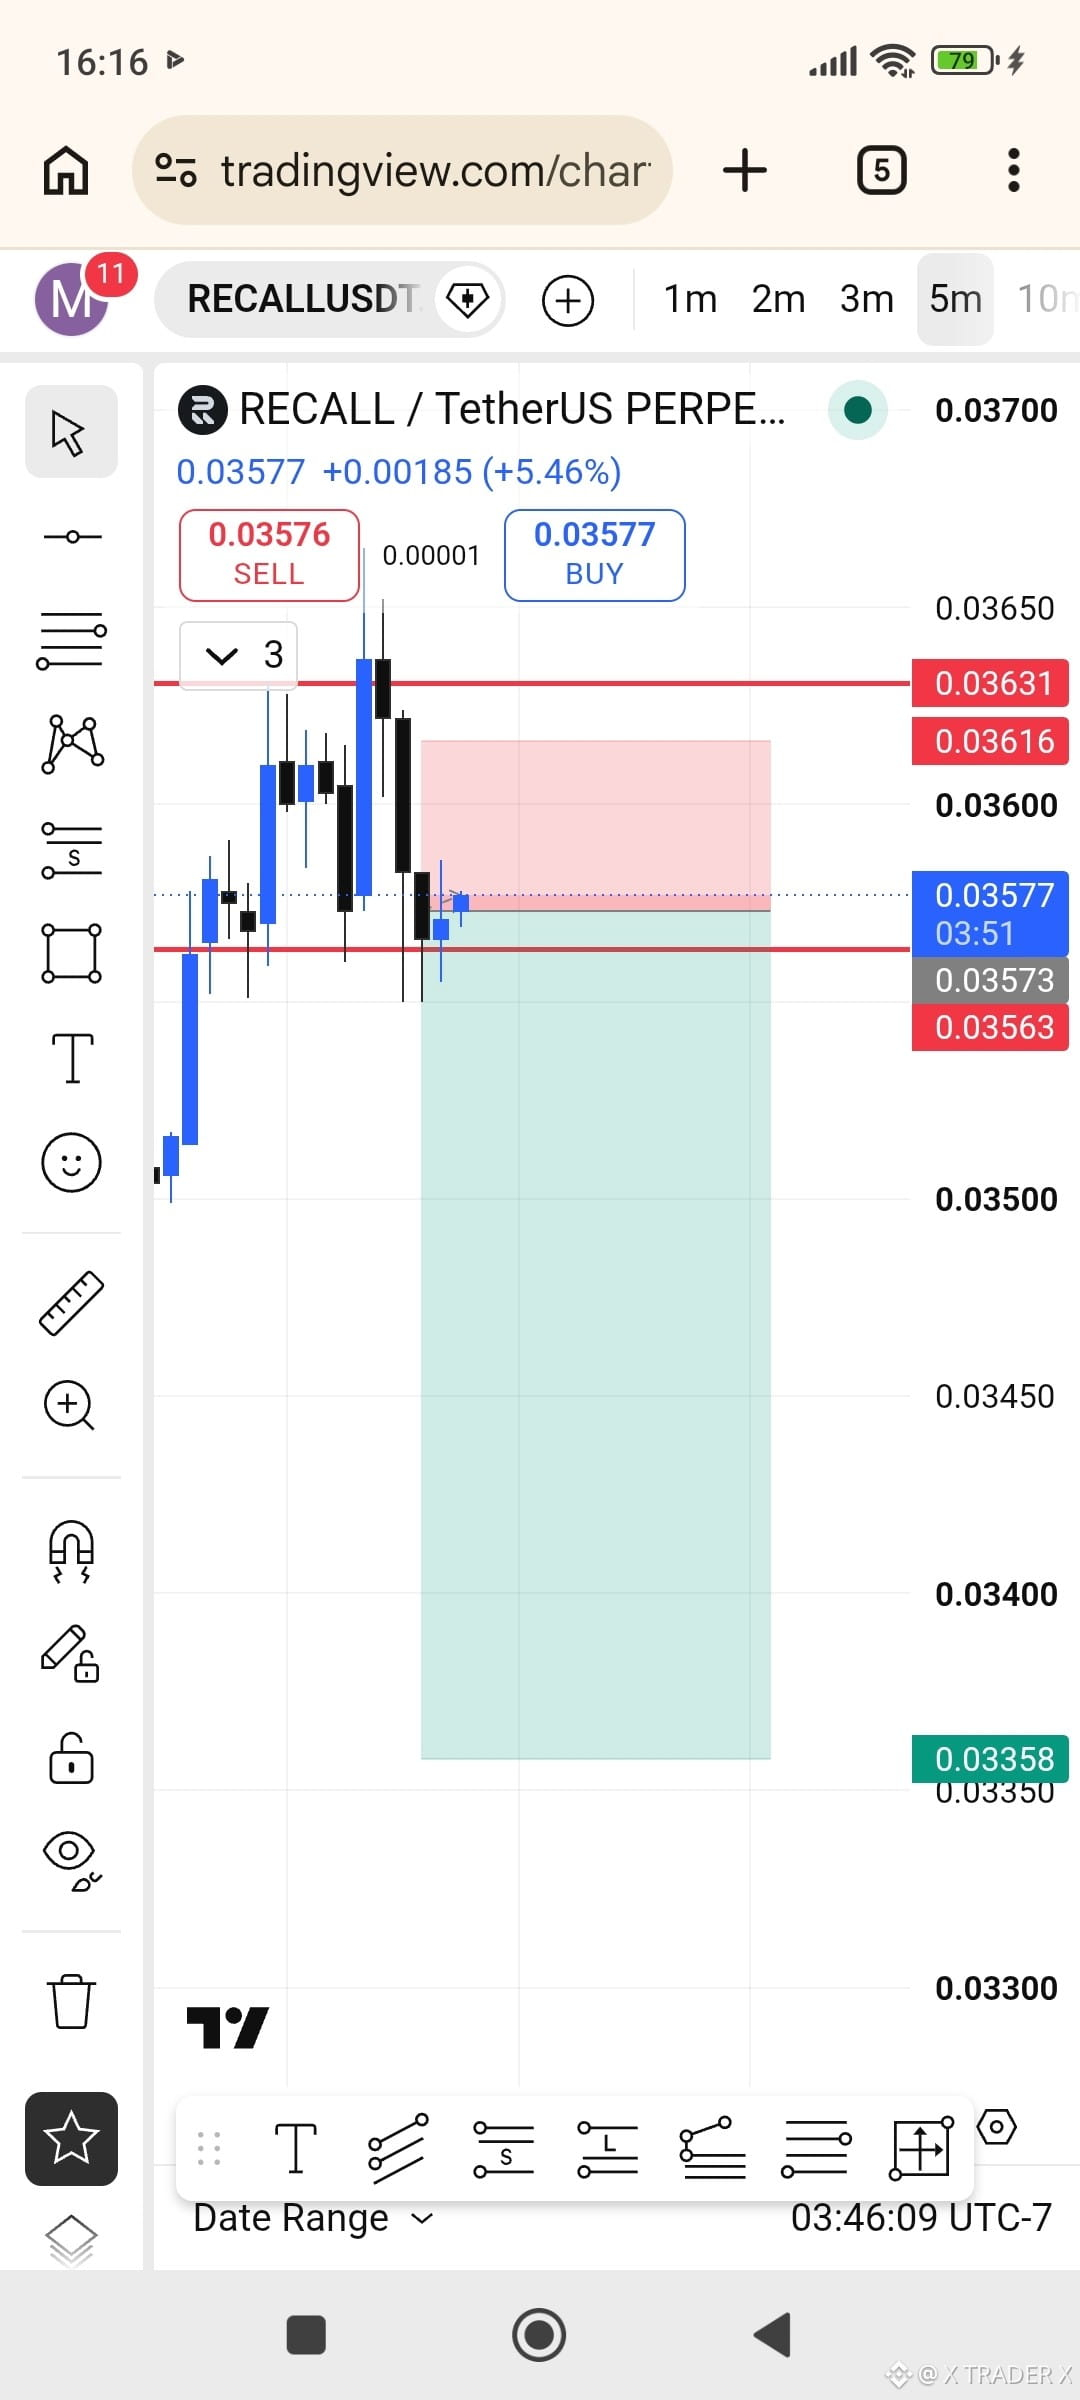
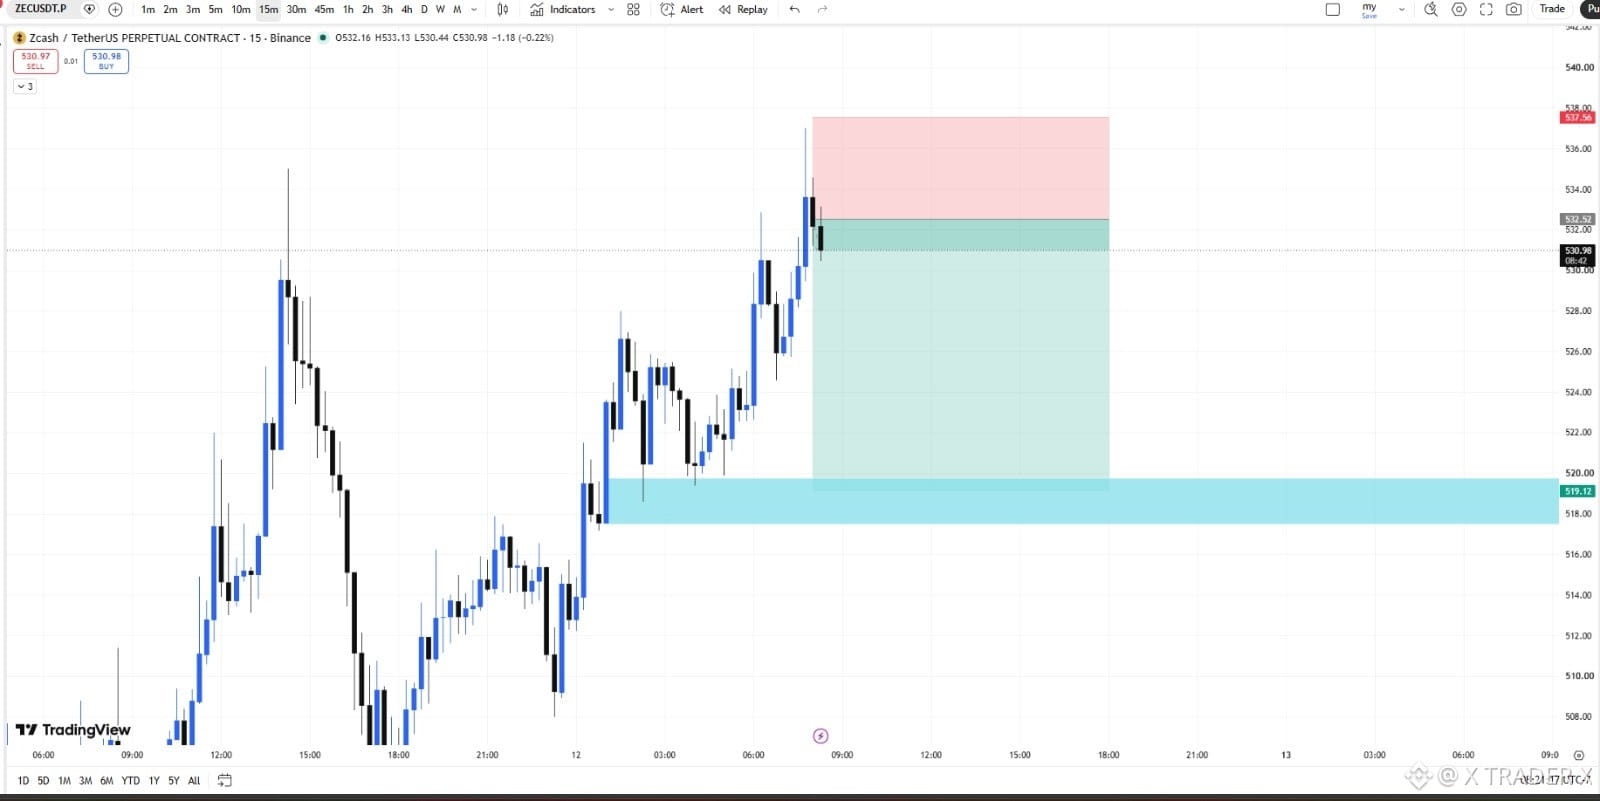
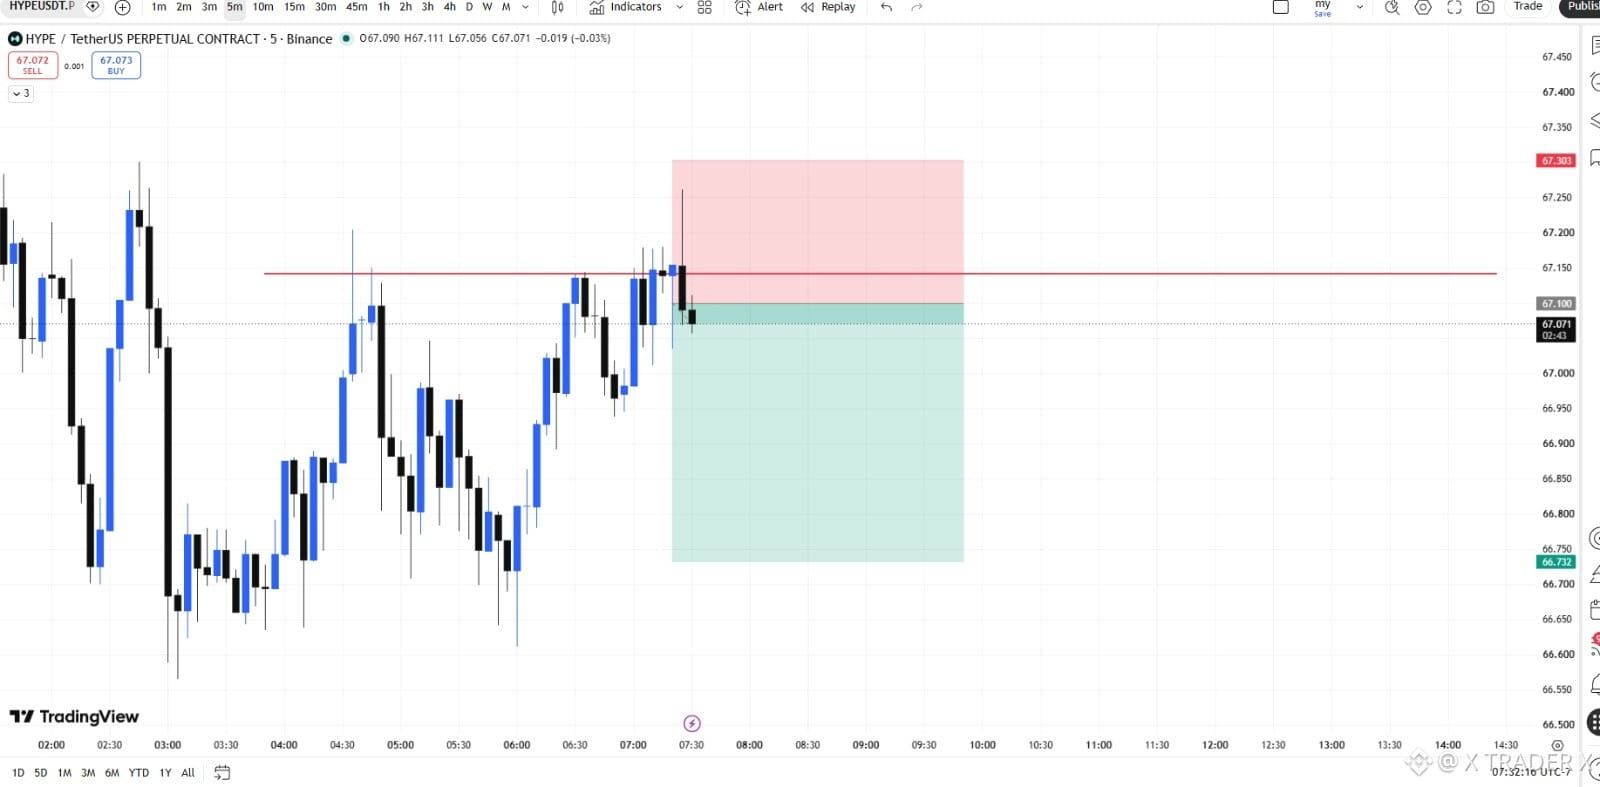
Sim! Eu me especializei em escolher Tops e Bottoms! Este foi o primeiro setup que encontramos hoje.. #sirenUSDT .. Fiquem ligados, meu Discord educacional está chegando em breve, pessoal! Vou postar os detalhes aqui nos próximos dias:
Sim! Eu me especializei em escolher Tops e Bottoms! Este foi o primeiro setup que encontramos hoje.. #sirenUSDT .. Fiquem ligados, meu Discord educacional está chegando em breve, pessoal! Vou postar os detalhes aqui nos próximos dias:
248
·
--
136
·
--
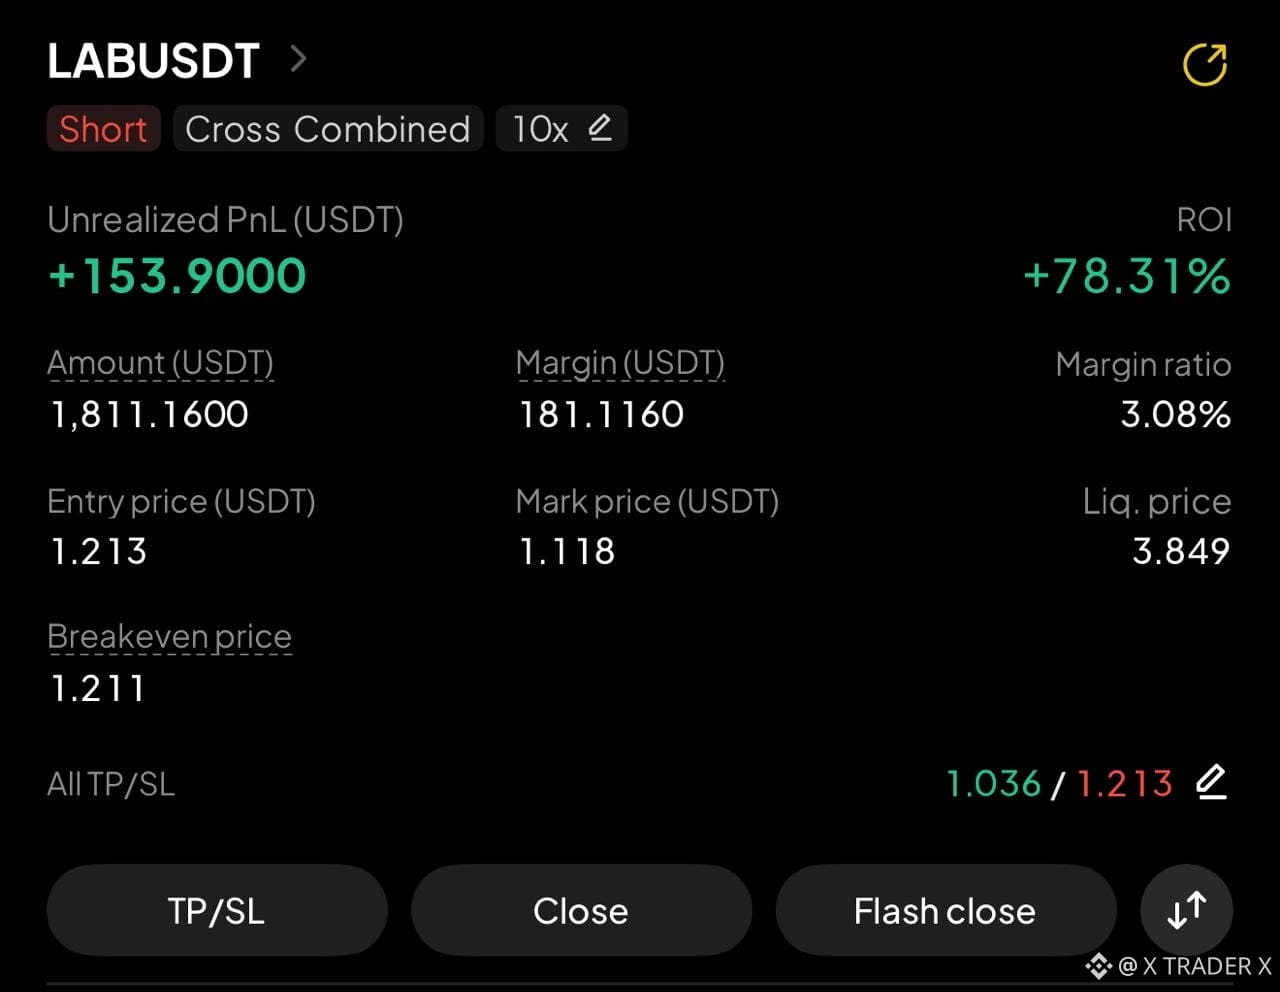
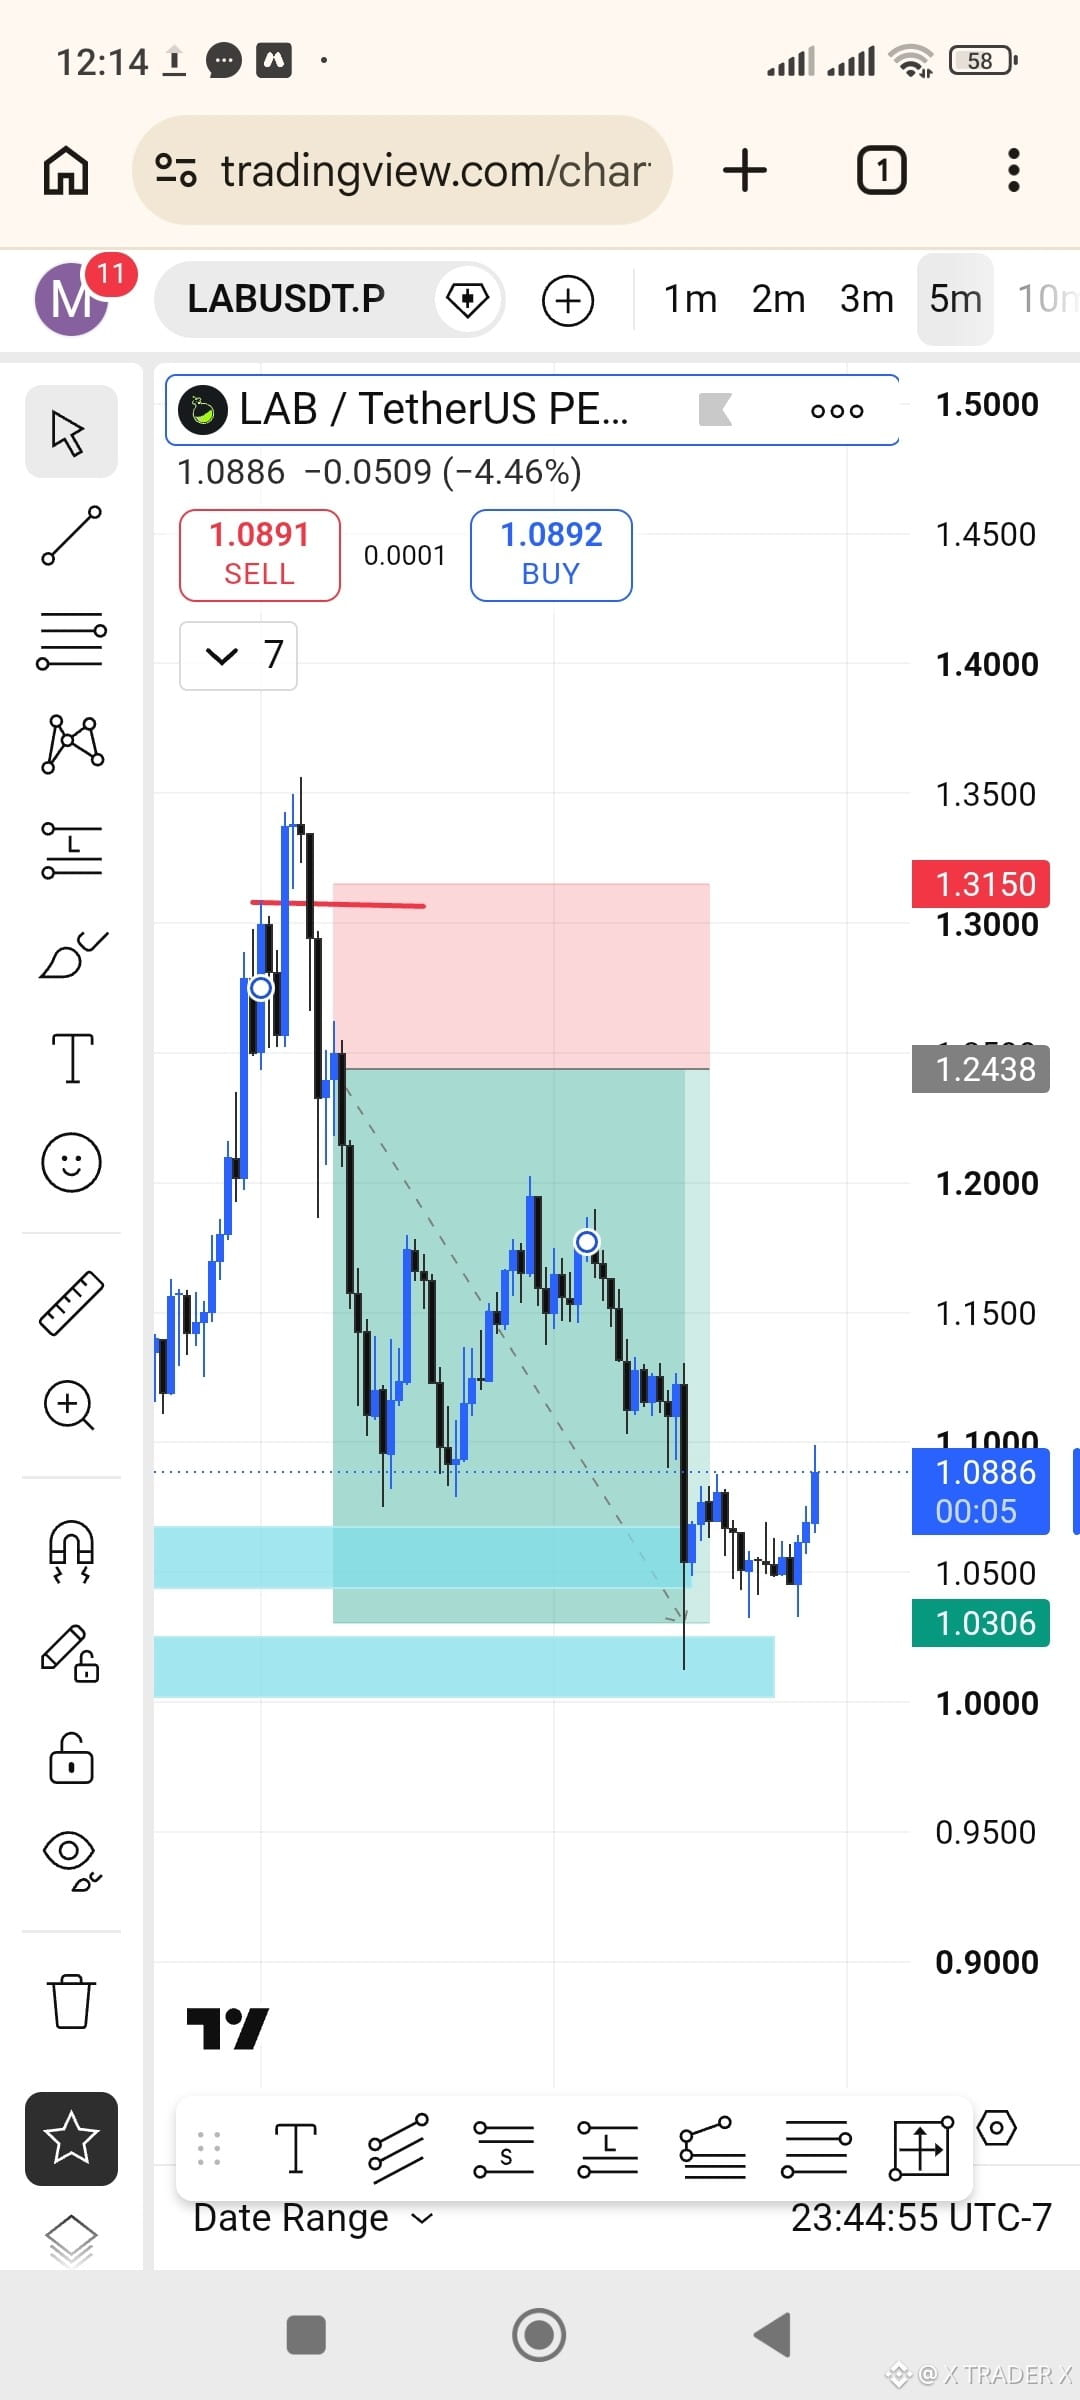
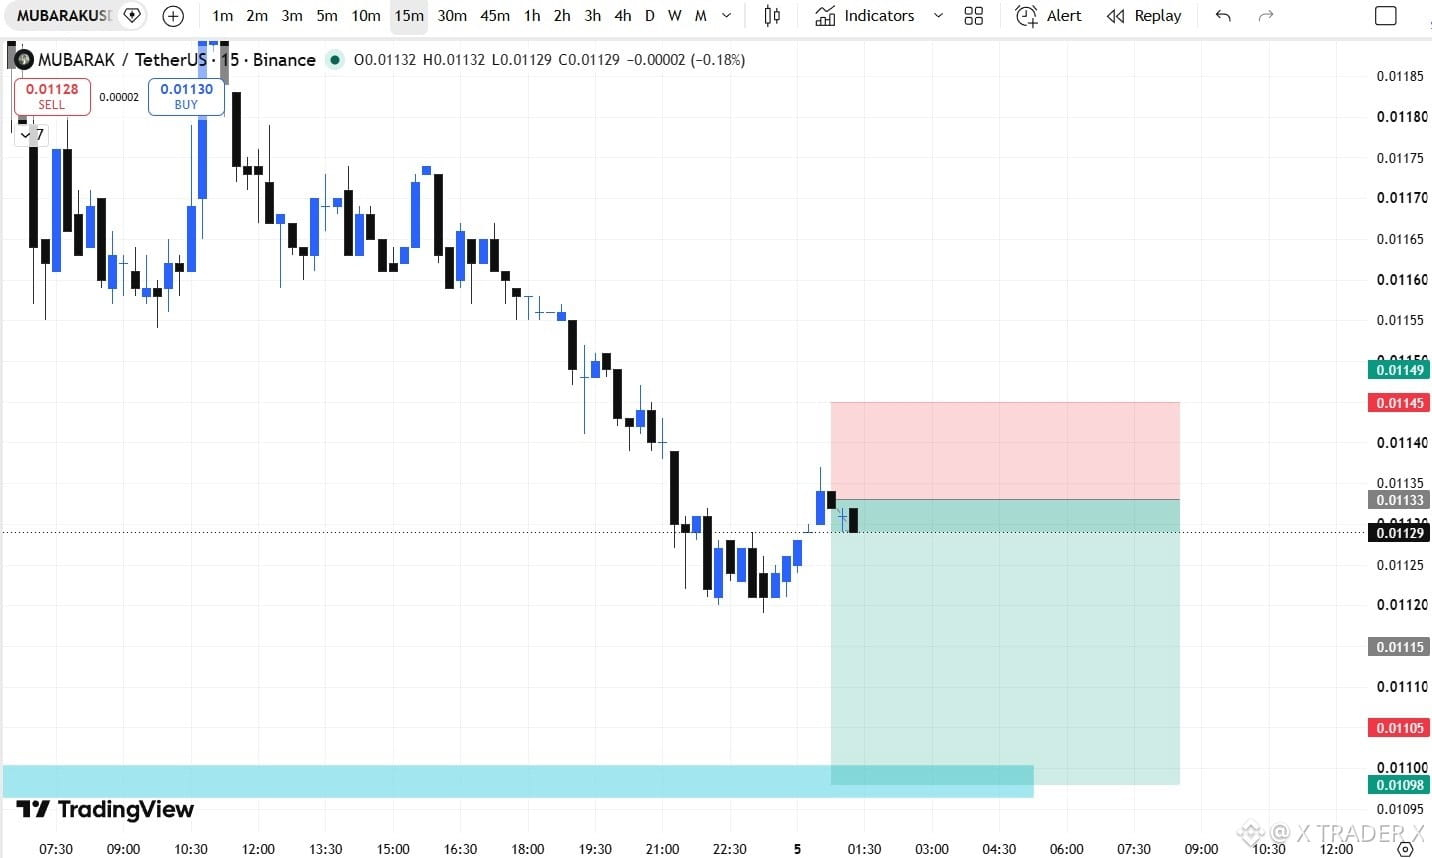
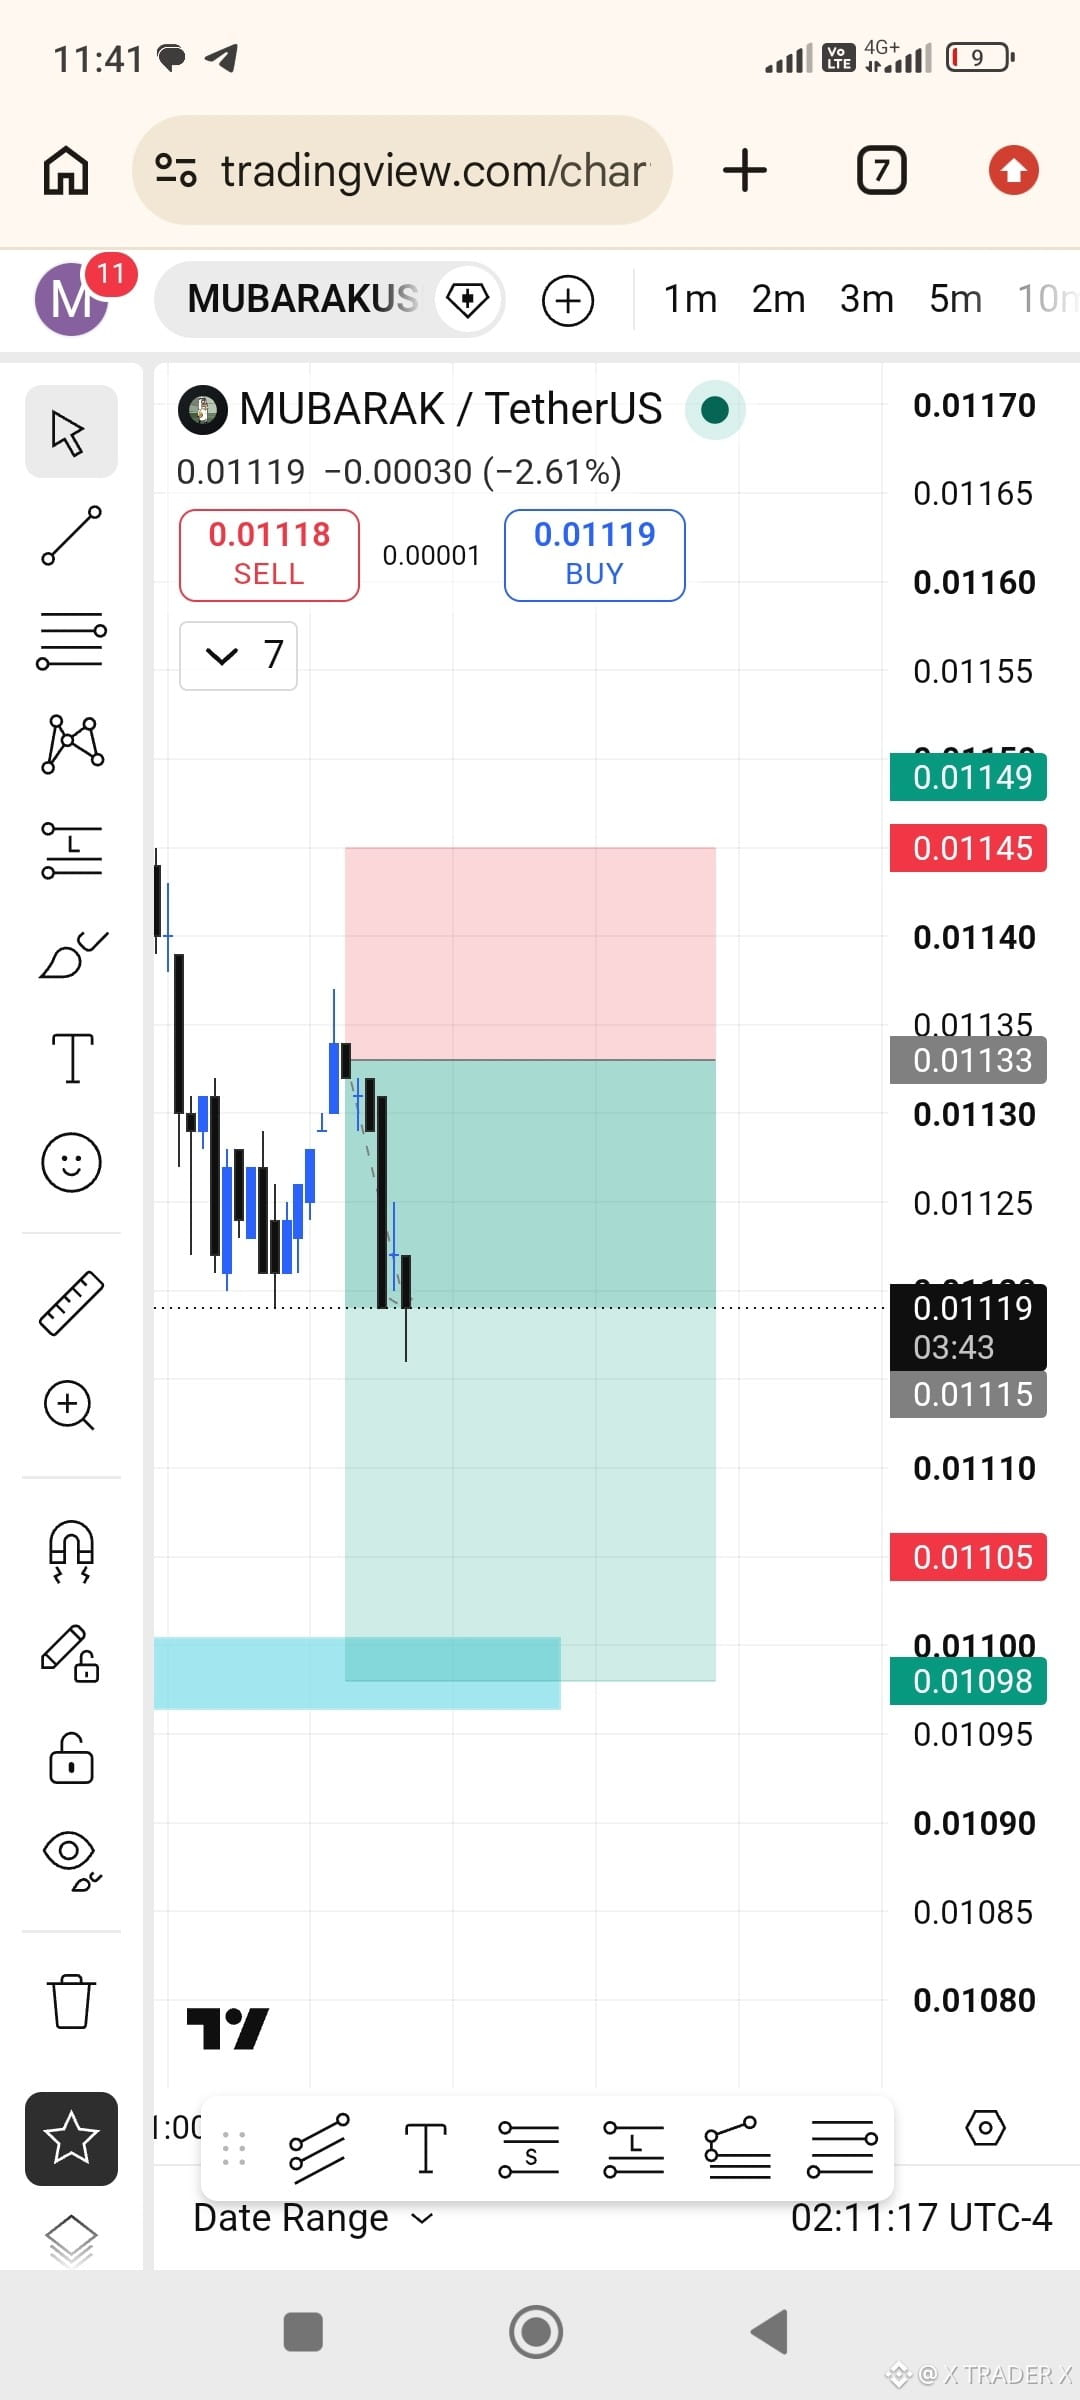
#LABTokenDrops94% #LABUSDT ponto de equilíbrio para entrar em meu grupo para quem quiser participar
#LABTokenDrops94% #LABUSDT ponto de equilíbrio para entrar em meu grupo para quem quiser participar
216
·
--
186
Inicia sessão para explorar mais conteúdos
Junta-te a utilizadores de criptomoedas de todo o mundo na Binance Square
⚡️ Obtém informações úteis e recentes sobre criptomoedas.
💬 Com a confiança da maior exchange de criptomoedas do mundo.
👍 Descobre perspetivas reais de criadores verificados.
E-mail/Número de telefone
Tópicos em Tendência
US2YearYieldRisesTo4.61%
144 visualizações
21 a discutir
😍😍😍😍😍😍😍😍😍😍😍😍😍😍😍😍😍😍😍😍😍😍😍😍#CYSUSD #US2YearYieldRisesTo4.61% #bitcoin.” #EtherRalliesAsBearishBetsLiquidate $
Gsembhi
·1 gostos
·29 visualizações
US10YearTreasuryYieldNears5%
152 visualizações
16 a discutir
CryptoLiquidations$674MIn24H
3,305 visualizações
48 a discutir