
Muhamamd Adeel
634 Publicações

Muhamamd Adeel
Denunciar
Bloquear Utilizador
Daily provide Latest News.
10 A seguir
52 Seguidores
59 Gostaram
Publicações
Tudo
Cotações
Artigo
Ver tradução
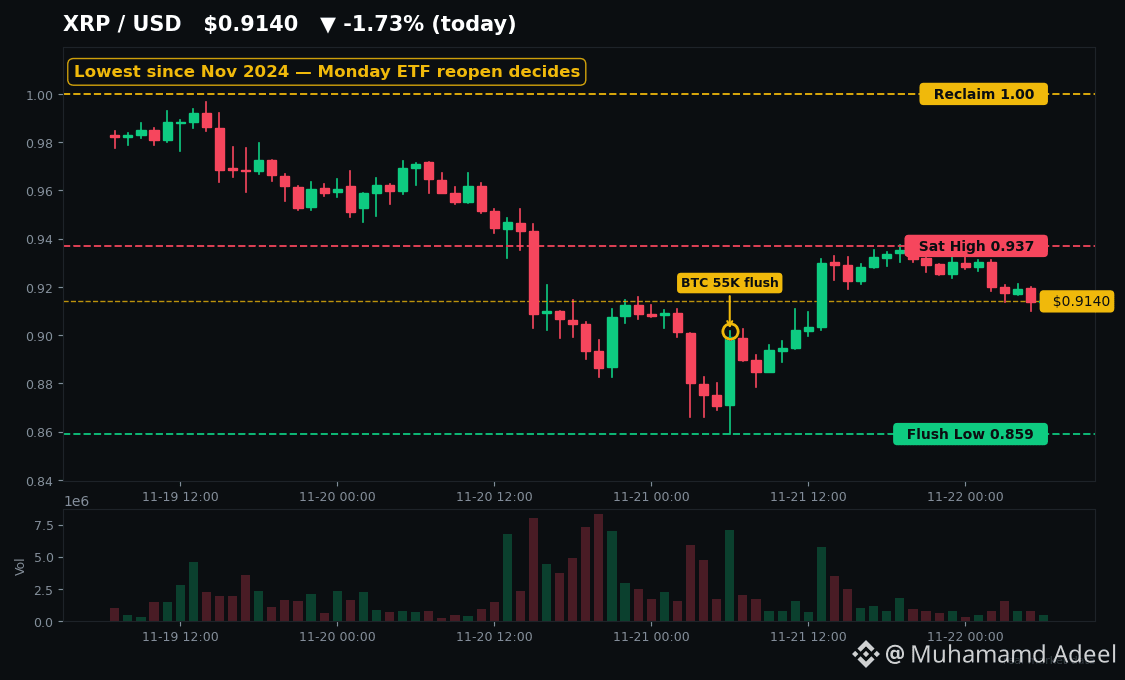
XRP Hit $0.859, Its Lowest Since 2024 — Monday Decides Everything$XRP just printed $0.859 — its lowest price since November 2024.
And here's the twist nobody's pricing in: while you were panic-selling, the biggest wallets didn't dump. They moved.
Saturday was a bloodbath. $BTC flushed to $55,100 — a two-year low — and XRP undercut its own 14 November low of $0.89, wicking to $0.859 before buyers stepped in. About $18M in XRP longs got liquidated in 24 hours, 94% of them longs (CoinGlass via CoinDesk). Then came the V: XRP bounced roughly 8% off the low into Saturday's close near $0.93. It's sitting around $0.91 now, with Fear & Greed at 11 — Extreme Fear.
So why didn't it keep falling? Look at what the whales actually did. On 15 November, 240M XRP moved between wallets at the two-year low. On 17 November, another 140M XRP moved. CoinDesk checked: neither batch went to an exchange. Meanwhile, Binance's XRP supply is the tightest in five months (CryptoQuant's Supply Shortage Index hit 2.4 on 19 November), and whales pulled more than $127M off Binance between 10–16 November. Retail is selling at a loss — the 90-day realized profit-to-loss ratio is 0.38 — while wallets holding 10,000+ XRP climbed past 343,500. That's not distribution. That's absorption.
Now the honest part. The ETF bid is gone. US spot XRP ETFs have bled $30.76M in November with zero inflow days — nearly the worst month since launch — and total assets slipped below $1B. The crowd is still 72% long by accounts, which means there's still fuel for another flush. And history is brutal here: November is on track to be XRP's worst November on record (down about 25%), and after XRP's five worst Novembers, December was red every single time. In 2022 and 2024, real bottoms took months to build, not one weekend.
So Monday decides everything. The levels are clean: $0.859 is the line — lose it on a closing basis and analysts like Ali Martinez see $0.80, then $0.64. Reclaim $0.937 (Saturday's high) and then $1.00, and the whole "dead coin" narrative flips. Tap $XRP and pull up the chart — that $0.859 low versus the $1.00 reclaim is the entire trade right now, and Monday's ETF reopen tells you which side has real money behind it.
Capitulation low or bull trap — which one are you calling?
#XRP #Crypto
Not financial advice. DYOR.
XRP Hit $0.859, Its Lowest Since 2024 — Monday Decides Everything
$XRP just printed $0.859 — its lowest price since November 2024.
And here's the twist nobody's pricing in: while you were panic-selling, the biggest wallets didn't dump. They moved.
Saturday was a bloodbath. $BTC flushed to $55,100 — a two-year low — and XRP undercut its own 14 November low of $0.89, wicking to $0.859 before buyers stepped in. About $18M in XRP longs got liquidated in 24 hours, 94% of them longs (CoinGlass via CoinDesk). Then came the V: XRP bounced roughly 8% off the low into Saturday's close near $0.93. It's sitting around $0.91 now, with Fear & Greed at 11 — Extreme Fear.
So why didn't it keep falling? Look at what the whales actually did. On 15 November, 240M XRP moved between wallets at the two-year low. On 17 November, another 140M XRP moved. CoinDesk checked: neither batch went to an exchange. Meanwhile, Binance's XRP supply is the tightest in five months (CryptoQuant's Supply Shortage Index hit 2.4 on 19 November), and whales pulled more than $127M off Binance between 10–16 November. Retail is selling at a loss — the 90-day realized profit-to-loss ratio is 0.38 — while wallets holding 10,000+ XRP climbed past 343,500. That's not distribution. That's absorption.
Now the honest part. The ETF bid is gone. US spot XRP ETFs have bled $30.76M in November with zero inflow days — nearly the worst month since launch — and total assets slipped below $1B. The crowd is still 72% long by accounts, which means there's still fuel for another flush. And history is brutal here: November is on track to be XRP's worst November on record (down about 25%), and after XRP's five worst Novembers, December was red every single time. In 2022 and 2024, real bottoms took months to build, not one weekend.
So Monday decides everything. The levels are clean: $0.859 is the line — lose it on a closing basis and analysts like Ali Martinez see $0.80, then $0.64. Reclaim $0.937 (Saturday's high) and then $1.00, and the whole "dead coin" narrative flips. Tap $XRP and pull up the chart — that $0.859 low versus the $1.00 reclaim is the entire trade right now, and Monday's ETF reopen tells you which side has real money behind it.
Capitulation low or bull trap — which one are you calling?
#XRP #Crypto
Not financial advice. DYOR.
And here's the twist nobody's pricing in: while you were panic-selling, the biggest wallets didn't dump. They moved.
Saturday was a bloodbath. $BTC flushed to $55,100 — a two-year low — and XRP undercut its own 14 November low of $0.89, wicking to $0.859 before buyers stepped in. About $18M in XRP longs got liquidated in 24 hours, 94% of them longs (CoinGlass via CoinDesk). Then came the V: XRP bounced roughly 8% off the low into Saturday's close near $0.93. It's sitting around $0.91 now, with Fear & Greed at 11 — Extreme Fear.
So why didn't it keep falling? Look at what the whales actually did. On 15 November, 240M XRP moved between wallets at the two-year low. On 17 November, another 140M XRP moved. CoinDesk checked: neither batch went to an exchange. Meanwhile, Binance's XRP supply is the tightest in five months (CryptoQuant's Supply Shortage Index hit 2.4 on 19 November), and whales pulled more than $127M off Binance between 10–16 November. Retail is selling at a loss — the 90-day realized profit-to-loss ratio is 0.38 — while wallets holding 10,000+ XRP climbed past 343,500. That's not distribution. That's absorption.
Now the honest part. The ETF bid is gone. US spot XRP ETFs have bled $30.76M in November with zero inflow days — nearly the worst month since launch — and total assets slipped below $1B. The crowd is still 72% long by accounts, which means there's still fuel for another flush. And history is brutal here: November is on track to be XRP's worst November on record (down about 25%), and after XRP's five worst Novembers, December was red every single time. In 2022 and 2024, real bottoms took months to build, not one weekend.
So Monday decides everything. The levels are clean: $0.859 is the line — lose it on a closing basis and analysts like Ali Martinez see $0.80, then $0.64. Reclaim $0.937 (Saturday's high) and then $1.00, and the whole "dead coin" narrative flips. Tap $XRP and pull up the chart — that $0.859 low versus the $1.00 reclaim is the entire trade right now, and Monday's ETF reopen tells you which side has real money behind it.
Capitulation low or bull trap — which one are you calling?
#XRP #Crypto
Not financial advice. DYOR.
14
Artigo
Ver tradução
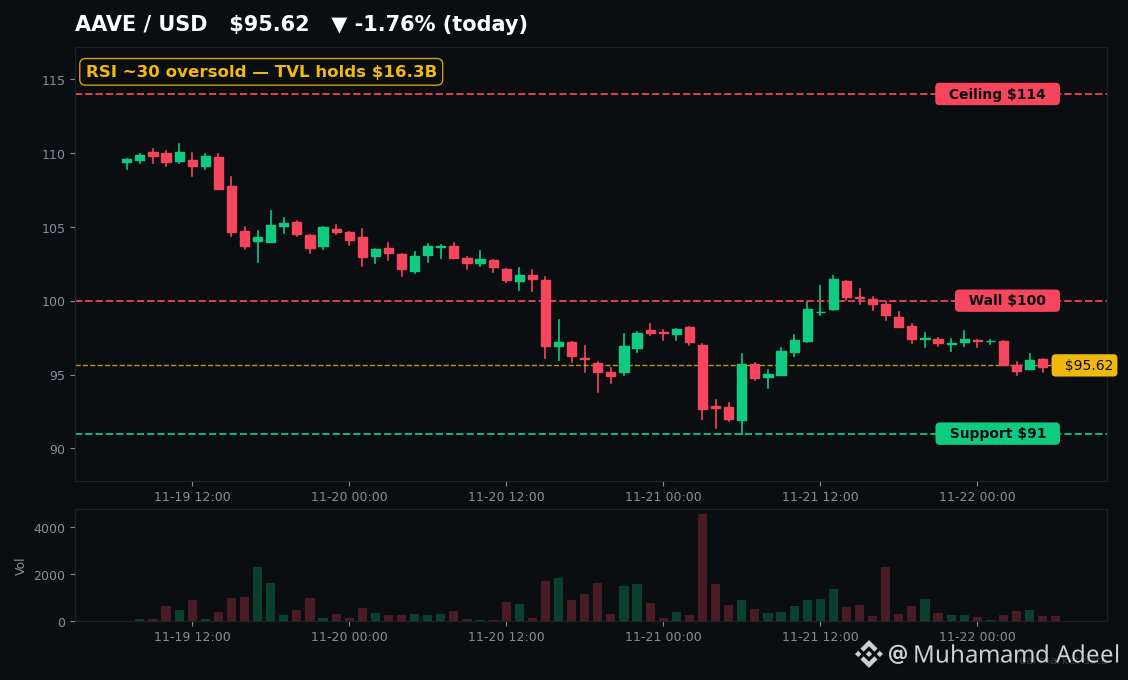
BTC Lost $60K. $AAVE Just Took the Real Stress Test$BTC just lost $60K. Fear is at 12. And the real stress test isn't on Bitcoin's chart — it's on $AAVE.
Lending is where crashes get ugly first. So here's the question nobody's asking: why hasn't DeFi's biggest lender cracked?
The token is getting destroyed. $AAVE is sitting around $96, down roughly 35% in a month and about 85% below its $661.69 all-time high from May 2021. RSI is hovering near 30 — oversold territory. Price is below every major moving average. On paper, this looks like capitulation.
But look at the protocol underneath. Aave still holds about $16.3B in TVL and $11.2B in active loans — still the #1 lending protocol in DeFi. In the last 24 hours alone, about $30.8M in collateral was liquidated on Aave, and across the Nov 20–21 flush roughly $50M of the $160M in DeFi liquidations ran through Aave v3 and v4. No bank run. No new bad-debt headline. The machine kept processing.
It even got more fuel mid-crash. One wallet supplied about $1.49B in USDC on Nov 19, and on Nov 20 Aave raised its Ethereum USDC borrow cap from $2.7B to $4B. Borrow rates didn't spike into panic — they eased. That's not what a breaking lender looks like.
Now the levels that actually matter. $91 is the line — that's basically the 24h low, and one dip-buyer has framed $91–$120 as a buying zone with invalidation under $91. Hold it, and this stays an oversold bounce setup. Lose it on a daily close, and the next supports sit near $86, then the mid-$70s. Above, $100 is the first wall, and $114 is the real ceiling — until $AAVE reclaims $114, every bounce is guilty until proven innocent. Tap $AAVE and look at that $91–$100 squeeze yourself.
The bigger risk isn't even $AAVE's chart. It's $ETH. One whale is sitting on about $301M in ETH collateral against $214M in USDT debt on Aave, with liquidation estimated near $1,401 ETH — and he added leverage during the drop. A Nasdaq-listed firm, BTCS, also disclosed in a Nov 19 SEC filing that its roughly $54M Aave loan could face liquidation if ETH keeps falling. ETH is near $1,659 right now. If $ETH slides toward $1,400, forced selling on Aave becomes the story.
And be honest about the token problem: AAVE holders have no automatic claim on fees, and buybacks have been paused since April while the DAO deals with the fallout from the Kelp exploit. The protocol can survive and the token can still lag. History says that's exactly the pattern — Aave held through 2021, Terra, Celsius, and FTX while the token drew down brutally.
So which $AAVE are you watching — the survivor protocol, or the broken token? Watch $91 below, $100 and $114 above, and $ETH at $1,401.
Not financial advice. DYOR.
BTC Lost $60K. $AAVE Just Took the Real Stress Test
$BTC just lost $60K. Fear is at 12. And the real stress test isn't on Bitcoin's chart — it's on $AAVE .
Lending is where crashes get ugly first. So here's the question nobody's asking: why hasn't DeFi's biggest lender cracked?
The token is getting destroyed. $AAVE is sitting around $96, down roughly 35% in a month and about 85% below its $661.69 all-time high from May 2021. RSI is hovering near 30 — oversold territory. Price is below every major moving average. On paper, this looks like capitulation.
But look at the protocol underneath. Aave still holds about $16.3B in TVL and $11.2B in active loans — still the #1 lending protocol in DeFi. In the last 24 hours alone, about $30.8M in collateral was liquidated on Aave, and across the Nov 20–21 flush roughly $50M of the $160M in DeFi liquidations ran through Aave v3 and v4. No bank run. No new bad-debt headline. The machine kept processing.
It even got more fuel mid-crash. One wallet supplied about $1.49B in USDC on Nov 19, and on Nov 20 Aave raised its Ethereum USDC borrow cap from $2.7B to $4B. Borrow rates didn't spike into panic — they eased. That's not what a breaking lender looks like.
Now the levels that actually matter. $91 is the line — that's basically the 24h low, and one dip-buyer has framed $91–$120 as a buying zone with invalidation under $91. Hold it, and this stays an oversold bounce setup. Lose it on a daily close, and the next supports sit near $86, then the mid-$70s. Above, $100 is the first wall, and $114 is the real ceiling — until $AAVE reclaims $114, every bounce is guilty until proven innocent. Tap $AAVE and look at that $91–$100 squeeze yourself.
The bigger risk isn't even $AAVE 's chart. It's $ETH . One whale is sitting on about $301M in ETH collateral against $214M in USDT debt on Aave, with liquidation estimated near $1,401 ETH — and he added leverage during the drop. A Nasdaq-listed firm, BTCS, also disclosed in a Nov 19 SEC filing that its roughly $54M Aave loan could face liquidation if ETH keeps falling. ETH is near $1,659 right now. If $ETH slides toward $1,400, forced selling on Aave becomes the story.
And be honest about the token problem: AAVE holders have no automatic claim on fees, and buybacks have been paused since April while the DAO deals with the fallout from the Kelp exploit. The protocol can survive and the token can still lag. History says that's exactly the pattern — Aave held through 2021, Terra, Celsius, and FTX while the token drew down brutally.
So which $AAVE are you watching — the survivor protocol, or the broken token? Watch $91 below, $100 and $114 above, and $ETH at $1,401.
Not financial advice. DYOR.
Lending is where crashes get ugly first. So here's the question nobody's asking: why hasn't DeFi's biggest lender cracked?
The token is getting destroyed. $AAVE is sitting around $96, down roughly 35% in a month and about 85% below its $661.69 all-time high from May 2021. RSI is hovering near 30 — oversold territory. Price is below every major moving average. On paper, this looks like capitulation.
But look at the protocol underneath. Aave still holds about $16.3B in TVL and $11.2B in active loans — still the #1 lending protocol in DeFi. In the last 24 hours alone, about $30.8M in collateral was liquidated on Aave, and across the Nov 20–21 flush roughly $50M of the $160M in DeFi liquidations ran through Aave v3 and v4. No bank run. No new bad-debt headline. The machine kept processing.
It even got more fuel mid-crash. One wallet supplied about $1.49B in USDC on Nov 19, and on Nov 20 Aave raised its Ethereum USDC borrow cap from $2.7B to $4B. Borrow rates didn't spike into panic — they eased. That's not what a breaking lender looks like.
Now the levels that actually matter. $91 is the line — that's basically the 24h low, and one dip-buyer has framed $91–$120 as a buying zone with invalidation under $91. Hold it, and this stays an oversold bounce setup. Lose it on a daily close, and the next supports sit near $86, then the mid-$70s. Above, $100 is the first wall, and $114 is the real ceiling — until $AAVE reclaims $114, every bounce is guilty until proven innocent. Tap $AAVE and look at that $91–$100 squeeze yourself.
The bigger risk isn't even $AAVE 's chart. It's $ETH . One whale is sitting on about $301M in ETH collateral against $214M in USDT debt on Aave, with liquidation estimated near $1,401 ETH — and he added leverage during the drop. A Nasdaq-listed firm, BTCS, also disclosed in a Nov 19 SEC filing that its roughly $54M Aave loan could face liquidation if ETH keeps falling. ETH is near $1,659 right now. If $ETH slides toward $1,400, forced selling on Aave becomes the story.
And be honest about the token problem: AAVE holders have no automatic claim on fees, and buybacks have been paused since April while the DAO deals with the fallout from the Kelp exploit. The protocol can survive and the token can still lag. History says that's exactly the pattern — Aave held through 2021, Terra, Celsius, and FTX while the token drew down brutally.
So which $AAVE are you watching — the survivor protocol, or the broken token? Watch $91 below, $100 and $114 above, and $ETH at $1,401.
Not financial advice. DYOR.
34
Artigo
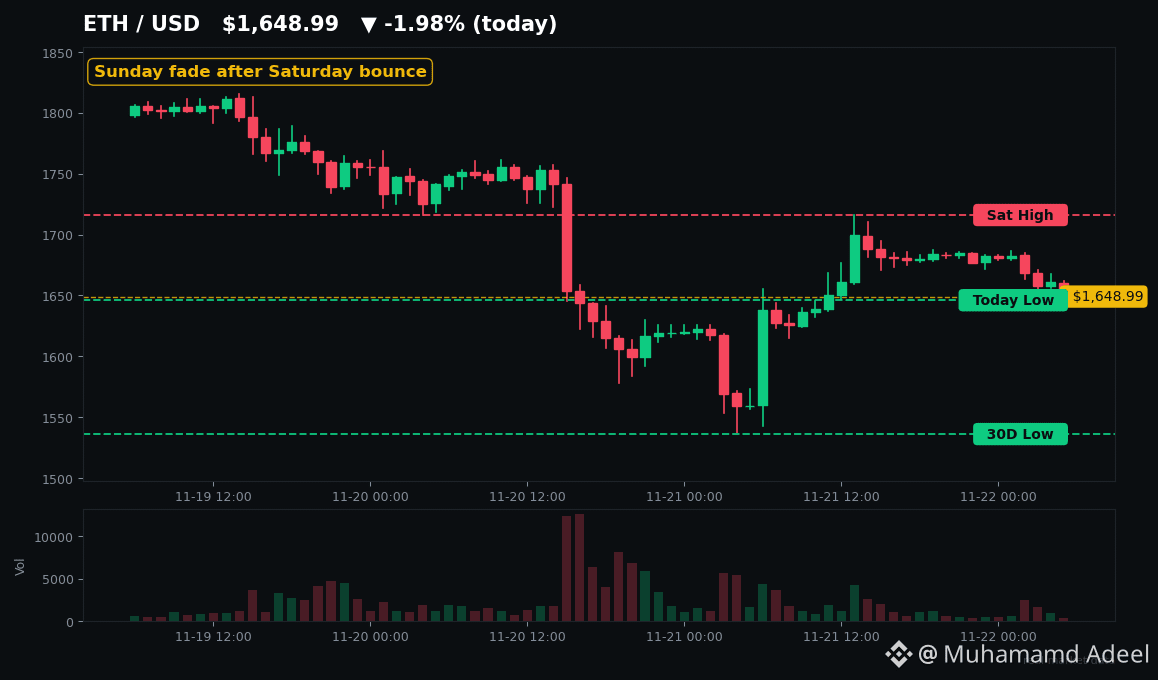
ETH após o BTC romper os US$ 60 mil: os níveis que vão decidir a segunda-feira$ETH recuperou-se após cair para US$ 1.536 no sábado. No domingo, já está devolvendo esses ganhos.
Aqui está o cenário que ninguém quer dizer em voz alta: a recuperação veio do fechamento de posições vendidas, não da chegada de compradores. E a abertura de segunda-feira vai nos dizer qual dos dois prevalece.
**O que realmente aconteceu**
Sexta-feira, $BTC perdeu US$ 60.000 pela primeira vez desde julho. No sábado, caiu para US$ 55.100 — o menor nível desde setembro de 2024 — e depois disparou de volta para perto de US$ 60.300.
O estrago: US$ 1,57 bilhão liquidado em 24 horas (CoinGlass, período de 20 de novembro). US$ 554 milhões desse total eram de BTC, com 91% em posições compradas. O ETH teve US$ 331 milhões em liquidações. A maior liquidação individual foi uma posição comprada de US$ 11,98 milhões em ETH na Binance.
ETH após o BTC romper os US$ 60 mil: os níveis que vão decidir a segunda-feira
$ETH recuperou-se após cair para US$ 1.536 no sábado. No domingo, já está devolvendo esses ganhos.
Aqui está o cenário que ninguém quer dizer em voz alta: a recuperação veio do fechamento de posições vendidas, não da chegada de compradores. E a abertura de segunda-feira vai nos dizer qual dos dois prevalece.
**O que realmente aconteceu**
Sexta-feira, $BTC perdeu US$ 60.000 pela primeira vez desde julho. No sábado, caiu para US$ 55.100 — o menor nível desde setembro de 2024 — e depois disparou de volta para perto de US$ 60.300.
O estrago: US$ 1,57 bilhão liquidado em 24 horas (CoinGlass, período de 20 de novembro). US$ 554 milhões desse total eram de BTC, com 91% em posições compradas. O ETH teve US$ 331 milhões em liquidações. A maior liquidação individual foi uma posição comprada de US$ 11,98 milhões em ETH na Binance.
Aqui está o cenário que ninguém quer dizer em voz alta: a recuperação veio do fechamento de posições vendidas, não da chegada de compradores. E a abertura de segunda-feira vai nos dizer qual dos dois prevalece.
**O que realmente aconteceu**
Sexta-feira, $BTC perdeu US$ 60.000 pela primeira vez desde julho. No sábado, caiu para US$ 55.100 — o menor nível desde setembro de 2024 — e depois disparou de volta para perto de US$ 60.300.
O estrago: US$ 1,57 bilhão liquidado em 24 horas (CoinGlass, período de 20 de novembro). US$ 554 milhões desse total eram de BTC, com 91% em posições compradas. O ETH teve US$ 331 milhões em liquidações. A maior liquidação individual foi uma posição comprada de US$ 11,98 milhões em ETH na Binance.
51
Artigo
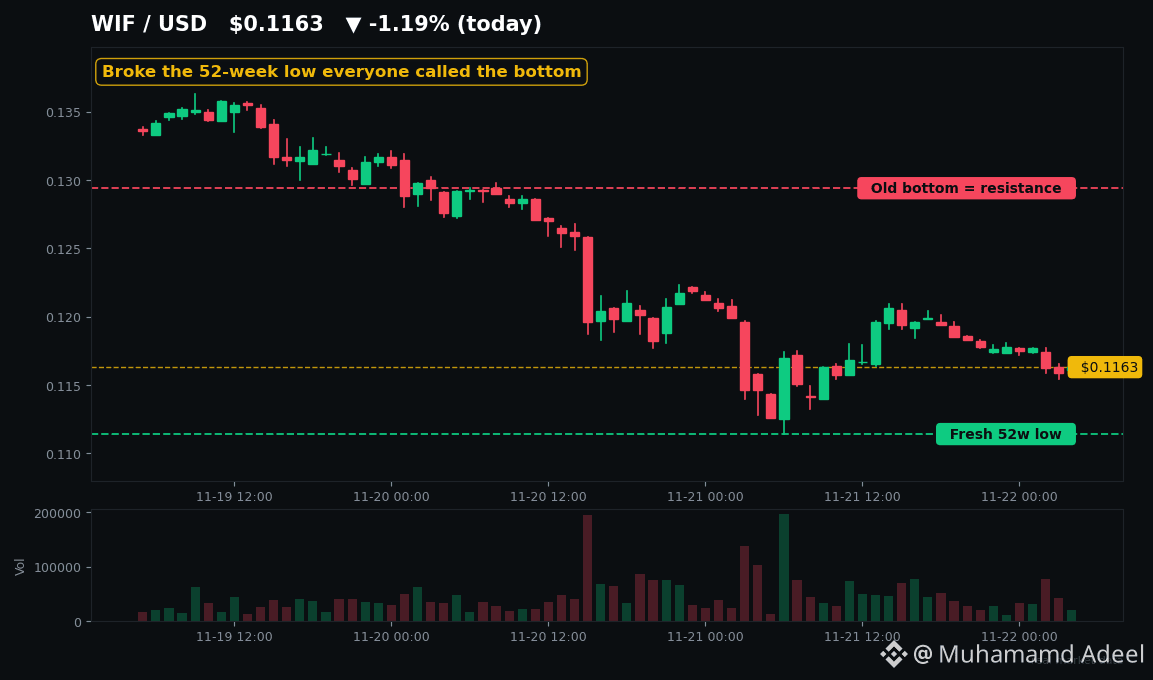
WIF Acaba de Romper o "Fundo" em que Todos ConfiavamNa semana passada, todos disseram que US$ 0,1294 era o fundo do poço. $WIF acabou de despencar abaixo desse nível.
WIF está sendo negociada perto de US$ 0,116 hoje — uma nova mínima de 52 semanas, queda de cerca de 40% em 30 dias e 97,6% abaixo da máxima histórica de US$ 4,83, registrada em março de 2024. Entre as seis principais moedas meme, é o pior desempenho do mês. Até a alta de hoje conta essa história: $WIF sobe cerca de 1,5%, enquanto DOGE e SHIB sobem 5%. O cachorro de chapéu está ficando para trás até na própria recuperação.
Veja o que isso realmente significa. Na semana passada, US$ 0,1294 era o nível que todos apontavam — "mínima de 52 semanas, RSI em sobrevenda, este é o fundo do poço". Esse nível não se sustentou. O preço caiu abaixo dele, até US$ 0,111, e aquela antiga mínima agora é uma resistência. É assim que as tendências de baixa funcionam: cada "fundo" vira o próximo teto até que os compradores provem o contrário.
WIF Acaba de Romper o "Fundo" em que Todos Confiavam
Na semana passada, todos disseram que US$ 0,1294 era o fundo do poço. $WIF acabou de despencar abaixo desse nível.
WIF está sendo negociada perto de US$ 0,116 hoje — uma nova mínima de 52 semanas, queda de cerca de 40% em 30 dias e 97,6% abaixo da máxima histórica de US$ 4,83, registrada em março de 2024. Entre as seis principais moedas meme, é o pior desempenho do mês. Até a alta de hoje conta essa história: $WIF sobe cerca de 1,5%, enquanto DOGE e SHIB sobem 5%. O cachorro de chapéu está ficando para trás até na própria recuperação.
Veja o que isso realmente significa. Na semana passada, US$ 0,1294 era o nível que todos apontavam — "mínima de 52 semanas, RSI em sobrevenda, este é o fundo do poço". Esse nível não se sustentou. O preço caiu abaixo dele, até US$ 0,111, e aquela antiga mínima agora é uma resistência. É assim que as tendências de baixa funcionam: cada "fundo" vira o próximo teto até que os compradores provem o contrário.
WIF está sendo negociada perto de US$ 0,116 hoje — uma nova mínima de 52 semanas, queda de cerca de 40% em 30 dias e 97,6% abaixo da máxima histórica de US$ 4,83, registrada em março de 2024. Entre as seis principais moedas meme, é o pior desempenho do mês. Até a alta de hoje conta essa história: $WIF sobe cerca de 1,5%, enquanto DOGE e SHIB sobem 5%. O cachorro de chapéu está ficando para trás até na própria recuperação.
Veja o que isso realmente significa. Na semana passada, US$ 0,1294 era o nível que todos apontavam — "mínima de 52 semanas, RSI em sobrevenda, este é o fundo do poço". Esse nível não se sustentou. O preço caiu abaixo dele, até US$ 0,111, e aquela antiga mínima agora é uma resistência. É assim que as tendências de baixa funcionam: cada "fundo" vira o próximo teto até que os compradores provem o contrário.
52
Artigo
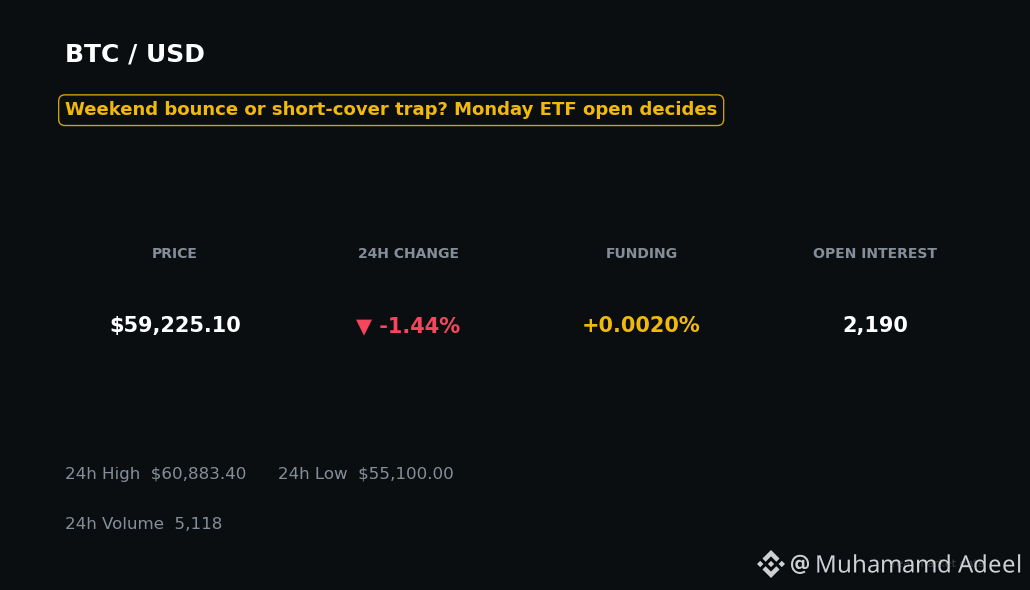
$BTC Caiu Abaixo dos US$ 60 mil — Agora, o Verdadeiro Teste Começa na Segunda-feira$BTC caiu para US$ 55.100 no sábado — sua menor cotação desde setembro de 2024.
Então, disparou cerca de 9% de volta em direção aos US$ 60 mil. Caso encerrado? Nem de longe. O verdadeiro teste começa na segunda-feira.
Foi isso que realmente aconteceu neste fim de semana. Na sexta-feira, o Bitcoin caiu abaixo de US$ 60.000 pela primeira vez desde julho. Na manhã de sábado, continuou caindo até US$ 55.130–US$ 55.251 — a mínima em dois anos, cerca de 52% abaixo do recorde de outubro de 2025, perto de US$ 126.000. Então, os compradores entraram e puxaram o preço de volta para perto de US$ 60.000 até a noite de sábado. Enquanto escrevo, neste domingo, ele está oscilando pouco abaixo dos US$ 60 mil, em torno de US$ 59,2 mil na Kraken.
$BTC Caiu Abaixo dos US$ 60 mil — Agora, o Verdadeiro Teste Começa na Segunda-feira
$BTC caiu para US$ 55.100 no sábado — sua menor cotação desde setembro de 2024.
Então, disparou cerca de 9% de volta em direção aos US$ 60 mil. Caso encerrado? Nem de longe. O verdadeiro teste começa na segunda-feira.
Foi isso que realmente aconteceu neste fim de semana. Na sexta-feira, o Bitcoin caiu abaixo de US$ 60.000 pela primeira vez desde julho. Na manhã de sábado, continuou caindo até US$ 55.130–US$ 55.251 — a mínima em dois anos, cerca de 52% abaixo do recorde de outubro de 2025, perto de US$ 126.000. Então, os compradores entraram e puxaram o preço de volta para perto de US$ 60.000 até a noite de sábado. Enquanto escrevo, neste domingo, ele está oscilando pouco abaixo dos US$ 60 mil, em torno de US$ 59,2 mil na Kraken.
Então, disparou cerca de 9% de volta em direção aos US$ 60 mil. Caso encerrado? Nem de longe. O verdadeiro teste começa na segunda-feira.
Foi isso que realmente aconteceu neste fim de semana. Na sexta-feira, o Bitcoin caiu abaixo de US$ 60.000 pela primeira vez desde julho. Na manhã de sábado, continuou caindo até US$ 55.130–US$ 55.251 — a mínima em dois anos, cerca de 52% abaixo do recorde de outubro de 2025, perto de US$ 126.000. Então, os compradores entraram e puxaram o preço de volta para perto de US$ 60.000 até a noite de sábado. Enquanto escrevo, neste domingo, ele está oscilando pouco abaixo dos US$ 60 mil, em torno de US$ 59,2 mil na Kraken.
73
Artigo
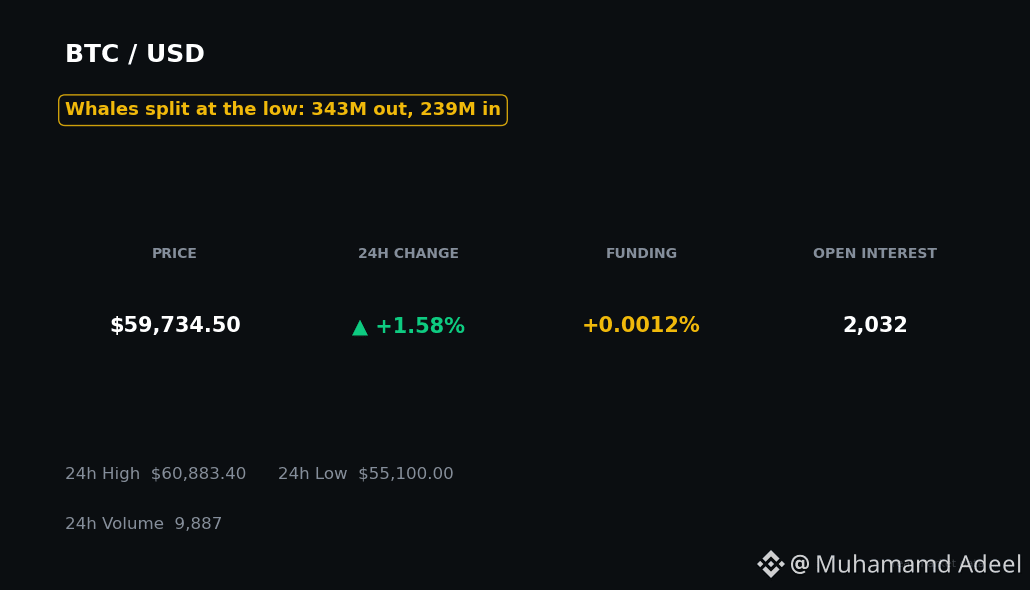
Baleias brigam nos US$ 55 mil — US$ 343 milhões saem, US$ 239 milhões entram. Quem vence?Uma baleia retirou US$ 343 milhões em Bitcoin das exchanges hoje. Outra colocou US$ 239 milhões de volta na Binance. Mesmo dia. Mesmo fundo. Apostas opostas.
Essa é a situação agora — as baleias estão brigando no fundo, e ninguém venceu ainda. Toque em $BTC e confira você mesmo a mínima de US$ 55,1 mil.
**A divisão, em números simples**
Rastreadores on-chain vincularam carteiras identificadas como pertencentes à Abraxas Capital a uma retirada de 5.856 BTC (~US$ 343 milhões) da Binance e da Kraken ao longo de cerca de 8 horas hoje. Horas depois, a Lookonchain informou que duas carteiras desconhecidas depositaram 4.069 BTC (~US$ 239 milhões) na Binance.
Baleias brigam nos US$ 55 mil — US$ 343 milhões saem, US$ 239 milhões entram. Quem vence?
Uma baleia retirou US$ 343 milhões em Bitcoin das exchanges hoje. Outra colocou US$ 239 milhões de volta na Binance. Mesmo dia. Mesmo fundo. Apostas opostas.
Essa é a situação agora — as baleias estão brigando no fundo, e ninguém venceu ainda. Toque em $BTC e confira você mesmo a mínima de US$ 55,1 mil.
**A divisão, em números simples**
Rastreadores on-chain vincularam carteiras identificadas como pertencentes à Abraxas Capital a uma retirada de 5.856 BTC (~US$ 343 milhões) da Binance e da Kraken ao longo de cerca de 8 horas hoje. Horas depois, a Lookonchain informou que duas carteiras desconhecidas depositaram 4.069 BTC (~US$ 239 milhões) na Binance.
Essa é a situação agora — as baleias estão brigando no fundo, e ninguém venceu ainda. Toque em $BTC e confira você mesmo a mínima de US$ 55,1 mil.
**A divisão, em números simples**
Rastreadores on-chain vincularam carteiras identificadas como pertencentes à Abraxas Capital a uma retirada de 5.856 BTC (~US$ 343 milhões) da Binance e da Kraken ao longo de cerca de 8 horas hoje. Horas depois, a Lookonchain informou que duas carteiras desconhecidas depositaram 4.069 BTC (~US$ 239 milhões) na Binance.
BTC+1,36%
IBITETF-4,95%
Artigo
O Fed Acaba de se Dividir em Público — e o Bitcoin Voltou a Subir Acima de US$ 60 MilO Bitcoin deixou um pavio até US$ 55.100 e depois voltou a subir acima de US$ 60 mil — enquanto o Fed discutia consigo mesmo em público.
Esta é a recuperação ou apenas a pausa antes de dezembro?
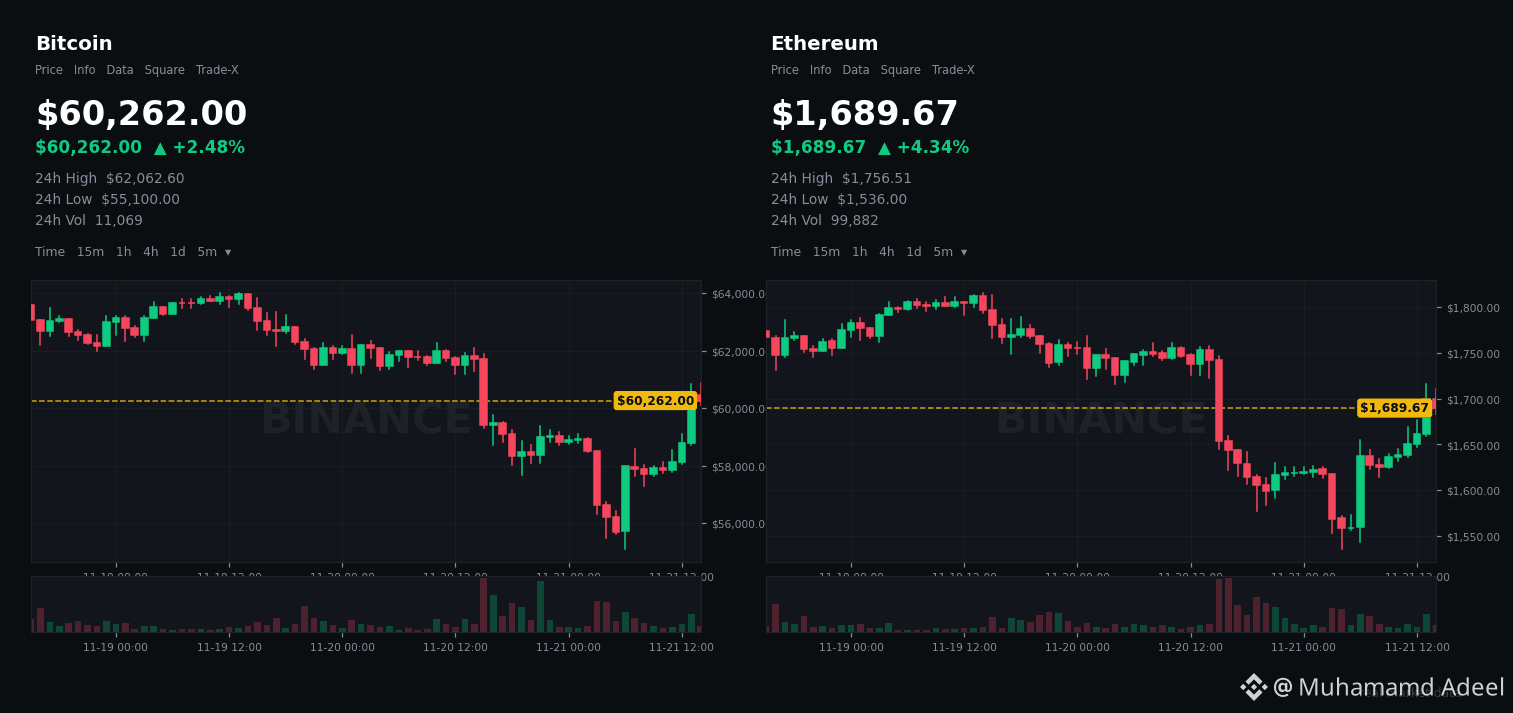
Eis o que realmente aconteceu nas últimas 24 horas. Na noite de sexta-feira, $BTC caiu abaixo de US$ 57 mil pela primeira vez desde setembro de 2024, e US$ 2,4 bilhões em posições de futuros de cripto foram liquidados em 24 horas, em sua maioria posições compradas. O Índice de Medo e Ganância está em 12 — Medo Extremo, pelo nono dia consecutivo.
Então, no sábado, o preço se recuperou. Agora: BTC ~US$ 60.295, ETH ~US$ 1.691. Compraram o pavio até US$ 55 mil. Rápido.
O Fed Acaba de se Dividir em Público — e o Bitcoin Voltou a Subir Acima de US$ 60 Mil
O Bitcoin deixou um pavio até US$ 55.100 e depois voltou a subir acima de US$ 60 mil — enquanto o Fed discutia consigo mesmo em público.
Esta é a recuperação ou apenas a pausa antes de dezembro?
Eis o que realmente aconteceu nas últimas 24 horas. Na noite de sexta-feira, $BTC caiu abaixo de US$ 57 mil pela primeira vez desde setembro de 2024, e US$ 2,4 bilhões em posições de futuros de cripto foram liquidados em 24 horas, em sua maioria posições compradas. O Índice de Medo e Ganância está em 12 — Medo Extremo, pelo nono dia consecutivo.
Então, no sábado, o preço se recuperou. Agora: BTC ~US$ 60.295, ETH ~US$ 1.691. Compraram o pavio até US$ 55 mil. Rápido.
Esta é a recuperação ou apenas a pausa antes de dezembro?
Eis o que realmente aconteceu nas últimas 24 horas. Na noite de sexta-feira, $BTC caiu abaixo de US$ 57 mil pela primeira vez desde setembro de 2024, e US$ 2,4 bilhões em posições de futuros de cripto foram liquidados em 24 horas, em sua maioria posições compradas. O Índice de Medo e Ganância está em 12 — Medo Extremo, pelo nono dia consecutivo.
Então, no sábado, o preço se recuperou. Agora: BTC ~US$ 60.295, ETH ~US$ 1.691. Compraram o pavio até US$ 55 mil. Rápido.
2
Artigo
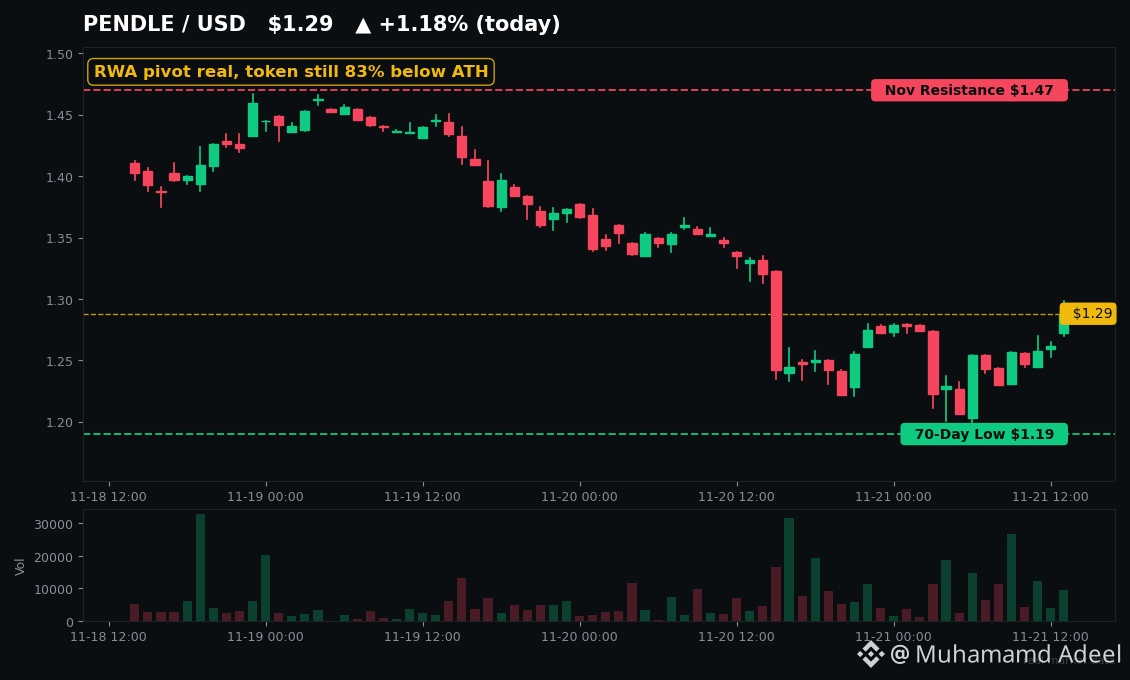
Medo em 12. O $PENDLE caiu 83% — mas sua aposta em ativos do mundo real é realO BTC acaba de atingir US$ 55 mil, e o medo está em 12.
Então, por que o rendimento tokenizado está se reconstruindo discretamente em vez de morrer? Toque em $PENDLE e olhe mais de perto — o gráfico e o negócio contam duas histórias diferentes.
Aqui está a divisão sobre a qual ninguém está falando. A Pendle permite dividir o rendimento em duas partes negociáveis: PT (principal, que fixa uma taxa) e YT (o próprio rendimento). A equipe da New York Life traduziu isso para as finanças tradicionais na semana passada: PT é basicamente um título de cupom zero, e YT é uma parcela composta apenas por juros. Estruturas que Wall Street negocia há décadas — agora on-chain.
Medo em 12. O $PENDLE caiu 83% — mas sua aposta em ativos do mundo real é real
O BTC acaba de atingir US$ 55 mil, e o medo está em 12.
Então, por que o rendimento tokenizado está se reconstruindo discretamente em vez de morrer? Toque em $PENDLE e olhe mais de perto — o gráfico e o negócio contam duas histórias diferentes.
Aqui está a divisão sobre a qual ninguém está falando. A Pendle permite dividir o rendimento em duas partes negociáveis: PT (principal, que fixa uma taxa) e YT (o próprio rendimento). A equipe da New York Life traduziu isso para as finanças tradicionais na semana passada: PT é basicamente um título de cupom zero, e YT é uma parcela composta apenas por juros. Estruturas que Wall Street negocia há décadas — agora on-chain.
Então, por que o rendimento tokenizado está se reconstruindo discretamente em vez de morrer? Toque em $PENDLE e olhe mais de perto — o gráfico e o negócio contam duas histórias diferentes.
Aqui está a divisão sobre a qual ninguém está falando. A Pendle permite dividir o rendimento em duas partes negociáveis: PT (principal, que fixa uma taxa) e YT (o próprio rendimento). A equipe da New York Life traduziu isso para as finanças tradicionais na semana passada: PT é basicamente um título de cupom zero, e YT é uma parcela composta apenas por juros. Estruturas que Wall Street negocia há décadas — agora on-chain.
1
Artigo
Ver tradução
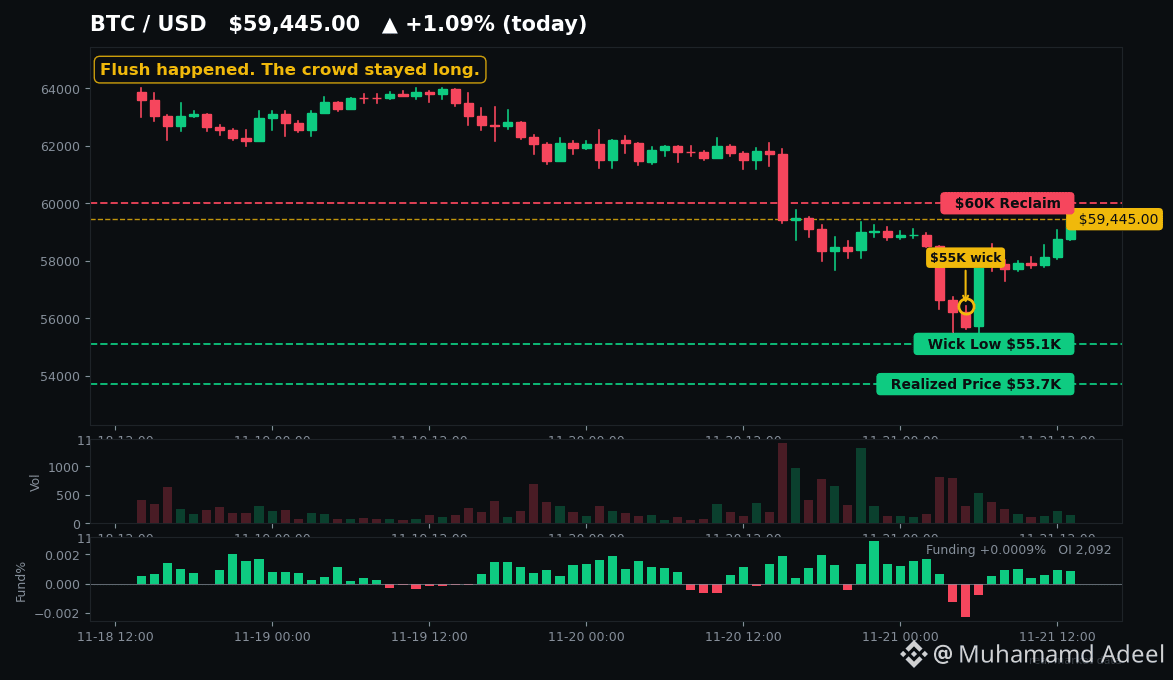
$2.4B Liquidated — And the Crowd Is STILL Long$2.4 billion just got wiped out in 24 hours. $BTC smashed through $60K on Friday, wicked to $55,100 on Saturday — its lowest since September 2024.
You'd think that flush cleaned the house. It didn't. And that's the most important thing on the board right now.
**What actually got flushed**
CoinGlass put total crypto liquidations at $2.40B in 24h, roughly 9 out of every 10 dollars from longs. BTC alone lost over $1B, $ETH another $545M, and the single biggest hit was a $51.7M BTC long on Binance. About 343,000 traders got liquidated.
Funding even flipped negative — Binance settled at -0.0061% at midnight UTC, its lowest since June — before snapping back to basically zero within hours.
**Here's the twist nobody's pricing**
Open interest in dollar terms fell hard, sure. But in actual BTC terms? Binance OI went from 97,204 BTC to 96,165 BTC. That's -1.1%. Across the market, BTC-denominated OI is down only ~4.7% since Nov 6 while price fell ~24%. Most of the "flush" is just price math, not positions closing.
And retail? Still 71%+ of Binance accounts are long. Top traders have been cutting (their long ratio fell from 1.95 to 1.68), but the crowd leaned IN. Meanwhile Hyperliquid's biggest whales are net short. Retail long, smart money short — into a falling knife.
**So what does this really mean?**
The bounce off $55K is already squeezing shorts — the last 4 hours of liquidations flipped to shorts. That's short-covering, not fresh spot buying. The spot bid is still missing: US spot BTC ETFs bled $582.3M on Nov 19 alone (IBIT's worst day ever), and stablecoin supply is shrinking ~$16-17B a month. Money is leaving, not rotating in.
History is honest about this setup: flushes deep in a drawdown with negative funding did mark local bottoms in Feb and Jun 2026 — but both later failed, and a retest was the norm, not the exception. Glassnode's own read: leverage above $62K cleared, but realized losses so far are only ~28% of February's bottom. Capitulation started. It's not proven complete.
**Levels that decide it**
Tap $BTC and check the $55,100 wick low — hold it and the squeeze can run toward the $60K reclaim, where short liquidations start stacking up. Lose it, and the next magnet is realized price near $53.7K, the average holder's cost basis. Wintermute's flip level is higher still: reclaim the 200-week average near $68K with ETF inflows returning. And $SOL traders — same story, beta version: flush first, questions later.
One more date: Nov 27 brings ~$6.2B+ of Deribit options expiry with max pain at $73K. That's ~20% above spot. It's not a magnet — it's a reminder of how far expectations have fallen.
The flush happened. The crowd stayed. Until positioning actually resets — or spot buyers show up — treat every bounce as guilty until proven innocent.
#Bitcoin #CryptoTrading
Not financial advice. DYOR.
$2.4B Liquidated — And the Crowd Is STILL Long
$2.4 billion just got wiped out in 24 hours. $BTC smashed through $60K on Friday, wicked to $55,100 on Saturday — its lowest since September 2024.
You'd think that flush cleaned the house. It didn't. And that's the most important thing on the board right now.
**What actually got flushed**
CoinGlass put total crypto liquidations at $2.40B in 24h, roughly 9 out of every 10 dollars from longs. BTC alone lost over $1B, $ETH another $545M, and the single biggest hit was a $51.7M BTC long on Binance. About 343,000 traders got liquidated.
Funding even flipped negative — Binance settled at -0.0061% at midnight UTC, its lowest since June — before snapping back to basically zero within hours.
**Here's the twist nobody's pricing**
Open interest in dollar terms fell hard, sure. But in actual BTC terms? Binance OI went from 97,204 BTC to 96,165 BTC. That's -1.1%. Across the market, BTC-denominated OI is down only ~4.7% since Nov 6 while price fell ~24%. Most of the "flush" is just price math, not positions closing.
And retail? Still 71%+ of Binance accounts are long. Top traders have been cutting (their long ratio fell from 1.95 to 1.68), but the crowd leaned IN. Meanwhile Hyperliquid's biggest whales are net short. Retail long, smart money short — into a falling knife.
**So what does this really mean?**
The bounce off $55K is already squeezing shorts — the last 4 hours of liquidations flipped to shorts. That's short-covering, not fresh spot buying. The spot bid is still missing: US spot BTC ETFs bled $582.3M on Nov 19 alone (IBIT's worst day ever), and stablecoin supply is shrinking ~$16-17B a month. Money is leaving, not rotating in.
History is honest about this setup: flushes deep in a drawdown with negative funding did mark local bottoms in Feb and Jun 2026 — but both later failed, and a retest was the norm, not the exception. Glassnode's own read: leverage above $62K cleared, but realized losses so far are only ~28% of February's bottom. Capitulation started. It's not proven complete.
**Levels that decide it**
Tap $BTC and check the $55,100 wick low — hold it and the squeeze can run toward the $60K reclaim, where short liquidations start stacking up. Lose it, and the next magnet is realized price near $53.7K, the average holder's cost basis. Wintermute's flip level is higher still: reclaim the 200-week average near $68K with ETF inflows returning. And $SOL traders — same story, beta version: flush first, questions later.
One more date: Nov 27 brings ~$6.2B+ of Deribit options expiry with max pain at $73K. That's ~20% above spot. It's not a magnet — it's a reminder of how far expectations have fallen.
The flush happened. The crowd stayed. Until positioning actually resets — or spot buyers show up — treat every bounce as guilty until proven innocent.
#Bitcoin #CryptoTrading
Not financial advice. DYOR.
You'd think that flush cleaned the house. It didn't. And that's the most important thing on the board right now.
**What actually got flushed**
CoinGlass put total crypto liquidations at $2.40B in 24h, roughly 9 out of every 10 dollars from longs. BTC alone lost over $1B, $ETH another $545M, and the single biggest hit was a $51.7M BTC long on Binance. About 343,000 traders got liquidated.
Funding even flipped negative — Binance settled at -0.0061% at midnight UTC, its lowest since June — before snapping back to basically zero within hours.
**Here's the twist nobody's pricing**
Open interest in dollar terms fell hard, sure. But in actual BTC terms? Binance OI went from 97,204 BTC to 96,165 BTC. That's -1.1%. Across the market, BTC-denominated OI is down only ~4.7% since Nov 6 while price fell ~24%. Most of the "flush" is just price math, not positions closing.
And retail? Still 71%+ of Binance accounts are long. Top traders have been cutting (their long ratio fell from 1.95 to 1.68), but the crowd leaned IN. Meanwhile Hyperliquid's biggest whales are net short. Retail long, smart money short — into a falling knife.
**So what does this really mean?**
The bounce off $55K is already squeezing shorts — the last 4 hours of liquidations flipped to shorts. That's short-covering, not fresh spot buying. The spot bid is still missing: US spot BTC ETFs bled $582.3M on Nov 19 alone (IBIT's worst day ever), and stablecoin supply is shrinking ~$16-17B a month. Money is leaving, not rotating in.
History is honest about this setup: flushes deep in a drawdown with negative funding did mark local bottoms in Feb and Jun 2026 — but both later failed, and a retest was the norm, not the exception. Glassnode's own read: leverage above $62K cleared, but realized losses so far are only ~28% of February's bottom. Capitulation started. It's not proven complete.
**Levels that decide it**
Tap $BTC and check the $55,100 wick low — hold it and the squeeze can run toward the $60K reclaim, where short liquidations start stacking up. Lose it, and the next magnet is realized price near $53.7K, the average holder's cost basis. Wintermute's flip level is higher still: reclaim the 200-week average near $68K with ETF inflows returning. And $SOL traders — same story, beta version: flush first, questions later.
One more date: Nov 27 brings ~$6.2B+ of Deribit options expiry with max pain at $73K. That's ~20% above spot. It's not a magnet — it's a reminder of how far expectations have fallen.
The flush happened. The crowd stayed. Until positioning actually resets — or spot buyers show up — treat every bounce as guilty until proven innocent.
#Bitcoin #CryptoTrading
Not financial advice. DYOR.
Artigo
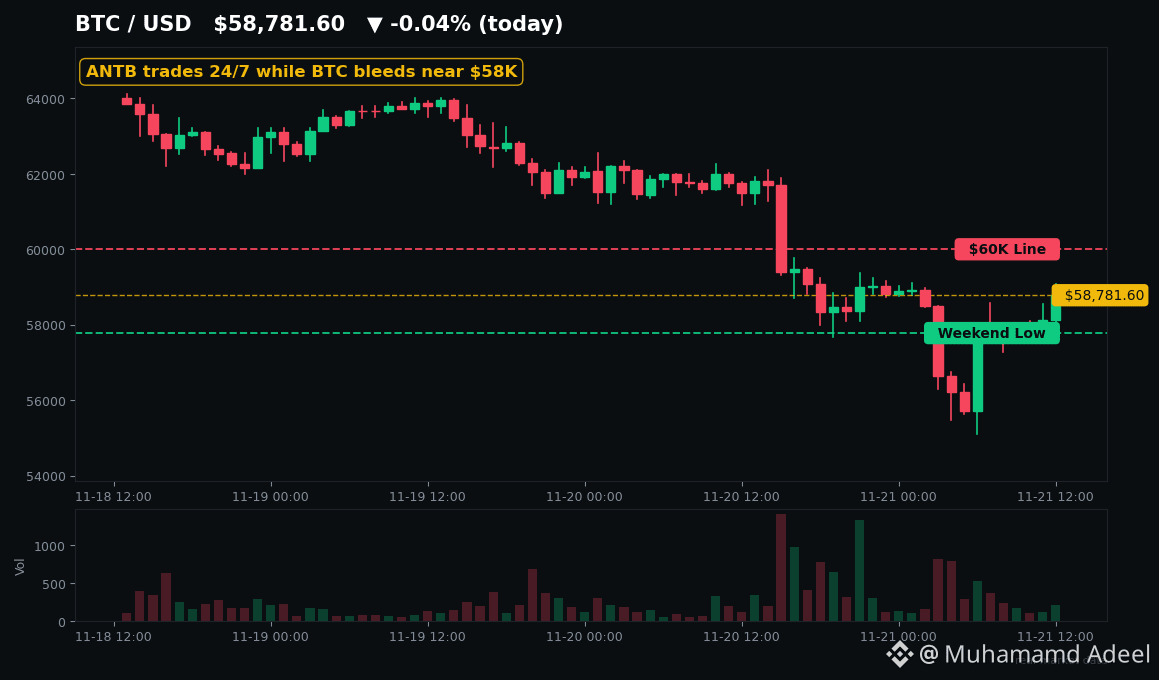
US$ 500 milhões subscritos, 2.957 ações entregues — $ANTB está disponívelUS$ 500 milhões subscritos. 2.957 ações entregues. Boas-vindas ao $ANTB.
Não é erro de digitação. A campanha de IPO da Anthropic na Binance Wallet atingiu o limite de 500 milhões de USDC em poucas horas, em 18 de novembro — e depois reembolsou cada centavo, pois só conseguiu garantir cerca de 2.957 ações tokenizadas. Todos receberam seus USDC de volta, além de um airdrop de US$ 1 milhão $ANTB como pedido de desculpas. E agora o próprio token está disponível na Binance Spot. Então, o que você está realmente negociando?
**O que acabou de ser listado**
A Anthropic precificou seu IPO na Nasdaq a US$ 83 em 18 de novembro — acima da faixa de US$ 70 a US$ 78 — e levantou cerca de US$ 81,3 bilhões em um dos maiores IPOs da história. A ANT abriu a US$ 111,50, fechou o primeiro dia a US$ 97,17 e depois recuou para US$ 88,91 na sexta-feira. Em 20 de novembro, a Binance listou ANTB/USDT na BNB Smart Chain com taxa zero para makers até 1º de dezembro. Toque em $ANTB e você verá que está sendo negociado na faixa de US$ 87 a US$ 88 neste fim de semana, com cerca de US$ 16 a 17 milhões em volume na Binance em 24 horas — enquanto a Nasdaq está fechada. Essa é a proposta: exposição à Anthropic, 24 horas por dia, 7 dias por semana, sem precisar de uma conta em uma corretora.
US$ 500 milhões subscritos, 2.957 ações entregues — $ANTB está disponível
US$ 500 milhões subscritos. 2.957 ações entregues. Boas-vindas ao $ANTB .
Não é erro de digitação. A campanha de IPO da Anthropic na Binance Wallet atingiu o limite de 500 milhões de USDC em poucas horas, em 18 de novembro — e depois reembolsou cada centavo, pois só conseguiu garantir cerca de 2.957 ações tokenizadas. Todos receberam seus USDC de volta, além de um airdrop de US$ 1 milhão $ANTB como pedido de desculpas. E agora o próprio token está disponível na Binance Spot. Então, o que você está realmente negociando?
**O que acabou de ser listado**
A Anthropic precificou seu IPO na Nasdaq a US$ 83 em 18 de novembro — acima da faixa de US$ 70 a US$ 78 — e levantou cerca de US$ 81,3 bilhões em um dos maiores IPOs da história. A ANT abriu a US$ 111,50, fechou o primeiro dia a US$ 97,17 e depois recuou para US$ 88,91 na sexta-feira. Em 20 de novembro, a Binance listou ANTB/USDT na BNB Smart Chain com taxa zero para makers até 1º de dezembro. Toque em $ANTB e você verá que está sendo negociado na faixa de US$ 87 a US$ 88 neste fim de semana, com cerca de US$ 16 a 17 milhões em volume na Binance em 24 horas — enquanto a Nasdaq está fechada. Essa é a proposta: exposição à Anthropic, 24 horas por dia, 7 dias por semana, sem precisar de uma conta em uma corretora.
Não é erro de digitação. A campanha de IPO da Anthropic na Binance Wallet atingiu o limite de 500 milhões de USDC em poucas horas, em 18 de novembro — e depois reembolsou cada centavo, pois só conseguiu garantir cerca de 2.957 ações tokenizadas. Todos receberam seus USDC de volta, além de um airdrop de US$ 1 milhão $ANTB como pedido de desculpas. E agora o próprio token está disponível na Binance Spot. Então, o que você está realmente negociando?
**O que acabou de ser listado**
A Anthropic precificou seu IPO na Nasdaq a US$ 83 em 18 de novembro — acima da faixa de US$ 70 a US$ 78 — e levantou cerca de US$ 81,3 bilhões em um dos maiores IPOs da história. A ANT abriu a US$ 111,50, fechou o primeiro dia a US$ 97,17 e depois recuou para US$ 88,91 na sexta-feira. Em 20 de novembro, a Binance listou ANTB/USDT na BNB Smart Chain com taxa zero para makers até 1º de dezembro. Toque em $ANTB e você verá que está sendo negociado na faixa de US$ 87 a US$ 88 neste fim de semana, com cerca de US$ 16 a 17 milhões em volume na Binance em 24 horas — enquanto a Nasdaq está fechada. Essa é a proposta: exposição à Anthropic, 24 horas por dia, 7 dias por semana, sem precisar de uma conta em uma corretora.
9
Artigo
Ver tradução
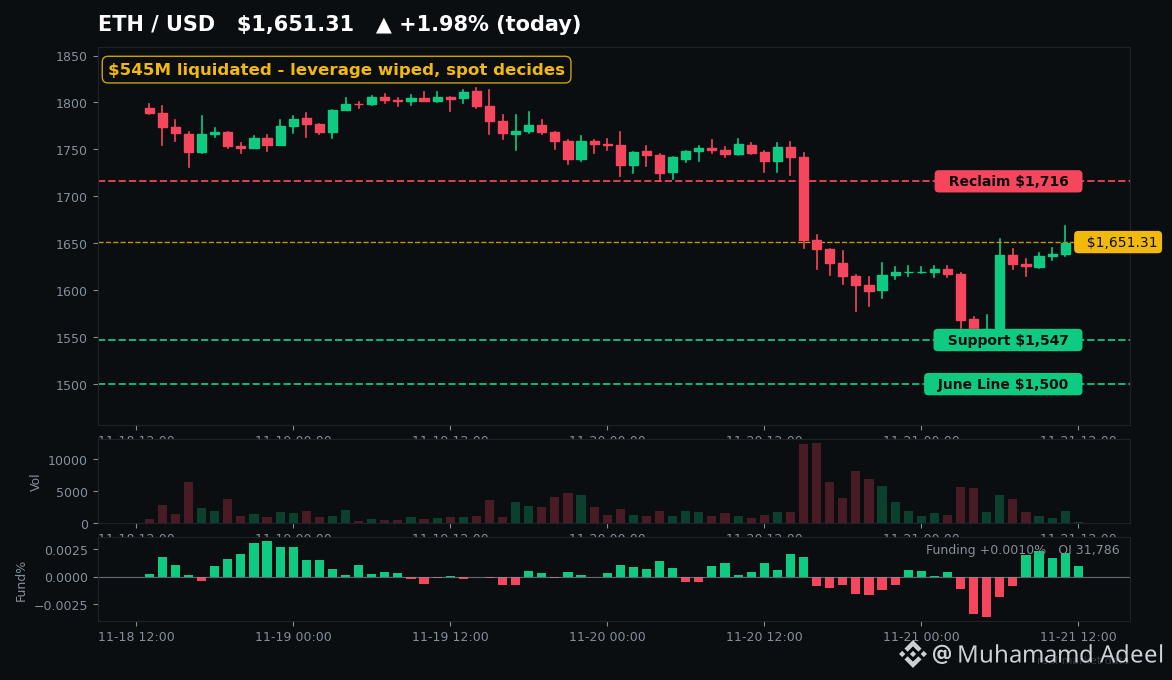
ETH Liquidated $545M in 24h. Is $1,536 the Flush or the Start?$545M of $ETH longs got wiped in 24 hours. Price wicked to $1,536 — and held. So was that the flush, or just the first leg?
Here's the setup. Early Saturday, CoinGlass showed ~$542–546M of Ether futures liquidated in 24h, roughly 90% longs, inside a $2.4B market-wide wipeout. Open interest dropped ~9% to ~$20.7B and funding flipped negative (~-0.014%). Translation: the leverage that was propping this market up is gone. Tap $ETH and look at the chart — that wick to $1,536 stopped just $33 above June's ~$1,505 low, while Bitcoin broke its own 2026 low in the same session. ETH held its line. BTC didn't.
Now here's what makes this interesting. While traders got liquidated, stakers didn't blink. The entry queue is still ~830–837K ETH (Nov 20–21 reads) versus an exit queue of only ~150–164K — five times more ETH waiting to get IN than out. And stETH just posted its largest single-day exchange outflow since May 30 (4,186 tokens, Santiment). Meanwhile Base did 12.6M transactions yesterday against Arbitrum's 1.66M — the L2s are busy even as the token bleeds. Check $ARB against that activity and tell me the usage story is dead.
The ETH/BTC ratio is where the pain really shows: ~0.0283, down 15.9% in a year, below its 200-day average. Tap $BTC and compare the two charts side by side — ETH is still the weaker major, and that hasn't changed.
Levels that decide this: $1,547 is the support everyone is watching (daily close below it opens the $1,490 area, then the $1,500 June line). Lose $1,500 on a closing basis and analysts like CryptoPatel flag $1,400, then $1,000. Reclaim $1,716 and the week's breakdown is undone. History is honest both ways: June 2022's flush bounced 100% — then FTX made a lower low. April 2025's fear print also went lower before the real bottom. Flushes clear leverage; they don't guarantee bottoms.
The bear case is real: Thursday's final ETF print was -$131.2M out (Friday's is still incomplete at -$13.2M across 8 of 11 funds, BlackRock pending), exchanges took a net +$267.7M of ETH in 24h, and December's FOMC hike is ~95% priced. Spot selling can continue with zero leverage left to liquidate.
So the question for Monday: does $1,536 hold when the ETF bid comes back — or does spot finish what leverage started?
#Ethereum #Crypto
Not financial advice. DYOR.
ETH Liquidated $545M in 24h. Is $1,536 the Flush or the Start?
$545M of $ETH longs got wiped in 24 hours. Price wicked to $1,536 — and held. So was that the flush, or just the first leg?
Here's the setup. Early Saturday, CoinGlass showed ~$542–546M of Ether futures liquidated in 24h, roughly 90% longs, inside a $2.4B market-wide wipeout. Open interest dropped ~9% to ~$20.7B and funding flipped negative (~-0.014%). Translation: the leverage that was propping this market up is gone. Tap $ETH and look at the chart — that wick to $1,536 stopped just $33 above June's ~$1,505 low, while Bitcoin broke its own 2026 low in the same session. ETH held its line. BTC didn't.
Now here's what makes this interesting. While traders got liquidated, stakers didn't blink. The entry queue is still ~830–837K ETH (Nov 20–21 reads) versus an exit queue of only ~150–164K — five times more ETH waiting to get IN than out. And stETH just posted its largest single-day exchange outflow since May 30 (4,186 tokens, Santiment). Meanwhile Base did 12.6M transactions yesterday against Arbitrum's 1.66M — the L2s are busy even as the token bleeds. Check $ARB against that activity and tell me the usage story is dead.
The ETH/BTC ratio is where the pain really shows: ~0.0283, down 15.9% in a year, below its 200-day average. Tap $BTC and compare the two charts side by side — ETH is still the weaker major, and that hasn't changed.
Levels that decide this: $1,547 is the support everyone is watching (daily close below it opens the $1,490 area, then the $1,500 June line). Lose $1,500 on a closing basis and analysts like CryptoPatel flag $1,400, then $1,000. Reclaim $1,716 and the week's breakdown is undone. History is honest both ways: June 2022's flush bounced 100% — then FTX made a lower low. April 2025's fear print also went lower before the real bottom. Flushes clear leverage; they don't guarantee bottoms.
The bear case is real: Thursday's final ETF print was -$131.2M out (Friday's is still incomplete at -$13.2M across 8 of 11 funds, BlackRock pending), exchanges took a net +$267.7M of ETH in 24h, and December's FOMC hike is ~95% priced. Spot selling can continue with zero leverage left to liquidate.
So the question for Monday: does $1,536 hold when the ETF bid comes back — or does spot finish what leverage started?
#Ethereum #Crypto
Not financial advice. DYOR.
Here's the setup. Early Saturday, CoinGlass showed ~$542–546M of Ether futures liquidated in 24h, roughly 90% longs, inside a $2.4B market-wide wipeout. Open interest dropped ~9% to ~$20.7B and funding flipped negative (~-0.014%). Translation: the leverage that was propping this market up is gone. Tap $ETH and look at the chart — that wick to $1,536 stopped just $33 above June's ~$1,505 low, while Bitcoin broke its own 2026 low in the same session. ETH held its line. BTC didn't.
Now here's what makes this interesting. While traders got liquidated, stakers didn't blink. The entry queue is still ~830–837K ETH (Nov 20–21 reads) versus an exit queue of only ~150–164K — five times more ETH waiting to get IN than out. And stETH just posted its largest single-day exchange outflow since May 30 (4,186 tokens, Santiment). Meanwhile Base did 12.6M transactions yesterday against Arbitrum's 1.66M — the L2s are busy even as the token bleeds. Check $ARB against that activity and tell me the usage story is dead.
The ETH/BTC ratio is where the pain really shows: ~0.0283, down 15.9% in a year, below its 200-day average. Tap $BTC and compare the two charts side by side — ETH is still the weaker major, and that hasn't changed.
Levels that decide this: $1,547 is the support everyone is watching (daily close below it opens the $1,490 area, then the $1,500 June line). Lose $1,500 on a closing basis and analysts like CryptoPatel flag $1,400, then $1,000. Reclaim $1,716 and the week's breakdown is undone. History is honest both ways: June 2022's flush bounced 100% — then FTX made a lower low. April 2025's fear print also went lower before the real bottom. Flushes clear leverage; they don't guarantee bottoms.
The bear case is real: Thursday's final ETF print was -$131.2M out (Friday's is still incomplete at -$13.2M across 8 of 11 funds, BlackRock pending), exchanges took a net +$267.7M of ETH in 24h, and December's FOMC hike is ~95% priced. Spot selling can continue with zero leverage left to liquidate.
So the question for Monday: does $1,536 hold when the ETF bid comes back — or does spot finish what leverage started?
#Ethereum #Crypto
Not financial advice. DYOR.
2
Artigo
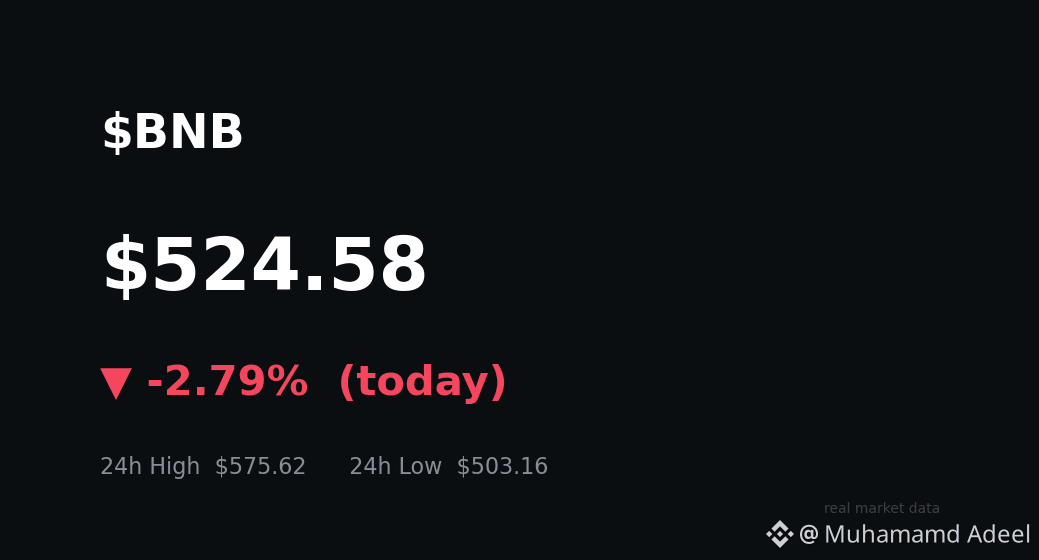
O $BNB Chegou a US$ 503 com o Medo em 12 — US$ 500 é o Nível Decisivo do Fim de Semana?O índice de medo está em 12, e $BNB acabou de marcar US$ 503,16. O piso de US$ 566 que todos acompanharam a semana inteira já era — será que US$ 500 é o nível que vai decidir este fim de semana?
Vamos ser sinceros sobre o que aconteceu. O BNB está sendo negociado perto de US$ 525, em queda de aproximadamente 8% no último dia, e caiu mais do que o mercado em geral. $BTC caiu US$ 60 mil na sexta-feira e está perto de US$ 58 mil, então esta não é uma história só do BNB. Mas o BNB teve desempenho inferior, e essa diferença é o que importa.
Aqui está a tensão que ninguém pode ignorar. A maioria ainda aposta na alta mesmo com a fraqueza — cerca de 70% das contas estão compradas, enquanto o interesse em aberto diminui e predominam as liquidações de posições compradas. O RSI está perto de 19, em território de sobrevenda extrema, e o preço está abaixo de todas as principais médias móveis. O mercado pode se recuperar após ficar sobrevendido. Mas também pode continuar sobrevendido. Em qual cenário você está apostando?
O $BNB Chegou a US$ 503 com o Medo em 12 — US$ 500 é o Nível Decisivo do Fim de Semana?
O índice de medo está em 12, e $BNB acabou de marcar US$ 503,16. O piso de US$ 566 que todos acompanharam a semana inteira já era — será que US$ 500 é o nível que vai decidir este fim de semana?
Vamos ser sinceros sobre o que aconteceu. O BNB está sendo negociado perto de US$ 525, em queda de aproximadamente 8% no último dia, e caiu mais do que o mercado em geral. $BTC caiu US$ 60 mil na sexta-feira e está perto de US$ 58 mil, então esta não é uma história só do BNB. Mas o BNB teve desempenho inferior, e essa diferença é o que importa.
Aqui está a tensão que ninguém pode ignorar. A maioria ainda aposta na alta mesmo com a fraqueza — cerca de 70% das contas estão compradas, enquanto o interesse em aberto diminui e predominam as liquidações de posições compradas. O RSI está perto de 19, em território de sobrevenda extrema, e o preço está abaixo de todas as principais médias móveis. O mercado pode se recuperar após ficar sobrevendido. Mas também pode continuar sobrevendido. Em qual cenário você está apostando?
Vamos ser sinceros sobre o que aconteceu. O BNB está sendo negociado perto de US$ 525, em queda de aproximadamente 8% no último dia, e caiu mais do que o mercado em geral. $BTC caiu US$ 60 mil na sexta-feira e está perto de US$ 58 mil, então esta não é uma história só do BNB. Mas o BNB teve desempenho inferior, e essa diferença é o que importa.
Aqui está a tensão que ninguém pode ignorar. A maioria ainda aposta na alta mesmo com a fraqueza — cerca de 70% das contas estão compradas, enquanto o interesse em aberto diminui e predominam as liquidações de posições compradas. O RSI está perto de 19, em território de sobrevenda extrema, e o preço está abaixo de todas as principais médias móveis. O mercado pode se recuperar após ficar sobrevendido. Mas também pode continuar sobrevendido. Em qual cenário você está apostando?
5
Artigo
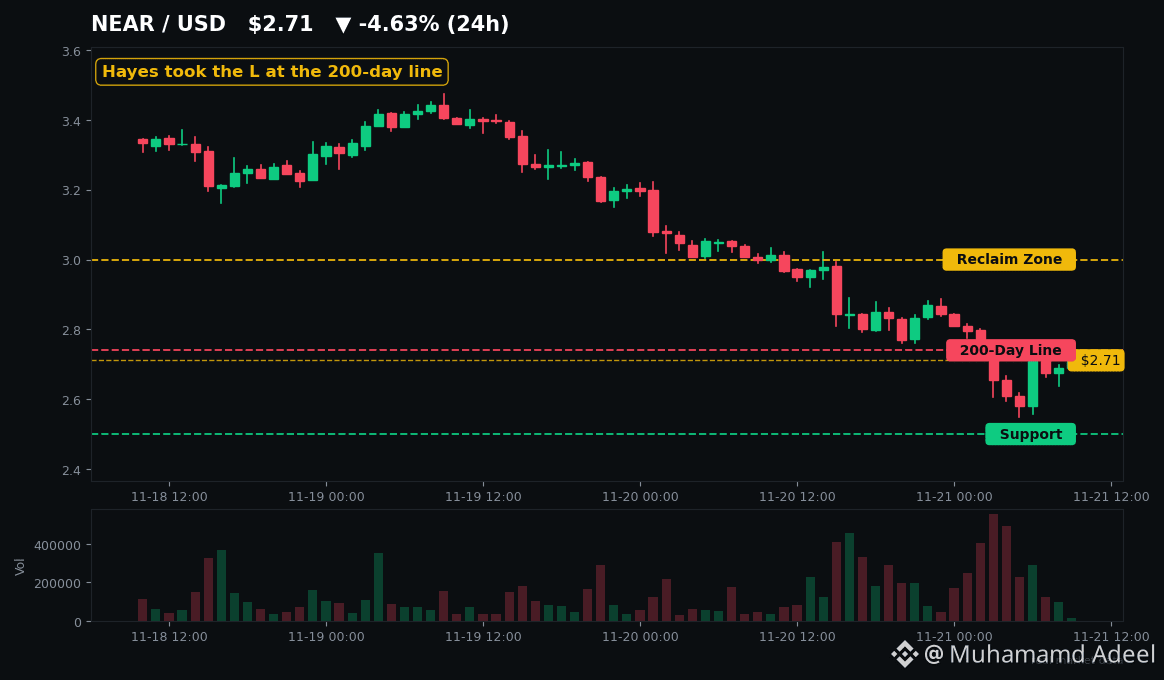
Hayes previu que a $NEAR chegaria a US$ 6. Quatro dias depois, aceitou a derrota.Há quatro dias, Arthur Hayes previu que $NEAR chegaria a US$ 6. Hoje, está dizendo que aceitou a derrota.
É assim que este mercado humilha as pessoas tão rápido. E o gráfico acabou de fazer algo que não fazia há três meses.
**O que acabou de acontecer**
$NEAR está sendo negociado em torno de US$ 2,71, com queda de cerca de 11% em 24 horas e aproximadamente 49% em um mês. Acabou de cair abaixo da média de 200 dias, em US$ 2,74 — o primeiro teste dessa linha após 94 sessões consecutivas acima dela. A média de 50 dias está bem acima, em US$ 4,33. O RSI diário está perto de 29, em território de sobrevenda profunda.
Hayes previu que a $NEAR chegaria a US$ 6. Quatro dias depois, aceitou a derrota.
Há quatro dias, Arthur Hayes previu que $NEAR chegaria a US$ 6. Hoje, está dizendo que aceitou a derrota.
É assim que este mercado humilha as pessoas tão rápido. E o gráfico acabou de fazer algo que não fazia há três meses.
**O que acabou de acontecer**
$NEAR está sendo negociado em torno de US$ 2,71, com queda de cerca de 11% em 24 horas e aproximadamente 49% em um mês. Acabou de cair abaixo da média de 200 dias, em US$ 2,74 — o primeiro teste dessa linha após 94 sessões consecutivas acima dela. A média de 50 dias está bem acima, em US$ 4,33. O RSI diário está perto de 29, em território de sobrevenda profunda.
É assim que este mercado humilha as pessoas tão rápido. E o gráfico acabou de fazer algo que não fazia há três meses.
**O que acabou de acontecer**
$NEAR está sendo negociado em torno de US$ 2,71, com queda de cerca de 11% em 24 horas e aproximadamente 49% em um mês. Acabou de cair abaixo da média de 200 dias, em US$ 2,74 — o primeiro teste dessa linha após 94 sessões consecutivas acima dela. A média de 50 dias está bem acima, em US$ 4,33. O RSI diário está perto de 29, em território de sobrevenda profunda.
6
Artigo
Ver tradução
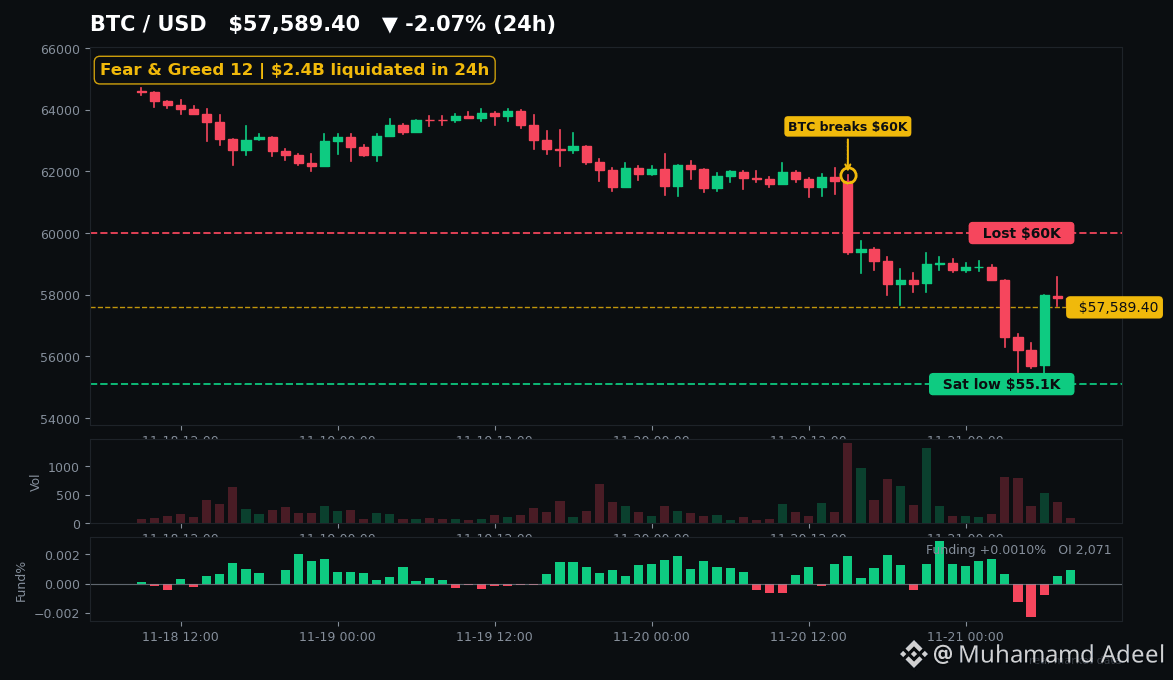
$2.4B Liquidated, BTC Tagged $55K — Fear Is at 12$2.4 billion in leveraged bets got wiped in 24 hours. Bitcoin wicked to $55,100 this morning — its lowest print since September 2024. Tap $BTC and look at that wick yourself.
**The flush**
BTC is bouncing near $57,600 as I write, but the damage is done: CoinGlass counts $2.40B liquidated in 24h — over $1B in BTC alone, $545M in ETH, biggest single hit a $51.7M long. Fear & Greed sits at 12 (alternative.me), the 9th straight day of Extreme Fear. Here's what this really means: leverage just died. Open interest fell while volume spiked — that's longs being flushed, not fresh shorts piling in. Flushes end the leverage problem. They don't end spot selling.
**Wall Street did this**
Crypto didn't break itself on Friday — it got dragged. The Nasdaq closed -5.28%, the S&P 500 -3.70%, and Nvidia crashed -14% to $125.53 after Reuters reported the SEC is probing its accounting (a probe, not a finding of wrongdoing). BTC's 40-day correlation with the Nasdaq 100 is running near 0.69. Check $ETH: it lost $1,600 and printed $1,536 at the lows. When chips bleed, crypto bleeds with them.
**The missing bid**
Friday's ETF numbers still aren't final — BlackRock's IBIT hasn't reported yet, so anyone quoting a Nov 20 "total" is guessing. The partials we do have are ugly: FBTC -$72.4M, GBTC -$32.8M. And it's not just BTC: US spot XRP ETF assets just slipped below $1B (~$990M) even after ~$1.78B of cumulative inflows, with $XRP near $0.88. It's the weekend — no ETF bid until Monday. The number that matters hasn't even printed.
**The hacker headline**
Wallets tied to October's Binance theft moved roughly $594M in ETH on Nov 19-20. Scary headline — but moved is not sold. Only about $70M has actually been swapped so far, and the original BTC stash hasn't budged. Until those wallets send to exchange-tagged addresses, this is laundering noise, not order-book supply.
**Levels that decide it**
$55,100 is the line. Hold it and reclaim $60K-$62K, and this turns into a short-covering squeeze. Lose $55,100 and the next test is the low-$53K zone. ETH needs $1,600 back; XRP needs to defend the high-$0.80s. Monday's IBIT print tells you if institutions are done selling.
Not financial advice. DYOR.
$2.4B Liquidated, BTC Tagged $55K — Fear Is at 12
$2.4 billion in leveraged bets got wiped in 24 hours. Bitcoin wicked to $55,100 this morning — its lowest print since September 2024. Tap $BTC and look at that wick yourself.
**The flush**
BTC is bouncing near $57,600 as I write, but the damage is done: CoinGlass counts $2.40B liquidated in 24h — over $1B in BTC alone, $545M in ETH, biggest single hit a $51.7M long. Fear & Greed sits at 12 (alternative.me), the 9th straight day of Extreme Fear. Here's what this really means: leverage just died. Open interest fell while volume spiked — that's longs being flushed, not fresh shorts piling in. Flushes end the leverage problem. They don't end spot selling.
**Wall Street did this**
Crypto didn't break itself on Friday — it got dragged. The Nasdaq closed -5.28%, the S&P 500 -3.70%, and Nvidia crashed -14% to $125.53 after Reuters reported the SEC is probing its accounting (a probe, not a finding of wrongdoing). BTC's 40-day correlation with the Nasdaq 100 is running near 0.69. Check $ETH : it lost $1,600 and printed $1,536 at the lows. When chips bleed, crypto bleeds with them.
**The missing bid**
Friday's ETF numbers still aren't final — BlackRock's IBIT hasn't reported yet, so anyone quoting a Nov 20 "total" is guessing. The partials we do have are ugly: FBTC -$72.4M, GBTC -$32.8M. And it's not just BTC: US spot XRP ETF assets just slipped below $1B (~$990M) even after ~$1.78B of cumulative inflows, with $XRP near $0.88. It's the weekend — no ETF bid until Monday. The number that matters hasn't even printed.
**The hacker headline**
Wallets tied to October's Binance theft moved roughly $594M in ETH on Nov 19-20. Scary headline — but moved is not sold. Only about $70M has actually been swapped so far, and the original BTC stash hasn't budged. Until those wallets send to exchange-tagged addresses, this is laundering noise, not order-book supply.
**Levels that decide it**
$55,100 is the line. Hold it and reclaim $60K-$62K, and this turns into a short-covering squeeze. Lose $55,100 and the next test is the low-$53K zone. ETH needs $1,600 back; XRP needs to defend the high-$0.80s. Monday's IBIT print tells you if institutions are done selling.
Not financial advice. DYOR.
**The flush**
BTC is bouncing near $57,600 as I write, but the damage is done: CoinGlass counts $2.40B liquidated in 24h — over $1B in BTC alone, $545M in ETH, biggest single hit a $51.7M long. Fear & Greed sits at 12 (alternative.me), the 9th straight day of Extreme Fear. Here's what this really means: leverage just died. Open interest fell while volume spiked — that's longs being flushed, not fresh shorts piling in. Flushes end the leverage problem. They don't end spot selling.
**Wall Street did this**
Crypto didn't break itself on Friday — it got dragged. The Nasdaq closed -5.28%, the S&P 500 -3.70%, and Nvidia crashed -14% to $125.53 after Reuters reported the SEC is probing its accounting (a probe, not a finding of wrongdoing). BTC's 40-day correlation with the Nasdaq 100 is running near 0.69. Check $ETH : it lost $1,600 and printed $1,536 at the lows. When chips bleed, crypto bleeds with them.
**The missing bid**
Friday's ETF numbers still aren't final — BlackRock's IBIT hasn't reported yet, so anyone quoting a Nov 20 "total" is guessing. The partials we do have are ugly: FBTC -$72.4M, GBTC -$32.8M. And it's not just BTC: US spot XRP ETF assets just slipped below $1B (~$990M) even after ~$1.78B of cumulative inflows, with $XRP near $0.88. It's the weekend — no ETF bid until Monday. The number that matters hasn't even printed.
**The hacker headline**
Wallets tied to October's Binance theft moved roughly $594M in ETH on Nov 19-20. Scary headline — but moved is not sold. Only about $70M has actually been swapped so far, and the original BTC stash hasn't budged. Until those wallets send to exchange-tagged addresses, this is laundering noise, not order-book supply.
**Levels that decide it**
$55,100 is the line. Hold it and reclaim $60K-$62K, and this turns into a short-covering squeeze. Lose $55,100 and the next test is the low-$53K zone. ETH needs $1,600 back; XRP needs to defend the high-$0.80s. Monday's IBIT print tells you if institutions are done selling.
Not financial advice. DYOR.
3
Artigo
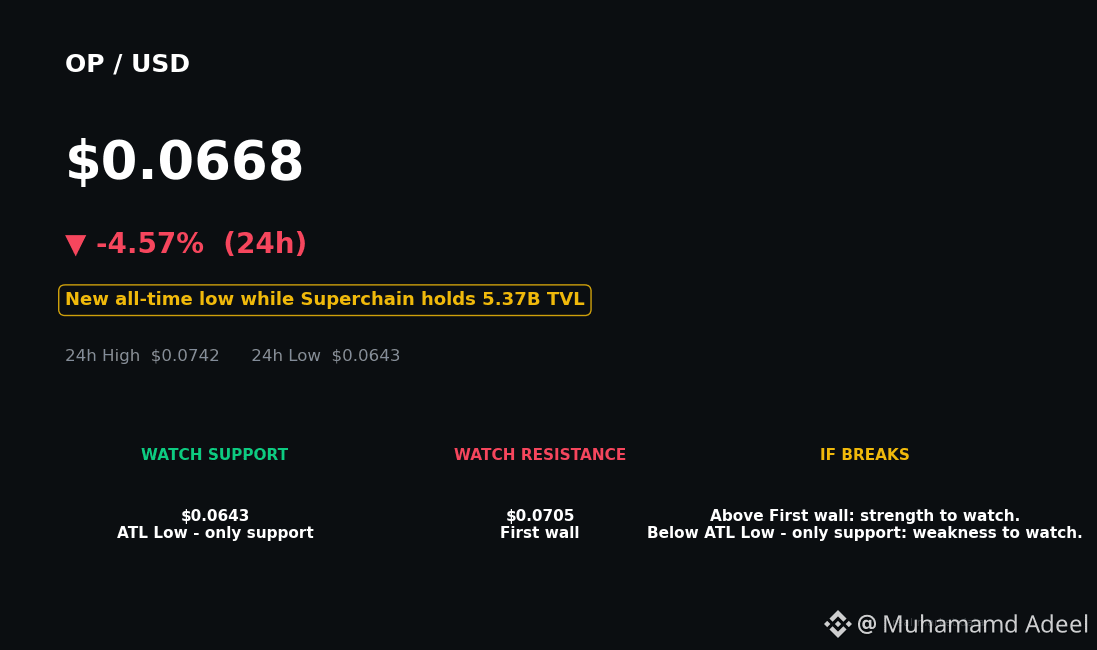
$OP em nova mínima histórica — enquanto sua Superchain detém US$ 5,3 bilhões$OP acaba de atingir uma nova mínima histórica de US$ 0,0643. A rede que ele impulsiona não recebeu o aviso.
Essa é a história toda em uma linha. O token da Optimism está agora 98,6% abaixo do pico de US$ 4,84 registrado em março de 2024, sendo negociado perto de US$ 0,067, com o índice de Medo e Ganância em 12. Enquanto isso, a Superchain ainda detém cerca de US$ 5,37 bilhões em TVL de DeFi distribuídos por 33 redes. Duas realidades, um ticker. Qual delas você está realmente comprando?
Aqui está a reviravolta que ninguém coloca na manchete: a maior parte desses US$ 5,37 bilhões não está na OP Mainnet. Só a Base representa US$ 4,43 bilhões. A própria OP Mainnet tem cerca de US$ 359 milhões em TVL de DeFi, uma queda de aproximadamente 18% em 30 dias. O império está bem. A capital está encolhendo.
$OP em nova mínima histórica — enquanto sua Superchain detém US$ 5,3 bilhões
$OP acaba de atingir uma nova mínima histórica de US$ 0,0643. A rede que ele impulsiona não recebeu o aviso.
Essa é a história toda em uma linha. O token da Optimism está agora 98,6% abaixo do pico de US$ 4,84 registrado em março de 2024, sendo negociado perto de US$ 0,067, com o índice de Medo e Ganância em 12. Enquanto isso, a Superchain ainda detém cerca de US$ 5,37 bilhões em TVL de DeFi distribuídos por 33 redes. Duas realidades, um ticker. Qual delas você está realmente comprando?
Aqui está a reviravolta que ninguém coloca na manchete: a maior parte desses US$ 5,37 bilhões não está na OP Mainnet. Só a Base representa US$ 4,43 bilhões. A própria OP Mainnet tem cerca de US$ 359 milhões em TVL de DeFi, uma queda de aproximadamente 18% em 30 dias. O império está bem. A capital está encolhendo.
Essa é a história toda em uma linha. O token da Optimism está agora 98,6% abaixo do pico de US$ 4,84 registrado em março de 2024, sendo negociado perto de US$ 0,067, com o índice de Medo e Ganância em 12. Enquanto isso, a Superchain ainda detém cerca de US$ 5,37 bilhões em TVL de DeFi distribuídos por 33 redes. Duas realidades, um ticker. Qual delas você está realmente comprando?
Aqui está a reviravolta que ninguém coloca na manchete: a maior parte desses US$ 5,37 bilhões não está na OP Mainnet. Só a Base representa US$ 4,43 bilhões. A própria OP Mainnet tem cerca de US$ 359 milhões em TVL de DeFi, uma queda de aproximadamente 18% em 30 dias. O império está bem. A capital está encolhendo.
16
Artigo
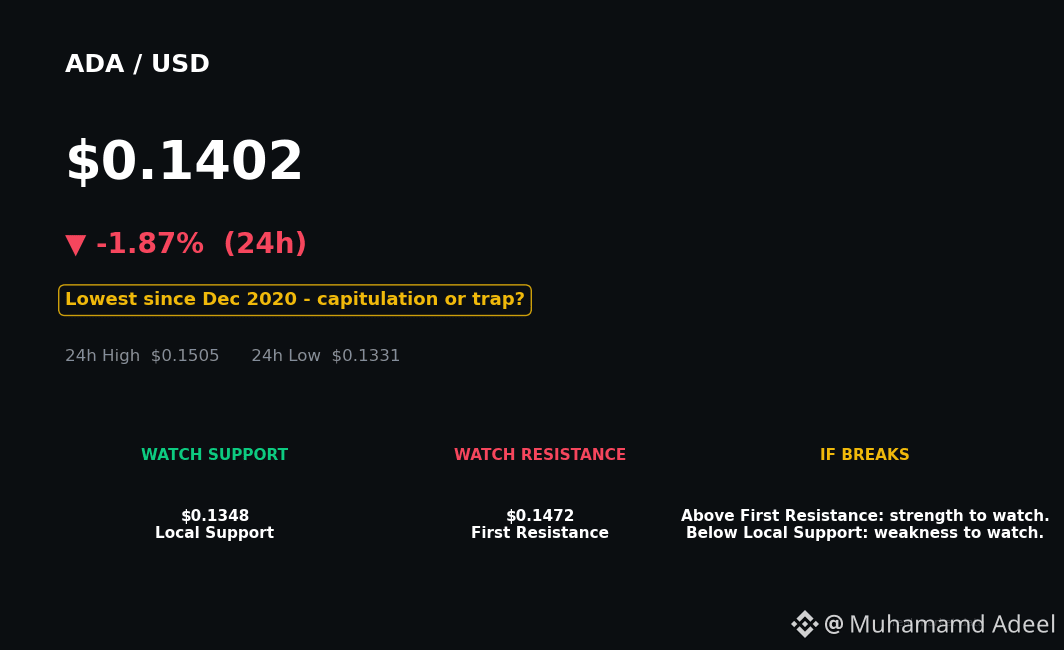
Medo em 12, $ADA a US$ 0,14: capitulação ou armadilha de valor?O índice de Medo e Ganância está em 12 — são nove dias seguidos de Medo Extremo. E a $ADA acabou de atingir US$ 0,14, seu nível mais baixo desde dezembro de 2020.
A Cardano está em queda de 95% em relação à sua máxima histórica de US$ 3,09. E tem mais: acabou de romper o piso de US$ 0,22–US$ 0,24 que se manteve durante todo o mercado de baixa de 2022–23. Estamos em território desconhecido — 42% abaixo do nível em que o último mercado de baixa atingiu o fundo.
E o momento não poderia ser pior. Nesta semana, o fundador Charles Hoskinson brigou publicamente com a própria Fundação no X — não participou da sessão AMA deles, acusou-os de mentir sobre prestação de contas e disse que seu trabalho com a Cardano acabou. O CEO da Fundação retrucou: "nenhum indivíduo pode decidir sozinho quando a Cardano acabou." Enquanto isso, a DJED, principal stablecoin da Cardano, será desativada em 31 de dezembro, e as baleias venderam cerca de 50 milhões de ADA entre 4 e 10 de novembro, segundo a Santiment.
Medo em 12, $ADA a US$ 0,14: capitulação ou armadilha de valor?
O índice de Medo e Ganância está em 12 — são nove dias seguidos de Medo Extremo. E a $ADA acabou de atingir US$ 0,14, seu nível mais baixo desde dezembro de 2020.
A Cardano está em queda de 95% em relação à sua máxima histórica de US$ 3,09. E tem mais: acabou de romper o piso de US$ 0,22–US$ 0,24 que se manteve durante todo o mercado de baixa de 2022–23. Estamos em território desconhecido — 42% abaixo do nível em que o último mercado de baixa atingiu o fundo.
E o momento não poderia ser pior. Nesta semana, o fundador Charles Hoskinson brigou publicamente com a própria Fundação no X — não participou da sessão AMA deles, acusou-os de mentir sobre prestação de contas e disse que seu trabalho com a Cardano acabou. O CEO da Fundação retrucou: "nenhum indivíduo pode decidir sozinho quando a Cardano acabou." Enquanto isso, a DJED, principal stablecoin da Cardano, será desativada em 31 de dezembro, e as baleias venderam cerca de 50 milhões de ADA entre 4 e 10 de novembro, segundo a Santiment.
A Cardano está em queda de 95% em relação à sua máxima histórica de US$ 3,09. E tem mais: acabou de romper o piso de US$ 0,22–US$ 0,24 que se manteve durante todo o mercado de baixa de 2022–23. Estamos em território desconhecido — 42% abaixo do nível em que o último mercado de baixa atingiu o fundo.
E o momento não poderia ser pior. Nesta semana, o fundador Charles Hoskinson brigou publicamente com a própria Fundação no X — não participou da sessão AMA deles, acusou-os de mentir sobre prestação de contas e disse que seu trabalho com a Cardano acabou. O CEO da Fundação retrucou: "nenhum indivíduo pode decidir sozinho quando a Cardano acabou." Enquanto isso, a DJED, principal stablecoin da Cardano, será desativada em 31 de dezembro, e as baleias venderam cerca de 50 milhões de ADA entre 4 e 10 de novembro, segundo a Santiment.
37
Artigo
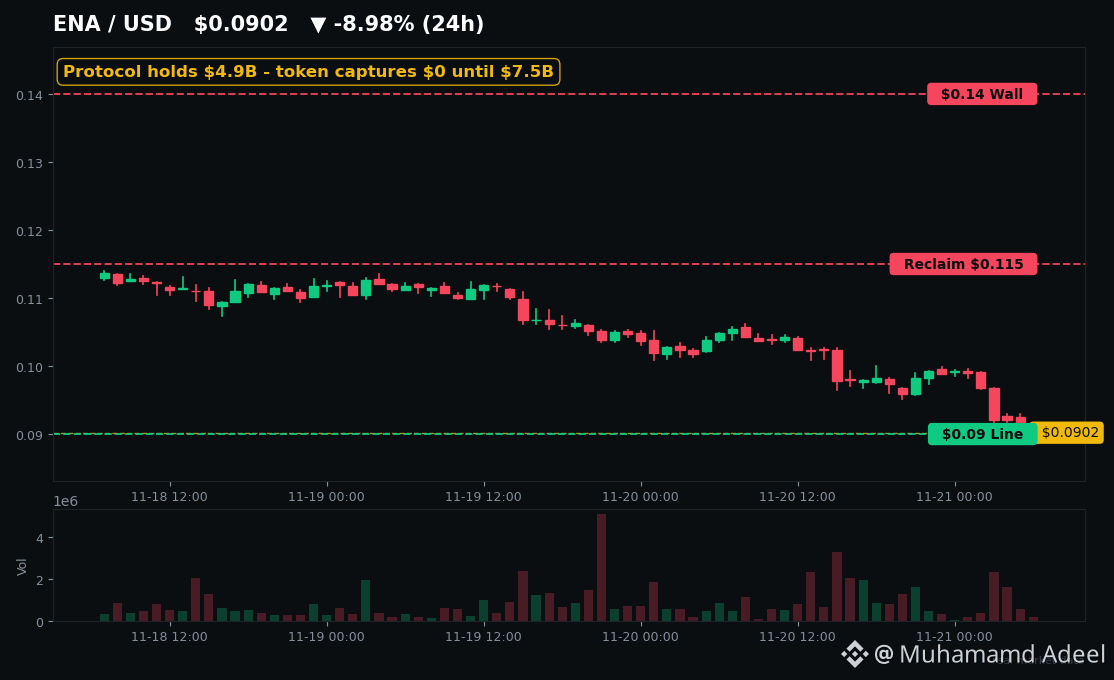
A ENA Caiu 55% em um Mês. O USDe Ainda Mantém US$ 4,9 Bilhões. O Que Vai Quebrar Primeiro?$BTC acabou de perder US$ 60 mil, o Índice de Medo e Ganância está em 12, e $ENA caiu 55% em um mês. Mas o dólar sintético de US$ 4,9 bilhões da Ethena ainda está cotado a US$ 0,999. Uma dessas coisas está mentindo para você.
Aqui está a divergência que ninguém está precificando. A ENA está sendo negociada a US$ 0,0903 — queda de 13% em 24 horas, 31% em uma semana e 94% abaixo da máxima histórica de US$ 1,52, registrada em abril de 2024. Enquanto isso, o protocolo por trás dela não está encolhendo: US$ 5,18 bilhões em TVL, US$ 22,6 milhões em taxas nos últimos 30 dias, oferta de USDe próxima de US$ 4,87 bilhões e o sUSDe ainda pagando cerca de 4,87%. A Ethena até lançou USDe e sUSDe na Stellar em 19 de novembro, em meio à queda.
A ENA Caiu 55% em um Mês. O USDe Ainda Mantém US$ 4,9 Bilhões. O Que Vai Quebrar Primeiro?
$BTC acabou de perder US$ 60 mil, o Índice de Medo e Ganância está em 12, e $ENA caiu 55% em um mês. Mas o dólar sintético de US$ 4,9 bilhões da Ethena ainda está cotado a US$ 0,999. Uma dessas coisas está mentindo para você.
Aqui está a divergência que ninguém está precificando. A ENA está sendo negociada a US$ 0,0903 — queda de 13% em 24 horas, 31% em uma semana e 94% abaixo da máxima histórica de US$ 1,52, registrada em abril de 2024. Enquanto isso, o protocolo por trás dela não está encolhendo: US$ 5,18 bilhões em TVL, US$ 22,6 milhões em taxas nos últimos 30 dias, oferta de USDe próxima de US$ 4,87 bilhões e o sUSDe ainda pagando cerca de 4,87%. A Ethena até lançou USDe e sUSDe na Stellar em 19 de novembro, em meio à queda.
Aqui está a divergência que ninguém está precificando. A ENA está sendo negociada a US$ 0,0903 — queda de 13% em 24 horas, 31% em uma semana e 94% abaixo da máxima histórica de US$ 1,52, registrada em abril de 2024. Enquanto isso, o protocolo por trás dela não está encolhendo: US$ 5,18 bilhões em TVL, US$ 22,6 milhões em taxas nos últimos 30 dias, oferta de USDe próxima de US$ 4,87 bilhões e o sUSDe ainda pagando cerca de 4,87%. A Ethena até lançou USDe e sUSDe na Stellar em 19 de novembro, em meio à queda.
42
Artigo
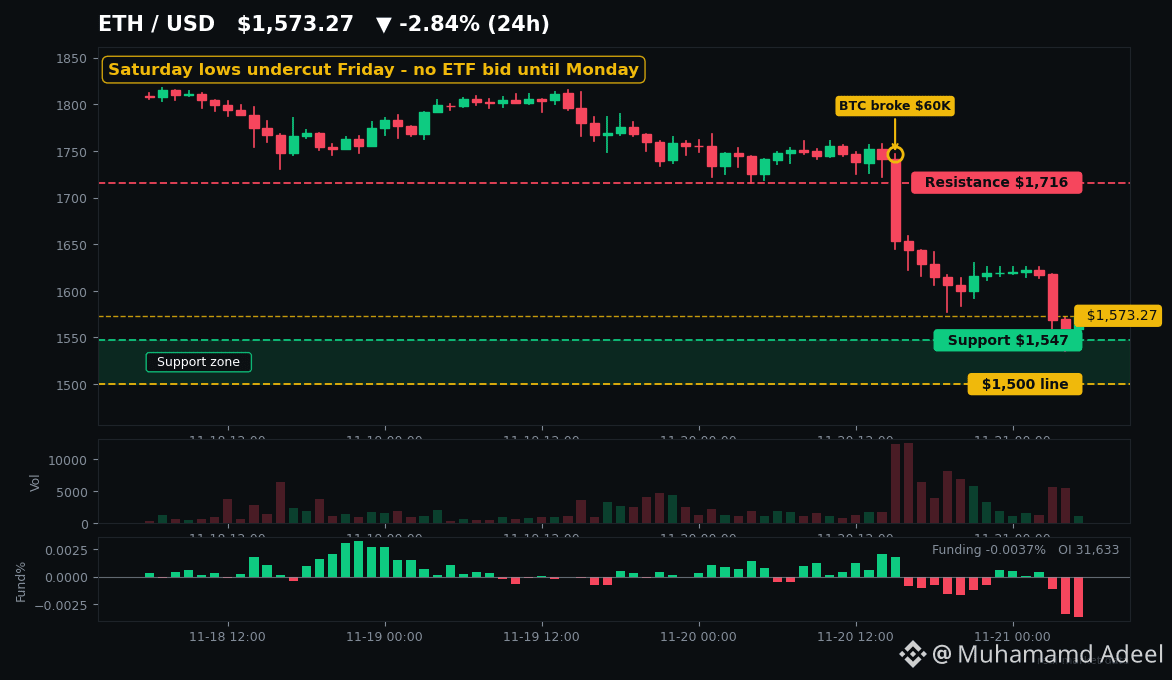
BTC caiu abaixo de US$ 60 mil na sexta. ETH não terá compras de ETFs até segunda-feira.$BTC caiu abaixo de US$ 60 mil na sexta-feira pela primeira vez desde julho.
Agora $ETH está passando um fim de semana inteiro sem compras de ETFs até segunda-feira. Então, quem compra primeiro?
Este é o cenário que você realmente vai negociar neste fim de semana.
**O que acabou de acontecer**
A queda de sexta atingiu todas as principais criptomoedas, não foi algo exclusivo do ETH. Na Kraken, o BTC fechou a sexta-feira a US$ 58.806, o ETH a US$ 1.619, e todas as principais criptomoedas voltaram a ficar abaixo de suas mínimas de sexta na manhã de sábado — até agora, o ETH chegou a US$ 1.536 no sábado, e o BTC, a US$ 55.480. No momento da publicação, o ETH estava a US$ 1.573. O Fear and Greed (alternative.me) está em 12, na zona de Medo Extremo, pelo 9º dia consecutivo.
BTC caiu abaixo de US$ 60 mil na sexta. ETH não terá compras de ETFs até segunda-feira.
$BTC caiu abaixo de US$ 60 mil na sexta-feira pela primeira vez desde julho.
Agora $ETH está passando um fim de semana inteiro sem compras de ETFs até segunda-feira. Então, quem compra primeiro?
Este é o cenário que você realmente vai negociar neste fim de semana.
**O que acabou de acontecer**
A queda de sexta atingiu todas as principais criptomoedas, não foi algo exclusivo do ETH. Na Kraken, o BTC fechou a sexta-feira a US$ 58.806, o ETH a US$ 1.619, e todas as principais criptomoedas voltaram a ficar abaixo de suas mínimas de sexta na manhã de sábado — até agora, o ETH chegou a US$ 1.536 no sábado, e o BTC, a US$ 55.480. No momento da publicação, o ETH estava a US$ 1.573. O Fear and Greed (alternative.me) está em 12, na zona de Medo Extremo, pelo 9º dia consecutivo.
Agora $ETH está passando um fim de semana inteiro sem compras de ETFs até segunda-feira. Então, quem compra primeiro?
Este é o cenário que você realmente vai negociar neste fim de semana.
**O que acabou de acontecer**
A queda de sexta atingiu todas as principais criptomoedas, não foi algo exclusivo do ETH. Na Kraken, o BTC fechou a sexta-feira a US$ 58.806, o ETH a US$ 1.619, e todas as principais criptomoedas voltaram a ficar abaixo de suas mínimas de sexta na manhã de sábado — até agora, o ETH chegou a US$ 1.536 no sábado, e o BTC, a US$ 55.480. No momento da publicação, o ETH estava a US$ 1.573. O Fear and Greed (alternative.me) está em 12, na zona de Medo Extremo, pelo 9º dia consecutivo.
47
Artigo
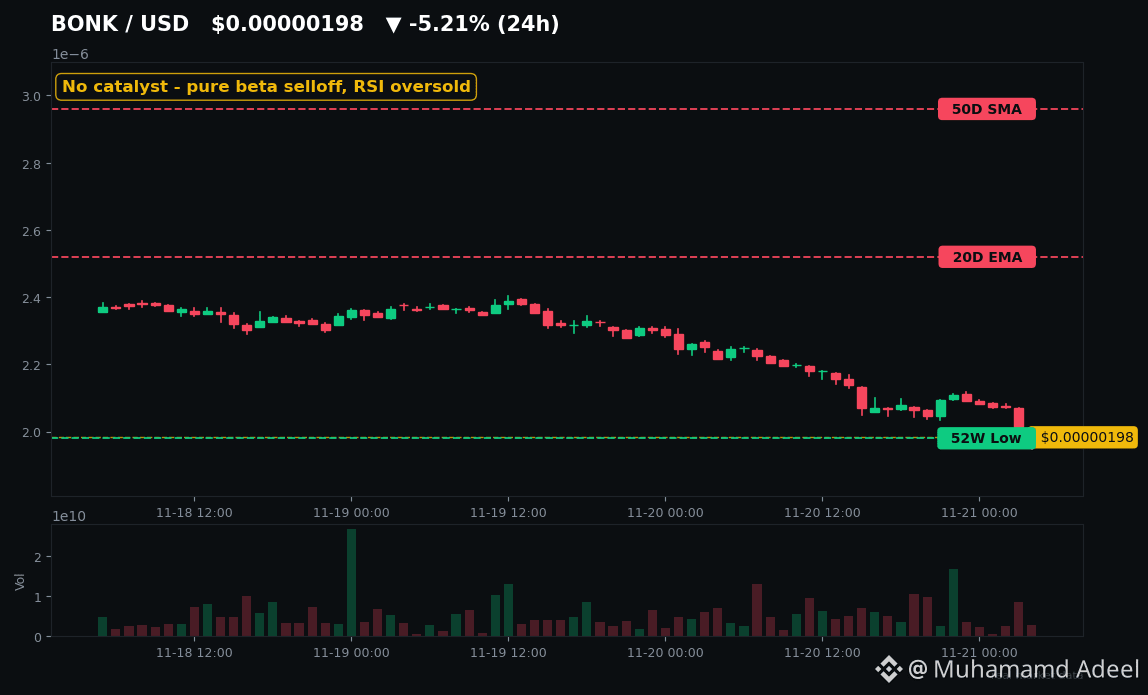
$BONK acaba de atingir a mínima de 52 semanas sem nenhuma notícia ruim — recuperação ou colapso?$BONK acaba de registrar uma nova mínima de 52 semanas — e ninguém consegue apontar uma única notícia sobre a BONK que tenha causado isso.
Essa é a história toda. E é pior do que uma notícia ruim.
Veja o que realmente aconteceu hoje: $BONK caiu para cerca de US$ 0,0000020, uma queda de aproximadamente 9% a 10% em 24 horas, segundo os principais rastreadores, e de cerca de 22% nesta semana. A mínima intradiária chegou a US$ 0,00000198. A capitalização de mercado agora está em torno de US$ 184 milhões — uma moeda que valia cerca de US$ 4 bilhões no pico de novembro de 2024, perto de US$ 0,000058. Isso representa uma queda de aproximadamente 96%.
Não houve exploração de vulnerabilidade hoje. Não houve exclusão de corretora hoje. Não houve desbloqueio de tokens hoje. Vários rastreadores que analisaram as últimas 24 horas não encontraram nenhum catalisador específico para BONK confirmado. A queda acompanhou o mercado: $BTC caiu cerca de 6%, e o mercado como um todo, cerca de 5,9%, após relatos de saídas de US$ 582 milhões de ETFs à vista de Bitcoin nos EUA em 19 de novembro. A BONK simplesmente caiu mais. Geralmente é assim — o histórico mostra que a BONK amplifica as vendas de moedas de grande capitalização em 2 a 3 vezes.
$BONK acaba de atingir a mínima de 52 semanas sem nenhuma notícia ruim — recuperação ou colapso?
$BONK acaba de registrar uma nova mínima de 52 semanas — e ninguém consegue apontar uma única notícia sobre a BONK que tenha causado isso.
Essa é a história toda. E é pior do que uma notícia ruim.
Veja o que realmente aconteceu hoje: $BONK caiu para cerca de US$ 0,0000020, uma queda de aproximadamente 9% a 10% em 24 horas, segundo os principais rastreadores, e de cerca de 22% nesta semana. A mínima intradiária chegou a US$ 0,00000198. A capitalização de mercado agora está em torno de US$ 184 milhões — uma moeda que valia cerca de US$ 4 bilhões no pico de novembro de 2024, perto de US$ 0,000058. Isso representa uma queda de aproximadamente 96%.
Não houve exploração de vulnerabilidade hoje. Não houve exclusão de corretora hoje. Não houve desbloqueio de tokens hoje. Vários rastreadores que analisaram as últimas 24 horas não encontraram nenhum catalisador específico para BONK confirmado. A queda acompanhou o mercado: $BTC caiu cerca de 6%, e o mercado como um todo, cerca de 5,9%, após relatos de saídas de US$ 582 milhões de ETFs à vista de Bitcoin nos EUA em 19 de novembro. A BONK simplesmente caiu mais. Geralmente é assim — o histórico mostra que a BONK amplifica as vendas de moedas de grande capitalização em 2 a 3 vezes.
Essa é a história toda. E é pior do que uma notícia ruim.
Veja o que realmente aconteceu hoje: $BONK caiu para cerca de US$ 0,0000020, uma queda de aproximadamente 9% a 10% em 24 horas, segundo os principais rastreadores, e de cerca de 22% nesta semana. A mínima intradiária chegou a US$ 0,00000198. A capitalização de mercado agora está em torno de US$ 184 milhões — uma moeda que valia cerca de US$ 4 bilhões no pico de novembro de 2024, perto de US$ 0,000058. Isso representa uma queda de aproximadamente 96%.
Não houve exploração de vulnerabilidade hoje. Não houve exclusão de corretora hoje. Não houve desbloqueio de tokens hoje. Vários rastreadores que analisaram as últimas 24 horas não encontraram nenhum catalisador específico para BONK confirmado. A queda acompanhou o mercado: $BTC caiu cerca de 6%, e o mercado como um todo, cerca de 5,9%, após relatos de saídas de US$ 582 milhões de ETFs à vista de Bitcoin nos EUA em 19 de novembro. A BONK simplesmente caiu mais. Geralmente é assim — o histórico mostra que a BONK amplifica as vendas de moedas de grande capitalização em 2 a 3 vezes.
54
Artigo
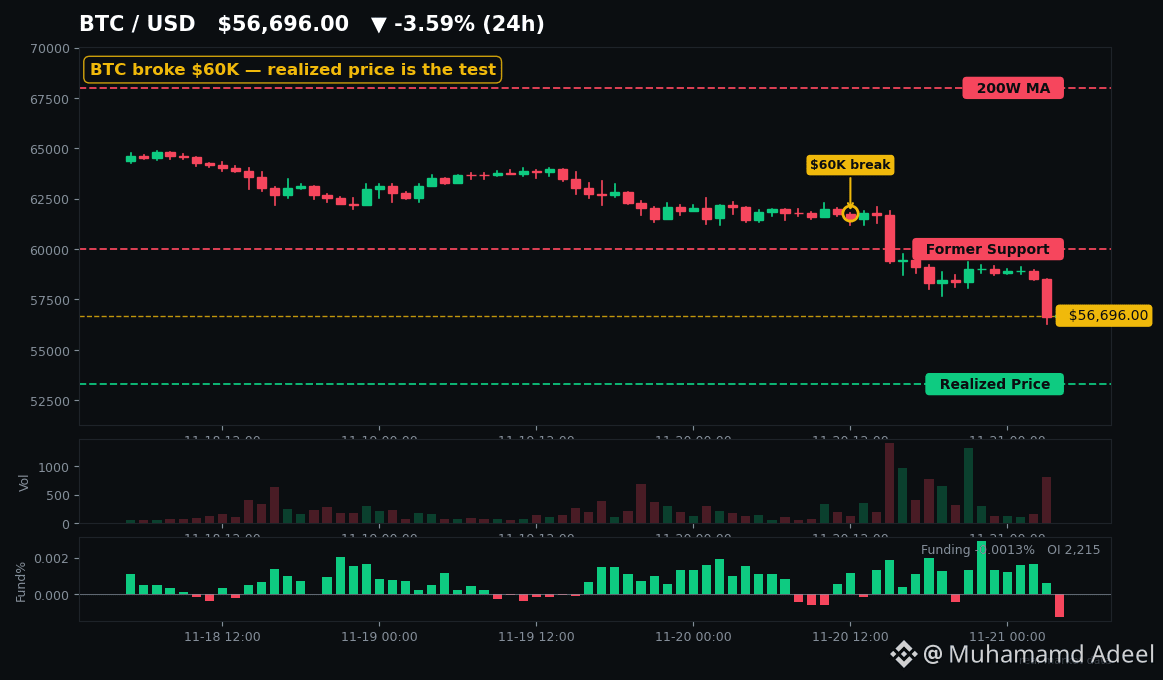
O $BTC Acaba de Cair Abaixo dos $60K — Agora, $53.3K É O Nível Que ImportaOs $60K já eram.
$BTC acabou de marcar $56,666 na Kraken — mínima de 24h de $56,300, a menor desde setembro de 2024 — com o Fear & Greed em 12, bem dentro da zona de Medo Extremo. Agora, um único nível separa uma recuperação de uma redefinição completa. E está apenas cerca de $3K abaixo.
Eis o que causou a queda. Os ETFs spot de Bitcoin dos EUA registraram saídas de US$ 582.3M só em 19 de novembro. O IBIT da BlackRock respondeu por US$ 541.1M — sua maior saída diária desde o lançamento. O total de novembro agora é de -US$ 3.47B até 19 de novembro. Some a isso uma onda de vendas de ações de tecnologia, uma alta dos juros pelo Fed em dezembro precificada em ~93% e mais de US$ 1.5B liquidados em 24h nas principais plataformas — cerca de 90% eram posições compradas — e os $60K nunca tiveram chance.
O $BTC Acaba de Cair Abaixo dos $60K — Agora, $53.3K É O Nível Que Importa
Os $60K já eram.
$BTC acabou de marcar $56,666 na Kraken — mínima de 24h de $56,300, a menor desde setembro de 2024 — com o Fear & Greed em 12, bem dentro da zona de Medo Extremo. Agora, um único nível separa uma recuperação de uma redefinição completa. E está apenas cerca de $3K abaixo.
Eis o que causou a queda. Os ETFs spot de Bitcoin dos EUA registraram saídas de US$ 582.3M só em 19 de novembro. O IBIT da BlackRock respondeu por US$ 541.1M — sua maior saída diária desde o lançamento. O total de novembro agora é de -US$ 3.47B até 19 de novembro. Some a isso uma onda de vendas de ações de tecnologia, uma alta dos juros pelo Fed em dezembro precificada em ~93% e mais de US$ 1.5B liquidados em 24h nas principais plataformas — cerca de 90% eram posições compradas — e os $60K nunca tiveram chance.
$BTC acabou de marcar $56,666 na Kraken — mínima de 24h de $56,300, a menor desde setembro de 2024 — com o Fear & Greed em 12, bem dentro da zona de Medo Extremo. Agora, um único nível separa uma recuperação de uma redefinição completa. E está apenas cerca de $3K abaixo.
Eis o que causou a queda. Os ETFs spot de Bitcoin dos EUA registraram saídas de US$ 582.3M só em 19 de novembro. O IBIT da BlackRock respondeu por US$ 541.1M — sua maior saída diária desde o lançamento. O total de novembro agora é de -US$ 3.47B até 19 de novembro. Some a isso uma onda de vendas de ações de tecnologia, uma alta dos juros pelo Fed em dezembro precificada em ~93% e mais de US$ 1.5B liquidados em 24h nas principais plataformas — cerca de 90% eram posições compradas — e os $60K nunca tiveram chance.
68
Inicia sessão para explorar mais conteúdos
Junta-te a utilizadores de criptomoedas de todo o mundo na Binance Square
⚡️ Obtém informações úteis e recentes sobre criptomoedas.
💬 Com a confiança da maior exchange de criptomoedas do mundo.
👍 Descobre perspetivas reais de criadores verificados.
E-mail/Número de telefone
Tópicos em Tendência
BTCReboundsAbove$60KAmidWhaleDipBuying
3,590 visualizações
43 a discutir
Abraxas Capital e outras baleias compram na queda do BTC enquanto o Bitcoin volta brevemente a superar US$ 60.000
Binance News
·12 gostos
·10.9k visualizações
NvidiaLoses$2.7TrillionInMonthAndAHalf
41,523 visualizações
201 a discutir
GlobalStocksFaceLongestLosingStreakSince2023
386,412 visualizações
2,541 a discutir