

Chart-Sniper
630 Publicações

Chart-Sniper
Denunciar
Bloquear Utilizador
🎯 ChartSniper is your go-to spot for spotting top crypto gainers and breakout setups in real time. I focus on clean chart analysis, key support and resistance.
Aberto ao trading
Trader Ocasional
5.1 mês(es)
5 A seguir
50 Seguidores
142 Gostaram
Publicações
Portfólio
·
--
Em Alta
Título: $CC Duplo Fundo com Reação 📈
$CC/USDT (Perp) – Setup de reversão de alta
Entrada: 0.1250–0.1256 (zona 61.8%–50%)
TP: 0.1273 / 0.1290
SL: 0.1230
⚠️ Não é conselho financeiro. Faça sua própria pesquisa (DYOR).
Notas sobre os níveis (a partir do seu gráfico):
Foi formado um duplo fundo perto do LL (0.123), seguido por um movimento forte para um novo HH (0.129), e agora o preço está recuando para a zona de Fibonacci de 50%–61.8% (0.1250–0.1256).
Entrada: 0.1250–0.1256, onde o suporte do Fib se alinha com a retração da linha do duplo fundo — uma zona comum de repique. TP1 (0.1273): Fib de 38.2% / resistência anterior da consolidação.
TP2 (0.1290): a máxima (HH) da oscilação — alvo completo do movimento se o momentum voltar. SL (0.1230): abaixo do Fib de 100% / LL — um fechamento abaixo disso invalida a estrutura do duplo fundo.
RSI em torno de 49–50 mostra momentum neutro; então aguarde uma vela de reação de alta na zona em vez de entrar no movimento de queda.
@Binance_Square_Official #BitcoinClears$85200 #AltcoinSeasonIndexHoldsAbove60For5Days #USADPAdds90000JobsInSeptember #Binance #ChartSniper
{future}(CCUSDT)
Título: $CC Duplo Fundo com Reação 📈
$CC /USDT (Perp) – Setup de reversão de alta
Entrada: 0.1250–0.1256 (zona 61.8%–50%)
TP: 0.1273 / 0.1290
SL: 0.1230
⚠️ Não é conselho financeiro. Faça sua própria pesquisa (DYOR).
Notas sobre os níveis (a partir do seu gráfico):
Foi formado um duplo fundo perto do LL (0.123), seguido por um movimento forte para um novo HH (0.129), e agora o preço está recuando para a zona de Fibonacci de 50%–61.8% (0.1250–0.1256).
Entrada: 0.1250–0.1256, onde o suporte do Fib se alinha com a retração da linha do duplo fundo — uma zona comum de repique. TP1 (0.1273): Fib de 38.2% / resistência anterior da consolidação.
TP2 (0.1290): a máxima (HH) da oscilação — alvo completo do movimento se o momentum voltar. SL (0.1230): abaixo do Fib de 100% / LL — um fechamento abaixo disso invalida a estrutura do duplo fundo.
RSI em torno de 49–50 mostra momentum neutro; então aguarde uma vela de reação de alta na zona em vez de entrar no movimento de queda.
@Binance Square Official #BitcoinClears$85200 #AltcoinSeasonIndexHoldsAbove60For5Days #USADPAdds90000JobsInSeptember #Binance #ChartSniper
$CC /USDT (Perp) – Setup de reversão de alta
Entrada: 0.1250–0.1256 (zona 61.8%–50%)
TP: 0.1273 / 0.1290
SL: 0.1230
⚠️ Não é conselho financeiro. Faça sua própria pesquisa (DYOR).
Notas sobre os níveis (a partir do seu gráfico):
Foi formado um duplo fundo perto do LL (0.123), seguido por um movimento forte para um novo HH (0.129), e agora o preço está recuando para a zona de Fibonacci de 50%–61.8% (0.1250–0.1256).
Entrada: 0.1250–0.1256, onde o suporte do Fib se alinha com a retração da linha do duplo fundo — uma zona comum de repique. TP1 (0.1273): Fib de 38.2% / resistência anterior da consolidação.
TP2 (0.1290): a máxima (HH) da oscilação — alvo completo do movimento se o momentum voltar. SL (0.1230): abaixo do Fib de 100% / LL — um fechamento abaixo disso invalida a estrutura do duplo fundo.
RSI em torno de 49–50 mostra momentum neutro; então aguarde uma vela de reação de alta na zona em vez de entrar no movimento de queda.
@Binance Square Official #BitcoinClears$85200 #AltcoinSeasonIndexHoldsAbove60For5Days #USADPAdds90000JobsInSeptember #Binance #ChartSniper
60
·
--
Em Alta
Título: $KITE Play do Canal em Ascensão 📊
KITE/USDT (Perp) – Canal de alta
Entrada: 0.1385–0.1390 (suporte Fib)
TP: 0.1414 / 0.1470
SL: 0.1330
⚠️ Não é aconselhamento financeiro. Faça sua própria pesquisa (DYOR).
Notas sobre os níveis (a partir do seu gráfico):
O preço rompeu o canal a partir do HL (0.133), fez uma máxima LH em 0.147 e agora está voltando pelo canal em alta em direção à zona de Fib de 50%–61.8% (0.1385–0.1390).
Entrada: a zona de 0.1385–0.1390, onde a linha de tendência do meio do canal e o suporte Fib se alinham — uma área comum para os compradores voltarem a entrar.
TP1 (0.1414): Fib de 38.2% / resistência recente de consolidação.
TP2 (0.1470): máxima swing LH — alvo de retração total se o momentum voltar. SL (0.1330): abaixo da linha de tendência inferior do canal e do HL — um fechamento abaixo daqui invalida a estrutura de alta.
O RSI esfria para 41–49 após o impulso anterior, então espere o preço segurar a zona e mostrar uma vela de reversão antes de entrar, em vez de tentar pegar a faca que cai.
@Binance_Square_Official #BitcoinClears$85200 #AltcoinSeasonIndexHoldsAbove60For5Days #USADPAdds90000JobsInSeptember #BINANCE #ChartSniper
{future}(KITEUSDT)
Título: $KITE Play do Canal em Ascensão 📊
KITE/USDT (Perp) – Canal de alta
Entrada: 0.1385–0.1390 (suporte Fib)
TP: 0.1414 / 0.1470
SL: 0.1330
⚠️ Não é aconselhamento financeiro. Faça sua própria pesquisa (DYOR).
Notas sobre os níveis (a partir do seu gráfico):
O preço rompeu o canal a partir do HL (0.133), fez uma máxima LH em 0.147 e agora está voltando pelo canal em alta em direção à zona de Fib de 50%–61.8% (0.1385–0.1390).
Entrada: a zona de 0.1385–0.1390, onde a linha de tendência do meio do canal e o suporte Fib se alinham — uma área comum para os compradores voltarem a entrar.
TP1 (0.1414): Fib de 38.2% / resistência recente de consolidação.
TP2 (0.1470): máxima swing LH — alvo de retração total se o momentum voltar. SL (0.1330): abaixo da linha de tendência inferior do canal e do HL — um fechamento abaixo daqui invalida a estrutura de alta.
O RSI esfria para 41–49 após o impulso anterior, então espere o preço segurar a zona e mostrar uma vela de reversão antes de entrar, em vez de tentar pegar a faca que cai.
@Binance Square Official #BitcoinClears$85200 #AltcoinSeasonIndexHoldsAbove60For5Days #USADPAdds90000JobsInSeptember #BINANCE #ChartSniper
KITE/USDT (Perp) – Canal de alta
Entrada: 0.1385–0.1390 (suporte Fib)
TP: 0.1414 / 0.1470
SL: 0.1330
⚠️ Não é aconselhamento financeiro. Faça sua própria pesquisa (DYOR).
Notas sobre os níveis (a partir do seu gráfico):
O preço rompeu o canal a partir do HL (0.133), fez uma máxima LH em 0.147 e agora está voltando pelo canal em alta em direção à zona de Fib de 50%–61.8% (0.1385–0.1390).
Entrada: a zona de 0.1385–0.1390, onde a linha de tendência do meio do canal e o suporte Fib se alinham — uma área comum para os compradores voltarem a entrar.
TP1 (0.1414): Fib de 38.2% / resistência recente de consolidação.
TP2 (0.1470): máxima swing LH — alvo de retração total se o momentum voltar. SL (0.1330): abaixo da linha de tendência inferior do canal e do HL — um fechamento abaixo daqui invalida a estrutura de alta.
O RSI esfria para 41–49 após o impulso anterior, então espere o preço segurar a zona e mostrar uma vela de reversão antes de entrar, em vez de tentar pegar a faca que cai.
@Binance Square Official #BitcoinClears$85200 #AltcoinSeasonIndexHoldsAbove60For5Days #USADPAdds90000JobsInSeptember #BINANCE #ChartSniper
124
·
--
Em Alta
Título: $PROM Continuação do Canal 🚀
PROM/USDT (Perp) – Canal de alta
Entrada: 6,20–6,30 (reteste)
TP: 6,60 / 7,00
SL: 5,91
⚠️ Não é conselho financeiro. Faça sua própria pesquisa (DYOR).
Notas sobre os níveis (a partir do seu gráfico):
O preço rompeu um canal ascendente a partir do HL (5,45), formando uma nova HH (~6,62), e agora está pairando logo acima do nível 6,20 (Fib de 38,2% / estrutura anterior).
Entrada: um reteste da zona 6,20–6,30 (antiga resistência virando suporte, dentro do canal em alta) oferece uma relação risco/recompensa melhor do que correr atrás do preço atual.
TP1 (6,60): a HH recente / resistência do canal. TP2 (7,00): extensão do topo do canal se o rompimento continuar.
SL (5,91): abaixo do Fib de 61,8% e do limite inferior do canal — um fechamento abaixo daqui quebraria a estrutura de alta.
RSI em 63 indica um momentum sólido, mas não extremo, deixando espaço para continuar — ainda assim, espere o reteste segurar antes de entrar, em vez de comprar força.
{future}(PROMUSDT)
@Binance_Square_Official #BitcoinClears$85200 #AltcoinSeasonIndexHoldsAbove60For5Days #USADPAdds90000JobsInSeptember #Binance #ChartSniper
Título: $PROM Continuação do Canal 🚀
PROM/USDT (Perp) – Canal de alta
Entrada: 6,20–6,30 (reteste)
TP: 6,60 / 7,00
SL: 5,91
⚠️ Não é conselho financeiro. Faça sua própria pesquisa (DYOR).
Notas sobre os níveis (a partir do seu gráfico):
O preço rompeu um canal ascendente a partir do HL (5,45), formando uma nova HH (~6,62), e agora está pairando logo acima do nível 6,20 (Fib de 38,2% / estrutura anterior).
Entrada: um reteste da zona 6,20–6,30 (antiga resistência virando suporte, dentro do canal em alta) oferece uma relação risco/recompensa melhor do que correr atrás do preço atual.
TP1 (6,60): a HH recente / resistência do canal. TP2 (7,00): extensão do topo do canal se o rompimento continuar.
SL (5,91): abaixo do Fib de 61,8% e do limite inferior do canal — um fechamento abaixo daqui quebraria a estrutura de alta.
RSI em 63 indica um momentum sólido, mas não extremo, deixando espaço para continuar — ainda assim, espere o reteste segurar antes de entrar, em vez de comprar força.
@Binance Square Official #BitcoinClears$85200 #AltcoinSeasonIndexHoldsAbove60For5Days #USADPAdds90000JobsInSeptember #Binance #ChartSniper
PROM/USDT (Perp) – Canal de alta
Entrada: 6,20–6,30 (reteste)
TP: 6,60 / 7,00
SL: 5,91
⚠️ Não é conselho financeiro. Faça sua própria pesquisa (DYOR).
Notas sobre os níveis (a partir do seu gráfico):
O preço rompeu um canal ascendente a partir do HL (5,45), formando uma nova HH (~6,62), e agora está pairando logo acima do nível 6,20 (Fib de 38,2% / estrutura anterior).
Entrada: um reteste da zona 6,20–6,30 (antiga resistência virando suporte, dentro do canal em alta) oferece uma relação risco/recompensa melhor do que correr atrás do preço atual.
TP1 (6,60): a HH recente / resistência do canal. TP2 (7,00): extensão do topo do canal se o rompimento continuar.
SL (5,91): abaixo do Fib de 61,8% e do limite inferior do canal — um fechamento abaixo daqui quebraria a estrutura de alta.
RSI em 63 indica um momentum sólido, mas não extremo, deixando espaço para continuar — ainda assim, espere o reteste segurar antes de entrar, em vez de comprar força.
@Binance Square Official #BitcoinClears$85200 #AltcoinSeasonIndexHoldsAbove60For5Days #USADPAdds90000JobsInSeptember #Binance #ChartSniper
197
·
--
Em Alta
Título: $GALA Reteste de Alta 📊
$GALA/USDT (Perp) – Bullish, estrutura de HL
Entrada: 0.00220–0.00225 (reteste da linha de tendência)
TP: 0.00234 / 0.00240
SL: 0.00218
⚠️ Não é aconselhamento financeiro. DYOR.
Observações sobre os níveis (a partir do seu gráfico):
O preço está formando mínimas mais altas (HL, LL) na linha de tendência em ascensão, com resistência agrupada perto de 0.00234 (zona HH) e suporte no teste da linha de tendência atual em torno de 0.00220–0.00225.
Entrada: a zona de 0.00220–0.00225, onde o preço está atualmente na linha de tendência e em um suporte horizontal anterior (linhas verdes) — uma área comum para os touros defenderem.
TP1 (0.00234): resistência HH / zona de rejeição anterior. TP2 (0.00240): extensão da linha de tendência / próxima resistência se 0.00234 romper. SL (0.00218): logo abaixo da linha de tendência e da zona de LL recente — um fechamento abaixo daqui quebraria a estrutura da tendência.
O RSI está perto da linha do meio (45–54), então o momentum é neutro em vez de forte — confirme que a linha de tendência se mantém com uma vela bullish antes de entrar, em vez de antecipar o repique.
@Binance_Square_Official #BitcoinClears$85200 #AltcoinSeasonIndexHoldsAbove60For5Days #USADPAdds90000JobsInSeptember #Binance #ChartSniper
{future}(GALAUSDT)
Título: $GALA Reteste de Alta 📊
$GALA /USDT (Perp) – Bullish, estrutura de HL
Entrada: 0.00220–0.00225 (reteste da linha de tendência)
TP: 0.00234 / 0.00240
SL: 0.00218
⚠️ Não é aconselhamento financeiro. DYOR.
Observações sobre os níveis (a partir do seu gráfico):
O preço está formando mínimas mais altas (HL, LL) na linha de tendência em ascensão, com resistência agrupada perto de 0.00234 (zona HH) e suporte no teste da linha de tendência atual em torno de 0.00220–0.00225.
Entrada: a zona de 0.00220–0.00225, onde o preço está atualmente na linha de tendência e em um suporte horizontal anterior (linhas verdes) — uma área comum para os touros defenderem.
TP1 (0.00234): resistência HH / zona de rejeição anterior. TP2 (0.00240): extensão da linha de tendência / próxima resistência se 0.00234 romper. SL (0.00218): logo abaixo da linha de tendência e da zona de LL recente — um fechamento abaixo daqui quebraria a estrutura da tendência.
O RSI está perto da linha do meio (45–54), então o momentum é neutro em vez de forte — confirme que a linha de tendência se mantém com uma vela bullish antes de entrar, em vez de antecipar o repique.
@Binance Square Official #BitcoinClears$85200 #AltcoinSeasonIndexHoldsAbove60For5Days #USADPAdds90000JobsInSeptember #Binance #ChartSniper
$GALA /USDT (Perp) – Bullish, estrutura de HL
Entrada: 0.00220–0.00225 (reteste da linha de tendência)
TP: 0.00234 / 0.00240
SL: 0.00218
⚠️ Não é aconselhamento financeiro. DYOR.
Observações sobre os níveis (a partir do seu gráfico):
O preço está formando mínimas mais altas (HL, LL) na linha de tendência em ascensão, com resistência agrupada perto de 0.00234 (zona HH) e suporte no teste da linha de tendência atual em torno de 0.00220–0.00225.
Entrada: a zona de 0.00220–0.00225, onde o preço está atualmente na linha de tendência e em um suporte horizontal anterior (linhas verdes) — uma área comum para os touros defenderem.
TP1 (0.00234): resistência HH / zona de rejeição anterior. TP2 (0.00240): extensão da linha de tendência / próxima resistência se 0.00234 romper. SL (0.00218): logo abaixo da linha de tendência e da zona de LL recente — um fechamento abaixo daqui quebraria a estrutura da tendência.
O RSI está perto da linha do meio (45–54), então o momentum é neutro em vez de forte — confirme que a linha de tendência se mantém com uma vela bullish antes de entrar, em vez de antecipar o repique.
@Binance Square Official #BitcoinClears$85200 #AltcoinSeasonIndexHoldsAbove60For5Days #USADPAdds90000JobsInSeptember #Binance #ChartSniper
313
·
--
Em Alta
Título: $KSM Support Test ⚖️
$KSM/USDT (Perp) – Monitoramento de faixa/rompimento
Entrada Longa: 5.05–5.06 (suporte)
TP: 5.15 / 5.30
SL: 4.98
Entrada Curta: Romper abaixo de 5.05
TP: 4.90
⚠️ Não é aconselhamento financeiro. Faça sua própria pesquisa (DYOR).
Notas sobre os níveis (do seu gráfico):
O preço rompeu abaixo da linha de tendência ascendente que sustentou o movimento de LL (4.62) para HH (5.35) e agora está testando o suporte horizontal em 5.05–5.06, perto da parte inferior da faixa recente de consolidação.
Cenário otimista: se 5.05–5.06 mantiver, a entrada ali mira 5.15 (resistência da faixa) e depois 5.30 (zona LH/HH).
SL em 4.98, logo abaixo do suporte. Cenário pessimista: um fechamento confirmado abaixo de 5.05 favorece uma queda em direção a 4.90 (linha de suporte teal), já que a ruptura da linha de tendência mais o RSI virando de 50 em direção a 41 indicam perda de momentum.
Este é um ponto de decisão, não uma tendência limpa — espere por confirmação (reclaim ou uma vela de rompimento bem definida) em vez de entrar no meio da faixa.
@Binance_Square_Official #BitcoinClears$85200 #AltcoinSeasonIndexHoldsAbove60For5Days #USADPAdds90000JobsInSeptember #Binance #ChartSniper
{future}(KSMUSDT)
Título: $KSM Support Test ⚖️
$KSM /USDT (Perp) – Monitoramento de faixa/rompimento
Entrada Longa: 5.05–5.06 (suporte)
TP: 5.15 / 5.30
SL: 4.98
Entrada Curta: Romper abaixo de 5.05
TP: 4.90
⚠️ Não é aconselhamento financeiro. Faça sua própria pesquisa (DYOR).
Notas sobre os níveis (do seu gráfico):
O preço rompeu abaixo da linha de tendência ascendente que sustentou o movimento de LL (4.62) para HH (5.35) e agora está testando o suporte horizontal em 5.05–5.06, perto da parte inferior da faixa recente de consolidação.
Cenário otimista: se 5.05–5.06 mantiver, a entrada ali mira 5.15 (resistência da faixa) e depois 5.30 (zona LH/HH).
SL em 4.98, logo abaixo do suporte. Cenário pessimista: um fechamento confirmado abaixo de 5.05 favorece uma queda em direção a 4.90 (linha de suporte teal), já que a ruptura da linha de tendência mais o RSI virando de 50 em direção a 41 indicam perda de momentum.
Este é um ponto de decisão, não uma tendência limpa — espere por confirmação (reclaim ou uma vela de rompimento bem definida) em vez de entrar no meio da faixa.
@Binance Square Official #BitcoinClears$85200 #AltcoinSeasonIndexHoldsAbove60For5Days #USADPAdds90000JobsInSeptember #Binance #ChartSniper
$KSM /USDT (Perp) – Monitoramento de faixa/rompimento
Entrada Longa: 5.05–5.06 (suporte)
TP: 5.15 / 5.30
SL: 4.98
Entrada Curta: Romper abaixo de 5.05
TP: 4.90
⚠️ Não é aconselhamento financeiro. Faça sua própria pesquisa (DYOR).
Notas sobre os níveis (do seu gráfico):
O preço rompeu abaixo da linha de tendência ascendente que sustentou o movimento de LL (4.62) para HH (5.35) e agora está testando o suporte horizontal em 5.05–5.06, perto da parte inferior da faixa recente de consolidação.
Cenário otimista: se 5.05–5.06 mantiver, a entrada ali mira 5.15 (resistência da faixa) e depois 5.30 (zona LH/HH).
SL em 4.98, logo abaixo do suporte. Cenário pessimista: um fechamento confirmado abaixo de 5.05 favorece uma queda em direção a 4.90 (linha de suporte teal), já que a ruptura da linha de tendência mais o RSI virando de 50 em direção a 41 indicam perda de momentum.
Este é um ponto de decisão, não uma tendência limpa — espere por confirmação (reclaim ou uma vela de rompimento bem definida) em vez de entrar no meio da faixa.
@Binance Square Official #BitcoinClears$85200 #AltcoinSeasonIndexHoldsAbove60For5Days #USADPAdds90000JobsInSeptember #Binance #ChartSniper
1
239
·
--
Em Alta
Título: $GLMR Bounce Play 📈
$GLMR/USDT – Retração bullish
Entrada: 0.00885–0.00895 (zona de 50–61,8%)
TP: 0.0093 / 0.0101
SL: 0.0078
⚠️ Não é conselho financeiro. Faça sua própria pesquisa (DYOR).
Notas sobre os níveis (a partir do seu gráfico):
Entrada: 0.00885–0.00895, a zona de retração de 50%–61,8% de Fibonacci onde o preço está atualmente — uma área comum para os touros recuarem após o movimento de impulso sair da LL.
TP1 (0.0093): a Fib de 28,2% / resistência anterior da consolidação. TP2 (0.0101): a máxima do último movimento (HH) — alvo de retração total se o momentum continuar.
SL (0.0078): logo abaixo da Fib de 100% / LL — se o preço fechar abaixo disso, a estrutura bullish é invalidada e o movimento provavelmente falha.
RSI em 68 já está forte; então confirme que o preço sustenta a zona (não apenas “encaixa” com pavio curto) antes de entrar, em vez de comprar às cegas.
@Binance_Square_Official #BitcoinClears$85200 #AltcoinSeasonIndexHoldsAbove60For5Days
#USADPAdds90000JobsInSeptember #Binance #ChartSniper
{spot}(GLMRUSDT)
Título: $GLMR Bounce Play 📈
$GLMR /USDT – Retração bullish
Entrada: 0.00885–0.00895 (zona de 50–61,8%)
TP: 0.0093 / 0.0101
SL: 0.0078
⚠️ Não é conselho financeiro. Faça sua própria pesquisa (DYOR).
Notas sobre os níveis (a partir do seu gráfico):
Entrada: 0.00885–0.00895, a zona de retração de 50%–61,8% de Fibonacci onde o preço está atualmente — uma área comum para os touros recuarem após o movimento de impulso sair da LL.
TP1 (0.0093): a Fib de 28,2% / resistência anterior da consolidação. TP2 (0.0101): a máxima do último movimento (HH) — alvo de retração total se o momentum continuar.
SL (0.0078): logo abaixo da Fib de 100% / LL — se o preço fechar abaixo disso, a estrutura bullish é invalidada e o movimento provavelmente falha.
RSI em 68 já está forte; então confirme que o preço sustenta a zona (não apenas “encaixa” com pavio curto) antes de entrar, em vez de comprar às cegas.
@Binance Square Official #BitcoinClears$85200 #AltcoinSeasonIndexHoldsAbove60For5Days
#USADPAdds90000JobsInSeptember #Binance #ChartSniper
$GLMR /USDT – Retração bullish
Entrada: 0.00885–0.00895 (zona de 50–61,8%)
TP: 0.0093 / 0.0101
SL: 0.0078
⚠️ Não é conselho financeiro. Faça sua própria pesquisa (DYOR).
Notas sobre os níveis (a partir do seu gráfico):
Entrada: 0.00885–0.00895, a zona de retração de 50%–61,8% de Fibonacci onde o preço está atualmente — uma área comum para os touros recuarem após o movimento de impulso sair da LL.
TP1 (0.0093): a Fib de 28,2% / resistência anterior da consolidação. TP2 (0.0101): a máxima do último movimento (HH) — alvo de retração total se o momentum continuar.
SL (0.0078): logo abaixo da Fib de 100% / LL — se o preço fechar abaixo disso, a estrutura bullish é invalidada e o movimento provavelmente falha.
RSI em 68 já está forte; então confirme que o preço sustenta a zona (não apenas “encaixa” com pavio curto) antes de entrar, em vez de comprar às cegas.
@Binance Square Official #BitcoinClears$85200 #AltcoinSeasonIndexHoldsAbove60For5Days
#USADPAdds90000JobsInSeptember #Binance #ChartSniper
170
·
--
Em Alta
Título: $PROM Continuação de alta 🚀
$PROM USDT (Perp) – Canal de alta
Entrada: 5.90–6.00 (reteste)
TP: 6.25 / 6.70
SL: 5.50
Canal em alta, estrutura de HH/LL intacta.
⚠️ Não é aconselhamento financeiro. Faça sua própria pesquisa (DYOR).
Notas sobre os níveis (a partir do seu gráfico):
O preço rompeu para uma nova máxima (HH) em 6.247 após saltar do suporte do canal na máxima-baixa (higher-low) por volta de 5.50.
Entrada: uma retração para a faixa de 5.90–6.00 (resistência anterior convertida em suporte) oferece uma relação risco/recompensa melhor do que perseguir o preço atual de 6.04.
TP1 (6.25): máxima/resistência recente.
TP2 (6.70): projeção da linha superior do canal.
SL (5.50): abaixo da última mínima da oscilação (LL) e da base do canal — invalida a estrutura da tendência de alta se for atingido.
@Binance_Square_Official #QNTRises39% #EthereumBreaksAbove$2700 #BitgetBreachForgedRequestsNotStolenKeys #Binance #ChartSniper
{future}(PROMUSDT)
Título: $PROM Continuação de alta 🚀
$PROM USDT (Perp) – Canal de alta
Entrada: 5.90–6.00 (reteste)
TP: 6.25 / 6.70
SL: 5.50
Canal em alta, estrutura de HH/LL intacta.
⚠️ Não é aconselhamento financeiro. Faça sua própria pesquisa (DYOR).
Notas sobre os níveis (a partir do seu gráfico):
O preço rompeu para uma nova máxima (HH) em 6.247 após saltar do suporte do canal na máxima-baixa (higher-low) por volta de 5.50.
Entrada: uma retração para a faixa de 5.90–6.00 (resistência anterior convertida em suporte) oferece uma relação risco/recompensa melhor do que perseguir o preço atual de 6.04.
TP1 (6.25): máxima/resistência recente.
TP2 (6.70): projeção da linha superior do canal.
SL (5.50): abaixo da última mínima da oscilação (LL) e da base do canal — invalida a estrutura da tendência de alta se for atingido.
@Binance Square Official #QNTRises39% #EthereumBreaksAbove$2700 #BitgetBreachForgedRequestsNotStolenKeys #Binance #ChartSniper
$PROM USDT (Perp) – Canal de alta
Entrada: 5.90–6.00 (reteste)
TP: 6.25 / 6.70
SL: 5.50
Canal em alta, estrutura de HH/LL intacta.
⚠️ Não é aconselhamento financeiro. Faça sua própria pesquisa (DYOR).
Notas sobre os níveis (a partir do seu gráfico):
O preço rompeu para uma nova máxima (HH) em 6.247 após saltar do suporte do canal na máxima-baixa (higher-low) por volta de 5.50.
Entrada: uma retração para a faixa de 5.90–6.00 (resistência anterior convertida em suporte) oferece uma relação risco/recompensa melhor do que perseguir o preço atual de 6.04.
TP1 (6.25): máxima/resistência recente.
TP2 (6.70): projeção da linha superior do canal.
SL (5.50): abaixo da última mínima da oscilação (LL) e da base do canal — invalida a estrutura da tendência de alta se for atingido.
@Binance Square Official #QNTRises39% #EthereumBreaksAbove$2700 #BitgetBreachForgedRequestsNotStolenKeys #Binance #ChartSniper
239
·
--
Artigo
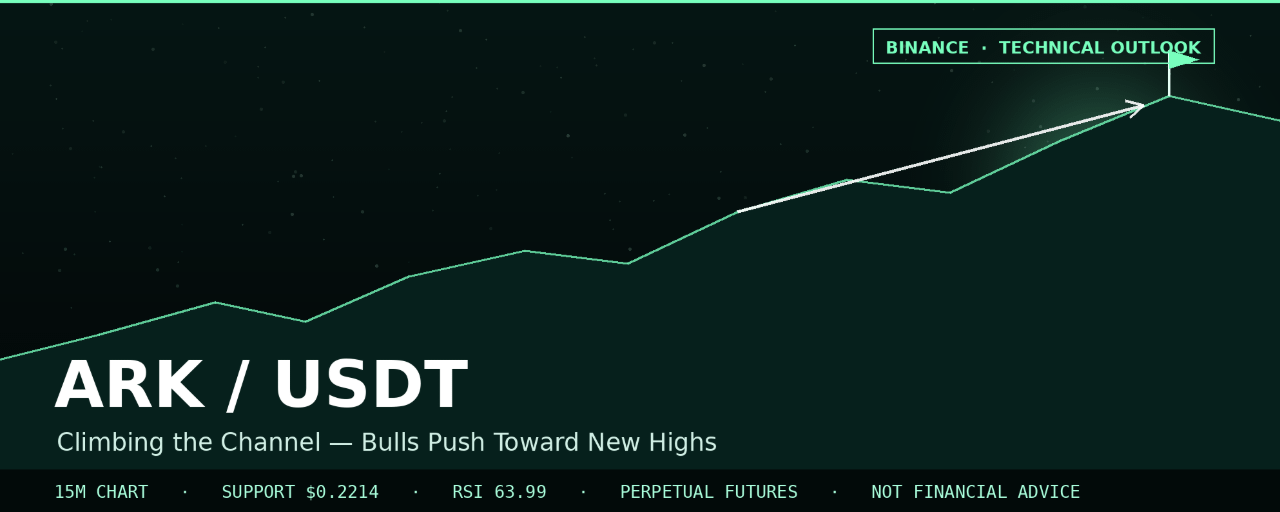
ARK/USDT sobe dentro do canal: touros pressionam por novas máximas$ARK
A ARK tem sido um dos escaladores mais fortes e consistentes no painel, avançando dentro de um canal ascendente limpo com uma estrutura de Higher High / Higher Low (Topo mais Alto / Fundo mais Alto) bem clássica. Após uma correção saudável e uma retomada, o preço volta a pressionar sua máxima recente — e o cenário favorece continuação enquanto o canal se mantiver.
Visão geral da estrutura de mercado
ARK/USDT (Futuros Perpétuos, Binance, timeframe de 15M) tem estado em uma alta persistente e bem organizada:
O preço avançou de forma constante, saindo de aproximadamente US$ 0,155, formando uma sequência de topos mais baixos que viraram topos mais altos à medida que a tendência amadureceu — um primeiro LH perto de US$ 0,165, seguido por outro LH em torno de US$ 0,195, antes de a estrutura virar de forma decisiva para alta.
ARK/USDT sobe dentro do canal: touros pressionam por novas máximas
$ARK
A ARK tem sido um dos escaladores mais fortes e consistentes no painel, avançando dentro de um canal ascendente limpo com uma estrutura de Higher High / Higher Low (Topo mais Alto / Fundo mais Alto) bem clássica. Após uma correção saudável e uma retomada, o preço volta a pressionar sua máxima recente — e o cenário favorece continuação enquanto o canal se mantiver.
Visão geral da estrutura de mercado
ARK/USDT (Futuros Perpétuos, Binance, timeframe de 15M) tem estado em uma alta persistente e bem organizada:
O preço avançou de forma constante, saindo de aproximadamente US$ 0,155, formando uma sequência de topos mais baixos que viraram topos mais altos à medida que a tendência amadureceu — um primeiro LH perto de US$ 0,165, seguido por outro LH em torno de US$ 0,195, antes de a estrutura virar de forma decisiva para alta.
A ARK tem sido um dos escaladores mais fortes e consistentes no painel, avançando dentro de um canal ascendente limpo com uma estrutura de Higher High / Higher Low (Topo mais Alto / Fundo mais Alto) bem clássica. Após uma correção saudável e uma retomada, o preço volta a pressionar sua máxima recente — e o cenário favorece continuação enquanto o canal se mantiver.
Visão geral da estrutura de mercado
ARK/USDT (Futuros Perpétuos, Binance, timeframe de 15M) tem estado em uma alta persistente e bem organizada:
O preço avançou de forma constante, saindo de aproximadamente US$ 0,155, formando uma sequência de topos mais baixos que viraram topos mais altos à medida que a tendência amadureceu — um primeiro LH perto de US$ 0,165, seguido por outro LH em torno de US$ 0,195, antes de a estrutura virar de forma decisiva para alta.
122
·
--
Título: RARA análise de rompimento ⚡
$RARE USDT (Perp) – Triângulo simétrico
Entrada: Romper acima de 0.0171
TP: 0.0180 / 0.0185
SL: 0.0160
Detalhamento: Entrada abaixo de 0.0162, TP 0.0155
⚠️ Não é conselho financeiro. Faça sua própria pesquisa (DYOR).
Notas sobre os níveis (do seu gráfico):
O preço está se comprimindo no ápice de um triângulo simétrico em torno de 0.01633, com os níveis de Fibonacci 61,8%/50% funcionando como suporte (0.0162–0.0163) e o topo do triângulo/Fib 28,2% como resistência (0.0171).
Entrada bullish: espere por um fechamento confirmado acima de 0.0171 (rompimento do triângulo), mirando 0.0180 e depois 0.0185.
Entrada bearish: se o preço romper abaixo do suporte do ápice 0.0162, visando 0.0155.
@Binance_Square_Official #QNTRises39% #EthereumBreaksAbove$2700 #BitgetBreachForgedRequestsNotStolenKeys #Binance #ChartSniper
{future}(RAREUSDT)
Título: RARA análise de rompimento ⚡
$RARE USDT (Perp) – Triângulo simétrico
Entrada: Romper acima de 0.0171
TP: 0.0180 / 0.0185
SL: 0.0160
Detalhamento: Entrada abaixo de 0.0162, TP 0.0155
⚠️ Não é conselho financeiro. Faça sua própria pesquisa (DYOR).
Notas sobre os níveis (do seu gráfico):
O preço está se comprimindo no ápice de um triângulo simétrico em torno de 0.01633, com os níveis de Fibonacci 61,8%/50% funcionando como suporte (0.0162–0.0163) e o topo do triângulo/Fib 28,2% como resistência (0.0171).
Entrada bullish: espere por um fechamento confirmado acima de 0.0171 (rompimento do triângulo), mirando 0.0180 e depois 0.0185.
Entrada bearish: se o preço romper abaixo do suporte do ápice 0.0162, visando 0.0155.
@Binance Square Official #QNTRises39% #EthereumBreaksAbove$2700 #BitgetBreachForgedRequestsNotStolenKeys #Binance #ChartSniper
$RARE USDT (Perp) – Triângulo simétrico
Entrada: Romper acima de 0.0171
TP: 0.0180 / 0.0185
SL: 0.0160
Detalhamento: Entrada abaixo de 0.0162, TP 0.0155
⚠️ Não é conselho financeiro. Faça sua própria pesquisa (DYOR).
Notas sobre os níveis (do seu gráfico):
O preço está se comprimindo no ápice de um triângulo simétrico em torno de 0.01633, com os níveis de Fibonacci 61,8%/50% funcionando como suporte (0.0162–0.0163) e o topo do triângulo/Fib 28,2% como resistência (0.0171).
Entrada bullish: espere por um fechamento confirmado acima de 0.0171 (rompimento do triângulo), mirando 0.0180 e depois 0.0185.
Entrada bearish: se o preço romper abaixo do suporte do ápice 0.0162, visando 0.0155.
@Binance Square Official #QNTRises39% #EthereumBreaksAbove$2700 #BitgetBreachForgedRequestsNotStolenKeys #Binance #ChartSniper
279
·
--
Artigo
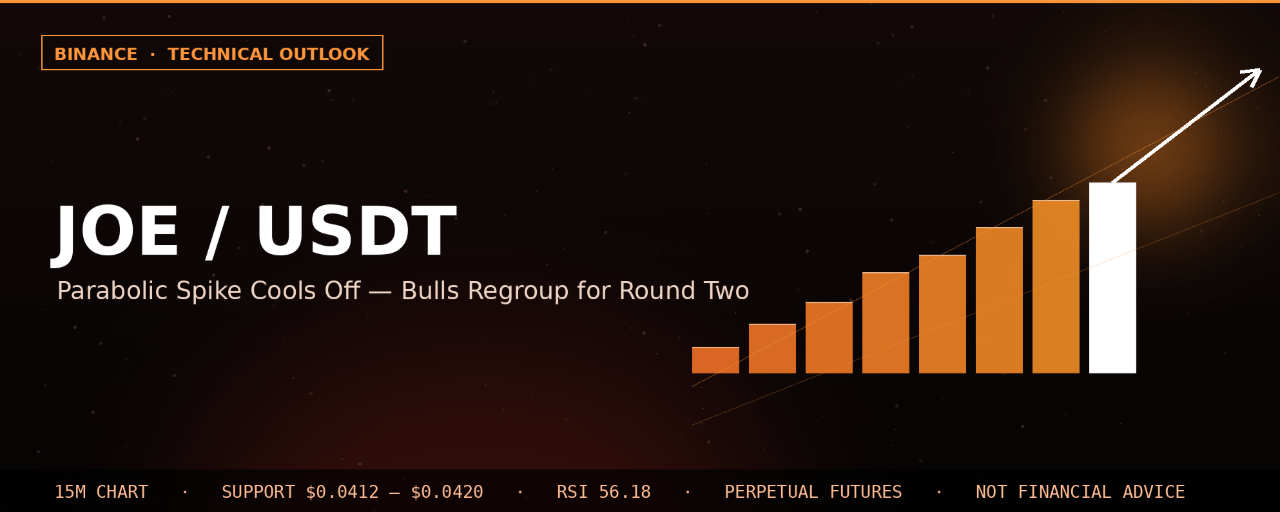
A Fagulha Parabólica do JOE/USDT Esfria: Os Touros se Reagrupam para a Rodada Dois$JOE
O JOE fez um dos movimentos mais agudos do tabuleiro — um rompimento rápido e quase vertical de um canal em alta que marcou uma Alta Mais Alta antes de recuar para uma consolidação apertada. Com o momentum ainda favorável e o preço sustentando-se acima de um suporte-chave, a configuração parece pronta para uma possível continuação.
Visão Geral da Estrutura de Mercado
JOE/USDT (Futuros Perpétuos, Binance, timeframe de 15M) vem construindo uma estrutura altista nas últimas sessões:
O preço saiu perto de US$ 0,0330–0,0345, formando uma primeira Baixa Mais Alta (LH) por volta de US$ 0,0355 antes de ficar lateralizado em uma faixa de acumulação apertada.
A Fagulha Parabólica do JOE/USDT Esfria: Os Touros se Reagrupam para a Rodada Dois
$JOE
O JOE fez um dos movimentos mais agudos do tabuleiro — um rompimento rápido e quase vertical de um canal em alta que marcou uma Alta Mais Alta antes de recuar para uma consolidação apertada. Com o momentum ainda favorável e o preço sustentando-se acima de um suporte-chave, a configuração parece pronta para uma possível continuação.
Visão Geral da Estrutura de Mercado
JOE/USDT (Futuros Perpétuos, Binance, timeframe de 15M) vem construindo uma estrutura altista nas últimas sessões:
O preço saiu perto de US$ 0,0330–0,0345, formando uma primeira Baixa Mais Alta (LH) por volta de US$ 0,0355 antes de ficar lateralizado em uma faixa de acumulação apertada.
O JOE fez um dos movimentos mais agudos do tabuleiro — um rompimento rápido e quase vertical de um canal em alta que marcou uma Alta Mais Alta antes de recuar para uma consolidação apertada. Com o momentum ainda favorável e o preço sustentando-se acima de um suporte-chave, a configuração parece pronta para uma possível continuação.
Visão Geral da Estrutura de Mercado
JOE/USDT (Futuros Perpétuos, Binance, timeframe de 15M) vem construindo uma estrutura altista nas últimas sessões:
O preço saiu perto de US$ 0,0330–0,0345, formando uma primeira Baixa Mais Alta (LH) por volta de US$ 0,0355 antes de ficar lateralizado em uma faixa de acumulação apertada.
415
·
--
Artigo
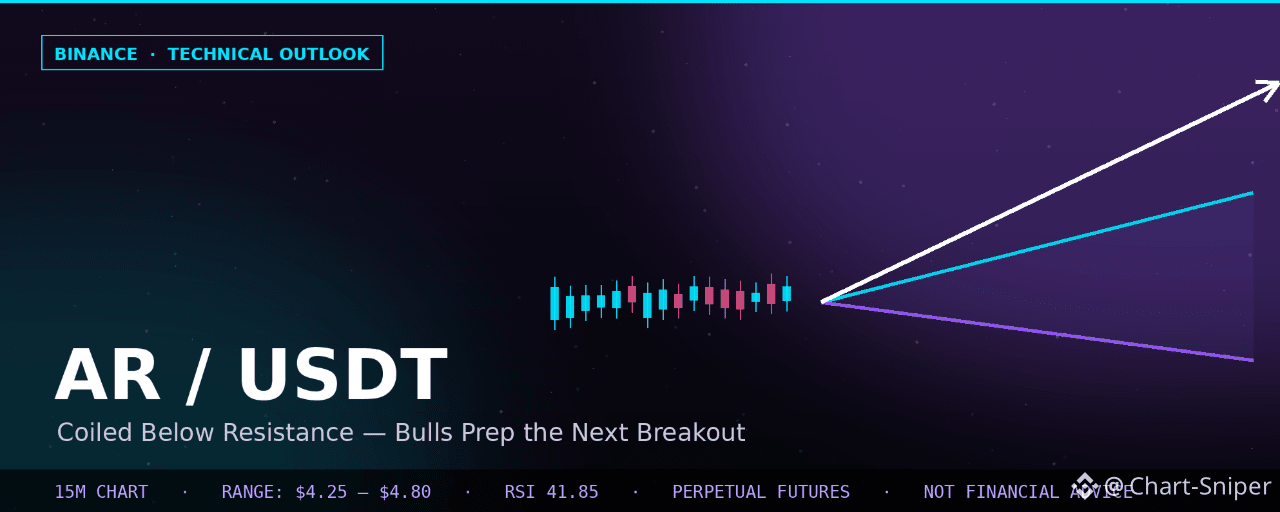
AR/USDT se Comprime Abaixo da Resistência: Preparando-se para o Próximo Grande Movimento$AR
A Arweave (AR) esfria de forma dramática após sua corrida explosiva para a região de US$ 5,20+, e o preço agora está se comprimindo dentro de uma faixa de aperto logo abaixo de uma resistência importante. A estrutura no gráfico de 15M sugere que o mercado está acumulando energia para sua próxima decisão direcional.
Visão Geral da Estrutura do Mercado
AR/USDT (Futuros Perpétuos, Binance, timeframe de 15M) passou por um ciclo violento de expansão e arrefecimento:
O preço explodiu de cerca de US$ 2,70 para um Máximo Mais Alto (HH) perto de US$ 5,20–5,30 em um movimento quase vertical, marcando a perna mais agressiva da tendência recente.
AR/USDT se Comprime Abaixo da Resistência: Preparando-se para o Próximo Grande Movimento
$AR
A Arweave (AR) esfria de forma dramática após sua corrida explosiva para a região de US$ 5,20+, e o preço agora está se comprimindo dentro de uma faixa de aperto logo abaixo de uma resistência importante. A estrutura no gráfico de 15M sugere que o mercado está acumulando energia para sua próxima decisão direcional.
Visão Geral da Estrutura do Mercado
AR/USDT (Futuros Perpétuos, Binance, timeframe de 15M) passou por um ciclo violento de expansão e arrefecimento:
O preço explodiu de cerca de US$ 2,70 para um Máximo Mais Alto (HH) perto de US$ 5,20–5,30 em um movimento quase vertical, marcando a perna mais agressiva da tendência recente.
A Arweave (AR) esfria de forma dramática após sua corrida explosiva para a região de US$ 5,20+, e o preço agora está se comprimindo dentro de uma faixa de aperto logo abaixo de uma resistência importante. A estrutura no gráfico de 15M sugere que o mercado está acumulando energia para sua próxima decisão direcional.
Visão Geral da Estrutura do Mercado
AR/USDT (Futuros Perpétuos, Binance, timeframe de 15M) passou por um ciclo violento de expansão e arrefecimento:
O preço explodiu de cerca de US$ 2,70 para um Máximo Mais Alto (HH) perto de US$ 5,20–5,30 em um movimento quase vertical, marcando a perna mais agressiva da tendência recente.
1
669
·
--
Artigo
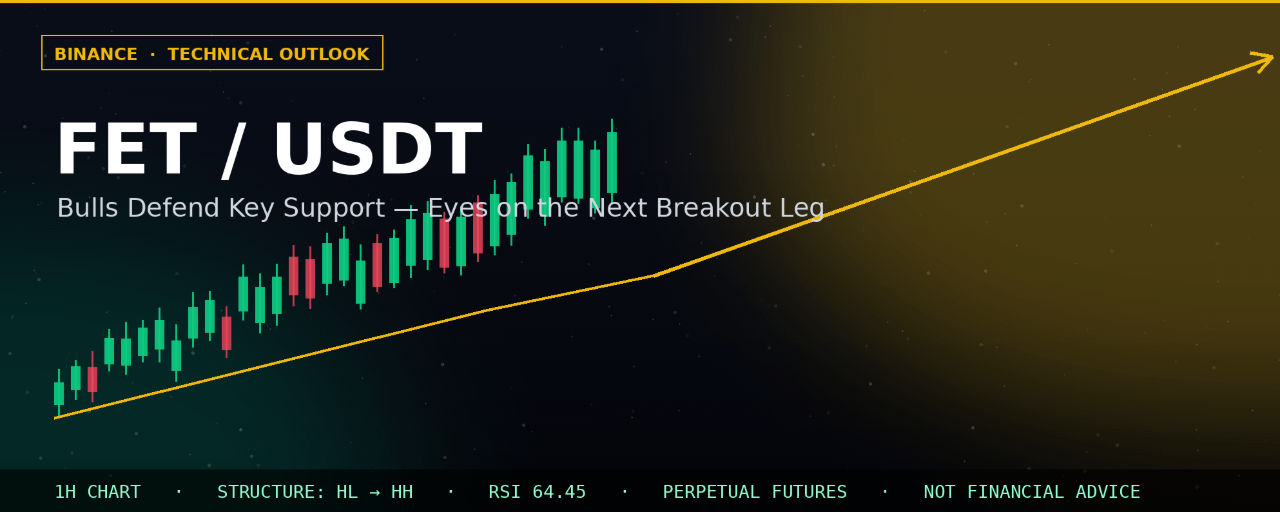
FET/USDT Mirando um Rompimento: os Touros Defendem o Suporte-Chave Acima de US$ 0.22$FET
Fetch.ai (FET) está mantendo intacta a estrutura de tendência do timeframe maior após marcar um novo Topo Mais Alto (Higher High) perto de US$ 0.2405. Agora o preço está esfriando em direção a uma faixa de suporte bem definida, e o setup no gráfico de 1H está se formando em um padrão clássico de pullback antes de continuidade.
Visão Geral da Estrutura de Mercado
FET/USDT (Futuros Perpétuos, Binance, timeframe de 1H) concluiu uma mudança limpa na estrutura de tendência:
A ação de preço anterior registrou uma sequência de Mínimos Mais Baixos (Lower Lows, LL) e Máximos Mais Baixos (Lower Highs, LH), confirmando a tendência de baixa anterior da região de US$ 0.30 até a base em torno de US$ 0.145.
FET/USDT Mirando um Rompimento: os Touros Defendem o Suporte-Chave Acima de US$ 0.22
$FET
Fetch.ai (FET) está mantendo intacta a estrutura de tendência do timeframe maior após marcar um novo Topo Mais Alto (Higher High) perto de US$ 0.2405. Agora o preço está esfriando em direção a uma faixa de suporte bem definida, e o setup no gráfico de 1H está se formando em um padrão clássico de pullback antes de continuidade.
Visão Geral da Estrutura de Mercado
FET/USDT (Futuros Perpétuos, Binance, timeframe de 1H) concluiu uma mudança limpa na estrutura de tendência:
A ação de preço anterior registrou uma sequência de Mínimos Mais Baixos (Lower Lows, LL) e Máximos Mais Baixos (Lower Highs, LH), confirmando a tendência de baixa anterior da região de US$ 0.30 até a base em torno de US$ 0.145.
Fetch.ai (FET) está mantendo intacta a estrutura de tendência do timeframe maior após marcar um novo Topo Mais Alto (Higher High) perto de US$ 0.2405. Agora o preço está esfriando em direção a uma faixa de suporte bem definida, e o setup no gráfico de 1H está se formando em um padrão clássico de pullback antes de continuidade.
Visão Geral da Estrutura de Mercado
FET/USDT (Futuros Perpétuos, Binance, timeframe de 1H) concluiu uma mudança limpa na estrutura de tendência:
A ação de preço anterior registrou uma sequência de Mínimos Mais Baixos (Lower Lows, LL) e Máximos Mais Baixos (Lower Highs, LH), confirmando a tendência de baixa anterior da região de US$ 0.30 até a base em torno de US$ 0.145.
1
303
·
--
Em Baixa
Título: ONE Short Setup 🔻
$ONE USDT (Perp) – Bearish
{future}(ONEUSDT)
Entrada: 0.0029–0.0030
TP: 0.0025 / 0.0023
SL: 0.0031
Canal de queda + LH/LL. Espere a retest.
⚠️ Não é aconselhamento financeiro. Faça sua própria pesquisa (DYOR).
Notas sobre os níveis (do seu gráfico):
Zona de entrada: a caixa de oferta em 0.00285–0.00302, onde o preço pode retestar antes de cair, como mostram suas setas vermelhas. TP1 (0.0025): a linha inferior do canal. TP2 (0.0023): a próxima área de suporte se o canal romper. SL (0.0031): logo acima da zona de oferta e do topo do canal.
@Binance_Square_Official #AIStocksWhatNext #BitcoinRejectedAt$87,300Twice #BCHJumps28%OnCMEFuturesListing #Binance #ChartSniper
Título: ONE Short Setup 🔻
$ONE USDT (Perp) – Bearish
Entrada: 0.0029–0.0030
TP: 0.0025 / 0.0023
SL: 0.0031
Canal de queda + LH/LL. Espere a retest.
⚠️ Não é aconselhamento financeiro. Faça sua própria pesquisa (DYOR).
Notas sobre os níveis (do seu gráfico):
Zona de entrada: a caixa de oferta em 0.00285–0.00302, onde o preço pode retestar antes de cair, como mostram suas setas vermelhas. TP1 (0.0025): a linha inferior do canal. TP2 (0.0023): a próxima área de suporte se o canal romper. SL (0.0031): logo acima da zona de oferta e do topo do canal.
@Binance Square Official #AIStocksWhatNext #BitcoinRejectedAt$87,300Twice #BCHJumps28%OnCMEFuturesListing #Binance #ChartSniper
$ONE USDT (Perp) – Bearish
Entrada: 0.0029–0.0030
TP: 0.0025 / 0.0023
SL: 0.0031
Canal de queda + LH/LL. Espere a retest.
⚠️ Não é aconselhamento financeiro. Faça sua própria pesquisa (DYOR).
Notas sobre os níveis (do seu gráfico):
Zona de entrada: a caixa de oferta em 0.00285–0.00302, onde o preço pode retestar antes de cair, como mostram suas setas vermelhas. TP1 (0.0025): a linha inferior do canal. TP2 (0.0023): a próxima área de suporte se o canal romper. SL (0.0031): logo acima da zona de oferta e do topo do canal.
@Binance Square Official #AIStocksWhatNext #BitcoinRejectedAt$87,300Twice #BCHJumps28%OnCMEFuturesListing #Binance #ChartSniper
439
·
--
Artigo
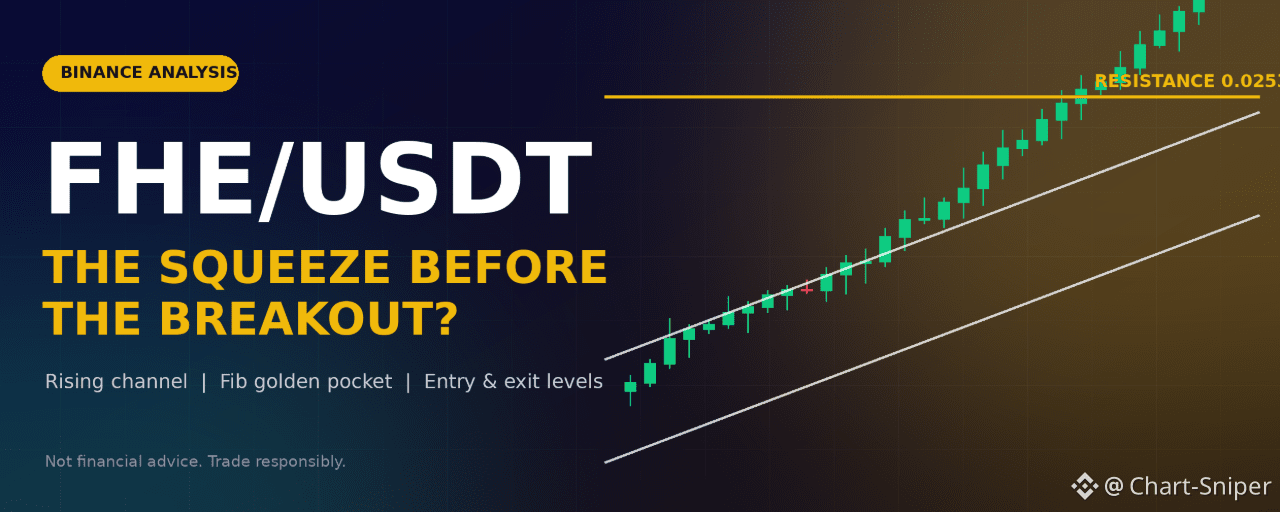
FHE/USDT: Preço Se Comprime Dentro de um Canal Ascendente, e o Teto de US$ 0.0254 Decide o Próximo Grande Movimento$FHE
Visão Geral do Mercado
FHE/USDT está sendo negociado perto de 0.02393, após uma sessão volátil que gerou um forte pico para cerca de 0.0253 e uma liquidação igualmente violenta para cerca de 0.0219 antes que os compradores voltassem a aparecer. Apesar do ruído, o panorama maior é construtivo: desde a mínima do swing perto de 0.0193 em 16 de setembro, o preço vem subindo dentro de um canal ascendente limpo, registrando uma sequência de máximas mais altas e mínimas mais altas.
Neste momento, o preço está quase exatamente no nível horizontal de 0.02406, o ponto em que o rally anterior travou e onde compradores e vendedores brigam por controle.
FHE/USDT: Preço Se Comprime Dentro de um Canal Ascendente, e o Teto de US$ 0.0254 Decide o Próximo Grande Movimento
$FHE
Visão Geral do Mercado
FHE/USDT está sendo negociado perto de 0.02393, após uma sessão volátil que gerou um forte pico para cerca de 0.0253 e uma liquidação igualmente violenta para cerca de 0.0219 antes que os compradores voltassem a aparecer. Apesar do ruído, o panorama maior é construtivo: desde a mínima do swing perto de 0.0193 em 16 de setembro, o preço vem subindo dentro de um canal ascendente limpo, registrando uma sequência de máximas mais altas e mínimas mais altas.
Neste momento, o preço está quase exatamente no nível horizontal de 0.02406, o ponto em que o rally anterior travou e onde compradores e vendedores brigam por controle.
Visão Geral do Mercado
FHE/USDT está sendo negociado perto de 0.02393, após uma sessão volátil que gerou um forte pico para cerca de 0.0253 e uma liquidação igualmente violenta para cerca de 0.0219 antes que os compradores voltassem a aparecer. Apesar do ruído, o panorama maior é construtivo: desde a mínima do swing perto de 0.0193 em 16 de setembro, o preço vem subindo dentro de um canal ascendente limpo, registrando uma sequência de máximas mais altas e mínimas mais altas.
Neste momento, o preço está quase exatamente no nível horizontal de 0.02406, o ponto em que o rally anterior travou e onde compradores e vendedores brigam por controle.
347
·
--
Artigo
ENA/USDT: Os Touros se Reagrupam na Linha de Tendência — $0,31 é o Próximo Destino?$FHE
A ENA da Ethena passou a segunda metade de setembro fazendo exatamente o que as fortes tendências de alta fazem antes da próxima perna: esfriar sem entrar em queda. Depois de uma arrancada impulsiva a partir das mínimas de meados de setembro, ENA/USDT agora está consolidando logo abaixo da sua máxima recente, e a estrutura no gráfico de 1H sugere que a correção pode estar mais perto do fim do que não.
Leitura da Estrutura
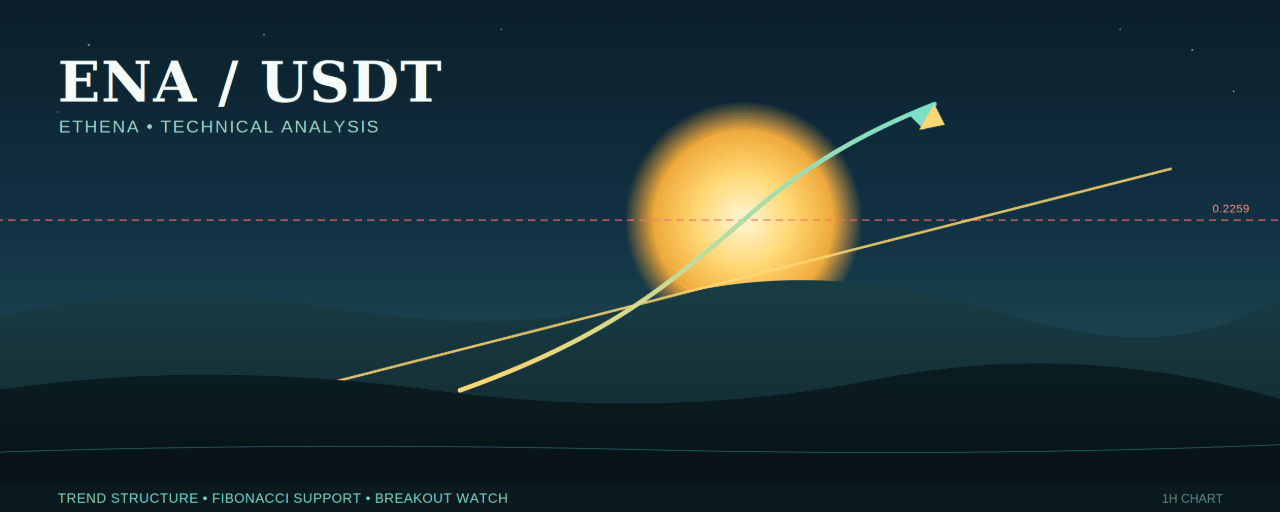
O gráfico perpétuo de 1H ENA/USDT (Binance) mostra uma sequência perfeita de fundo mais alto → topo mais baixo → topo mais alto, se estendendo da base de 15–16 de setembro por volta de 0,145 até 0,190 e chegando à máxima de 0,2259 no swing. Isso é uma tendência de alta bem definida por qualquer critério técnico — cada correção foi menos profunda do que a alta que veio antes, e os compradores têm voltado consistentemente antes da mínima anterior do swing.
ENA/USDT: Os Touros se Reagrupam na Linha de Tendência — $0,31 é o Próximo Destino?
$FHE
A ENA da Ethena passou a segunda metade de setembro fazendo exatamente o que as fortes tendências de alta fazem antes da próxima perna: esfriar sem entrar em queda. Depois de uma arrancada impulsiva a partir das mínimas de meados de setembro, ENA/USDT agora está consolidando logo abaixo da sua máxima recente, e a estrutura no gráfico de 1H sugere que a correção pode estar mais perto do fim do que não.
Leitura da Estrutura
O gráfico perpétuo de 1H ENA/USDT (Binance) mostra uma sequência perfeita de fundo mais alto → topo mais baixo → topo mais alto, se estendendo da base de 15–16 de setembro por volta de 0,145 até 0,190 e chegando à máxima de 0,2259 no swing. Isso é uma tendência de alta bem definida por qualquer critério técnico — cada correção foi menos profunda do que a alta que veio antes, e os compradores têm voltado consistentemente antes da mínima anterior do swing.
A ENA da Ethena passou a segunda metade de setembro fazendo exatamente o que as fortes tendências de alta fazem antes da próxima perna: esfriar sem entrar em queda. Depois de uma arrancada impulsiva a partir das mínimas de meados de setembro, ENA/USDT agora está consolidando logo abaixo da sua máxima recente, e a estrutura no gráfico de 1H sugere que a correção pode estar mais perto do fim do que não.
Leitura da Estrutura
O gráfico perpétuo de 1H ENA/USDT (Binance) mostra uma sequência perfeita de fundo mais alto → topo mais baixo → topo mais alto, se estendendo da base de 15–16 de setembro por volta de 0,145 até 0,190 e chegando à máxima de 0,2259 no swing. Isso é uma tendência de alta bem definida por qualquer critério técnico — cada correção foi menos profunda do que a alta que veio antes, e os compradores têm voltado consistentemente antes da mínima anterior do swing.
364
·
--
Artigo
Acompanhamento do rompimento ZRO/USDT: os touros explodem para uma nova máxima mais alta — US$ 1,70 é o próximo?$ZRO
LayerZero (ZRO/USDT Perpétuo) — gráfico de 1H, Binance
O token nativo da LayerZero acabou de fazer algo que não acontecia há semanas: ele imprimiu uma máxima (Higher High) bem definida, confirmando que a queda de múltiplas semanas finalmente virou para uma estrutura de mercado bullish. Depois de consolidar na faixa de US$ 0,93–US$ 1,05 em meados de setembro, a ZRO montou uma reversão “de manual” — e o gráfico agora deixa uma pergunta no ar: será que este rali tem mais uma perna, ou está na hora de uma pausa na resistência?
Lendo a Estrutura
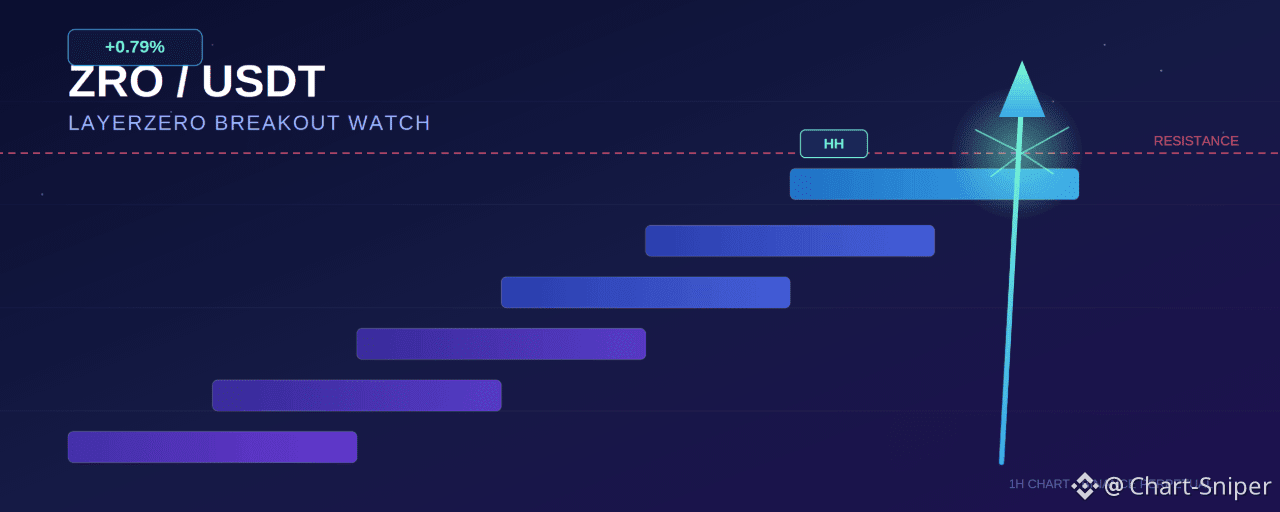
O gráfico de 1H conta uma história clara. O preço esculpiu uma mínima mais baixa (Lower Low) perto de US$ 1,02, fez um fundo com uma mínima mais alta (Higher Low) perto de US$ 0,95 e, em seguida, construiu um canal de alta que tem se mantido com disciplina impressionante. No caminho, marcou uma máxima mais baixa (Lower High) perto de US$ 1,20 antes de um “shakeout” com outra mínima mais baixa perto de US$ 1,05, o que eliminou os vendedores tardios — o clássico “spring” antes do movimento de verdade.
Acompanhamento do rompimento ZRO/USDT: os touros explodem para uma nova máxima mais alta — US$ 1,70 é o próximo?
$ZRO
LayerZero (ZRO/USDT Perpétuo) — gráfico de 1H, Binance
O token nativo da LayerZero acabou de fazer algo que não acontecia há semanas: ele imprimiu uma máxima (Higher High) bem definida, confirmando que a queda de múltiplas semanas finalmente virou para uma estrutura de mercado bullish. Depois de consolidar na faixa de US$ 0,93–US$ 1,05 em meados de setembro, a ZRO montou uma reversão “de manual” — e o gráfico agora deixa uma pergunta no ar: será que este rali tem mais uma perna, ou está na hora de uma pausa na resistência?
Lendo a Estrutura
O gráfico de 1H conta uma história clara. O preço esculpiu uma mínima mais baixa (Lower Low) perto de US$ 1,02, fez um fundo com uma mínima mais alta (Higher Low) perto de US$ 0,95 e, em seguida, construiu um canal de alta que tem se mantido com disciplina impressionante. No caminho, marcou uma máxima mais baixa (Lower High) perto de US$ 1,20 antes de um “shakeout” com outra mínima mais baixa perto de US$ 1,05, o que eliminou os vendedores tardios — o clássico “spring” antes do movimento de verdade.
LayerZero (ZRO/USDT Perpétuo) — gráfico de 1H, Binance
O token nativo da LayerZero acabou de fazer algo que não acontecia há semanas: ele imprimiu uma máxima (Higher High) bem definida, confirmando que a queda de múltiplas semanas finalmente virou para uma estrutura de mercado bullish. Depois de consolidar na faixa de US$ 0,93–US$ 1,05 em meados de setembro, a ZRO montou uma reversão “de manual” — e o gráfico agora deixa uma pergunta no ar: será que este rali tem mais uma perna, ou está na hora de uma pausa na resistência?
Lendo a Estrutura
O gráfico de 1H conta uma história clara. O preço esculpiu uma mínima mais baixa (Lower Low) perto de US$ 1,02, fez um fundo com uma mínima mais alta (Higher Low) perto de US$ 0,95 e, em seguida, construiu um canal de alta que tem se mantido com disciplina impressionante. No caminho, marcou uma máxima mais baixa (Lower High) perto de US$ 1,20 antes de um “shakeout” com outra mínima mais baixa perto de US$ 1,05, o que eliminou os vendedores tardios — o clássico “spring” antes do movimento de verdade.
142
·
--
Artigo
MANTA/USDT: Testando as Máximas Após uma Sequência Perfeita de Canal Ascendente$MANTA
A Manta Network vem construindo com calma um dos uptrends (tendências de alta) mais disciplinados do gráfico — uma sequência constante de higher lows e higher highs, tudo contido de forma organizada dentro de um único canal ascendente. Agora, com o preço pressionando de volta contra a máxima recente, a configuração está tomando forma como uma oportunidade clássica de rompimento e reteste para traders que preferem operar comprado.
Lendo a Estrutura
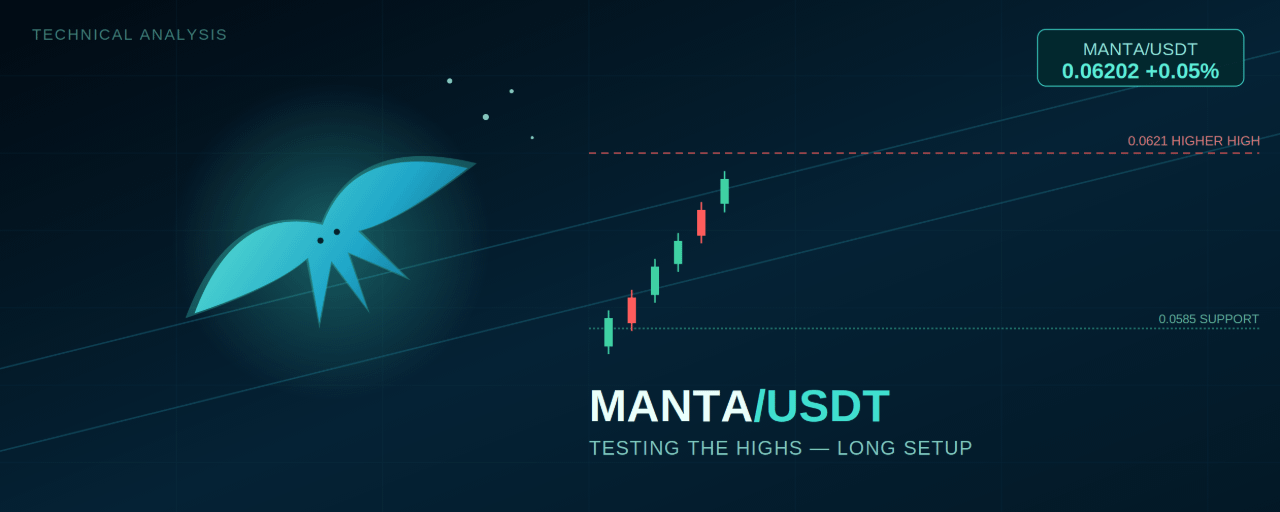
O movimento começou a partir de uma Higher Low (menor mínima) perto de 0,0552 e subiu de forma “textbook” (no padrão clássico) desde então — uma Lower High (menor máxima) por volta de 0,0578, uma segunda Lower High perto de 0,0592 e, por fim, uma Higher High (maior máxima) em 0,0621. Cada perna desse avanço permaneceu contida dentro de um canal ascendente bem definido, com o preço respeitando tanto a linha de suporte em alta abaixo quanto uma linha paralela acima.
MANTA/USDT: Testando as Máximas Após uma Sequência Perfeita de Canal Ascendente
$MANTA
A Manta Network vem construindo com calma um dos uptrends (tendências de alta) mais disciplinados do gráfico — uma sequência constante de higher lows e higher highs, tudo contido de forma organizada dentro de um único canal ascendente. Agora, com o preço pressionando de volta contra a máxima recente, a configuração está tomando forma como uma oportunidade clássica de rompimento e reteste para traders que preferem operar comprado.
Lendo a Estrutura
O movimento começou a partir de uma Higher Low (menor mínima) perto de 0,0552 e subiu de forma “textbook” (no padrão clássico) desde então — uma Lower High (menor máxima) por volta de 0,0578, uma segunda Lower High perto de 0,0592 e, por fim, uma Higher High (maior máxima) em 0,0621. Cada perna desse avanço permaneceu contida dentro de um canal ascendente bem definido, com o preço respeitando tanto a linha de suporte em alta abaixo quanto uma linha paralela acima.
A Manta Network vem construindo com calma um dos uptrends (tendências de alta) mais disciplinados do gráfico — uma sequência constante de higher lows e higher highs, tudo contido de forma organizada dentro de um único canal ascendente. Agora, com o preço pressionando de volta contra a máxima recente, a configuração está tomando forma como uma oportunidade clássica de rompimento e reteste para traders que preferem operar comprado.
Lendo a Estrutura
O movimento começou a partir de uma Higher Low (menor mínima) perto de 0,0552 e subiu de forma “textbook” (no padrão clássico) desde então — uma Lower High (menor máxima) por volta de 0,0578, uma segunda Lower High perto de 0,0592 e, por fim, uma Higher High (maior máxima) em 0,0621. Cada perna desse avanço permaneceu contida dentro de um canal ascendente bem definido, com o preço respeitando tanto a linha de suporte em alta abaixo quanto uma linha paralela acima.
197
·
--
Artigo
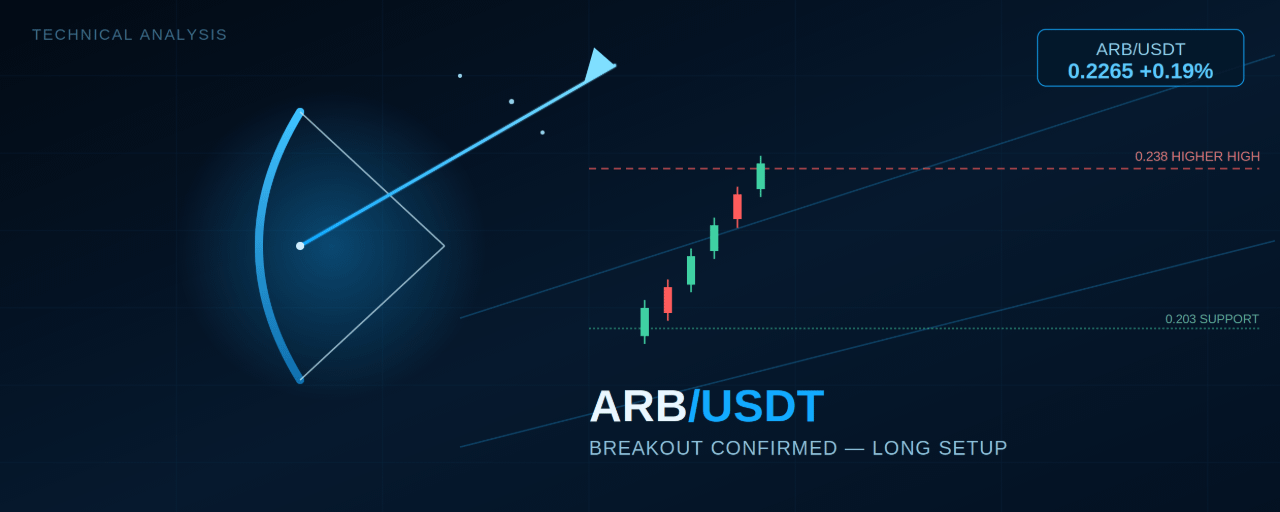
ARB/USDT: Ruptura Confirmada — O Canal de Alargamento Aponta para Cima$ARB
A Arbitrum rompeu uma faixa de consolidação de vários dias com verdadeira convicção, e o acompanhamento desde essa ruptura tem sido exatamente o que os traders de tendência querem ver: um movimento impulsivo acentuado, uma retração rasa que segurou um suporte-chave e um novo impulso de volta às máximas. A estrutura no gráfico de perpétuo de 15 minutos se alinha claramente a favor de continuação.
Lendo a Estrutura
ARB passou a maior parte de duas sessões acumulando de lado entre aproximadamente 0.145 e 0.165, imprimindo uma série de topos descendentes e um último fundo descendente antes que os compradores finalmente assumissem o controle. A partir desse fundo descendente, o preço disparou para uma forte alta impulsiva que produziu o Higher High da sessão perto de 0.238 — uma ruptura limpa acima de toda a faixa anterior.
ARB/USDT: Ruptura Confirmada — O Canal de Alargamento Aponta para Cima
$ARB
A Arbitrum rompeu uma faixa de consolidação de vários dias com verdadeira convicção, e o acompanhamento desde essa ruptura tem sido exatamente o que os traders de tendência querem ver: um movimento impulsivo acentuado, uma retração rasa que segurou um suporte-chave e um novo impulso de volta às máximas. A estrutura no gráfico de perpétuo de 15 minutos se alinha claramente a favor de continuação.
Lendo a Estrutura
ARB passou a maior parte de duas sessões acumulando de lado entre aproximadamente 0.145 e 0.165, imprimindo uma série de topos descendentes e um último fundo descendente antes que os compradores finalmente assumissem o controle. A partir desse fundo descendente, o preço disparou para uma forte alta impulsiva que produziu o Higher High da sessão perto de 0.238 — uma ruptura limpa acima de toda a faixa anterior.
A Arbitrum rompeu uma faixa de consolidação de vários dias com verdadeira convicção, e o acompanhamento desde essa ruptura tem sido exatamente o que os traders de tendência querem ver: um movimento impulsivo acentuado, uma retração rasa que segurou um suporte-chave e um novo impulso de volta às máximas. A estrutura no gráfico de perpétuo de 15 minutos se alinha claramente a favor de continuação.
Lendo a Estrutura
ARB passou a maior parte de duas sessões acumulando de lado entre aproximadamente 0.145 e 0.165, imprimindo uma série de topos descendentes e um último fundo descendente antes que os compradores finalmente assumissem o controle. A partir desse fundo descendente, o preço disparou para uma forte alta impulsiva que produziu o Higher High da sessão perto de 0.238 — uma ruptura limpa acima de toda a faixa anterior.
184
·
--
Artigo
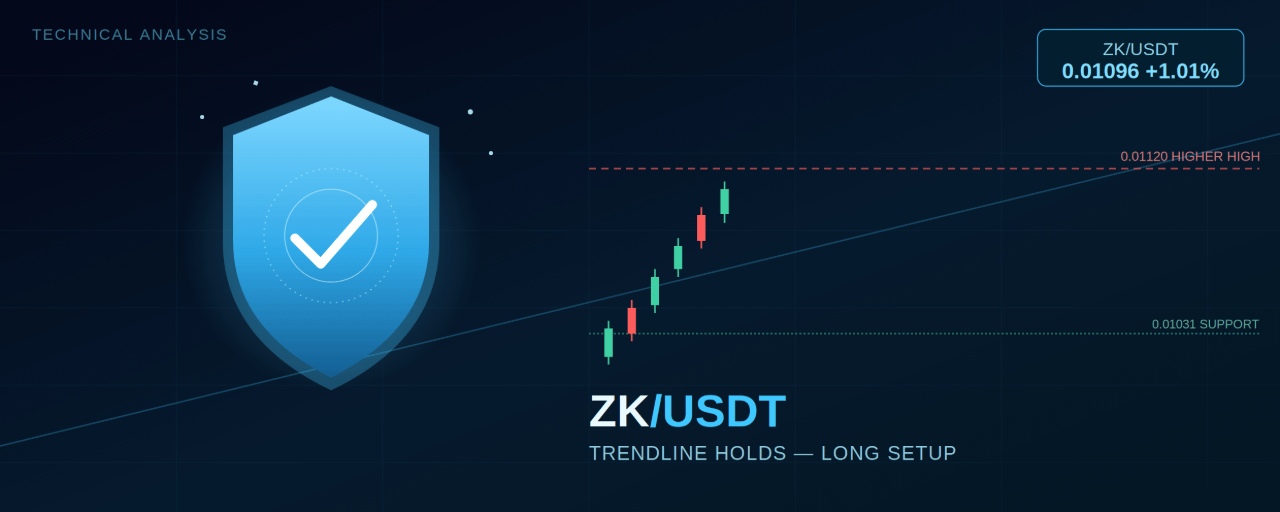
ZK/USDT: A Linha de Tendência Continua Cumprindo Seu Papel — Longo em Andamento$ZK
A ZKsync tem sido uma das mais constantes negociadoras no quadro nas últimas 24 horas, subindo em um padrão de escada disciplinado ao longo de uma única linha de tendência ascendente que não foi rompida uma única vez. Depois de marcar uma nova Higher High e recuar para testar novamente essa mesma linha de tendência, o preço voltou a reagir — e a estrutura ainda favorece os compradores.
Lendo a Estrutura
O movimento remonta a uma mínima perto de 0.0089, e a partir daí a ZK respeitou uma única linha de tendência ascendente contínua ao longo de toda uma sessão, com máximas e mínimas mais altas. No caminho, ela rompeu uma Higher High mais baixa por volta de 0.0110, consolidou e então disparou em uma vela impulsiva e acentuada que gerou a Higher High da sessão.
ZK/USDT: A Linha de Tendência Continua Cumprindo Seu Papel — Longo em Andamento
$ZK
A ZKsync tem sido uma das mais constantes negociadoras no quadro nas últimas 24 horas, subindo em um padrão de escada disciplinado ao longo de uma única linha de tendência ascendente que não foi rompida uma única vez. Depois de marcar uma nova Higher High e recuar para testar novamente essa mesma linha de tendência, o preço voltou a reagir — e a estrutura ainda favorece os compradores.
Lendo a Estrutura
O movimento remonta a uma mínima perto de 0.0089, e a partir daí a ZK respeitou uma única linha de tendência ascendente contínua ao longo de toda uma sessão, com máximas e mínimas mais altas. No caminho, ela rompeu uma Higher High mais baixa por volta de 0.0110, consolidou e então disparou em uma vela impulsiva e acentuada que gerou a Higher High da sessão.
A ZKsync tem sido uma das mais constantes negociadoras no quadro nas últimas 24 horas, subindo em um padrão de escada disciplinado ao longo de uma única linha de tendência ascendente que não foi rompida uma única vez. Depois de marcar uma nova Higher High e recuar para testar novamente essa mesma linha de tendência, o preço voltou a reagir — e a estrutura ainda favorece os compradores.
Lendo a Estrutura
O movimento remonta a uma mínima perto de 0.0089, e a partir daí a ZK respeitou uma única linha de tendência ascendente contínua ao longo de toda uma sessão, com máximas e mínimas mais altas. No caminho, ela rompeu uma Higher High mais baixa por volta de 0.0110, consolidou e então disparou em uma vela impulsiva e acentuada que gerou a Higher High da sessão.
163
·
--
Artigo
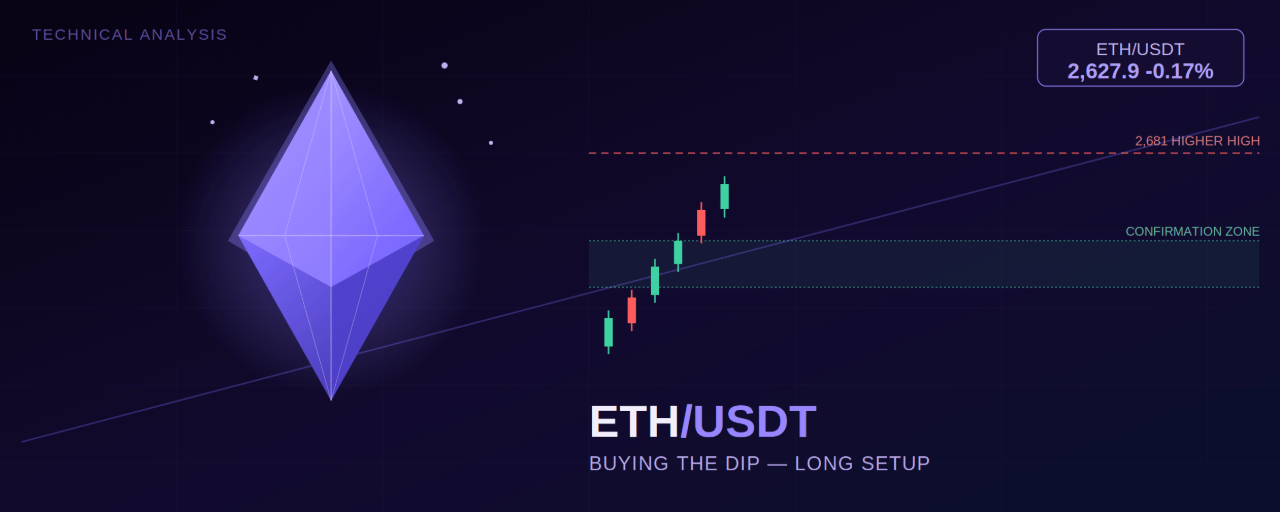
ETH/USDT: Comprando a Queda Dentro de um Uptrend de Livro$ETH
A Ethereum fez um dos seus rallies impulsivos mais limpos nas sessões recentes, disparando a partir de uma mínima de swing e seguindo uma linha de tendência ascendente até uma nova máxima mais alta. Agora, com o preço arrefecendo em um pullback raso, a pergunta que os traders estão fazendo é simples: esta é a queda para comprar, ou o começo de algo mais profundo? Veja como a estrutura se encaixa.
Nota: o gráfico de origem é de ETH/USD na Bitstamp, em vez de ETH/USDT diretamente — ambos acompanham quase exatamente, então os níveis abaixo se aplicam perfeitamente também ao ETH/USDT.
ETH/USDT: Comprando a Queda Dentro de um Uptrend de Livro
$ETH
A Ethereum fez um dos seus rallies impulsivos mais limpos nas sessões recentes, disparando a partir de uma mínima de swing e seguindo uma linha de tendência ascendente até uma nova máxima mais alta. Agora, com o preço arrefecendo em um pullback raso, a pergunta que os traders estão fazendo é simples: esta é a queda para comprar, ou o começo de algo mais profundo? Veja como a estrutura se encaixa.
Nota: o gráfico de origem é de ETH/USD na Bitstamp, em vez de ETH/USDT diretamente — ambos acompanham quase exatamente, então os níveis abaixo se aplicam perfeitamente também ao ETH/USDT.
A Ethereum fez um dos seus rallies impulsivos mais limpos nas sessões recentes, disparando a partir de uma mínima de swing e seguindo uma linha de tendência ascendente até uma nova máxima mais alta. Agora, com o preço arrefecendo em um pullback raso, a pergunta que os traders estão fazendo é simples: esta é a queda para comprar, ou o começo de algo mais profundo? Veja como a estrutura se encaixa.
Nota: o gráfico de origem é de ETH/USD na Bitstamp, em vez de ETH/USDT diretamente — ambos acompanham quase exatamente, então os níveis abaixo se aplicam perfeitamente também ao ETH/USDT.
141
Inicia sessão para explorar mais conteúdos
Junta-te a utilizadores de criptomoedas de todo o mundo na Binance Square
⚡️ Obtém informações úteis e recentes sobre criptomoedas.
💬 Com a confiança da maior exchange de criptomoedas do mundo.
👍 Descobre perspetivas reais de criadores verificados.
E-mail/Número de telefone
Tópicos em Tendência
MetaMaskExitsLidoValidatorsAfterSecurityIncident
4,670 visualizações
213 a discutir
🚨 METAMASK COMEÇOU A SAIR DE VALIDADORES DE ETH APÓS UM INCIDENTE DE SEGURANÇA.
A MetaMask afirma que um incidente de segurança em andamento afetou parte de sua infraestrutura, forçando-a a sair proativamente de validadores afetados em suas operações de staking sem custódia. A empresa diz que não encontrou, até agora, nenhuma ameaça imediata às carteiras da MetaMask.
O detalhe-chave?
Esses validadores estão ligados ao staking da Lido, e o processo de saída pode remover temporariamente ETH do staking enquanto a investigação continua. Relatórios relacionados à Lido dizem que o ciclo completo de saída, saque e reentrada pode levar até cerca de 45 dias.
Isso significa que o mercado deve separar duas coisas:
Usuários de carteiras não estão sendo informados de que estão em risco imediato.
Mas a infraestrutura de validadores claramente era séria o bastante para acionar uma saída de emergência.
E quando uma das maiores marcas de carteiras do Ethereum começa a retirar validadores por precaução, os traders prestam atenção.
Incidentes de segurança não precisam de fundos roubados para mover o mercado.
Às vezes, a própria reação é o sinal. 👀
$ETH $LDO
#metamaskexitslidovalidatorsaftersecurityincident
KimHotbae
·0 gostos
·1.7k visualizações
MicronBeatsEarningsLiftsGuidance
6,987 visualizações
211 a discutir
CFTCSubmitsTwoEventContractRulesToWhiteHouse
6,968 visualizações
203 a discutir