

Zerionix
494 Publicações

Zerionix
Denunciar
Bloquear Utilizador
Crypto Researcher • Market Structure • Data > Hype • Daily updates → NFA
0 A seguir
13 Seguidores
66 Gostaram
Publicações
·
--
Ver tradução
Hyperliquid is taking its perpetuals fight to Europe.
The Hyperliquid Policy Center has urged the European Commission to classify crypto perpetual futures under MiFID II rather than MiCA in its first regulatory filing outside the U.S.
The argument is pretty straightforward.
Perpetuals are derivatives. So their regulatory treatment should depend on what the product actually does, not whether the trade happens on a public blockchain.
That distinction matters.
MiFID II is already the EU framework for financial instruments and derivatives, while MiCA primarily covers crypto assets and services that aren't already regulated under existing financial legislation.
HPC is also asking the EU to recognize something interesting about onchain markets.
Trades, funding payments and liquidations can be publicly verifiable on a blockchain, potentially helping satisfy some transparency and recordkeeping requirements without forcing firms to duplicate information that is already available onchain.
Personally, I think the bigger story is regulatory recognition of onchain markets as actual financial infrastructure.
If Europe accepts that a derivative doesn't become a different product simply because it runs on a blockchain, that could create a much clearer path for regulated firms to build onchain markets.
But this is still a policy proposal.
The European Commission hasn't adopted HPC's position, and the MiCA review is still underway.
The interesting question now is whether regulators treat public blockchains as a problem to control, or infrastructure that can actually help satisfy existing financial rules.
That decision could shape how big onchain derivatives become in Europe.
$BTC #BTC Price Analysis# $HYPE #Altcoin Season#
Hyperliquid is taking its perpetuals fight to Europe.
The Hyperliquid Policy Center has urged the European Commission to classify crypto perpetual futures under MiFID II rather than MiCA in its first regulatory filing outside the U.S.
The argument is pretty straightforward.
Perpetuals are derivatives. So their regulatory treatment should depend on what the product actually does, not whether the trade happens on a public blockchain.
That distinction matters.
MiFID II is already the EU framework for financial instruments and derivatives, while MiCA primarily covers crypto assets and services that aren't already regulated under existing financial legislation.
HPC is also asking the EU to recognize something interesting about onchain markets.
Trades, funding payments and liquidations can be publicly verifiable on a blockchain, potentially helping satisfy some transparency and recordkeeping requirements without forcing firms to duplicate information that is already available onchain.
Personally, I think the bigger story is regulatory recognition of onchain markets as actual financial infrastructure.
If Europe accepts that a derivative doesn't become a different product simply because it runs on a blockchain, that could create a much clearer path for regulated firms to build onchain markets.
But this is still a policy proposal.
The European Commission hasn't adopted HPC's position, and the MiCA review is still underway.
The interesting question now is whether regulators treat public blockchains as a problem to control, or infrastructure that can actually help satisfy existing financial rules.
That decision could shape how big onchain derivatives become in Europe.
$BTC #BTC Price Analysis# $HYPE #Altcoin Season#
The Hyperliquid Policy Center has urged the European Commission to classify crypto perpetual futures under MiFID II rather than MiCA in its first regulatory filing outside the U.S.
The argument is pretty straightforward.
Perpetuals are derivatives. So their regulatory treatment should depend on what the product actually does, not whether the trade happens on a public blockchain.
That distinction matters.
MiFID II is already the EU framework for financial instruments and derivatives, while MiCA primarily covers crypto assets and services that aren't already regulated under existing financial legislation.
HPC is also asking the EU to recognize something interesting about onchain markets.
Trades, funding payments and liquidations can be publicly verifiable on a blockchain, potentially helping satisfy some transparency and recordkeeping requirements without forcing firms to duplicate information that is already available onchain.
Personally, I think the bigger story is regulatory recognition of onchain markets as actual financial infrastructure.
If Europe accepts that a derivative doesn't become a different product simply because it runs on a blockchain, that could create a much clearer path for regulated firms to build onchain markets.
But this is still a policy proposal.
The European Commission hasn't adopted HPC's position, and the MiCA review is still underway.
The interesting question now is whether regulators treat public blockchains as a problem to control, or infrastructure that can actually help satisfy existing financial rules.
That decision could shape how big onchain derivatives become in Europe.
$BTC #BTC Price Analysis# $HYPE #Altcoin Season#


29
·
--
Ver tradução
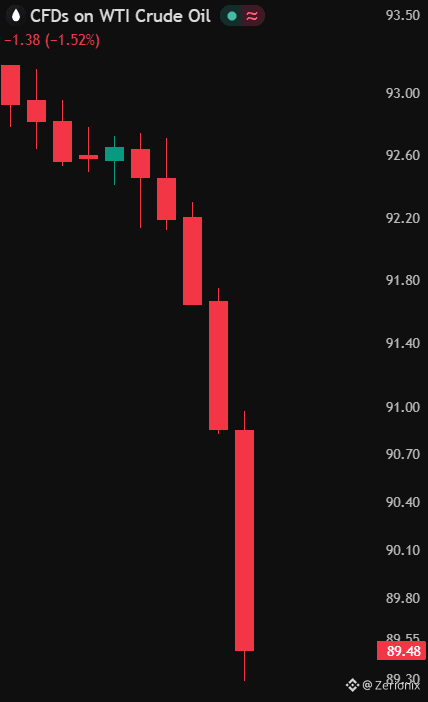
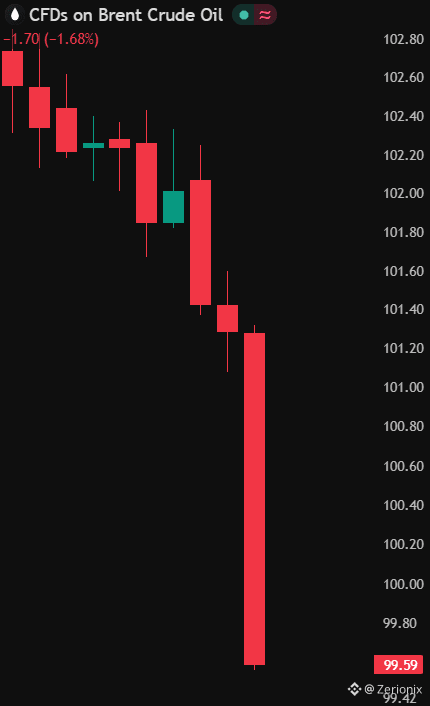
🚨 Oil just got hit with a serious supply shock.
Brent crude dropped below $100 while U.S. WTI fell below $90 as European countries discussed releasing emergency fuel reserves.
The move comes after the U.S. pressured France and Germany to release diesel stocks, with Washington even threatening a potential U.S. diesel export ban if Europe doesn't help increase supply.
A French proposal now being discussed would see European countries release around 50M barrels of diesel, while IEA members could release another 50M barrels of crude.
That's a lot of potential supply hitting a market that has been dealing with serious energy disruptions.
Personally, I think the crypto angle here is more interesting than the oil headline itself.
Lower energy prices can take some pressure off inflation expectations.
And if the oil shock starts fading, that could eventually give central banks a little more breathing room on the rate side.
That's important for Bitcoin because one of BTC's biggest macro problems right now has been the combination of expensive energy, sticky inflation and elevated yields.
But I'm not calling the oil problem solved yet.
Middle Eastern supply risks remain, and physical energy markets are still tight. Reuters reported that Barclays has even raised its Q4 Brent forecast to $115 despite today's decline.
So I'm watching whether Brent can stay below $100.
If it does, the inflation narrative could start changing quickly.
And that could become a much bigger catalyst for risk assets than this one day oil dump suggests.
$BTC #Altcoin Season# #BTC Price Analysis#
$XAUt
🚨 Oil just got hit with a serious supply shock.
Brent crude dropped below $100 while U.S. WTI fell below $90 as European countries discussed releasing emergency fuel reserves.
The move comes after the U.S. pressured France and Germany to release diesel stocks, with Washington even threatening a potential U.S. diesel export ban if Europe doesn't help increase supply.
A French proposal now being discussed would see European countries release around 50M barrels of diesel, while IEA members could release another 50M barrels of crude.
That's a lot of potential supply hitting a market that has been dealing with serious energy disruptions.
Personally, I think the crypto angle here is more interesting than the oil headline itself.
Lower energy prices can take some pressure off inflation expectations.
And if the oil shock starts fading, that could eventually give central banks a little more breathing room on the rate side.
That's important for Bitcoin because one of BTC's biggest macro problems right now has been the combination of expensive energy, sticky inflation and elevated yields.
But I'm not calling the oil problem solved yet.
Middle Eastern supply risks remain, and physical energy markets are still tight. Reuters reported that Barclays has even raised its Q4 Brent forecast to $115 despite today's decline.
So I'm watching whether Brent can stay below $100.
If it does, the inflation narrative could start changing quickly.
And that could become a much bigger catalyst for risk assets than this one day oil dump suggests.
$BTC #Altcoin Season# #BTC Price Analysis#
$XAUt
Brent crude dropped below $100 while U.S. WTI fell below $90 as European countries discussed releasing emergency fuel reserves.
The move comes after the U.S. pressured France and Germany to release diesel stocks, with Washington even threatening a potential U.S. diesel export ban if Europe doesn't help increase supply.
A French proposal now being discussed would see European countries release around 50M barrels of diesel, while IEA members could release another 50M barrels of crude.
That's a lot of potential supply hitting a market that has been dealing with serious energy disruptions.
Personally, I think the crypto angle here is more interesting than the oil headline itself.
Lower energy prices can take some pressure off inflation expectations.
And if the oil shock starts fading, that could eventually give central banks a little more breathing room on the rate side.
That's important for Bitcoin because one of BTC's biggest macro problems right now has been the combination of expensive energy, sticky inflation and elevated yields.
But I'm not calling the oil problem solved yet.
Middle Eastern supply risks remain, and physical energy markets are still tight. Reuters reported that Barclays has even raised its Q4 Brent forecast to $115 despite today's decline.
So I'm watching whether Brent can stay below $100.
If it does, the inflation narrative could start changing quickly.
And that could become a much bigger catalyst for risk assets than this one day oil dump suggests.
$BTC #Altcoin Season# #BTC Price Analysis#
$XAUt
·
--
AGORA: 🇺🇸 A SEC está propondo novas regras de custódia de cripto que podem dar a consultores de investimento e fundos regulamentados mais opções para manter ativos digitais.
A proposta permitiria que consultores custodiassem certos crips dos clientes por conta própria quando um custodiante qualificado não estiver disponível, desde que atendam a salvaguardas específicas relacionadas a cibersegurança, experiência, relatórios e divulgações ao cliente.
Ela também permitiria que empresas de confiança com charter estadual elegíveis atuem como custodantes de cripto.
Isso importa porque a custódia tem sido um dos maiores desafios operacionais para instituições que tentam oferecer exposição a cripto.
A parte mais interessante é que a SEC não está apenas dizendo "deixem as instituições fazerem custódia própria".
Ela está tentando construir um arcabouço sobre quando eles podem fazer isso e quais proteções precisam estar em vigor.
Pessoalmente, acho que isso é um desenvolvimento importante de infraestrutura.
A adoção de cripto não é apenas sobre ETFs e ativos tokenizados. Alguém ainda precisa manter com segurança os ativos subjacentes.
Se consultores e fundos conseguirem opções de custódia mais práticas, a fricção regulatória para oferecer produtos de investimento em cripto poderia diminuir.
Mas isso ainda é uma proposta, não uma regra final. A SEC abrirá um período de 60 dias de comentários públicos após a publicação no Federal Register.
A grande questão agora é se essas regras realmente tornam a custódia institucional de cripto mais fácil sem enfraquecer as proteções das quais os investidores dependem.
É essa a parte que eu vou observar.
$BTC #BTC Price Analysis# #Bitcoin Price Prediction: What is Bitcoins next move?#
AGORA: 🇺🇸 A SEC está propondo novas regras de custódia de cripto que podem dar a consultores de investimento e fundos regulamentados mais opções para manter ativos digitais.
A proposta permitiria que consultores custodiassem certos crips dos clientes por conta própria quando um custodiante qualificado não estiver disponível, desde que atendam a salvaguardas específicas relacionadas a cibersegurança, experiência, relatórios e divulgações ao cliente.
Ela também permitiria que empresas de confiança com charter estadual elegíveis atuem como custodantes de cripto.
Isso importa porque a custódia tem sido um dos maiores desafios operacionais para instituições que tentam oferecer exposição a cripto.
A parte mais interessante é que a SEC não está apenas dizendo "deixem as instituições fazerem custódia própria".
Ela está tentando construir um arcabouço sobre quando eles podem fazer isso e quais proteções precisam estar em vigor.
Pessoalmente, acho que isso é um desenvolvimento importante de infraestrutura.
A adoção de cripto não é apenas sobre ETFs e ativos tokenizados. Alguém ainda precisa manter com segurança os ativos subjacentes.
Se consultores e fundos conseguirem opções de custódia mais práticas, a fricção regulatória para oferecer produtos de investimento em cripto poderia diminuir.
Mas isso ainda é uma proposta, não uma regra final. A SEC abrirá um período de 60 dias de comentários públicos após a publicação no Federal Register.
A grande questão agora é se essas regras realmente tornam a custódia institucional de cripto mais fácil sem enfraquecer as proteções das quais os investidores dependem.
É essa a parte que eu vou observar.
$BTC #BTC Price Analysis# #Bitcoin Price Prediction: What is Bitcoins next move?#
A proposta permitiria que consultores custodiassem certos crips dos clientes por conta própria quando um custodiante qualificado não estiver disponível, desde que atendam a salvaguardas específicas relacionadas a cibersegurança, experiência, relatórios e divulgações ao cliente.
Ela também permitiria que empresas de confiança com charter estadual elegíveis atuem como custodantes de cripto.
Isso importa porque a custódia tem sido um dos maiores desafios operacionais para instituições que tentam oferecer exposição a cripto.
A parte mais interessante é que a SEC não está apenas dizendo "deixem as instituições fazerem custódia própria".
Ela está tentando construir um arcabouço sobre quando eles podem fazer isso e quais proteções precisam estar em vigor.
Pessoalmente, acho que isso é um desenvolvimento importante de infraestrutura.
A adoção de cripto não é apenas sobre ETFs e ativos tokenizados. Alguém ainda precisa manter com segurança os ativos subjacentes.
Se consultores e fundos conseguirem opções de custódia mais práticas, a fricção regulatória para oferecer produtos de investimento em cripto poderia diminuir.
Mas isso ainda é uma proposta, não uma regra final. A SEC abrirá um período de 60 dias de comentários públicos após a publicação no Federal Register.
A grande questão agora é se essas regras realmente tornam a custódia institucional de cripto mais fácil sem enfraquecer as proteções das quais os investidores dependem.
É essa a parte que eu vou observar.
$BTC #BTC Price Analysis# #Bitcoin Price Prediction: What is Bitcoins next move?#

87
·
--
Ver tradução
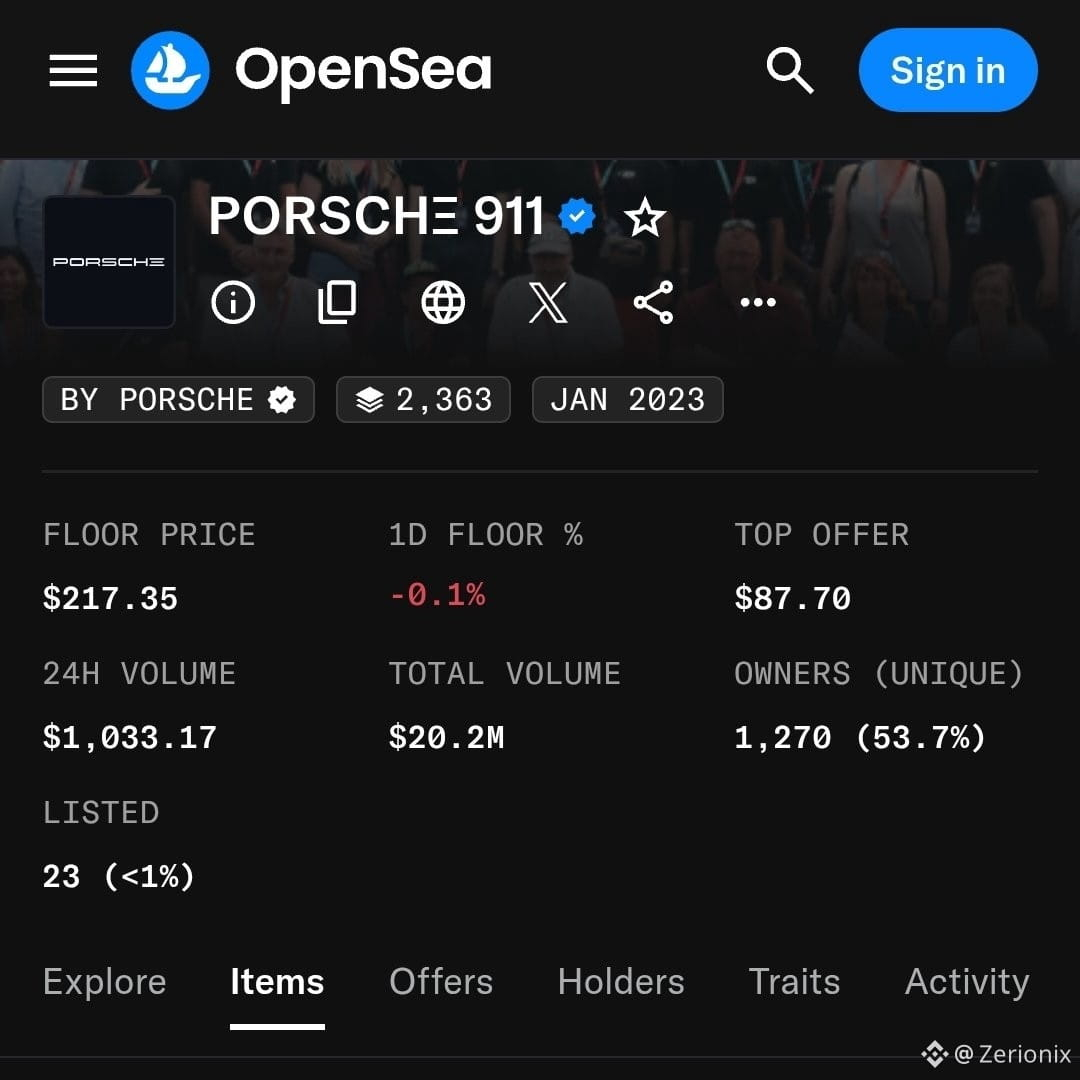
Porsche is officially winding down its Web3 experiment.
The automaker is ending the Porsche Web3 project and PIONΞERS CIRCLE community, closing out a Web3 initiative that began with its 911 NFT collection.
But there is an important distinction.
The NFTs aren't disappearing.
Existing PORSCHΞ 911 NFTs will remain onchain and stay with their respective holders. What is ending is the ecosystem around them.
The PIONΞERS Discord will become a read only archive, while the project's official X account will stop actively posting.
And honestly, this is an interesting moment for the broader NFT market.
Porsche originally positioned the project around co creation, digital collectibles and exclusive experiences, trying to connect one of the world's most recognizable automotive brands with Web3. Its official launch materials even described the project as a long term Web3 journey.
Personally, I think the important takeaway isn't simply "Porsche left Web3."
It's that putting an NFT onchain doesn't guarantee the surrounding community, benefits or brand engagement will last forever.
The blockchain record can survive.
The company doesn't have to.
That's one of the biggest differences between owning an onchain asset and owning an ongoing relationship with a brand.
Porsche's NFTs remain.
The experiment around them is what is ending.
And that says a lot about where the first wave of corporate Web3 experiments ended up.
$BTC #Macro Insights# #Altcoin Season# $XAUt
Porsche is officially winding down its Web3 experiment.
The automaker is ending the Porsche Web3 project and PIONΞERS CIRCLE community, closing out a Web3 initiative that began with its 911 NFT collection.
But there is an important distinction.
The NFTs aren't disappearing.
Existing PORSCHΞ 911 NFTs will remain onchain and stay with their respective holders. What is ending is the ecosystem around them.
The PIONΞERS Discord will become a read only archive, while the project's official X account will stop actively posting.
And honestly, this is an interesting moment for the broader NFT market.
Porsche originally positioned the project around co creation, digital collectibles and exclusive experiences, trying to connect one of the world's most recognizable automotive brands with Web3. Its official launch materials even described the project as a long term Web3 journey.
Personally, I think the important takeaway isn't simply "Porsche left Web3."
It's that putting an NFT onchain doesn't guarantee the surrounding community, benefits or brand engagement will last forever.
The blockchain record can survive.
The company doesn't have to.
That's one of the biggest differences between owning an onchain asset and owning an ongoing relationship with a brand.
Porsche's NFTs remain.
The experiment around them is what is ending.
And that says a lot about where the first wave of corporate Web3 experiments ended up.
$BTC #Macro Insights# #Altcoin Season# $XAUt
The automaker is ending the Porsche Web3 project and PIONΞERS CIRCLE community, closing out a Web3 initiative that began with its 911 NFT collection.
But there is an important distinction.
The NFTs aren't disappearing.
Existing PORSCHΞ 911 NFTs will remain onchain and stay with their respective holders. What is ending is the ecosystem around them.
The PIONΞERS Discord will become a read only archive, while the project's official X account will stop actively posting.
And honestly, this is an interesting moment for the broader NFT market.
Porsche originally positioned the project around co creation, digital collectibles and exclusive experiences, trying to connect one of the world's most recognizable automotive brands with Web3. Its official launch materials even described the project as a long term Web3 journey.
Personally, I think the important takeaway isn't simply "Porsche left Web3."
It's that putting an NFT onchain doesn't guarantee the surrounding community, benefits or brand engagement will last forever.
The blockchain record can survive.
The company doesn't have to.
That's one of the biggest differences between owning an onchain asset and owning an ongoing relationship with a brand.
Porsche's NFTs remain.
The experiment around them is what is ending.
And that says a lot about where the first wave of corporate Web3 experiments ended up.
$BTC #Macro Insights# #Altcoin Season# $XAUt

60
·
--
Ver tradução
Injective is bringing privacy directly into onchain finance.
$INJ is set to unveil CypherOS, its native privacy layer, with the first public demo going live today.
The demo showcases three things that could matter a lot for serious financial activity onchain.
Shielded transactions.
Confidential trading.
And encrypted RFQs that can hide sensitive trade information before execution.
That last one is particularly interesting.
On a transparent blockchain, large orders and RFQs can expose traders to front running and information leakage. Private execution could make onchain markets more practical for institutions that don't want the entire market seeing what they're about to trade.
CypherOS follows Injective's Meridian mainnet upgrade, which went live on September 24 and laid the groundwork for private RFQ testing alongside regulated asset issuance and tokenized markets.
Personally, I think this is bigger than simply adding another privacy feature.
If onchain finance wants serious institutional capital, transparency can't always mean exposing every trade in real time.
The challenge is balancing privacy with compliance and verifiability.
If Injective can solve that properly, privacy stops being just a crypto ideology.
It becomes financial infrastructure.
Now I want to see how CypherOS performs outside the demo.
$INJ #Macro Insights# $BTC #Altcoin Season#
Injective is bringing privacy directly into onchain finance.
$INJ is set to unveil CypherOS, its native privacy layer, with the first public demo going live today.
The demo showcases three things that could matter a lot for serious financial activity onchain.
Shielded transactions.
Confidential trading.
And encrypted RFQs that can hide sensitive trade information before execution.
That last one is particularly interesting.
On a transparent blockchain, large orders and RFQs can expose traders to front running and information leakage. Private execution could make onchain markets more practical for institutions that don't want the entire market seeing what they're about to trade.
CypherOS follows Injective's Meridian mainnet upgrade, which went live on September 24 and laid the groundwork for private RFQ testing alongside regulated asset issuance and tokenized markets.
Personally, I think this is bigger than simply adding another privacy feature.
If onchain finance wants serious institutional capital, transparency can't always mean exposing every trade in real time.
The challenge is balancing privacy with compliance and verifiability.
If Injective can solve that properly, privacy stops being just a crypto ideology.
It becomes financial infrastructure.
Now I want to see how CypherOS performs outside the demo.
$INJ #Macro Insights# $BTC #Altcoin Season#
$INJ is set to unveil CypherOS, its native privacy layer, with the first public demo going live today.
The demo showcases three things that could matter a lot for serious financial activity onchain.
Shielded transactions.
Confidential trading.
And encrypted RFQs that can hide sensitive trade information before execution.
That last one is particularly interesting.
On a transparent blockchain, large orders and RFQs can expose traders to front running and information leakage. Private execution could make onchain markets more practical for institutions that don't want the entire market seeing what they're about to trade.
CypherOS follows Injective's Meridian mainnet upgrade, which went live on September 24 and laid the groundwork for private RFQ testing alongside regulated asset issuance and tokenized markets.
Personally, I think this is bigger than simply adding another privacy feature.
If onchain finance wants serious institutional capital, transparency can't always mean exposing every trade in real time.
The challenge is balancing privacy with compliance and verifiability.
If Injective can solve that properly, privacy stops being just a crypto ideology.
It becomes financial infrastructure.
Now I want to see how CypherOS performs outside the demo.
$INJ #Macro Insights# $BTC #Altcoin Season#


55
·
--
Ver tradução
$82K is becoming an important line for Bitcoin.
BTC has been stuck around the $82K to $85K range, and the big question isn't simply whether Bitcoin can stay above $82K.
It's who gets shaken out if it doesn't.
A 3% move from current levels would be enough to put pressure on leveraged longs, while ETF buyers aren't necessarily forced to sell just because BTC dips.
That's an important difference.
Leverage can turn a normal pullback into a liquidation cascade.
Spot ETF investors, on the other hand, can absorb volatility without being mechanically forced out of their positions.
And we've already seen how important ETF demand has become. U.S. spot Bitcoin ETFs pulled in roughly $2.4B during the week ending September 25, helping drive the recent recovery.
But there's a catch.
That demand has started showing signs of cooling. The latest session saw about $148.7M in ETF outflows, ending a nine day inflow streak worth roughly $3.08B.
So personally, I'm watching the reaction more than the $82K number itself.
If BTC dips, leverage gets flushed and spot demand absorbs the selling, that's a very different signal from BTC losing $82K while ETF flows turn negative.
A 3% dip doesn't scare me nearly as much as a lack of buyers underneath it.
The real question isn't who gets liquidated first.
It's whether someone is ready to buy their Bitcoin.
$BTC #BTC #BTC Price Analysis# #Bitcoin Price Prediction: What is Bitcoins next move?#
$82K is becoming an important line for Bitcoin.
BTC has been stuck around the $82K to $85K range, and the big question isn't simply whether Bitcoin can stay above $82K.
It's who gets shaken out if it doesn't.
A 3% move from current levels would be enough to put pressure on leveraged longs, while ETF buyers aren't necessarily forced to sell just because BTC dips.
That's an important difference.
Leverage can turn a normal pullback into a liquidation cascade.
Spot ETF investors, on the other hand, can absorb volatility without being mechanically forced out of their positions.
And we've already seen how important ETF demand has become. U.S. spot Bitcoin ETFs pulled in roughly $2.4B during the week ending September 25, helping drive the recent recovery.
But there's a catch.
That demand has started showing signs of cooling. The latest session saw about $148.7M in ETF outflows, ending a nine day inflow streak worth roughly $3.08B.
So personally, I'm watching the reaction more than the $82K number itself.
If BTC dips, leverage gets flushed and spot demand absorbs the selling, that's a very different signal from BTC losing $82K while ETF flows turn negative.
A 3% dip doesn't scare me nearly as much as a lack of buyers underneath it.
The real question isn't who gets liquidated first.
It's whether someone is ready to buy their Bitcoin.
$BTC #BTC #BTC Price Analysis# #Bitcoin Price Prediction: What is Bitcoins next move?#
BTC has been stuck around the $82K to $85K range, and the big question isn't simply whether Bitcoin can stay above $82K.
It's who gets shaken out if it doesn't.
A 3% move from current levels would be enough to put pressure on leveraged longs, while ETF buyers aren't necessarily forced to sell just because BTC dips.
That's an important difference.
Leverage can turn a normal pullback into a liquidation cascade.
Spot ETF investors, on the other hand, can absorb volatility without being mechanically forced out of their positions.
And we've already seen how important ETF demand has become. U.S. spot Bitcoin ETFs pulled in roughly $2.4B during the week ending September 25, helping drive the recent recovery.
But there's a catch.
That demand has started showing signs of cooling. The latest session saw about $148.7M in ETF outflows, ending a nine day inflow streak worth roughly $3.08B.
So personally, I'm watching the reaction more than the $82K number itself.
If BTC dips, leverage gets flushed and spot demand absorbs the selling, that's a very different signal from BTC losing $82K while ETF flows turn negative.
A 3% dip doesn't scare me nearly as much as a lack of buyers underneath it.
The real question isn't who gets liquidated first.
It's whether someone is ready to buy their Bitcoin.
$BTC #BTC #BTC Price Analysis# #Bitcoin Price Prediction: What is Bitcoins next move?#
66
·
--
Ver tradução
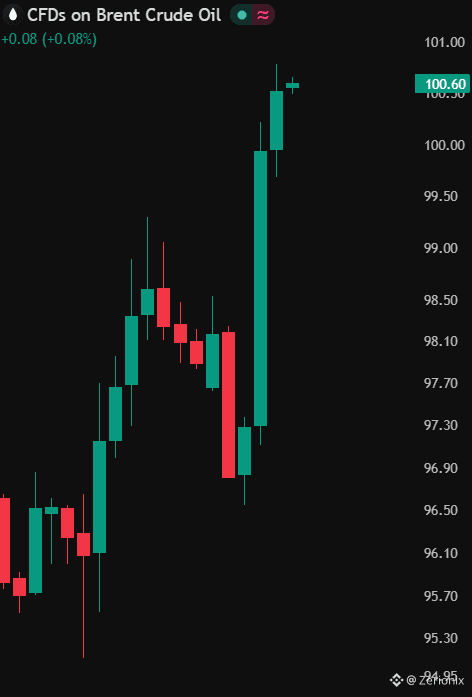
Brent is back above $100, and this time the pressure isn’t coming from one headline.
China has suspended oil product exports beyond Hong Kong and Macau until further notice, with PetroChina reportedly cancelling gasoline and jet fuel cargoes scheduled for October. That removes another source of refined fuel from an already tight global market.
Russia has also extended its diesel and marine fuel export restrictions through October 31, while refinery disruptions have already reduced its fuel exports.
Then there’s the US. Washington is pressuring Germany and France to use emergency diesel reserves and has raised the possibility of restricting US diesel exports if global fuel shortages worsen. The US is a major diesel exporter, so actually implementing that measure would have global consequences.
That’s the part worth watching.
This isn’t simply a crude oil story anymore. The refined-product market is becoming the pressure point. The IEA says global diesel/gasoil supply has already been hit by disruptions across the Gulf and Russia with combined exports from those regions down significantly from pre-war levels.
So Brent crossing $100 is almost a symptom of a much bigger problem: fewer barrels of usable fuel are moving through the global system while governments are increasingly prioritizing domestic supply.
The question now isn’t just whether oil stays above $100.
It’s whether the squeeze in diesel and other refined products starts feeding into transportation costs, inflation and eventually broader economic demand
$BTC #BTC Price Analysis# $ETH #Macro Insights#
Brent is back above $100, and this time the pressure isn’t coming from one headline.
China has suspended oil product exports beyond Hong Kong and Macau until further notice, with PetroChina reportedly cancelling gasoline and jet fuel cargoes scheduled for October. That removes another source of refined fuel from an already tight global market.
Russia has also extended its diesel and marine fuel export restrictions through October 31, while refinery disruptions have already reduced its fuel exports.
Then there’s the US. Washington is pressuring Germany and France to use emergency diesel reserves and has raised the possibility of restricting US diesel exports if global fuel shortages worsen. The US is a major diesel exporter, so actually implementing that measure would have global consequences.
That’s the part worth watching.
This isn’t simply a crude oil story anymore. The refined-product market is becoming the pressure point. The IEA says global diesel/gasoil supply has already been hit by disruptions across the Gulf and Russia with combined exports from those regions down significantly from pre-war levels.
So Brent crossing $100 is almost a symptom of a much bigger problem: fewer barrels of usable fuel are moving through the global system while governments are increasingly prioritizing domestic supply.
The question now isn’t just whether oil stays above $100.
It’s whether the squeeze in diesel and other refined products starts feeding into transportation costs, inflation and eventually broader economic demand
$BTC #BTC Price Analysis# $ETH #Macro Insights#
China has suspended oil product exports beyond Hong Kong and Macau until further notice, with PetroChina reportedly cancelling gasoline and jet fuel cargoes scheduled for October. That removes another source of refined fuel from an already tight global market.
Russia has also extended its diesel and marine fuel export restrictions through October 31, while refinery disruptions have already reduced its fuel exports.
Then there’s the US. Washington is pressuring Germany and France to use emergency diesel reserves and has raised the possibility of restricting US diesel exports if global fuel shortages worsen. The US is a major diesel exporter, so actually implementing that measure would have global consequences.
That’s the part worth watching.
This isn’t simply a crude oil story anymore. The refined-product market is becoming the pressure point. The IEA says global diesel/gasoil supply has already been hit by disruptions across the Gulf and Russia with combined exports from those regions down significantly from pre-war levels.
So Brent crossing $100 is almost a symptom of a much bigger problem: fewer barrels of usable fuel are moving through the global system while governments are increasingly prioritizing domestic supply.
The question now isn’t just whether oil stays above $100.
It’s whether the squeeze in diesel and other refined products starts feeding into transportation costs, inflation and eventually broader economic demand
$BTC #BTC Price Analysis# $ETH #Macro Insights#
·
--
Ver tradução
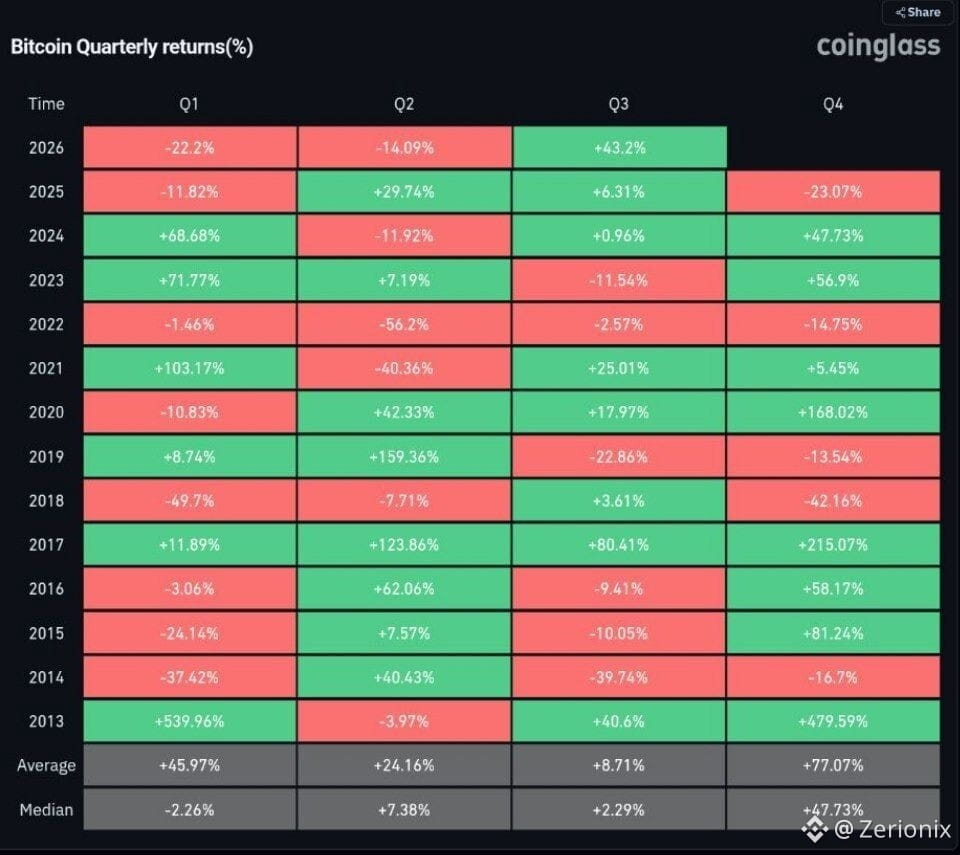
Uptober is back on the timeline.
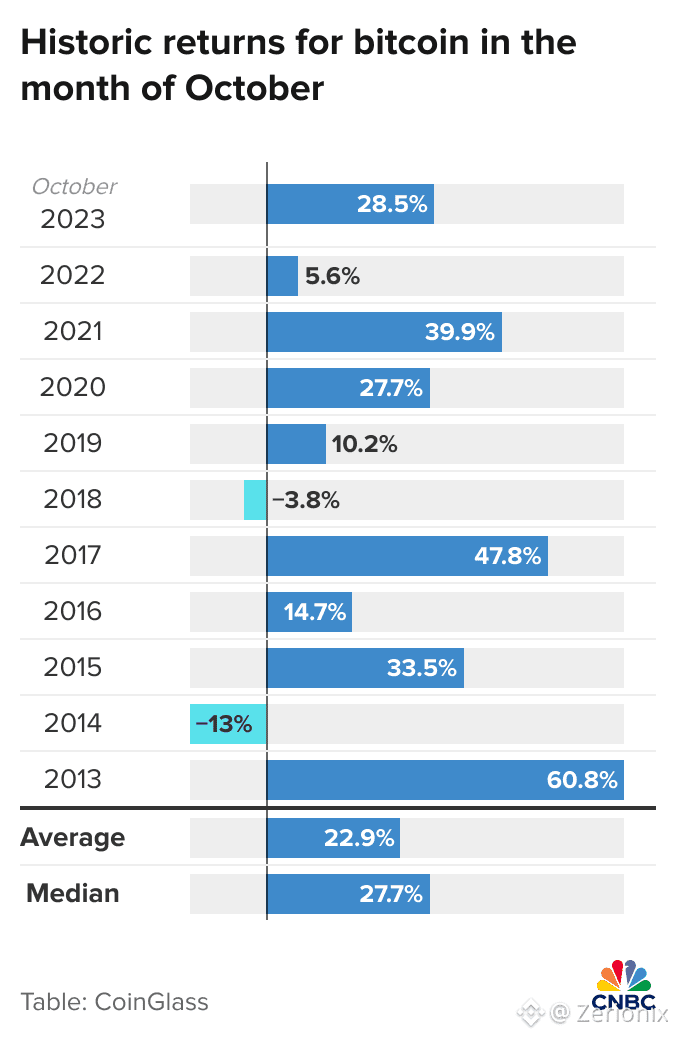
Historically, Bitcoin has finished October in the green in 10 of the last 13 years.
And now the market is asking the obvious question:
Is history enough to trust this time?
October has built a pretty strong reputation in crypto, but I wouldn't blindly trade the calendar.
Bitcoin can have a strong historical tendency and still break the pattern when macro conditions, liquidity or positioning change.
What makes this October interesting is that BTC is coming in with strong momentum after a major Q3 move.
Personally, I'm watching whether that momentum survives the first half of the month.
If BTC keeps attracting spot demand and holds the gains from Q3, the historical October trend becomes much more interesting.
But if macro liquidity tightens or leverage starts building too quickly, history won't save the trade.
10 green Octobers out of 13 is a nice statistic.
Now Bitcoin has to prove it can do it again.
$BTC #BTC Price Analysis# #Bitcoin Price Prediction: What is Bitcoins next move?#
Uptober is back on the timeline.
Historically, Bitcoin has finished October in the green in 10 of the last 13 years.
And now the market is asking the obvious question:
Is history enough to trust this time?
October has built a pretty strong reputation in crypto, but I wouldn't blindly trade the calendar.
Bitcoin can have a strong historical tendency and still break the pattern when macro conditions, liquidity or positioning change.
What makes this October interesting is that BTC is coming in with strong momentum after a major Q3 move.
Personally, I'm watching whether that momentum survives the first half of the month.
If BTC keeps attracting spot demand and holds the gains from Q3, the historical October trend becomes much more interesting.
But if macro liquidity tightens or leverage starts building too quickly, history won't save the trade.
10 green Octobers out of 13 is a nice statistic.
Now Bitcoin has to prove it can do it again.
$BTC #BTC Price Analysis# #Bitcoin Price Prediction: What is Bitcoins next move?#
Historically, Bitcoin has finished October in the green in 10 of the last 13 years.
And now the market is asking the obvious question:
Is history enough to trust this time?
October has built a pretty strong reputation in crypto, but I wouldn't blindly trade the calendar.
Bitcoin can have a strong historical tendency and still break the pattern when macro conditions, liquidity or positioning change.
What makes this October interesting is that BTC is coming in with strong momentum after a major Q3 move.
Personally, I'm watching whether that momentum survives the first half of the month.
If BTC keeps attracting spot demand and holds the gains from Q3, the historical October trend becomes much more interesting.
But if macro liquidity tightens or leverage starts building too quickly, history won't save the trade.
10 green Octobers out of 13 is a nice statistic.
Now Bitcoin has to prove it can do it again.
$BTC #BTC Price Analysis# #Bitcoin Price Prediction: What is Bitcoins next move?#
48
·
--
Na verdade, não. E a própria forma como a Glassnode enquadra isso é mais cuidadosa do que o título que está circulando agora.
O volume à vista de altcoins subiu para quase 4x o volume do Bitcoin, a maior relação desde setembro de 2025. O Altcoin Season Index saltou para 62-64%, acima dos apenas 33% de um mês atrás, e 72,5% das altcoins monitoradas superaram o BTC na semana passada, contra apenas 39% durante a alta de agosto. Uma aceleração real e acentuada, por qualquer métrica.
Mas aqui está a parte que a maior parte da cobertura desse dado ignora. A razão de 4x mede o giro de negociações, não a entrada líquida de capital. Um volume maior captura compra e venda ao mesmo tempo, então esse número sozinho não consegue dizer se dinheiro novo está entrando em altcoins ou se detentores existentes estão apenas negociando com mais agressividade entre si. Essa distinção importa enormemente para saber qual das suas duas leituras realmente está correta.
O que se destaca para mim é a ressalva histórica própria da Glassnode, colocada bem dentro dos dados que eles estão reportando. Picos semelhantes no volume de altcoin para BTC historicamente coincidiram com topos locais de preço do Bitcoin, não com o início confirmado de um altseason. Isso não é uma previsão; é um encaixe de padrão, e padrões se quebram.
O detalhe do Altcoin Season Index, na verdade, vai contra chamar isso de altseason ainda. A versão do CoinMarketCap fica em torno de 64, seu maior nível do ano, mas o limite confirmado é 75, e a maioria das mesas também quer que a dominância do Bitcoin esteja abaixo de 55% junto com isso. A dominância atualmente está por volta de 58-59%, perto, mas não lá.
A questão em aberto não é se a rotação está acontecendo — a amplitude de fato se expandiu e isso é real. A questão é se isto é um posicionamento inicial antes de um movimento mais amplo, ou exatamente o tipo de salto de apetite a risco que os próprios dados da Glassnode dizem que aconteceu antes do BTC esfriar.
$BTC #BTC Price Analysis# #Bitcoin Price Prediction: What is Bitcoins next move?#
Na verdade, não. E a própria forma como a Glassnode enquadra isso é mais cuidadosa do que o título que está circulando agora.
O volume à vista de altcoins subiu para quase 4x o volume do Bitcoin, a maior relação desde setembro de 2025. O Altcoin Season Index saltou para 62-64%, acima dos apenas 33% de um mês atrás, e 72,5% das altcoins monitoradas superaram o BTC na semana passada, contra apenas 39% durante a alta de agosto. Uma aceleração real e acentuada, por qualquer métrica.
Mas aqui está a parte que a maior parte da cobertura desse dado ignora. A razão de 4x mede o giro de negociações, não a entrada líquida de capital. Um volume maior captura compra e venda ao mesmo tempo, então esse número sozinho não consegue dizer se dinheiro novo está entrando em altcoins ou se detentores existentes estão apenas negociando com mais agressividade entre si. Essa distinção importa enormemente para saber qual das suas duas leituras realmente está correta.
O que se destaca para mim é a ressalva histórica própria da Glassnode, colocada bem dentro dos dados que eles estão reportando. Picos semelhantes no volume de altcoin para BTC historicamente coincidiram com topos locais de preço do Bitcoin, não com o início confirmado de um altseason. Isso não é uma previsão; é um encaixe de padrão, e padrões se quebram.
O detalhe do Altcoin Season Index, na verdade, vai contra chamar isso de altseason ainda. A versão do CoinMarketCap fica em torno de 64, seu maior nível do ano, mas o limite confirmado é 75, e a maioria das mesas também quer que a dominância do Bitcoin esteja abaixo de 55% junto com isso. A dominância atualmente está por volta de 58-59%, perto, mas não lá.
A questão em aberto não é se a rotação está acontecendo — a amplitude de fato se expandiu e isso é real. A questão é se isto é um posicionamento inicial antes de um movimento mais amplo, ou exatamente o tipo de salto de apetite a risco que os próprios dados da Glassnode dizem que aconteceu antes do BTC esfriar.
$BTC #BTC Price Analysis# #Bitcoin Price Prediction: What is Bitcoins next move?#
O volume à vista de altcoins subiu para quase 4x o volume do Bitcoin, a maior relação desde setembro de 2025. O Altcoin Season Index saltou para 62-64%, acima dos apenas 33% de um mês atrás, e 72,5% das altcoins monitoradas superaram o BTC na semana passada, contra apenas 39% durante a alta de agosto. Uma aceleração real e acentuada, por qualquer métrica.
Mas aqui está a parte que a maior parte da cobertura desse dado ignora. A razão de 4x mede o giro de negociações, não a entrada líquida de capital. Um volume maior captura compra e venda ao mesmo tempo, então esse número sozinho não consegue dizer se dinheiro novo está entrando em altcoins ou se detentores existentes estão apenas negociando com mais agressividade entre si. Essa distinção importa enormemente para saber qual das suas duas leituras realmente está correta.
O que se destaca para mim é a ressalva histórica própria da Glassnode, colocada bem dentro dos dados que eles estão reportando. Picos semelhantes no volume de altcoin para BTC historicamente coincidiram com topos locais de preço do Bitcoin, não com o início confirmado de um altseason. Isso não é uma previsão; é um encaixe de padrão, e padrões se quebram.
O detalhe do Altcoin Season Index, na verdade, vai contra chamar isso de altseason ainda. A versão do CoinMarketCap fica em torno de 64, seu maior nível do ano, mas o limite confirmado é 75, e a maioria das mesas também quer que a dominância do Bitcoin esteja abaixo de 55% junto com isso. A dominância atualmente está por volta de 58-59%, perto, mas não lá.
A questão em aberto não é se a rotação está acontecendo — a amplitude de fato se expandiu e isso é real. A questão é se isto é um posicionamento inicial antes de um movimento mais amplo, ou exatamente o tipo de salto de apetite a risco que os próprios dados da Glassnode dizem que aconteceu antes do BTC esfriar.
$BTC #BTC Price Analysis# #Bitcoin Price Prediction: What is Bitcoins next move?#
72
·
--
A THORChain acabou de se ver no meio de um debate de criptomoedas bem desconfortável.
Depois do hack da Bitget de US$ 388 milhões, a Bitget pediu à THORChain para bloquear endereços ligados ao atacante e impedir que ele trocasse os fundos roubados.
A THORChain recusou.
E o motivo vai direto ao coração da descentralização.
A THORChain afirma que seus controles de emergência conseguem interromper a atividade da rede, mas eles não foram feitos para congelar seletivamente endereços ou transações.
Enquanto isso, o atacante já usou a rede para mover aproximadamente US$ 6,3 milhões em ETH roubado para BTC.
É aqui que as criptos ficam complicadas.
Se um protocolo consegue identificar fundos roubados, ele deveria ser capaz de parar isso?
Na visão da Bitget, certamente. Os fundos teriam sido roubados e a exchange quer que eles sejam congelados ou recuperados.
Mas, na perspectiva do projeto da THORChain, decidir seletivamente quais usuários podem transacionar cria um tipo de sistema bem diferente.
Pessoalmente, acho que isso é maior do que apenas Bitget e THORChain.
A cripto passou anos construindo uma infraestrutura financeira sem permissões. No momento em que fundos roubados entram nessa infraestrutura, a indústria precisa decidir onde termina a descentralização e começa a intervenção.
E não existe uma resposta fácil.
Porque se os protocolos conseguem congelar hackers hoje, quem decide quais transações merecem ser congeladas amanhã?
Essa é a pergunta desconfortável que este incidente está forçando a cripto a encarar.
$BTC #BTC Price Analysis# #Meme Alpha# #Bitget $BGB
A THORChain acabou de se ver no meio de um debate de criptomoedas bem desconfortável.
Depois do hack da Bitget de US$ 388 milhões, a Bitget pediu à THORChain para bloquear endereços ligados ao atacante e impedir que ele trocasse os fundos roubados.
A THORChain recusou.
E o motivo vai direto ao coração da descentralização.
A THORChain afirma que seus controles de emergência conseguem interromper a atividade da rede, mas eles não foram feitos para congelar seletivamente endereços ou transações.
Enquanto isso, o atacante já usou a rede para mover aproximadamente US$ 6,3 milhões em ETH roubado para BTC.
É aqui que as criptos ficam complicadas.
Se um protocolo consegue identificar fundos roubados, ele deveria ser capaz de parar isso?
Na visão da Bitget, certamente. Os fundos teriam sido roubados e a exchange quer que eles sejam congelados ou recuperados.
Mas, na perspectiva do projeto da THORChain, decidir seletivamente quais usuários podem transacionar cria um tipo de sistema bem diferente.
Pessoalmente, acho que isso é maior do que apenas Bitget e THORChain.
A cripto passou anos construindo uma infraestrutura financeira sem permissões. No momento em que fundos roubados entram nessa infraestrutura, a indústria precisa decidir onde termina a descentralização e começa a intervenção.
E não existe uma resposta fácil.
Porque se os protocolos conseguem congelar hackers hoje, quem decide quais transações merecem ser congeladas amanhã?
Essa é a pergunta desconfortável que este incidente está forçando a cripto a encarar.
$BTC #BTC Price Analysis# #Meme Alpha# #Bitget $BGB
Depois do hack da Bitget de US$ 388 milhões, a Bitget pediu à THORChain para bloquear endereços ligados ao atacante e impedir que ele trocasse os fundos roubados.
A THORChain recusou.
E o motivo vai direto ao coração da descentralização.
A THORChain afirma que seus controles de emergência conseguem interromper a atividade da rede, mas eles não foram feitos para congelar seletivamente endereços ou transações.
Enquanto isso, o atacante já usou a rede para mover aproximadamente US$ 6,3 milhões em ETH roubado para BTC.
É aqui que as criptos ficam complicadas.
Se um protocolo consegue identificar fundos roubados, ele deveria ser capaz de parar isso?
Na visão da Bitget, certamente. Os fundos teriam sido roubados e a exchange quer que eles sejam congelados ou recuperados.
Mas, na perspectiva do projeto da THORChain, decidir seletivamente quais usuários podem transacionar cria um tipo de sistema bem diferente.
Pessoalmente, acho que isso é maior do que apenas Bitget e THORChain.
A cripto passou anos construindo uma infraestrutura financeira sem permissões. No momento em que fundos roubados entram nessa infraestrutura, a indústria precisa decidir onde termina a descentralização e começa a intervenção.
E não existe uma resposta fácil.
Porque se os protocolos conseguem congelar hackers hoje, quem decide quais transações merecem ser congeladas amanhã?
Essa é a pergunta desconfortável que este incidente está forçando a cripto a encarar.
$BTC #BTC Price Analysis# #Meme Alpha# #Bitget $BGB
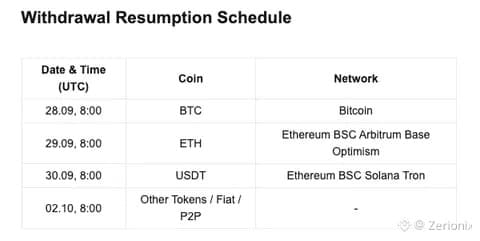
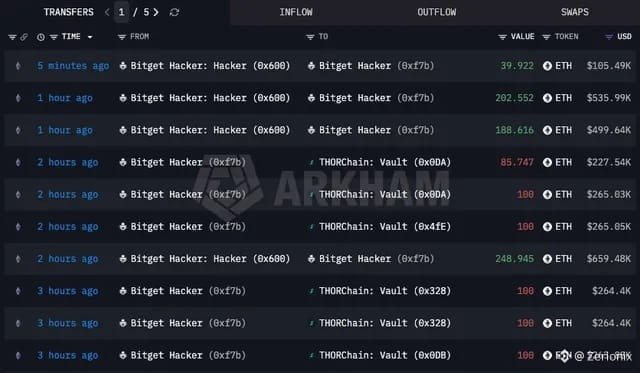
1
159
·
--
A China está lembrando usuários de cripto de algo que muita gente ainda entende errado.
🇨🇳 O Ministério de Segurança do Estado da China afirma que a “anonimidade” das criptos é uma ilusão.
A agência argumenta que transações na blockchain deixam registros permanentes, enquanto a atividade em carteiras pode, em potencial, ser vinculada a identidades reais por meio de exchanges, plataformas de pagamento, dispositivos e informações de IP.
E, tecnicamente, há uma distinção importante aqui.
Bitcoin e a maioria das principais blockchains públicas são pseudônimos, não anônimos.
Seu endereço de carteira pode não ter seu nome vinculado a ele, mas o histórico de transações fica lá, permanentemente. Quando esse endereço é ligado à sua identidade por uma exchange ou por outro ponto identificável, o histórico pode, potencialmente, ser mapeado de volta para você.
Pessoalmente, acho que o aprendizado mais importante não é o aviso da China.
É que a privacidade on-chain está se tornando uma conversa muito maior à medida que as criptos ficam cada vez mais integradas à infraestrutura financeira tradicional.
Mas a declaração não deve ser entendida como se toda transação em cripto fosse automaticamente rastreável. Redes e tecnologias com foco em privacidade são projetadas especificamente para tornar o rastreamento mais difícil.
Então o verdadeiro debate não é apenas se as criptos são anônimas.
É quanta privacidade uma rede específica realmente oferece, e onde essa privacidade começa a falhar?
Porque colocar seu dinheiro on-chain não te torna invisível.
Isso te dá um rastro permanente.
$BTC #BTC Price Analysis# #Altcoin Season#
A China está lembrando usuários de cripto de algo que muita gente ainda entende errado.
🇨🇳 O Ministério de Segurança do Estado da China afirma que a “anonimidade” das criptos é uma ilusão.
A agência argumenta que transações na blockchain deixam registros permanentes, enquanto a atividade em carteiras pode, em potencial, ser vinculada a identidades reais por meio de exchanges, plataformas de pagamento, dispositivos e informações de IP.
E, tecnicamente, há uma distinção importante aqui.
Bitcoin e a maioria das principais blockchains públicas são pseudônimos, não anônimos.
Seu endereço de carteira pode não ter seu nome vinculado a ele, mas o histórico de transações fica lá, permanentemente. Quando esse endereço é ligado à sua identidade por uma exchange ou por outro ponto identificável, o histórico pode, potencialmente, ser mapeado de volta para você.
Pessoalmente, acho que o aprendizado mais importante não é o aviso da China.
É que a privacidade on-chain está se tornando uma conversa muito maior à medida que as criptos ficam cada vez mais integradas à infraestrutura financeira tradicional.
Mas a declaração não deve ser entendida como se toda transação em cripto fosse automaticamente rastreável. Redes e tecnologias com foco em privacidade são projetadas especificamente para tornar o rastreamento mais difícil.
Então o verdadeiro debate não é apenas se as criptos são anônimas.
É quanta privacidade uma rede específica realmente oferece, e onde essa privacidade começa a falhar?
Porque colocar seu dinheiro on-chain não te torna invisível.
Isso te dá um rastro permanente.
$BTC #BTC Price Analysis# #Altcoin Season#
🇨🇳 O Ministério de Segurança do Estado da China afirma que a “anonimidade” das criptos é uma ilusão.
A agência argumenta que transações na blockchain deixam registros permanentes, enquanto a atividade em carteiras pode, em potencial, ser vinculada a identidades reais por meio de exchanges, plataformas de pagamento, dispositivos e informações de IP.
E, tecnicamente, há uma distinção importante aqui.
Bitcoin e a maioria das principais blockchains públicas são pseudônimos, não anônimos.
Seu endereço de carteira pode não ter seu nome vinculado a ele, mas o histórico de transações fica lá, permanentemente. Quando esse endereço é ligado à sua identidade por uma exchange ou por outro ponto identificável, o histórico pode, potencialmente, ser mapeado de volta para você.
Pessoalmente, acho que o aprendizado mais importante não é o aviso da China.
É que a privacidade on-chain está se tornando uma conversa muito maior à medida que as criptos ficam cada vez mais integradas à infraestrutura financeira tradicional.
Mas a declaração não deve ser entendida como se toda transação em cripto fosse automaticamente rastreável. Redes e tecnologias com foco em privacidade são projetadas especificamente para tornar o rastreamento mais difícil.
Então o verdadeiro debate não é apenas se as criptos são anônimas.
É quanta privacidade uma rede específica realmente oferece, e onde essa privacidade começa a falhar?
Porque colocar seu dinheiro on-chain não te torna invisível.
Isso te dá um rastro permanente.
$BTC #BTC Price Analysis# #Altcoin Season#


87
·
--
Uma coisa que acho interessante sobre a infraestrutura de cross chain é quando você deixa de perceber isso.
Um usuário da TON não deveria necessariamente precisar pensar em qual ponte usar, para onde enviar seus tokens, ou como mover ativos entre redes apenas para acessar uma aplicação construída para EVM.
É essa a ideia por trás de um novo exemplo de integração open source da Omniston para Telegram Mini Apps.
O fluxo é bem simples do ponto de vista do usuário.
Conecte uma carteira TON via TonConnect, enquanto uma carteira EVM embutida é criada nos bastidores. A Omniston gerencia a execução cross chain entre a TON e a rede EVM.
O exemplo usa TON USDT ↔ Arbitrum USDT0.
O que torna isso mais interessante para mim é que a mesma arquitetura pode ser reutilizada por aplicações nativas de EVM que querem alcançar usuários da TON sem precisarem se tornar nativas da TON.
Já estamos vendo exemplos dessa direção com Polymarket e WenLong, onde os usuários podem começar pela TON enquanto a aplicação opera em outra rede.
E é para aí que eu acho que o UX de cross chain está indo.
A infraestrutura não precisa necessariamente se tornar outra tela que o usuário precisa entender.
Ela pode virar a camada que conecta silenciosamente a aplicação que você quer usar com a liquidez e os ativos que estão em algum outro lugar.
Para quem constrói, provavelmente essa é a parte mais importante desta atualização.
Cross chain não é só sobre mover tokens entre redes agora. É sobre fazer que ecossistemas diferentes pareçam parte da mesma experiência de aplicação.
É essa a parte que eu estou acompanhando.
Explore Omniston → https://ston.fi/omniston
#BTC Price Analysis# #Altcoin Season# $NEAR $PUMP
Uma coisa que acho interessante sobre a infraestrutura de cross chain é quando você deixa de perceber isso.
Um usuário da TON não deveria necessariamente precisar pensar em qual ponte usar, para onde enviar seus tokens, ou como mover ativos entre redes apenas para acessar uma aplicação construída para EVM.
É essa a ideia por trás de um novo exemplo de integração open source da Omniston para Telegram Mini Apps.
O fluxo é bem simples do ponto de vista do usuário.
Conecte uma carteira TON via TonConnect, enquanto uma carteira EVM embutida é criada nos bastidores. A Omniston gerencia a execução cross chain entre a TON e a rede EVM.
O exemplo usa TON USDT ↔ Arbitrum USDT0.
O que torna isso mais interessante para mim é que a mesma arquitetura pode ser reutilizada por aplicações nativas de EVM que querem alcançar usuários da TON sem precisarem se tornar nativas da TON.
Já estamos vendo exemplos dessa direção com Polymarket e WenLong, onde os usuários podem começar pela TON enquanto a aplicação opera em outra rede.
E é para aí que eu acho que o UX de cross chain está indo.
A infraestrutura não precisa necessariamente se tornar outra tela que o usuário precisa entender.
Ela pode virar a camada que conecta silenciosamente a aplicação que você quer usar com a liquidez e os ativos que estão em algum outro lugar.
Para quem constrói, provavelmente essa é a parte mais importante desta atualização.
Cross chain não é só sobre mover tokens entre redes agora. É sobre fazer que ecossistemas diferentes pareçam parte da mesma experiência de aplicação.
É essa a parte que eu estou acompanhando.
Explore Omniston → https://ston.fi/omniston
#BTC Price Analysis# #Altcoin Season# $NEAR $PUMP
Um usuário da TON não deveria necessariamente precisar pensar em qual ponte usar, para onde enviar seus tokens, ou como mover ativos entre redes apenas para acessar uma aplicação construída para EVM.
É essa a ideia por trás de um novo exemplo de integração open source da Omniston para Telegram Mini Apps.
O fluxo é bem simples do ponto de vista do usuário.
Conecte uma carteira TON via TonConnect, enquanto uma carteira EVM embutida é criada nos bastidores. A Omniston gerencia a execução cross chain entre a TON e a rede EVM.
O exemplo usa TON USDT ↔ Arbitrum USDT0.
O que torna isso mais interessante para mim é que a mesma arquitetura pode ser reutilizada por aplicações nativas de EVM que querem alcançar usuários da TON sem precisarem se tornar nativas da TON.
Já estamos vendo exemplos dessa direção com Polymarket e WenLong, onde os usuários podem começar pela TON enquanto a aplicação opera em outra rede.
E é para aí que eu acho que o UX de cross chain está indo.
A infraestrutura não precisa necessariamente se tornar outra tela que o usuário precisa entender.
Ela pode virar a camada que conecta silenciosamente a aplicação que você quer usar com a liquidez e os ativos que estão em algum outro lugar.
Para quem constrói, provavelmente essa é a parte mais importante desta atualização.
Cross chain não é só sobre mover tokens entre redes agora. É sobre fazer que ecossistemas diferentes pareçam parte da mesma experiência de aplicação.
É essa a parte que eu estou acompanhando.
Explore Omniston → https://ston.fi/omniston
#BTC Price Analysis# #Altcoin Season# $NEAR $PUMP

55
·
--
A China está enviando uma mensagem bem clara aos usuários de criptomoedas.
O Ministério da Segurança do Estado da China diz que a ideia de que as criptos oferecem anonimato garantido é uma ilusão.
O ministério aponta para algo que pesquisadores de cripto já sabem há anos.
A maioria das blockchains públicas deixa um rastro permanente.
Endereços de carteira talvez não revelem diretamente a identidade de uma pessoa, mas as transações ainda podem ser rastreadas ao longo da cadeia. Quando os fundos interagem com exchanges, serviços de pagamento ou outros pontos identificáveis, informações adicionais podem potencialmente ligar a carteira a uma pessoa real.
Pessoalmente, acho que a parte interessante não é o aviso da China em si.
É o lembrete de que pseudônimo não significa anônimo.
O Bitcoin não esconde a transação. Ele a registra para sempre.
É por isso também que a análise de blockchain se tornou uma indústria tão grande. A mesma transparência que torna as criptos atrativas também pode tornar certos tipos de atividade financeira mais fáceis de investigar.
Claro, redes focadas em privacidade e ferramentas de privacidade são outra conversa. Nem toda transação cripto é igualmente rastreável.
Mas a ideia de que você pode simplesmente mover dinheiro na blockchain e ficar invisível?
Isso está ficando mais difícil de defender.
As criptos lhe dão um livro-razão público.
A verdadeira questão é quanto da sua identidade pode, eventualmente, ser conectada a ele.
$BTC #BTC Price Analysis# $XRP
A China está enviando uma mensagem bem clara aos usuários de criptomoedas.
O Ministério da Segurança do Estado da China diz que a ideia de que as criptos oferecem anonimato garantido é uma ilusão.
O ministério aponta para algo que pesquisadores de cripto já sabem há anos.
A maioria das blockchains públicas deixa um rastro permanente.
Endereços de carteira talvez não revelem diretamente a identidade de uma pessoa, mas as transações ainda podem ser rastreadas ao longo da cadeia. Quando os fundos interagem com exchanges, serviços de pagamento ou outros pontos identificáveis, informações adicionais podem potencialmente ligar a carteira a uma pessoa real.
Pessoalmente, acho que a parte interessante não é o aviso da China em si.
É o lembrete de que pseudônimo não significa anônimo.
O Bitcoin não esconde a transação. Ele a registra para sempre.
É por isso também que a análise de blockchain se tornou uma indústria tão grande. A mesma transparência que torna as criptos atrativas também pode tornar certos tipos de atividade financeira mais fáceis de investigar.
Claro, redes focadas em privacidade e ferramentas de privacidade são outra conversa. Nem toda transação cripto é igualmente rastreável.
Mas a ideia de que você pode simplesmente mover dinheiro na blockchain e ficar invisível?
Isso está ficando mais difícil de defender.
As criptos lhe dão um livro-razão público.
A verdadeira questão é quanto da sua identidade pode, eventualmente, ser conectada a ele.
$BTC #BTC Price Analysis# $XRP
O Ministério da Segurança do Estado da China diz que a ideia de que as criptos oferecem anonimato garantido é uma ilusão.
O ministério aponta para algo que pesquisadores de cripto já sabem há anos.
A maioria das blockchains públicas deixa um rastro permanente.
Endereços de carteira talvez não revelem diretamente a identidade de uma pessoa, mas as transações ainda podem ser rastreadas ao longo da cadeia. Quando os fundos interagem com exchanges, serviços de pagamento ou outros pontos identificáveis, informações adicionais podem potencialmente ligar a carteira a uma pessoa real.
Pessoalmente, acho que a parte interessante não é o aviso da China em si.
É o lembrete de que pseudônimo não significa anônimo.
O Bitcoin não esconde a transação. Ele a registra para sempre.
É por isso também que a análise de blockchain se tornou uma indústria tão grande. A mesma transparência que torna as criptos atrativas também pode tornar certos tipos de atividade financeira mais fáceis de investigar.
Claro, redes focadas em privacidade e ferramentas de privacidade são outra conversa. Nem toda transação cripto é igualmente rastreável.
Mas a ideia de que você pode simplesmente mover dinheiro na blockchain e ficar invisível?
Isso está ficando mais difícil de defender.
As criptos lhe dão um livro-razão público.
A verdadeira questão é quanto da sua identidade pode, eventualmente, ser conectada a ele.
$BTC #BTC Price Analysis# $XRP

80
·
--
O ETF NEAR da Bitwise ultrapassou a barreira de listagem da NYSE Arca sob o ticker US$ $NRR.
Isso já dá ao NEAR algo que ele não tinha antes.
Um caminho regulado para investidores tradicionais terem exposição ao ativo.
Mas a Bitwise não parou por aí.
A empresa também lançou um relatório de investimento do NEAR com 39 páginas, com alguns cenários extremamente otimistas para o longo prazo.
O caso-base coloca o NEAR em US$ 155 até 2030, enquanto o caso de alta extrema atinge US$ 562. O mesmo relatório também traz um cenário de baixa por volta de US$ 1,63, então não é exatamente um alvo garantido de “lua”.
Pessoalmente, o ETF importa mais para mim do que as metas de preço.
US$ 155 ou US$ 562 depende fortemente de suposições sobre adoção, uso da rede e o crescimento do ecossistema NEAR. Esses números são cenários, não promessas.
O ETF é diferente.
Ele cria uma via financeira de verdade para o capital acessar o NEAR via mercados tradicionais.
E, com o fundo desenhado para fazer staking de suas participações em NEAR, o produto também está trazendo exposição a staking para dentro da estrutura do ETF.
Agora, a verdadeira questão é se o acesso institucional se traduz em demanda sustentada.
A narrativa está ficando maior.
Vamos ver se a liquidez acompanha
#BTC Price Analysis# #Altcoin Season# $NEAR
O ETF NEAR da Bitwise ultrapassou a barreira de listagem da NYSE Arca sob o ticker US$ $NRR.
Isso já dá ao NEAR algo que ele não tinha antes.
Um caminho regulado para investidores tradicionais terem exposição ao ativo.
Mas a Bitwise não parou por aí.
A empresa também lançou um relatório de investimento do NEAR com 39 páginas, com alguns cenários extremamente otimistas para o longo prazo.
O caso-base coloca o NEAR em US$ 155 até 2030, enquanto o caso de alta extrema atinge US$ 562. O mesmo relatório também traz um cenário de baixa por volta de US$ 1,63, então não é exatamente um alvo garantido de “lua”.
Pessoalmente, o ETF importa mais para mim do que as metas de preço.
US$ 155 ou US$ 562 depende fortemente de suposições sobre adoção, uso da rede e o crescimento do ecossistema NEAR. Esses números são cenários, não promessas.
O ETF é diferente.
Ele cria uma via financeira de verdade para o capital acessar o NEAR via mercados tradicionais.
E, com o fundo desenhado para fazer staking de suas participações em NEAR, o produto também está trazendo exposição a staking para dentro da estrutura do ETF.
Agora, a verdadeira questão é se o acesso institucional se traduz em demanda sustentada.
A narrativa está ficando maior.
Vamos ver se a liquidez acompanha
#BTC Price Analysis# #Altcoin Season# $NEAR
Isso já dá ao NEAR algo que ele não tinha antes.
Um caminho regulado para investidores tradicionais terem exposição ao ativo.
Mas a Bitwise não parou por aí.
A empresa também lançou um relatório de investimento do NEAR com 39 páginas, com alguns cenários extremamente otimistas para o longo prazo.
O caso-base coloca o NEAR em US$ 155 até 2030, enquanto o caso de alta extrema atinge US$ 562. O mesmo relatório também traz um cenário de baixa por volta de US$ 1,63, então não é exatamente um alvo garantido de “lua”.
Pessoalmente, o ETF importa mais para mim do que as metas de preço.
US$ 155 ou US$ 562 depende fortemente de suposições sobre adoção, uso da rede e o crescimento do ecossistema NEAR. Esses números são cenários, não promessas.
O ETF é diferente.
Ele cria uma via financeira de verdade para o capital acessar o NEAR via mercados tradicionais.
E, com o fundo desenhado para fazer staking de suas participações em NEAR, o produto também está trazendo exposição a staking para dentro da estrutura do ETF.
Agora, a verdadeira questão é se o acesso institucional se traduz em demanda sustentada.
A narrativa está ficando maior.
Vamos ver se a liquidez acompanha
#BTC Price Analysis# #Altcoin Season# $NEAR

63
·
--
Eu achava que a parte difícil de uma troca (swap) em DeFi era apenas enviar a transação.
Você clica em confirmar, espera a blockchain e, se passar, está tudo pronto.
Mas a execução cross chain me fez perceber que existe outra etapa do processo que importa tanto quanto: como o negócio é efetivado (settles).
Quando os ativos estão se movendo entre redes diferentes, você não pode simplesmente assumir que os dois lados vão concluir exatamente ao mesmo tempo.
É aí que o design de settlement se torna importante.
Com a Omniston, a execução cross chain usa HTLCs vinculadas (linked) de modo que os dois lados de uma troca fiquem conectados pela mesma condição de settlement.
A parte interessante é o que acontece quando tudo não sai perfeitamente.
Se a condição exigida for atendida, a troca pode ser efetivada.
Se ela não for concluída dentro do período de tempo relevante, os ativos bloqueados têm um caminho para serem reembolsados.
Isso parece um detalhe técnico, mas eu acho que na verdade é uma das coisas que os usuários deveriam se importar mais.
Porque “cross chain” não deveria significar apenas mover valor entre duas redes.
Também deveria significar ter uma resposta clara para:
O que acontece se algo der errado?
É essa a parte da arquitetura Omniston da STONfi que eu acho interessante.
O usuário tem uma experiência de swap simples, enquanto por baixo existe um mecanismo de settlement projetado para concluir os dois lados ou fornecer uma forma de recuperar os fundos relevantes.
Quanto mais suave o DeFi fica na superfície, mais importantes essas mecânicas invisíveis se tornam por baixo.
E é algo que estou observando com mais atenção.
Explore Omniston → https://ston.fi/omniston
$ZEC #BTC Price Analysis# $GRAM #Altcoin Season#
Eu achava que a parte difícil de uma troca (swap) em DeFi era apenas enviar a transação.
Você clica em confirmar, espera a blockchain e, se passar, está tudo pronto.
Mas a execução cross chain me fez perceber que existe outra etapa do processo que importa tanto quanto: como o negócio é efetivado (settles).
Quando os ativos estão se movendo entre redes diferentes, você não pode simplesmente assumir que os dois lados vão concluir exatamente ao mesmo tempo.
É aí que o design de settlement se torna importante.
Com a Omniston, a execução cross chain usa HTLCs vinculadas (linked) de modo que os dois lados de uma troca fiquem conectados pela mesma condição de settlement.
A parte interessante é o que acontece quando tudo não sai perfeitamente.
Se a condição exigida for atendida, a troca pode ser efetivada.
Se ela não for concluída dentro do período de tempo relevante, os ativos bloqueados têm um caminho para serem reembolsados.
Isso parece um detalhe técnico, mas eu acho que na verdade é uma das coisas que os usuários deveriam se importar mais.
Porque “cross chain” não deveria significar apenas mover valor entre duas redes.
Também deveria significar ter uma resposta clara para:
O que acontece se algo der errado?
É essa a parte da arquitetura Omniston da STONfi que eu acho interessante.
O usuário tem uma experiência de swap simples, enquanto por baixo existe um mecanismo de settlement projetado para concluir os dois lados ou fornecer uma forma de recuperar os fundos relevantes.
Quanto mais suave o DeFi fica na superfície, mais importantes essas mecânicas invisíveis se tornam por baixo.
E é algo que estou observando com mais atenção.
Explore Omniston → https://ston.fi/omniston
$ZEC #BTC Price Analysis# $GRAM #Altcoin Season#
Você clica em confirmar, espera a blockchain e, se passar, está tudo pronto.
Mas a execução cross chain me fez perceber que existe outra etapa do processo que importa tanto quanto: como o negócio é efetivado (settles).
Quando os ativos estão se movendo entre redes diferentes, você não pode simplesmente assumir que os dois lados vão concluir exatamente ao mesmo tempo.
É aí que o design de settlement se torna importante.
Com a Omniston, a execução cross chain usa HTLCs vinculadas (linked) de modo que os dois lados de uma troca fiquem conectados pela mesma condição de settlement.
A parte interessante é o que acontece quando tudo não sai perfeitamente.
Se a condição exigida for atendida, a troca pode ser efetivada.
Se ela não for concluída dentro do período de tempo relevante, os ativos bloqueados têm um caminho para serem reembolsados.
Isso parece um detalhe técnico, mas eu acho que na verdade é uma das coisas que os usuários deveriam se importar mais.
Porque “cross chain” não deveria significar apenas mover valor entre duas redes.
Também deveria significar ter uma resposta clara para:
O que acontece se algo der errado?
É essa a parte da arquitetura Omniston da STONfi que eu acho interessante.
O usuário tem uma experiência de swap simples, enquanto por baixo existe um mecanismo de settlement projetado para concluir os dois lados ou fornecer uma forma de recuperar os fundos relevantes.
Quanto mais suave o DeFi fica na superfície, mais importantes essas mecânicas invisíveis se tornam por baixo.
E é algo que estou observando com mais atenção.
Explore Omniston → https://ston.fi/omniston
$ZEC #BTC Price Analysis# $GRAM #Altcoin Season#
90
·
--
$BTC está prestes a encerrar seu 2º melhor 3º trimestre de todos os tempos.
O Bitcoin acumulou um ganho de aproximadamente 43% neste trimestre, tornando o Q3 um dos trimestres mais fortes da sua história.
O que torna isso mais interessante para mim é onde o BTC começou.
O mercado entrou no Q3 após dois trimestres consecutivos negativos, com o sentimento parecendo bem ruim. Agora estamos nos aproximando do fim do trimestre com o Bitcoin de volta acima de US$ 80 mil e o momentum firmemente de volta ao jogo.
Esse tipo de reversão mostra que algo mudou na demanda e no posicionamento.
Mas eu não trataria uma forte vela trimestral como confirmação de que o próximo movimento é automaticamente mais alto.
Uma coisa que aprendi ao observar a infraestrutura de DeFi é que o número de manchete raramente conta toda a história. Seja TVL, volume, liquidez ou até um retorno trimestral do BTC, eu quero entender o que está acontecendo de verdade por baixo.
É por isso também que tenho interesse no que acontece com a liquidez do BTC entre ecossistemas conforme o mercado se expande.
Essa liquidez pode se tornar mais acessível entre cadeias e aplicações, sem que os usuários tenham que lidar com toda a complexidade subjacente?
É uma parte do que projetos como STON.fi estão construindo com a Omniston.
Para o próprio BTC, porém, estou acompanhando o que acontece depois que o trimestre termina.
Ele consegue manter a maior parte desses ganhos, manter a demanda à vista forte e construir uma base mais alta em vez de devolver o movimento imediatamente?
Porque um Q3 forte é impressionante.
Transformar essa força em um Q4 forte é a parte que realmente importa.
Explore a Omniston → https://ston.fi/omniston $BTC #Bitcoin Previsão de Preço: Qual é o próximo movimento do Bitcoin?# $SOL
$BTC está prestes a encerrar seu 2º melhor 3º trimestre de todos os tempos.
O Bitcoin acumulou um ganho de aproximadamente 43% neste trimestre, tornando o Q3 um dos trimestres mais fortes da sua história.
O que torna isso mais interessante para mim é onde o BTC começou.
O mercado entrou no Q3 após dois trimestres consecutivos negativos, com o sentimento parecendo bem ruim. Agora estamos nos aproximando do fim do trimestre com o Bitcoin de volta acima de US$ 80 mil e o momentum firmemente de volta ao jogo.
Esse tipo de reversão mostra que algo mudou na demanda e no posicionamento.
Mas eu não trataria uma forte vela trimestral como confirmação de que o próximo movimento é automaticamente mais alto.
Uma coisa que aprendi ao observar a infraestrutura de DeFi é que o número de manchete raramente conta toda a história. Seja TVL, volume, liquidez ou até um retorno trimestral do BTC, eu quero entender o que está acontecendo de verdade por baixo.
É por isso também que tenho interesse no que acontece com a liquidez do BTC entre ecossistemas conforme o mercado se expande.
Essa liquidez pode se tornar mais acessível entre cadeias e aplicações, sem que os usuários tenham que lidar com toda a complexidade subjacente?
É uma parte do que projetos como STON.fi estão construindo com a Omniston.
Para o próprio BTC, porém, estou acompanhando o que acontece depois que o trimestre termina.
Ele consegue manter a maior parte desses ganhos, manter a demanda à vista forte e construir uma base mais alta em vez de devolver o movimento imediatamente?
Porque um Q3 forte é impressionante.
Transformar essa força em um Q4 forte é a parte que realmente importa.
Explore a Omniston → https://ston.fi/omniston $BTC #Bitcoin Previsão de Preço: Qual é o próximo movimento do Bitcoin?# $SOL
O Bitcoin acumulou um ganho de aproximadamente 43% neste trimestre, tornando o Q3 um dos trimestres mais fortes da sua história.
O que torna isso mais interessante para mim é onde o BTC começou.
O mercado entrou no Q3 após dois trimestres consecutivos negativos, com o sentimento parecendo bem ruim. Agora estamos nos aproximando do fim do trimestre com o Bitcoin de volta acima de US$ 80 mil e o momentum firmemente de volta ao jogo.
Esse tipo de reversão mostra que algo mudou na demanda e no posicionamento.
Mas eu não trataria uma forte vela trimestral como confirmação de que o próximo movimento é automaticamente mais alto.
Uma coisa que aprendi ao observar a infraestrutura de DeFi é que o número de manchete raramente conta toda a história. Seja TVL, volume, liquidez ou até um retorno trimestral do BTC, eu quero entender o que está acontecendo de verdade por baixo.
É por isso também que tenho interesse no que acontece com a liquidez do BTC entre ecossistemas conforme o mercado se expande.
Essa liquidez pode se tornar mais acessível entre cadeias e aplicações, sem que os usuários tenham que lidar com toda a complexidade subjacente?
É uma parte do que projetos como STON.fi estão construindo com a Omniston.
Para o próprio BTC, porém, estou acompanhando o que acontece depois que o trimestre termina.
Ele consegue manter a maior parte desses ganhos, manter a demanda à vista forte e construir uma base mais alta em vez de devolver o movimento imediatamente?
Porque um Q3 forte é impressionante.
Transformar essa força em um Q4 forte é a parte que realmente importa.
Explore a Omniston → https://ston.fi/omniston $BTC #Bitcoin Previsão de Preço: Qual é o próximo movimento do Bitcoin?# $SOL
29
·
--
Eu costumava achar que a parte mais difícil de uma troca (swap) em DeFi era conseguir enviar a transação.
Clica em confirmar, espera a blockchain, e se ela passar, acabou.
Mas a execução cross chain me fez perceber que existe outra parte do processo que importa tanto quanto: como a negociação é efetivamente liquidada.
Quando os ativos estão se movendo entre redes diferentes, não dá para simplesmente assumir que os dois lados vão completar exatamente ao mesmo tempo.
É aí que o desenho da liquidação (settlement) se torna importante.
Com a Omniston, a execução cross chain usa HTLCs vinculadas, de modo que os dois lados de uma negociação ficam conectados pela mesma condição de liquidação.
O interessante é o que acontece quando nem tudo corre perfeitamente.
Se a condição necessária for atendida, a negociação pode ser liquidada. Se ela não for concluída dentro do prazo relevante, os ativos bloqueados têm um caminho para serem reembolsados.
Isso parece um detalhe técnico, mas eu acho que na prática é uma das coisas de que os usuários deveriam se importar mais.
Porque “cross chain” não deveria significar apenas transferir valor entre duas redes.
Também deveria significar ter uma resposta clara para:
O que acontece se algo der errado?
É essa a parte da arquitetura da Omniston da STON.fi que eu acho interessante.
O usuário tem uma experiência de swap simples; por baixo disso, existe um mecanismo de liquidação pensado para concluir os dois lados ou, então, dar aos fundos relevantes uma forma de voltar.
Quanto mais suave o DeFi fica por cima, mais importantes essas mecânicas invisíveis se tornam por baixo.
E é algo ao qual estou dando mais atenção.
Explore Omniston → https://ston.fi/omniston
$BTC #BTC Price Analysis# $ETH #Macro Insights#
Eu costumava achar que a parte mais difícil de uma troca (swap) em DeFi era conseguir enviar a transação.
Clica em confirmar, espera a blockchain, e se ela passar, acabou.
Mas a execução cross chain me fez perceber que existe outra parte do processo que importa tanto quanto: como a negociação é efetivamente liquidada.
Quando os ativos estão se movendo entre redes diferentes, não dá para simplesmente assumir que os dois lados vão completar exatamente ao mesmo tempo.
É aí que o desenho da liquidação (settlement) se torna importante.
Com a Omniston, a execução cross chain usa HTLCs vinculadas, de modo que os dois lados de uma negociação ficam conectados pela mesma condição de liquidação.
O interessante é o que acontece quando nem tudo corre perfeitamente.
Se a condição necessária for atendida, a negociação pode ser liquidada. Se ela não for concluída dentro do prazo relevante, os ativos bloqueados têm um caminho para serem reembolsados.
Isso parece um detalhe técnico, mas eu acho que na prática é uma das coisas de que os usuários deveriam se importar mais.
Porque “cross chain” não deveria significar apenas transferir valor entre duas redes.
Também deveria significar ter uma resposta clara para:
O que acontece se algo der errado?
É essa a parte da arquitetura da Omniston da STON.fi que eu acho interessante.
O usuário tem uma experiência de swap simples; por baixo disso, existe um mecanismo de liquidação pensado para concluir os dois lados ou, então, dar aos fundos relevantes uma forma de voltar.
Quanto mais suave o DeFi fica por cima, mais importantes essas mecânicas invisíveis se tornam por baixo.
E é algo ao qual estou dando mais atenção.
Explore Omniston → https://ston.fi/omniston
$BTC #BTC Price Analysis# $ETH #Macro Insights#
Clica em confirmar, espera a blockchain, e se ela passar, acabou.
Mas a execução cross chain me fez perceber que existe outra parte do processo que importa tanto quanto: como a negociação é efetivamente liquidada.
Quando os ativos estão se movendo entre redes diferentes, não dá para simplesmente assumir que os dois lados vão completar exatamente ao mesmo tempo.
É aí que o desenho da liquidação (settlement) se torna importante.
Com a Omniston, a execução cross chain usa HTLCs vinculadas, de modo que os dois lados de uma negociação ficam conectados pela mesma condição de liquidação.
O interessante é o que acontece quando nem tudo corre perfeitamente.
Se a condição necessária for atendida, a negociação pode ser liquidada. Se ela não for concluída dentro do prazo relevante, os ativos bloqueados têm um caminho para serem reembolsados.
Isso parece um detalhe técnico, mas eu acho que na prática é uma das coisas de que os usuários deveriam se importar mais.
Porque “cross chain” não deveria significar apenas transferir valor entre duas redes.
Também deveria significar ter uma resposta clara para:
O que acontece se algo der errado?
É essa a parte da arquitetura da Omniston da STON.fi que eu acho interessante.
O usuário tem uma experiência de swap simples; por baixo disso, existe um mecanismo de liquidação pensado para concluir os dois lados ou, então, dar aos fundos relevantes uma forma de voltar.
Quanto mais suave o DeFi fica por cima, mais importantes essas mecânicas invisíveis se tornam por baixo.
E é algo ao qual estou dando mais atenção.
Explore Omniston → https://ston.fi/omniston
$BTC #BTC Price Analysis# $ETH #Macro Insights#

38
·
--
Cerca de US$ 2,7 bilhões em BTC teriam saído das exchanges centralizadas nos últimos quatro dias, com a Binance respondendo por grande parte do movimento. A Binance registrou mais de 13.800 BTC em saídas líquidas em um único dia, sua maior saída líquida diária desde 2023.
As reservas de BTC reportadas da Binance caíram de aproximadamente 705.000 BTC para 685.000 BTC ao longo de quatro dias.
Isso importa porque menos moedas paradas nas exchanges pode significar menos BTC disponível imediatamente para venda à vista.
Mas eu não chamaria isso automaticamente de acumulação por baleias.
Os fluxos entre exchanges não nos dizem se essas moedas foram para detentores de longo prazo, custódia institucional, outra exchange, ou simplesmente para carteiras diferentes. Até os analistas que discutem a movimentação reconhecem essa distinção.
Pessoalmente, o que chama minha atenção é o timing.
O Bitcoin vem se recuperando enquanto a demanda por ETFs também ganhou força, e agora os saldos nas exchanges estão caindo ao mesmo tempo. Se essas tendências continuarem juntas, a oferta disponível nos locais de negociação pode ficar cada vez mais apertada.
Mas a confirmação vem do que acontecerá a seguir.
Se o BTC continuar sustentando níveis mais altos enquanto as reservas em exchanges seguem caindo e a demanda à vista permanecer forte, o lado da oferta do mercado começa a parecer muito diferente.
Por enquanto, estou observando os fluxos em vez de presumir que cada retirada é um sinal de acumulação.
Moedas saindo das exchanges é interessante. Moedas ficando fora enquanto a demanda continua subindo é o sinal real.
#BTC Price Analysis# $BTC #Macro Insights#
Cerca de US$ 2,7 bilhões em BTC teriam saído das exchanges centralizadas nos últimos quatro dias, com a Binance respondendo por grande parte do movimento. A Binance registrou mais de 13.800 BTC em saídas líquidas em um único dia, sua maior saída líquida diária desde 2023.
As reservas de BTC reportadas da Binance caíram de aproximadamente 705.000 BTC para 685.000 BTC ao longo de quatro dias.
Isso importa porque menos moedas paradas nas exchanges pode significar menos BTC disponível imediatamente para venda à vista.
Mas eu não chamaria isso automaticamente de acumulação por baleias.
Os fluxos entre exchanges não nos dizem se essas moedas foram para detentores de longo prazo, custódia institucional, outra exchange, ou simplesmente para carteiras diferentes. Até os analistas que discutem a movimentação reconhecem essa distinção.
Pessoalmente, o que chama minha atenção é o timing.
O Bitcoin vem se recuperando enquanto a demanda por ETFs também ganhou força, e agora os saldos nas exchanges estão caindo ao mesmo tempo. Se essas tendências continuarem juntas, a oferta disponível nos locais de negociação pode ficar cada vez mais apertada.
Mas a confirmação vem do que acontecerá a seguir.
Se o BTC continuar sustentando níveis mais altos enquanto as reservas em exchanges seguem caindo e a demanda à vista permanecer forte, o lado da oferta do mercado começa a parecer muito diferente.
Por enquanto, estou observando os fluxos em vez de presumir que cada retirada é um sinal de acumulação.
Moedas saindo das exchanges é interessante. Moedas ficando fora enquanto a demanda continua subindo é o sinal real.
#BTC Price Analysis# $BTC #Macro Insights#
As reservas de BTC reportadas da Binance caíram de aproximadamente 705.000 BTC para 685.000 BTC ao longo de quatro dias.
Isso importa porque menos moedas paradas nas exchanges pode significar menos BTC disponível imediatamente para venda à vista.
Mas eu não chamaria isso automaticamente de acumulação por baleias.
Os fluxos entre exchanges não nos dizem se essas moedas foram para detentores de longo prazo, custódia institucional, outra exchange, ou simplesmente para carteiras diferentes. Até os analistas que discutem a movimentação reconhecem essa distinção.
Pessoalmente, o que chama minha atenção é o timing.
O Bitcoin vem se recuperando enquanto a demanda por ETFs também ganhou força, e agora os saldos nas exchanges estão caindo ao mesmo tempo. Se essas tendências continuarem juntas, a oferta disponível nos locais de negociação pode ficar cada vez mais apertada.
Mas a confirmação vem do que acontecerá a seguir.
Se o BTC continuar sustentando níveis mais altos enquanto as reservas em exchanges seguem caindo e a demanda à vista permanecer forte, o lado da oferta do mercado começa a parecer muito diferente.
Por enquanto, estou observando os fluxos em vez de presumir que cada retirada é um sinal de acumulação.
Moedas saindo das exchanges é interessante. Moedas ficando fora enquanto a demanda continua subindo é o sinal real.
#BTC Price Analysis# $BTC #Macro Insights#

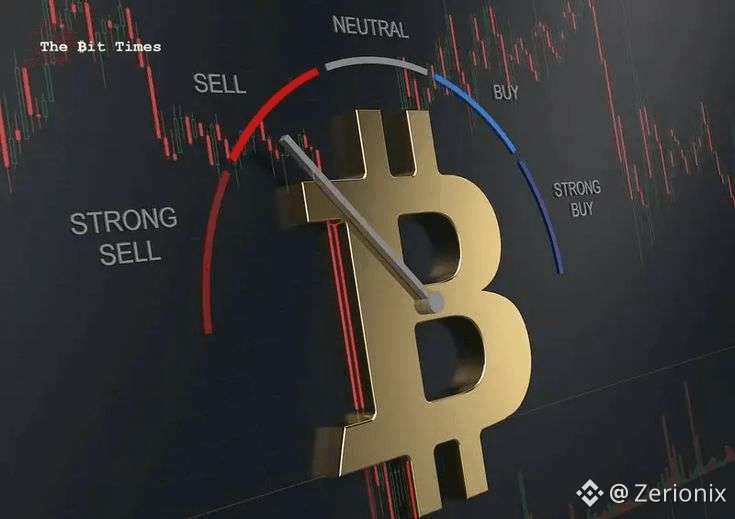
48
·
--
Os ETFs de Bitcoin à vista dos EUA acabam de registrar sua maior entrada semanal de 2026.
Os fundos captaram aproximadamente US$ 2,39B durante a semana de 21 a 25 de setembro, superando o recorde anterior de 2026 de US$ 1,92B estabelecido em agosto.
E o ritmo foi forte.
Na segunda-feira sozinha, vieram quase US$ 999M, o maior dia único de entradas em ETFs desde outubro de 2025.
O que me chama atenção é que isso não foi apenas um grande dia seguido de saídas. Os ETFs continuaram registrando entradas ao longo da semana, com a sequência de seis sessões eventualmente superando US$ 2,8B.
Isso torna o movimento atual mais interessante.
O Bitcoin chegou rapidamente a ultrapassar US$ 87K, enquanto veículos institucionais absorviam simultaneamente bilhões de dólares de exposição à vista.
Mas eu não trataria as entradas em ETFs como uma linha reta garantida subindo.
Cobertura de posições vendidas a descoberto e o posicionamento em derivativos também ajudaram a acelerar a alta, o que significa que parte do movimento de preço não foi puramente demanda à vista.
Pessoalmente, o número que importa para mim agora é se os fluxos permanecem positivos depois que a empolgação esfriar.
Se bilhões continuarem entrando enquanto o BTC mantiver a faixa mais alta, a história da demanda fica mais forte.
Se os fluxos inverterem de repente, vamos saber que parte desse movimento foi posicionamento e não acúmulo sustentável.
US$ 2,39B é impressionante. O sinal real é se as instituições continuam comprando depois do rompimento.
$BTC #Altcoin Season# #Altcoin Season#
Os ETFs de Bitcoin à vista dos EUA acabam de registrar sua maior entrada semanal de 2026.
Os fundos captaram aproximadamente US$ 2,39B durante a semana de 21 a 25 de setembro, superando o recorde anterior de 2026 de US$ 1,92B estabelecido em agosto.
E o ritmo foi forte.
Na segunda-feira sozinha, vieram quase US$ 999M, o maior dia único de entradas em ETFs desde outubro de 2025.
O que me chama atenção é que isso não foi apenas um grande dia seguido de saídas. Os ETFs continuaram registrando entradas ao longo da semana, com a sequência de seis sessões eventualmente superando US$ 2,8B.
Isso torna o movimento atual mais interessante.
O Bitcoin chegou rapidamente a ultrapassar US$ 87K, enquanto veículos institucionais absorviam simultaneamente bilhões de dólares de exposição à vista.
Mas eu não trataria as entradas em ETFs como uma linha reta garantida subindo.
Cobertura de posições vendidas a descoberto e o posicionamento em derivativos também ajudaram a acelerar a alta, o que significa que parte do movimento de preço não foi puramente demanda à vista.
Pessoalmente, o número que importa para mim agora é se os fluxos permanecem positivos depois que a empolgação esfriar.
Se bilhões continuarem entrando enquanto o BTC mantiver a faixa mais alta, a história da demanda fica mais forte.
Se os fluxos inverterem de repente, vamos saber que parte desse movimento foi posicionamento e não acúmulo sustentável.
US$ 2,39B é impressionante. O sinal real é se as instituições continuam comprando depois do rompimento.
$BTC #Altcoin Season# #Altcoin Season#
Os fundos captaram aproximadamente US$ 2,39B durante a semana de 21 a 25 de setembro, superando o recorde anterior de 2026 de US$ 1,92B estabelecido em agosto.
E o ritmo foi forte.
Na segunda-feira sozinha, vieram quase US$ 999M, o maior dia único de entradas em ETFs desde outubro de 2025.
O que me chama atenção é que isso não foi apenas um grande dia seguido de saídas. Os ETFs continuaram registrando entradas ao longo da semana, com a sequência de seis sessões eventualmente superando US$ 2,8B.
Isso torna o movimento atual mais interessante.
O Bitcoin chegou rapidamente a ultrapassar US$ 87K, enquanto veículos institucionais absorviam simultaneamente bilhões de dólares de exposição à vista.
Mas eu não trataria as entradas em ETFs como uma linha reta garantida subindo.
Cobertura de posições vendidas a descoberto e o posicionamento em derivativos também ajudaram a acelerar a alta, o que significa que parte do movimento de preço não foi puramente demanda à vista.
Pessoalmente, o número que importa para mim agora é se os fluxos permanecem positivos depois que a empolgação esfriar.
Se bilhões continuarem entrando enquanto o BTC mantiver a faixa mais alta, a história da demanda fica mais forte.
Se os fluxos inverterem de repente, vamos saber que parte desse movimento foi posicionamento e não acúmulo sustentável.
US$ 2,39B é impressionante. O sinal real é se as instituições continuam comprando depois do rompimento.
$BTC #Altcoin Season# #Altcoin Season#
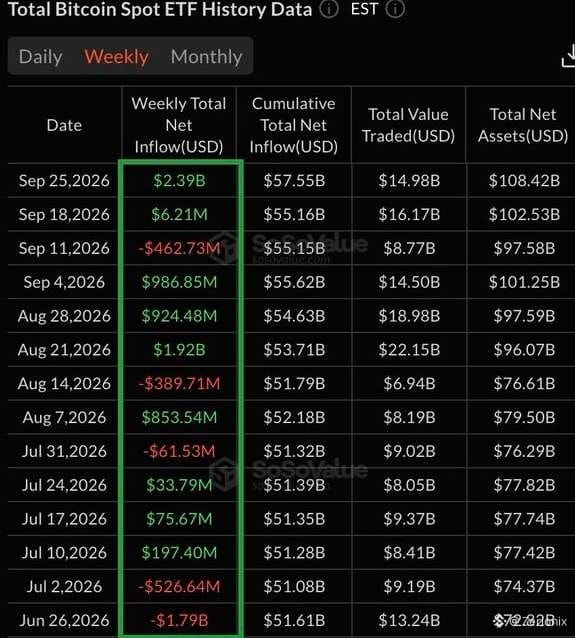
53
·
--
O CFO do Circle, Jeremy Fox-Geen, está se desligando do cargo após mais de cinco anos na função.
Fox-Geen permanecerá como CFO até dezembro de 2026, a menos que um sucessor seja nomeado antes, enquanto a Circle busca seu substituto com a ajuda de uma empresa de recrutamento executivo.
Seu mandato incluiu a IPO do Circle, de US$ 1,2 bilhão, e um período importante de crescimento da empresa. Fox-Geen disse que pretende fazer uma pausa antes do próximo capítulo.
O momento é interessante.
A Circle está se aprofundando em stablecoins, pagamentos e infraestrutura de blockchain; portanto, substituir o chefe financeiro ocorre enquanto a empresa entra em mais uma fase importante de expansão.
Mas isso não sinaliza automaticamente problemas.
A Circle afirmou explicitamente que a saída de Fox-Geen não foi resultado de qualquer discordância com as operações, políticas ou práticas da empresa.
Pessoalmente, estou mais interessado em quem vem a seguir.
Um novo CFO na Circle não vai apenas gerenciar um balanço tradicional de fintech. Ele terá de lidar com a economia das stablecoins, mudanças regulatórias, expectativas do mercado público e a infraestrutura financeira que está sendo construída em torno do USDC.
A transição, por enquanto, é ordenada.
O verdadeiro sinal será o perfil do próximo CFO da Circle e o que essa nomeação diz sobre para onde a empresa quer ir a seguir.
$USDC #BTC Price Analysis# #Altcoin Season# $SOL
O CFO do Circle, Jeremy Fox-Geen, está se desligando do cargo após mais de cinco anos na função.
Fox-Geen permanecerá como CFO até dezembro de 2026, a menos que um sucessor seja nomeado antes, enquanto a Circle busca seu substituto com a ajuda de uma empresa de recrutamento executivo.
Seu mandato incluiu a IPO do Circle, de US$ 1,2 bilhão, e um período importante de crescimento da empresa. Fox-Geen disse que pretende fazer uma pausa antes do próximo capítulo.
O momento é interessante.
A Circle está se aprofundando em stablecoins, pagamentos e infraestrutura de blockchain; portanto, substituir o chefe financeiro ocorre enquanto a empresa entra em mais uma fase importante de expansão.
Mas isso não sinaliza automaticamente problemas.
A Circle afirmou explicitamente que a saída de Fox-Geen não foi resultado de qualquer discordância com as operações, políticas ou práticas da empresa.
Pessoalmente, estou mais interessado em quem vem a seguir.
Um novo CFO na Circle não vai apenas gerenciar um balanço tradicional de fintech. Ele terá de lidar com a economia das stablecoins, mudanças regulatórias, expectativas do mercado público e a infraestrutura financeira que está sendo construída em torno do USDC.
A transição, por enquanto, é ordenada.
O verdadeiro sinal será o perfil do próximo CFO da Circle e o que essa nomeação diz sobre para onde a empresa quer ir a seguir.
$USDC #BTC Price Analysis# #Altcoin Season# $SOL
Fox-Geen permanecerá como CFO até dezembro de 2026, a menos que um sucessor seja nomeado antes, enquanto a Circle busca seu substituto com a ajuda de uma empresa de recrutamento executivo.
Seu mandato incluiu a IPO do Circle, de US$ 1,2 bilhão, e um período importante de crescimento da empresa. Fox-Geen disse que pretende fazer uma pausa antes do próximo capítulo.
O momento é interessante.
A Circle está se aprofundando em stablecoins, pagamentos e infraestrutura de blockchain; portanto, substituir o chefe financeiro ocorre enquanto a empresa entra em mais uma fase importante de expansão.
Mas isso não sinaliza automaticamente problemas.
A Circle afirmou explicitamente que a saída de Fox-Geen não foi resultado de qualquer discordância com as operações, políticas ou práticas da empresa.
Pessoalmente, estou mais interessado em quem vem a seguir.
Um novo CFO na Circle não vai apenas gerenciar um balanço tradicional de fintech. Ele terá de lidar com a economia das stablecoins, mudanças regulatórias, expectativas do mercado público e a infraestrutura financeira que está sendo construída em torno do USDC.
A transição, por enquanto, é ordenada.
O verdadeiro sinal será o perfil do próximo CFO da Circle e o que essa nomeação diz sobre para onde a empresa quer ir a seguir.
$USDC #BTC Price Analysis# #Altcoin Season# $SOL


79
Inicia sessão para explorar mais conteúdos
Junta-te a utilizadores de criptomoedas de todo o mundo na Binance Square
⚡️ Obtém informações úteis e recentes sobre criptomoedas.
💬 Com a confiança da maior exchange de criptomoedas do mundo.
👍 Descobre perspetivas reais de criadores verificados.
E-mail/Número de telefone
Tópicos em Tendência
NFPWatch
10.5M visualizações
17,856 a discutir
Notícias de Cripto | Bitcoin se Aproxima de US$ 85 mil à medida que os Rendimento dos Treasuries Caem antes do Relatório NFP dos EUA
Binance News
·30 gostos
·38.5k visualizações
BitcoinFundingRateTriplesTo10%
6,400 visualizações
204 a discutir
BitcoinSurpasses$86KUp2.99%
2,108 visualizações
33 a discutir