

Bitcoinworld
69.1k Publicações

Bitcoinworld
 Square verificado+
Denunciar
Bloquear Utilizador
BitcoinWorld is a leading media publication bringing the latest happenings in the Blockchain and Crypto Space.

#BinanceTurns7

Excellence Award (Market Buzz)

Creator of the Year
2 A seguir
100.7K Seguidores
287.4K+ Gostaram
4 Emblemas
Publicações
Tudo
Vídeos
Em direto
·
--
Artigo
Volume Cripto da Coreia do Sul Cai 19,56% em Uma SemanaBitcoinWorld
O volume cripto da Coreia do Sul cai 19,56% em uma semana
O volume de negociações consolidado das cinco maiores bolsas de criptomoedas da Coreia do Sul caiu para aproximadamente 20,5 trilhões de won, ou cerca de US$ 15,1 bilhões, na semana encerrada em 2 de outubro, uma queda de 19,56% em relação à semana anterior, de acordo com a Crypto.news, citando dados da Digital Asset. A queda removeu cerca de 5 trilhões de won, ou aproximadamente US$ 3,7 bilhões, da atividade no período de sete dias que terminou às 14h (horário padrão da Coreia) em 2 de outubro.
As cinco principais bolsas da Coreia do Sul negociaram cerca de 20,5 trilhões de won na semana até 2 de outubro, abaixo de 19,56% de uma semana para a outra. O recuo semanal ocorreu após dados do governo mostrarem que o volume médio diário de negociação na país caiu 44% no primeiro semestre de 2026 e que o lucro operacional caiu 78%.
Volume Cripto da Coreia do Sul Cai 19,56% em Uma Semana
BitcoinWorld
O volume cripto da Coreia do Sul cai 19,56% em uma semana
O volume de negociações consolidado das cinco maiores bolsas de criptomoedas da Coreia do Sul caiu para aproximadamente 20,5 trilhões de won, ou cerca de US$ 15,1 bilhões, na semana encerrada em 2 de outubro, uma queda de 19,56% em relação à semana anterior, de acordo com a Crypto.news, citando dados da Digital Asset. A queda removeu cerca de 5 trilhões de won, ou aproximadamente US$ 3,7 bilhões, da atividade no período de sete dias que terminou às 14h (horário padrão da Coreia) em 2 de outubro.
As cinco principais bolsas da Coreia do Sul negociaram cerca de 20,5 trilhões de won na semana até 2 de outubro, abaixo de 19,56% de uma semana para a outra. O recuo semanal ocorreu após dados do governo mostrarem que o volume médio diário de negociação na país caiu 44% no primeiro semestre de 2026 e que o lucro operacional caiu 78%.
O volume cripto da Coreia do Sul cai 19,56% em uma semana
O volume de negociações consolidado das cinco maiores bolsas de criptomoedas da Coreia do Sul caiu para aproximadamente 20,5 trilhões de won, ou cerca de US$ 15,1 bilhões, na semana encerrada em 2 de outubro, uma queda de 19,56% em relação à semana anterior, de acordo com a Crypto.news, citando dados da Digital Asset. A queda removeu cerca de 5 trilhões de won, ou aproximadamente US$ 3,7 bilhões, da atividade no período de sete dias que terminou às 14h (horário padrão da Coreia) em 2 de outubro.
As cinco principais bolsas da Coreia do Sul negociaram cerca de 20,5 trilhões de won na semana até 2 de outubro, abaixo de 19,56% de uma semana para a outra. O recuo semanal ocorreu após dados do governo mostrarem que o volume médio diário de negociação na país caiu 44% no primeiro semestre de 2026 e que o lucro operacional caiu 78%.
57
·
--
Verificado
Artigo
OpenPayd mira listagem na Nasdaq até o fim do ano sob o ticker OPBitcoinWorld
OpenPayd mira listagem na Nasdaq até o fim do ano sob o ticker OP
A OpenPayd, empresa de infraestrutura de pagamentos com stablecoin com sede em Londres, espera concluir sua fusão com a Titan Acquisition Corp. e listar na Nasdaq sob o ticker OP até o final de 2026, segundo a Crypto.news. A transação, anunciada em cerca de US$ 1,1 bilhão, daria à empresa combinada um valor implícito de patrimônio pro forma de até US$ 1,145 bilhão.
A OpenPayd planeja encerrar a fusão com a Titan Acquisition Corp. e listar na Nasdaq sob a OP até o fim de 2026, avaliando a empresa combinada em até US$ 1,145 bilhão. A empresa de pagamentos com stablecoin pretende lançar serviços nos EUA até abril de 2027 usando 43 licenças de money transmitter adquiridas em setembro.
OpenPayd mira listagem na Nasdaq até o fim do ano sob o ticker OP
BitcoinWorld
OpenPayd mira listagem na Nasdaq até o fim do ano sob o ticker OP
A OpenPayd, empresa de infraestrutura de pagamentos com stablecoin com sede em Londres, espera concluir sua fusão com a Titan Acquisition Corp. e listar na Nasdaq sob o ticker OP até o final de 2026, segundo a Crypto.news. A transação, anunciada em cerca de US$ 1,1 bilhão, daria à empresa combinada um valor implícito de patrimônio pro forma de até US$ 1,145 bilhão.
A OpenPayd planeja encerrar a fusão com a Titan Acquisition Corp. e listar na Nasdaq sob a OP até o fim de 2026, avaliando a empresa combinada em até US$ 1,145 bilhão. A empresa de pagamentos com stablecoin pretende lançar serviços nos EUA até abril de 2027 usando 43 licenças de money transmitter adquiridas em setembro.
OpenPayd mira listagem na Nasdaq até o fim do ano sob o ticker OP
A OpenPayd, empresa de infraestrutura de pagamentos com stablecoin com sede em Londres, espera concluir sua fusão com a Titan Acquisition Corp. e listar na Nasdaq sob o ticker OP até o final de 2026, segundo a Crypto.news. A transação, anunciada em cerca de US$ 1,1 bilhão, daria à empresa combinada um valor implícito de patrimônio pro forma de até US$ 1,145 bilhão.
A OpenPayd planeja encerrar a fusão com a Titan Acquisition Corp. e listar na Nasdaq sob a OP até o fim de 2026, avaliando a empresa combinada em até US$ 1,145 bilhão. A empresa de pagamentos com stablecoin pretende lançar serviços nos EUA até abril de 2027 usando 43 licenças de money transmitter adquiridas em setembro.
1
3
637
·
--

Artigo
Pesquisa da Lloyds: 71% dos líderes de finanças do Reino Unido esperam mudança com tokenizaçãoBitcoinWorld
Pesquisa da Lloyds: 71% dos líderes de finanças do Reino Unido esperam mudança com tokenização
Quase três quartos dos principais decisores em grandes instituições financeiras do Reino Unido acreditam que a tokenização vai transformar os serviços financeiros, segundo uma pesquisa anual do Lloyds Banking Group divulgada em 2 de outubro de 2026. O levantamento com 100 executivos de bancos, seguradoras, gestores de ativos e patrocinadores financeiros constatou que 71% esperam que a representação baseada em blockchain de ativos como dinheiro, títulos e fundos altere a forma como o setor opera, conforme informou a Cointelegraph.
Pesquisa da Lloyds: 71% dos líderes de finanças do Reino Unido esperam mudança com tokenização
BitcoinWorld
Pesquisa da Lloyds: 71% dos líderes de finanças do Reino Unido esperam mudança com tokenização
Quase três quartos dos principais decisores em grandes instituições financeiras do Reino Unido acreditam que a tokenização vai transformar os serviços financeiros, segundo uma pesquisa anual do Lloyds Banking Group divulgada em 2 de outubro de 2026. O levantamento com 100 executivos de bancos, seguradoras, gestores de ativos e patrocinadores financeiros constatou que 71% esperam que a representação baseada em blockchain de ativos como dinheiro, títulos e fundos altere a forma como o setor opera, conforme informou a Cointelegraph.
Pesquisa da Lloyds: 71% dos líderes de finanças do Reino Unido esperam mudança com tokenização
Quase três quartos dos principais decisores em grandes instituições financeiras do Reino Unido acreditam que a tokenização vai transformar os serviços financeiros, segundo uma pesquisa anual do Lloyds Banking Group divulgada em 2 de outubro de 2026. O levantamento com 100 executivos de bancos, seguradoras, gestores de ativos e patrocinadores financeiros constatou que 71% esperam que a representação baseada em blockchain de ativos como dinheiro, títulos e fundos altere a forma como o setor opera, conforme informou a Cointelegraph.
244
·
--

Artigo
A IA da Chainalysis Rastreia o Hack de US$ 387M na Bitget até a Coreia do NorteBitcoinWorld
A IA da Chainalysis Rastreia o Hack de US$ 387M na Bitget até a Coreia do Norte
A empresa de análise de blockchain Chainalysis atribuiu o hack da exchange Bitget de US$ 387 milhões a atores ligados à Coreia do Norte, levando o total de roubos cripto do país em 2026 a ultrapassar US$ 1 bilhão, de acordo com um relatório publicado na quarta-feira e coberto pelo Decrypt. A invasão de 24 de setembro fez com que US$ 387 milhões saíssem da Bitget em 23 transferências em quatro blockchains em três horas. A Chainalysis disse que usou uma IA interna para acelerar o rastreamento, comprimindo o que estimou como mais de 20 horas de conciliação manual de ponte em menos de 10 minutos.
A IA da Chainalysis Rastreia o Hack de US$ 387M na Bitget até a Coreia do Norte
BitcoinWorld
A IA da Chainalysis Rastreia o Hack de US$ 387M na Bitget até a Coreia do Norte
A empresa de análise de blockchain Chainalysis atribuiu o hack da exchange Bitget de US$ 387 milhões a atores ligados à Coreia do Norte, levando o total de roubos cripto do país em 2026 a ultrapassar US$ 1 bilhão, de acordo com um relatório publicado na quarta-feira e coberto pelo Decrypt. A invasão de 24 de setembro fez com que US$ 387 milhões saíssem da Bitget em 23 transferências em quatro blockchains em três horas. A Chainalysis disse que usou uma IA interna para acelerar o rastreamento, comprimindo o que estimou como mais de 20 horas de conciliação manual de ponte em menos de 10 minutos.
A IA da Chainalysis Rastreia o Hack de US$ 387M na Bitget até a Coreia do Norte
A empresa de análise de blockchain Chainalysis atribuiu o hack da exchange Bitget de US$ 387 milhões a atores ligados à Coreia do Norte, levando o total de roubos cripto do país em 2026 a ultrapassar US$ 1 bilhão, de acordo com um relatório publicado na quarta-feira e coberto pelo Decrypt. A invasão de 24 de setembro fez com que US$ 387 milhões saíssem da Bitget em 23 transferências em quatro blockchains em três horas. A Chainalysis disse que usou uma IA interna para acelerar o rastreamento, comprimindo o que estimou como mais de 20 horas de conciliação manual de ponte em menos de 10 minutos.
1
2
271
·
--
Artigo
Bitcoin Crashes Below $84K as Liquidations Near $600MBitcoinWorld
Bitcoin Crashes Below $84K as Liquidations Near $600M
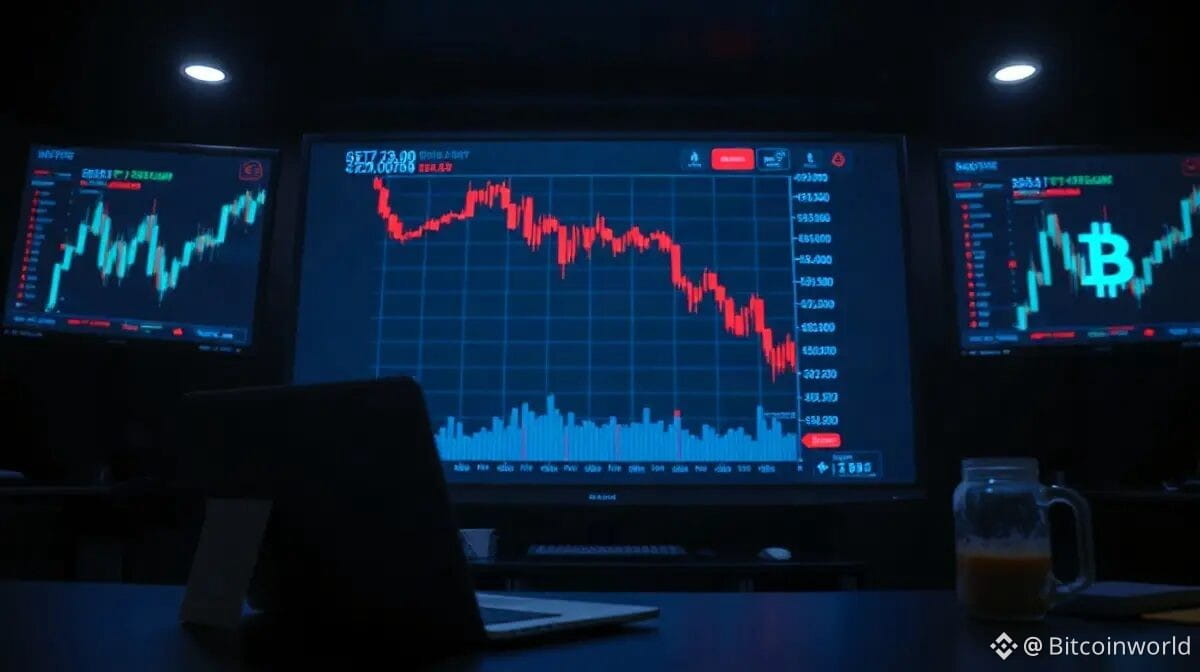
O Bitcoin despencou abaixo de US$ 84.000 em 2 de outubro de 2026, horas depois de ter ultrapassado brevemente US$ 87.000 pela primeira vez em cerca de dez dias, segundo a Cryptopotato. A reversão brusca desencadeou uma onda de vendas forçadas que fez as liquidações totais de cripto ultrapassarem US$ 570 milhões em 24 horas, com US$ 186 milhões liquidados em uma única hora.
Em 2 de outubro, o Bitcoin despencou abaixo de US$ 84.000 após uma alta fracassada acima de US$ 87.000, levando a mais de US$ 570 milhões em liquidações de criptomoedas. As posições compradas (longs) responderam por 99% dos US$ 186 milhões liquidados na última hora, de acordo com dados da CoinGlass citados pela Cryptopotato.
Bitcoin Crashes Below $84K as Liquidations Near $600M
BitcoinWorld
Bitcoin Crashes Below $84K as Liquidations Near $600M
O Bitcoin despencou abaixo de US$ 84.000 em 2 de outubro de 2026, horas depois de ter ultrapassado brevemente US$ 87.000 pela primeira vez em cerca de dez dias, segundo a Cryptopotato. A reversão brusca desencadeou uma onda de vendas forçadas que fez as liquidações totais de cripto ultrapassarem US$ 570 milhões em 24 horas, com US$ 186 milhões liquidados em uma única hora.
Em 2 de outubro, o Bitcoin despencou abaixo de US$ 84.000 após uma alta fracassada acima de US$ 87.000, levando a mais de US$ 570 milhões em liquidações de criptomoedas. As posições compradas (longs) responderam por 99% dos US$ 186 milhões liquidados na última hora, de acordo com dados da CoinGlass citados pela Cryptopotato.
Bitcoin Crashes Below $84K as Liquidations Near $600M
O Bitcoin despencou abaixo de US$ 84.000 em 2 de outubro de 2026, horas depois de ter ultrapassado brevemente US$ 87.000 pela primeira vez em cerca de dez dias, segundo a Cryptopotato. A reversão brusca desencadeou uma onda de vendas forçadas que fez as liquidações totais de cripto ultrapassarem US$ 570 milhões em 24 horas, com US$ 186 milhões liquidados em uma única hora.
Em 2 de outubro, o Bitcoin despencou abaixo de US$ 84.000 após uma alta fracassada acima de US$ 87.000, levando a mais de US$ 570 milhões em liquidações de criptomoedas. As posições compradas (longs) responderam por 99% dos US$ 186 milhões liquidados na última hora, de acordo com dados da CoinGlass citados pela Cryptopotato.
1
247
·
--
Artigo
Blast encerrará a Layer 2 à medida que os custos superam a receita, definindo prazo de 26 de outubroBitcoinWorld
Blast encerrará a Layer 2 quando os custos superarem a receita, definindo prazo de 26 de outubro
A Blast encerrará sua rede Ethereum Layer 2 após determinar que o custo de manter a cadeia supera o que ela arrecada, disse o projeto em um comunicado de 2 de outubro no X. Os usuários têm até 26 de outubro de 2026 para sacar pela interface normal da Blast, de acordo com a Crypto.news.
A Blast está diminuindo suas operações na Ethereum Layer 2 porque os custos de manutenção da rede excederam a receita gerada pelas suas operações na Layer 2. Os usuários devem fazer saques pela interface padrão até 26 de outubro de 2026; depois disso, os ativos permanecem recuperáveis apenas interagindo diretamente com os contratos de ponte (bridge) da Blast na mainnet do Ethereum.
Blast encerrará a Layer 2 à medida que os custos superam a receita, definindo prazo de 26 de outubro
BitcoinWorld
Blast encerrará a Layer 2 quando os custos superarem a receita, definindo prazo de 26 de outubro
A Blast encerrará sua rede Ethereum Layer 2 após determinar que o custo de manter a cadeia supera o que ela arrecada, disse o projeto em um comunicado de 2 de outubro no X. Os usuários têm até 26 de outubro de 2026 para sacar pela interface normal da Blast, de acordo com a Crypto.news.
A Blast está diminuindo suas operações na Ethereum Layer 2 porque os custos de manutenção da rede excederam a receita gerada pelas suas operações na Layer 2. Os usuários devem fazer saques pela interface padrão até 26 de outubro de 2026; depois disso, os ativos permanecem recuperáveis apenas interagindo diretamente com os contratos de ponte (bridge) da Blast na mainnet do Ethereum.
Blast encerrará a Layer 2 quando os custos superarem a receita, definindo prazo de 26 de outubro
A Blast encerrará sua rede Ethereum Layer 2 após determinar que o custo de manter a cadeia supera o que ela arrecada, disse o projeto em um comunicado de 2 de outubro no X. Os usuários têm até 26 de outubro de 2026 para sacar pela interface normal da Blast, de acordo com a Crypto.news.
A Blast está diminuindo suas operações na Ethereum Layer 2 porque os custos de manutenção da rede excederam a receita gerada pelas suas operações na Layer 2. Os usuários devem fazer saques pela interface padrão até 26 de outubro de 2026; depois disso, os ativos permanecem recuperáveis apenas interagindo diretamente com os contratos de ponte (bridge) da Blast na mainnet do Ethereum.
207
·
--
Artigo
Controladora da Kraken, Payward, discute parceria com o BNY envolvendo criptoBitcoinWorld
Payward, controladora da Kraken, negocia parceria com o BNY envolvendo cripto
A Payward, empresa-mãe da exchange de criptomoedas Kraken, entrou em negociações com o BNY sobre uma possível parceria que abrange seis linhas de negócios, incluindo custódia de cripto, negociação e pagamentos, de acordo com a Crypto.news. Duas pessoas familiarizadas com as discussões, que falaram anonimamente porque as negociações são privadas, disseram que nenhum acordo é garantido.
A Payward e o BNY estão discutindo uma parceria potencial que cobre produtos de cripto, custódia, gestão de patrimônio, negociação, pagamentos e infraestrutura financeira. As conversas foram divulgadas pela primeira vez pela Crypto.news em 2 de outubro de 2026, enquanto a PANews informou as mesmas discussões em 3 de outubro. As negociações seguem em andamento e nenhum acordo foi confirmado.
Controladora da Kraken, Payward, discute parceria com o BNY envolvendo cripto
BitcoinWorld
Payward, controladora da Kraken, negocia parceria com o BNY envolvendo cripto
A Payward, empresa-mãe da exchange de criptomoedas Kraken, entrou em negociações com o BNY sobre uma possível parceria que abrange seis linhas de negócios, incluindo custódia de cripto, negociação e pagamentos, de acordo com a Crypto.news. Duas pessoas familiarizadas com as discussões, que falaram anonimamente porque as negociações são privadas, disseram que nenhum acordo é garantido.
A Payward e o BNY estão discutindo uma parceria potencial que cobre produtos de cripto, custódia, gestão de patrimônio, negociação, pagamentos e infraestrutura financeira. As conversas foram divulgadas pela primeira vez pela Crypto.news em 2 de outubro de 2026, enquanto a PANews informou as mesmas discussões em 3 de outubro. As negociações seguem em andamento e nenhum acordo foi confirmado.
Payward, controladora da Kraken, negocia parceria com o BNY envolvendo cripto
A Payward, empresa-mãe da exchange de criptomoedas Kraken, entrou em negociações com o BNY sobre uma possível parceria que abrange seis linhas de negócios, incluindo custódia de cripto, negociação e pagamentos, de acordo com a Crypto.news. Duas pessoas familiarizadas com as discussões, que falaram anonimamente porque as negociações são privadas, disseram que nenhum acordo é garantido.
A Payward e o BNY estão discutindo uma parceria potencial que cobre produtos de cripto, custódia, gestão de patrimônio, negociação, pagamentos e infraestrutura financeira. As conversas foram divulgadas pela primeira vez pela Crypto.news em 2 de outubro de 2026, enquanto a PANews informou as mesmas discussões em 3 de outubro. As negociações seguem em andamento e nenhum acordo foi confirmado.
154
·
--
Artigo
SEC Propõe Regras de Custódia de Cripto para Consultores e FundosBitcoinWorld
SEC Propõe Regras de Custódia de Cripto para Consultores e Fundos
A Comissão de Valores Mobiliários dos Estados Unidos (SEC) propôs novas regras para orientar como consultores de investimentos registrados e fundos regulamentados fazem a custódia de criptoativos, em um esforço que o presidente Paul Atkins disse que substituiria “a zona cinzenta de incerteza criada por regras de custódia elaboradas para uma era já passada”, segundo a Cryptopotato. A proposta, emitida ao abrigo da Lei de 1940 sobre Consultores de Investimento (Investment Advisers Act) e da Lei de 1940 sobre Sociedades de Investimento (Investment Company Act), foi criada para esclarecer quais arranjos atendem ao padrão de “custodiante qualificado”, que por muito tempo impediu muitas empresas de oferecerem estratégias de ativos digitais.
SEC Propõe Regras de Custódia de Cripto para Consultores e Fundos
BitcoinWorld
SEC Propõe Regras de Custódia de Cripto para Consultores e Fundos
A Comissão de Valores Mobiliários dos Estados Unidos (SEC) propôs novas regras para orientar como consultores de investimentos registrados e fundos regulamentados fazem a custódia de criptoativos, em um esforço que o presidente Paul Atkins disse que substituiria “a zona cinzenta de incerteza criada por regras de custódia elaboradas para uma era já passada”, segundo a Cryptopotato. A proposta, emitida ao abrigo da Lei de 1940 sobre Consultores de Investimento (Investment Advisers Act) e da Lei de 1940 sobre Sociedades de Investimento (Investment Company Act), foi criada para esclarecer quais arranjos atendem ao padrão de “custodiante qualificado”, que por muito tempo impediu muitas empresas de oferecerem estratégias de ativos digitais.
SEC Propõe Regras de Custódia de Cripto para Consultores e Fundos
A Comissão de Valores Mobiliários dos Estados Unidos (SEC) propôs novas regras para orientar como consultores de investimentos registrados e fundos regulamentados fazem a custódia de criptoativos, em um esforço que o presidente Paul Atkins disse que substituiria “a zona cinzenta de incerteza criada por regras de custódia elaboradas para uma era já passada”, segundo a Cryptopotato. A proposta, emitida ao abrigo da Lei de 1940 sobre Consultores de Investimento (Investment Advisers Act) e da Lei de 1940 sobre Sociedades de Investimento (Investment Company Act), foi criada para esclarecer quais arranjos atendem ao padrão de “custodiante qualificado”, que por muito tempo impediu muitas empresas de oferecerem estratégias de ativos digitais.
2
168
·
--
Artigo
A Maior Programação do Token Week Está Aqui: Arthur Hayes, Raoul Pal Estreiam no CoinFerenceX The Best ...BitcoinWorld
A Maior Programação do Token Week Está Aqui: Arthur Hayes, Raoul Pal Estreiam no CoinFerenceX The Best Event Singapore 2026
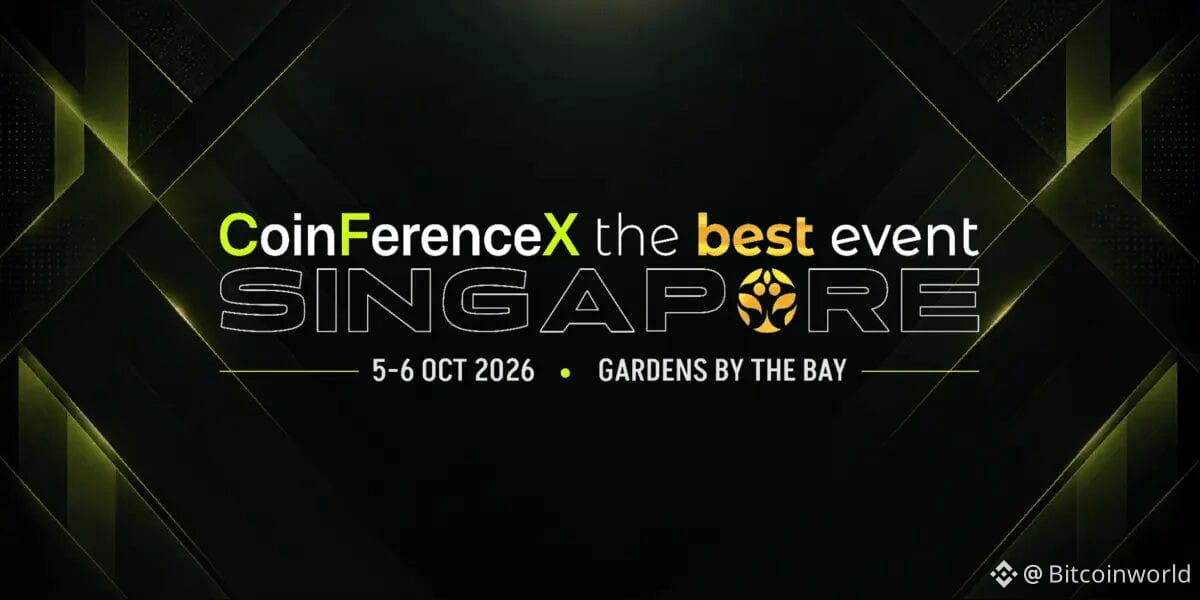
SINGAPURA, 1 de outubro de 2026 – A maior programação de palestrantes do Token Week está a caminho do Gardens by the Bay. CoinFerenceX The Best Event Singapore 2026 contará com mais de 85 palestrantes no Flower Field Hall em 5–6 de outubro por dois dias de keynotes, painéis e conversas em formato fireside durante a semana TOKEN2049.
O cimeira é encabeçada por Arthur Hayes, CIO da Maelstrom; Raoul Pal, Co-Fundador e CEO da Real Vision; Yat Siu, Co-Fundador e Presidente Executivo da Animoca Brands; Sandeep Nailwal, Co-Fundador e CEO da Polygon; e Andrei Grachev, Sócio-Gerente da DWF Labs. Eles se juntam a líderes sêniores da Binance, Coinbase, Crypto.com, BNB Chain, MEXC, Gate, BingX, KuCoin, CertiK, Hacken, MetaMask, Base, Berachain e Spartan Group.
A Maior Programação do Token Week Está Aqui: Arthur Hayes, Raoul Pal Estreiam no CoinFerenceX The Best ...
BitcoinWorld
A Maior Programação do Token Week Está Aqui: Arthur Hayes, Raoul Pal Estreiam no CoinFerenceX The Best Event Singapore 2026
SINGAPURA, 1 de outubro de 2026 – A maior programação de palestrantes do Token Week está a caminho do Gardens by the Bay. CoinFerenceX The Best Event Singapore 2026 contará com mais de 85 palestrantes no Flower Field Hall em 5–6 de outubro por dois dias de keynotes, painéis e conversas em formato fireside durante a semana TOKEN2049.
O cimeira é encabeçada por Arthur Hayes, CIO da Maelstrom; Raoul Pal, Co-Fundador e CEO da Real Vision; Yat Siu, Co-Fundador e Presidente Executivo da Animoca Brands; Sandeep Nailwal, Co-Fundador e CEO da Polygon; e Andrei Grachev, Sócio-Gerente da DWF Labs. Eles se juntam a líderes sêniores da Binance, Coinbase, Crypto.com, BNB Chain, MEXC, Gate, BingX, KuCoin, CertiK, Hacken, MetaMask, Base, Berachain e Spartan Group.
A Maior Programação do Token Week Está Aqui: Arthur Hayes, Raoul Pal Estreiam no CoinFerenceX The Best Event Singapore 2026
SINGAPURA, 1 de outubro de 2026 – A maior programação de palestrantes do Token Week está a caminho do Gardens by the Bay. CoinFerenceX The Best Event Singapore 2026 contará com mais de 85 palestrantes no Flower Field Hall em 5–6 de outubro por dois dias de keynotes, painéis e conversas em formato fireside durante a semana TOKEN2049.
O cimeira é encabeçada por Arthur Hayes, CIO da Maelstrom; Raoul Pal, Co-Fundador e CEO da Real Vision; Yat Siu, Co-Fundador e Presidente Executivo da Animoca Brands; Sandeep Nailwal, Co-Fundador e CEO da Polygon; e Andrei Grachev, Sócio-Gerente da DWF Labs. Eles se juntam a líderes sêniores da Binance, Coinbase, Crypto.com, BNB Chain, MEXC, Gate, BingX, KuCoin, CertiK, Hacken, MetaMask, Base, Berachain e Spartan Group.
150
·
--
Artigo
Circle pede à UE para retirar a regra de depósitos bancários da MiCA para stablecoinsBitcoinWorld
Circle pede à UE para retirar a regra da MiCA de depósitos bancários para stablecoins
A Circle pediu à Comissão Europeia que reescreva as regras de reservas no coração da Regulamentação dos Mercados de Cripto-Ativos (Markets in Crypto-Assets Regulation) da UE, dizendo a Bruxelas que uma exigência fixa de depósito bancário deixa os emissores de stablecoins mais expostos ao sistema bancário, e não menos. O emissor do USDC apresentou sua resposta à consulta da Comissão sobre a MiCA na quinta-feira, 2 de outubro, de acordo com a Decrypt.
A Circle quer que a Comissão Europeia substitua a exigência da MiCA de que os emissores de stablecoins mantenham pelo menos 30% das reservas em depósitos em bancos comerciais — subindo para 60% para tokens considerados significativos — por requisitos baseados em liquidez. A empresa também instou a UE a preservar a emissão múltipla, alertando que restringi-la impulsionaria a atividade para o exterior.
Circle pede à UE para retirar a regra de depósitos bancários da MiCA para stablecoins
BitcoinWorld
Circle pede à UE para retirar a regra da MiCA de depósitos bancários para stablecoins
A Circle pediu à Comissão Europeia que reescreva as regras de reservas no coração da Regulamentação dos Mercados de Cripto-Ativos (Markets in Crypto-Assets Regulation) da UE, dizendo a Bruxelas que uma exigência fixa de depósito bancário deixa os emissores de stablecoins mais expostos ao sistema bancário, e não menos. O emissor do USDC apresentou sua resposta à consulta da Comissão sobre a MiCA na quinta-feira, 2 de outubro, de acordo com a Decrypt.
A Circle quer que a Comissão Europeia substitua a exigência da MiCA de que os emissores de stablecoins mantenham pelo menos 30% das reservas em depósitos em bancos comerciais — subindo para 60% para tokens considerados significativos — por requisitos baseados em liquidez. A empresa também instou a UE a preservar a emissão múltipla, alertando que restringi-la impulsionaria a atividade para o exterior.
Circle pede à UE para retirar a regra da MiCA de depósitos bancários para stablecoins
A Circle pediu à Comissão Europeia que reescreva as regras de reservas no coração da Regulamentação dos Mercados de Cripto-Ativos (Markets in Crypto-Assets Regulation) da UE, dizendo a Bruxelas que uma exigência fixa de depósito bancário deixa os emissores de stablecoins mais expostos ao sistema bancário, e não menos. O emissor do USDC apresentou sua resposta à consulta da Comissão sobre a MiCA na quinta-feira, 2 de outubro, de acordo com a Decrypt.
A Circle quer que a Comissão Europeia substitua a exigência da MiCA de que os emissores de stablecoins mantenham pelo menos 30% das reservas em depósitos em bancos comerciais — subindo para 60% para tokens considerados significativos — por requisitos baseados em liquidez. A empresa também instou a UE a preservar a emissão múltipla, alertando que restringi-la impulsionaria a atividade para o exterior.
762
·
--
Artigo
THORChain abre pool de Zcash; swaps de ZEC ainda não estão ativosBitcoinWorld
THORChain abre pool de Zcash; swaps de ZEC ainda não estão ativos
A THORChain ativou um pool de liquidez de Zcash (ZEC) em 2 de out. de 2026, algumas horas depois de concluir um churn de nós, no qual cada nó começou a acompanhar a cadeia de Zcash. O protocolo disse que o pool está ativo, mas que “a negociação é o próximo passo”, e não divulgou um horário inicial firme nem um dado de profundidade do pool, de acordo com a Crypto.news.
THORChain lançou seu pool de liquidez de Zcash (ZEC) em 2 de out. de 2026, após um churn na rede ter deixado cada nó monitorando a cadeia de Zcash. A negociação nativa de ZEC ainda não começou, e a THORChain disse que a liquidez está baixa por enquanto, então está orientando os usuários a negociar com cautela nos primeiros dias.
THORChain abre pool de Zcash; swaps de ZEC ainda não estão ativos
BitcoinWorld
THORChain abre pool de Zcash; swaps de ZEC ainda não estão ativos
A THORChain ativou um pool de liquidez de Zcash (ZEC) em 2 de out. de 2026, algumas horas depois de concluir um churn de nós, no qual cada nó começou a acompanhar a cadeia de Zcash. O protocolo disse que o pool está ativo, mas que “a negociação é o próximo passo”, e não divulgou um horário inicial firme nem um dado de profundidade do pool, de acordo com a Crypto.news.
THORChain lançou seu pool de liquidez de Zcash (ZEC) em 2 de out. de 2026, após um churn na rede ter deixado cada nó monitorando a cadeia de Zcash. A negociação nativa de ZEC ainda não começou, e a THORChain disse que a liquidez está baixa por enquanto, então está orientando os usuários a negociar com cautela nos primeiros dias.
THORChain abre pool de Zcash; swaps de ZEC ainda não estão ativos
A THORChain ativou um pool de liquidez de Zcash (ZEC) em 2 de out. de 2026, algumas horas depois de concluir um churn de nós, no qual cada nó começou a acompanhar a cadeia de Zcash. O protocolo disse que o pool está ativo, mas que “a negociação é o próximo passo”, e não divulgou um horário inicial firme nem um dado de profundidade do pool, de acordo com a Crypto.news.
THORChain lançou seu pool de liquidez de Zcash (ZEC) em 2 de out. de 2026, após um churn na rede ter deixado cada nó monitorando a cadeia de Zcash. A negociação nativa de ZEC ainda não começou, e a THORChain disse que a liquidez está baixa por enquanto, então está orientando os usuários a negociar com cautela nos primeiros dias.
1
686
·
--
Artigo
Exploit de Adaptador Aave de Terceiros Drena 114 ETH dos SafesBitcoinWorld
Exploit de adaptador Aave de terceiros drena 114 ETH dos Safes
Um atacante drenou cerca de 114,09 ETH — no valor aproximado de US$ 305.000 — de duas carteiras multisig Safe em 2 de outubro ao explorar uma falha de controle de acesso em um adaptador de terceiros construído sobre a Aave v3, segundo o Cryptoslate. A empresa de segurança blockchain SlowMist rastreou a perda até o FlashLoopAdapter, um módulo usado para abrir e fechar posições alavancadas na Aave v3 por meio de carteiras Safe, enquanto os contratos próprios da Aave não foram afetados.
Os contratos inteligentes principais da Aave v3 não foram afetados. A SlowMist disse que o atacante comprometeu duas carteiras multisig Safe por meio de uma falha no terceiro-party FlashLoopAdapter, ignorando sua verificação de autenticação para drenar cerca de 114,09 ETH, ou aproximadamente US$ 305.000. O fundador da Aave, Stani Kulechov, confirmou que o incidente envolveu infraestrutura externa construída sobre a Aave, e não o próprio protocolo.
Exploit de Adaptador Aave de Terceiros Drena 114 ETH dos Safes
BitcoinWorld
Exploit de adaptador Aave de terceiros drena 114 ETH dos Safes
Um atacante drenou cerca de 114,09 ETH — no valor aproximado de US$ 305.000 — de duas carteiras multisig Safe em 2 de outubro ao explorar uma falha de controle de acesso em um adaptador de terceiros construído sobre a Aave v3, segundo o Cryptoslate. A empresa de segurança blockchain SlowMist rastreou a perda até o FlashLoopAdapter, um módulo usado para abrir e fechar posições alavancadas na Aave v3 por meio de carteiras Safe, enquanto os contratos próprios da Aave não foram afetados.
Os contratos inteligentes principais da Aave v3 não foram afetados. A SlowMist disse que o atacante comprometeu duas carteiras multisig Safe por meio de uma falha no terceiro-party FlashLoopAdapter, ignorando sua verificação de autenticação para drenar cerca de 114,09 ETH, ou aproximadamente US$ 305.000. O fundador da Aave, Stani Kulechov, confirmou que o incidente envolveu infraestrutura externa construída sobre a Aave, e não o próprio protocolo.
Exploit de adaptador Aave de terceiros drena 114 ETH dos Safes
Um atacante drenou cerca de 114,09 ETH — no valor aproximado de US$ 305.000 — de duas carteiras multisig Safe em 2 de outubro ao explorar uma falha de controle de acesso em um adaptador de terceiros construído sobre a Aave v3, segundo o Cryptoslate. A empresa de segurança blockchain SlowMist rastreou a perda até o FlashLoopAdapter, um módulo usado para abrir e fechar posições alavancadas na Aave v3 por meio de carteiras Safe, enquanto os contratos próprios da Aave não foram afetados.
Os contratos inteligentes principais da Aave v3 não foram afetados. A SlowMist disse que o atacante comprometeu duas carteiras multisig Safe por meio de uma falha no terceiro-party FlashLoopAdapter, ignorando sua verificação de autenticação para drenar cerca de 114,09 ETH, ou aproximadamente US$ 305.000. O fundador da Aave, Stani Kulechov, confirmou que o incidente envolveu infraestrutura externa construída sobre a Aave, e não o próprio protocolo.
441
·
--
Artigo
Evernorth Vence Voto de Acionistas para Estreia na Nasdaq com 473M de XRPBitcoinWorld
Evernorth Vence Voto de Acionistas para Estreia na Nasdaq com 473M de XRP
O plano da Evernoth para listar na Nasdaq deu seu passo principal final esta semana, à medida que os acionistas da empresa de aquisição de “blank-check” Armada Acquisition Corp. II aprovaram sua proposta de combinação de negócios, informou a Cointelegraph. A votação remove o último obstáculo antes do fechamento esperado do acordo em 7 de outubro, com as ações devendo começar a ser negociadas no dia seguinte sob o ticker XRPN, sujeitas às condições restantes para o fechamento.
A fusão da Evernorth com a Armada Acquisition Corp. II recebeu aprovação dos acionistas, abrindo caminho para a empresa combinada negociar na Nasdaq sob o ticker XRPN. O acordo deve ser fechado em 7 de outubro, e a Evernorth espera manter cerca de 473 milhões de XRP — um tesouro avaliado em cerca de US$ 710 milhões a preços atuais. Fatos principais
Evernorth Vence Voto de Acionistas para Estreia na Nasdaq com 473M de XRP
BitcoinWorld
Evernorth Vence Voto de Acionistas para Estreia na Nasdaq com 473M de XRP
O plano da Evernoth para listar na Nasdaq deu seu passo principal final esta semana, à medida que os acionistas da empresa de aquisição de “blank-check” Armada Acquisition Corp. II aprovaram sua proposta de combinação de negócios, informou a Cointelegraph. A votação remove o último obstáculo antes do fechamento esperado do acordo em 7 de outubro, com as ações devendo começar a ser negociadas no dia seguinte sob o ticker XRPN, sujeitas às condições restantes para o fechamento.
A fusão da Evernorth com a Armada Acquisition Corp. II recebeu aprovação dos acionistas, abrindo caminho para a empresa combinada negociar na Nasdaq sob o ticker XRPN. O acordo deve ser fechado em 7 de outubro, e a Evernorth espera manter cerca de 473 milhões de XRP — um tesouro avaliado em cerca de US$ 710 milhões a preços atuais. Fatos principais
Evernorth Vence Voto de Acionistas para Estreia na Nasdaq com 473M de XRP
O plano da Evernoth para listar na Nasdaq deu seu passo principal final esta semana, à medida que os acionistas da empresa de aquisição de “blank-check” Armada Acquisition Corp. II aprovaram sua proposta de combinação de negócios, informou a Cointelegraph. A votação remove o último obstáculo antes do fechamento esperado do acordo em 7 de outubro, com as ações devendo começar a ser negociadas no dia seguinte sob o ticker XRPN, sujeitas às condições restantes para o fechamento.
A fusão da Evernorth com a Armada Acquisition Corp. II recebeu aprovação dos acionistas, abrindo caminho para a empresa combinada negociar na Nasdaq sob o ticker XRPN. O acordo deve ser fechado em 7 de outubro, e a Evernorth espera manter cerca de 473 milhões de XRP — um tesouro avaliado em cerca de US$ 710 milhões a preços atuais. Fatos principais
499
·
--

Artigo
Ethereum testa resistência de US$ 2,8 mil enquanto o RENDER retesta US$ 2BitcoinWorld
Ethereum testa resistência de US$ 2,8 mil enquanto o RENDER retesta US$ 2
O Ethereum está sendo negociado em torno de US$ 2,75 mil, pressionando a zona de resistência de US$ 2,8 mil após manter uma consolidação de várias semanas acima de US$ 2,4 mil, de acordo com uma análise técnica e on-chain publicada pela Cryptopotato. Na mesma semana, um relatório separado da AMBCrypto observa que o token vinculado à IA RENDER voltou ao nível de US$ 2 após uma alta de 35% em setembro — um preço que não conseguiu superar três vezes desde a queda em outubro.
O Ethereum está sendo negociado a cerca de US$ 2,75 mil e testando uma resistência em US$ 2,8 mil, enquanto o Índice de Prêmio da Coinbase ainda permanece negativo em aproximadamente -0,03. O RENDER, acompanhado separadamente pela AMBCrypto, está retomando o teste de US$ 2 após um ganho de 35% em setembro — um nível que falhou em romper três vezes. Principais fatos
Ethereum testa resistência de US$ 2,8 mil enquanto o RENDER retesta US$ 2
BitcoinWorld
Ethereum testa resistência de US$ 2,8 mil enquanto o RENDER retesta US$ 2
O Ethereum está sendo negociado em torno de US$ 2,75 mil, pressionando a zona de resistência de US$ 2,8 mil após manter uma consolidação de várias semanas acima de US$ 2,4 mil, de acordo com uma análise técnica e on-chain publicada pela Cryptopotato. Na mesma semana, um relatório separado da AMBCrypto observa que o token vinculado à IA RENDER voltou ao nível de US$ 2 após uma alta de 35% em setembro — um preço que não conseguiu superar três vezes desde a queda em outubro.
O Ethereum está sendo negociado a cerca de US$ 2,75 mil e testando uma resistência em US$ 2,8 mil, enquanto o Índice de Prêmio da Coinbase ainda permanece negativo em aproximadamente -0,03. O RENDER, acompanhado separadamente pela AMBCrypto, está retomando o teste de US$ 2 após um ganho de 35% em setembro — um nível que falhou em romper três vezes. Principais fatos
Ethereum testa resistência de US$ 2,8 mil enquanto o RENDER retesta US$ 2
O Ethereum está sendo negociado em torno de US$ 2,75 mil, pressionando a zona de resistência de US$ 2,8 mil após manter uma consolidação de várias semanas acima de US$ 2,4 mil, de acordo com uma análise técnica e on-chain publicada pela Cryptopotato. Na mesma semana, um relatório separado da AMBCrypto observa que o token vinculado à IA RENDER voltou ao nível de US$ 2 após uma alta de 35% em setembro — um preço que não conseguiu superar três vezes desde a queda em outubro.
O Ethereum está sendo negociado a cerca de US$ 2,75 mil e testando uma resistência em US$ 2,8 mil, enquanto o Índice de Prêmio da Coinbase ainda permanece negativo em aproximadamente -0,03. O RENDER, acompanhado separadamente pela AMBCrypto, está retomando o teste de US$ 2 após um ganho de 35% em setembro — um nível que falhou em romper três vezes. Principais fatos
340
·
--
Artigo
Porsche encerra projeto Web3 PIONΞERS CIRCLE após quase quatro anosBitcoinWorld
Porsche encerra projeto Web3 PIONΞERS CIRCLE após quase quatro anos
A Porsche encerrou seu projeto Web3 e a comunidade PIONΞERS CIRCLE quase quatro anos depois de lançar sua iniciativa de NFTs 911, disse a empresa em uma postagem no X. O anúncio, inicialmente reportado pela Crypto.news em 2 de outubro de 2026, confirma que os NFTs PORSCHΞ 911 existentes permanecerão com seus detentores e continuarão existindo na blockchain mesmo enquanto a infraestrutura oficial ao redor deles é descontinuada.
A Porsche anunciou em 1º de outubro de 2026 que está encerrando seu projeto Web3 e a comunidade PIONΞERS CIRCLE quase quatro anos após lançar sua coleção de NFTs 911. Os NFTs PORSCHΞ 911 permanecerão nas carteiras onchain dos detentores, enquanto o servidor do Discord se tornará um arquivo somente leitura e a conta X @eth_porsche não será mais atualizada ativamente. Fatos principais
Porsche encerra projeto Web3 PIONΞERS CIRCLE após quase quatro anos
BitcoinWorld
Porsche encerra projeto Web3 PIONΞERS CIRCLE após quase quatro anos
A Porsche encerrou seu projeto Web3 e a comunidade PIONΞERS CIRCLE quase quatro anos depois de lançar sua iniciativa de NFTs 911, disse a empresa em uma postagem no X. O anúncio, inicialmente reportado pela Crypto.news em 2 de outubro de 2026, confirma que os NFTs PORSCHΞ 911 existentes permanecerão com seus detentores e continuarão existindo na blockchain mesmo enquanto a infraestrutura oficial ao redor deles é descontinuada.
A Porsche anunciou em 1º de outubro de 2026 que está encerrando seu projeto Web3 e a comunidade PIONΞERS CIRCLE quase quatro anos após lançar sua coleção de NFTs 911. Os NFTs PORSCHΞ 911 permanecerão nas carteiras onchain dos detentores, enquanto o servidor do Discord se tornará um arquivo somente leitura e a conta X @eth_porsche não será mais atualizada ativamente. Fatos principais
Porsche encerra projeto Web3 PIONΞERS CIRCLE após quase quatro anos
A Porsche encerrou seu projeto Web3 e a comunidade PIONΞERS CIRCLE quase quatro anos depois de lançar sua iniciativa de NFTs 911, disse a empresa em uma postagem no X. O anúncio, inicialmente reportado pela Crypto.news em 2 de outubro de 2026, confirma que os NFTs PORSCHΞ 911 existentes permanecerão com seus detentores e continuarão existindo na blockchain mesmo enquanto a infraestrutura oficial ao redor deles é descontinuada.
A Porsche anunciou em 1º de outubro de 2026 que está encerrando seu projeto Web3 e a comunidade PIONΞERS CIRCLE quase quatro anos após lançar sua coleção de NFTs 911. Os NFTs PORSCHΞ 911 permanecerão nas carteiras onchain dos detentores, enquanto o servidor do Discord se tornará um arquivo somente leitura e a conta X @eth_porsche não será mais atualizada ativamente. Fatos principais
173
·
--
Artigo
SMBC Nikko e Uniswap assinam MoU para DeFi Gateway no JapãoBitcoinWorld
SMBC Nikko e Uniswap assinam MoU para DeFi Gateway no Japão
A SMBC Nikko Securities e a desenvolvedora de blockchain Nethermind assinaram um memorando de entendimento com a Uniswap Labs, a Base e a Nyx Foundation em 2 de outubro de 2026, estabelecendo um plano de cinco partes para construir um gateway de finanças descentralizadas focado no Japão. Segundo a Crypto.news, os parceiros pretendem concluir o projeto até meados de 2027, sem produto em funcionamento lançado e sem aprovação pública da Agência de Serviços Financeiros do Japão.
O DeFi Gateway é um projeto de desenvolvimento liderado pela SMBC Nikko Securities e Nethermind em conjunto com a Uniswap Labs, a Base e a Nyx Foundation, com foco na conclusão até meados de 2027. Ele usaria hooks do Uniswap v4 para construir pools de liquidez compatíveis, com controles de combate à lavagem de dinheiro, financiamento ao terrorismo e proteção ao investidor, mas nenhum produto está em funcionamento e a FSA não aprovou um para uso público. Fatos principais
SMBC Nikko e Uniswap assinam MoU para DeFi Gateway no Japão
BitcoinWorld
SMBC Nikko e Uniswap assinam MoU para DeFi Gateway no Japão
A SMBC Nikko Securities e a desenvolvedora de blockchain Nethermind assinaram um memorando de entendimento com a Uniswap Labs, a Base e a Nyx Foundation em 2 de outubro de 2026, estabelecendo um plano de cinco partes para construir um gateway de finanças descentralizadas focado no Japão. Segundo a Crypto.news, os parceiros pretendem concluir o projeto até meados de 2027, sem produto em funcionamento lançado e sem aprovação pública da Agência de Serviços Financeiros do Japão.
O DeFi Gateway é um projeto de desenvolvimento liderado pela SMBC Nikko Securities e Nethermind em conjunto com a Uniswap Labs, a Base e a Nyx Foundation, com foco na conclusão até meados de 2027. Ele usaria hooks do Uniswap v4 para construir pools de liquidez compatíveis, com controles de combate à lavagem de dinheiro, financiamento ao terrorismo e proteção ao investidor, mas nenhum produto está em funcionamento e a FSA não aprovou um para uso público. Fatos principais
SMBC Nikko e Uniswap assinam MoU para DeFi Gateway no Japão
A SMBC Nikko Securities e a desenvolvedora de blockchain Nethermind assinaram um memorando de entendimento com a Uniswap Labs, a Base e a Nyx Foundation em 2 de outubro de 2026, estabelecendo um plano de cinco partes para construir um gateway de finanças descentralizadas focado no Japão. Segundo a Crypto.news, os parceiros pretendem concluir o projeto até meados de 2027, sem produto em funcionamento lançado e sem aprovação pública da Agência de Serviços Financeiros do Japão.
O DeFi Gateway é um projeto de desenvolvimento liderado pela SMBC Nikko Securities e Nethermind em conjunto com a Uniswap Labs, a Base e a Nyx Foundation, com foco na conclusão até meados de 2027. Ele usaria hooks do Uniswap v4 para construir pools de liquidez compatíveis, com controles de combate à lavagem de dinheiro, financiamento ao terrorismo e proteção ao investidor, mas nenhum produto está em funcionamento e a FSA não aprovou um para uso público. Fatos principais
166
·
--
Artigo
Fiserv vai ao ar com a Roughrider Coin na SolanaBitcoinWorld
Fiserv vai ao ar com a Roughrider Coin na Solana
A Fiserv disse em 1º de outubro de 2026 que sua plataforma de ativos digitais já está no ar, e a primeira carga de produção é a Roughrider Coin — uma stablecoin lastreada em dólar criada para o Bank of North Dakota, que processa as transações na Solana. Segundo a Bitcoinist, a implantação coloca uma blockchain pública dentro de um produto de pagamentos interbancários regulamentado, em vez de outro aplicativo cripto voltado ao varejo.
A plataforma de ativos digitais da Fiserv está em funcionamento em 1º de outubro de 2026, com a Roughrider Coin do Bank of North Dakota como o primeiro caso de uso em produção. A VersaBank USA emite o token, a Fireblocks fornece carteiras e tokenização, e a Solana processa as transações subjacentes para bancos e cooperativas de crédito de Dakota do Norte participantes. Fatos principais
Fiserv vai ao ar com a Roughrider Coin na Solana
BitcoinWorld
Fiserv vai ao ar com a Roughrider Coin na Solana
A Fiserv disse em 1º de outubro de 2026 que sua plataforma de ativos digitais já está no ar, e a primeira carga de produção é a Roughrider Coin — uma stablecoin lastreada em dólar criada para o Bank of North Dakota, que processa as transações na Solana. Segundo a Bitcoinist, a implantação coloca uma blockchain pública dentro de um produto de pagamentos interbancários regulamentado, em vez de outro aplicativo cripto voltado ao varejo.
A plataforma de ativos digitais da Fiserv está em funcionamento em 1º de outubro de 2026, com a Roughrider Coin do Bank of North Dakota como o primeiro caso de uso em produção. A VersaBank USA emite o token, a Fireblocks fornece carteiras e tokenização, e a Solana processa as transações subjacentes para bancos e cooperativas de crédito de Dakota do Norte participantes. Fatos principais
Fiserv vai ao ar com a Roughrider Coin na Solana
A Fiserv disse em 1º de outubro de 2026 que sua plataforma de ativos digitais já está no ar, e a primeira carga de produção é a Roughrider Coin — uma stablecoin lastreada em dólar criada para o Bank of North Dakota, que processa as transações na Solana. Segundo a Bitcoinist, a implantação coloca uma blockchain pública dentro de um produto de pagamentos interbancários regulamentado, em vez de outro aplicativo cripto voltado ao varejo.
A plataforma de ativos digitais da Fiserv está em funcionamento em 1º de outubro de 2026, com a Roughrider Coin do Bank of North Dakota como o primeiro caso de uso em produção. A VersaBank USA emite o token, a Fireblocks fornece carteiras e tokenização, e a Solana processa as transações subjacentes para bancos e cooperativas de crédito de Dakota do Norte participantes. Fatos principais
2
357
·
--
Bitget Reconstrói Fundo de Proteção de US$ 300M Após Violação de US$ 388MBitcoinWorldBitget reconstrói fundo de proteção de US$ 300 milhões após violação de US$ 388 milhões
De acordo com a Cryptoslate, a Bitget restaurou seu Fundo de Proteção para mais de US$ 300 milhões em 30 de setembro de 2026, absorvendo o impacto de US$ 388 milhões de uma violação de segurança em 24 de setembro. A exchange diz que o fundo é separado das reservas dos clientes e que os saldos dos clientes permaneceram precisos, mas os usuários ainda enfrentam cronogramas de saque em etapas e um processo de reivindicações que a Bitget controla.
A Bitget afirma que seu Fundo de Proteção voltou a ficar acima de US$ 300 milhões depois de absorver US$ 388 milhões da violação de 24 de setembro. O fundo é separado das reservas dos clientes, e as solicitações que se qualificam continuam sujeitas à avaliação da Bitget. Os saques de USDT estão abertos em quatro redes, enquanto os demais serviços de cripto, fiat e P2P miram 2 de outubro às 08:00 UTC.
Bitget Reconstrói Fundo de Proteção de US$ 300M Após Violação de US$ 388M
BitcoinWorldBitget reconstrói fundo de proteção de US$ 300 milhões após violação de US$ 388 milhões
De acordo com a Cryptoslate, a Bitget restaurou seu Fundo de Proteção para mais de US$ 300 milhões em 30 de setembro de 2026, absorvendo o impacto de US$ 388 milhões de uma violação de segurança em 24 de setembro. A exchange diz que o fundo é separado das reservas dos clientes e que os saldos dos clientes permaneceram precisos, mas os usuários ainda enfrentam cronogramas de saque em etapas e um processo de reivindicações que a Bitget controla.
A Bitget afirma que seu Fundo de Proteção voltou a ficar acima de US$ 300 milhões depois de absorver US$ 388 milhões da violação de 24 de setembro. O fundo é separado das reservas dos clientes, e as solicitações que se qualificam continuam sujeitas à avaliação da Bitget. Os saques de USDT estão abertos em quatro redes, enquanto os demais serviços de cripto, fiat e P2P miram 2 de outubro às 08:00 UTC.
De acordo com a Cryptoslate, a Bitget restaurou seu Fundo de Proteção para mais de US$ 300 milhões em 30 de setembro de 2026, absorvendo o impacto de US$ 388 milhões de uma violação de segurança em 24 de setembro. A exchange diz que o fundo é separado das reservas dos clientes e que os saldos dos clientes permaneceram precisos, mas os usuários ainda enfrentam cronogramas de saque em etapas e um processo de reivindicações que a Bitget controla.
A Bitget afirma que seu Fundo de Proteção voltou a ficar acima de US$ 300 milhões depois de absorver US$ 388 milhões da violação de 24 de setembro. O fundo é separado das reservas dos clientes, e as solicitações que se qualificam continuam sujeitas à avaliação da Bitget. Os saques de USDT estão abertos em quatro redes, enquanto os demais serviços de cripto, fiat e P2P miram 2 de outubro às 08:00 UTC.
149
·
--
Artigo
Juiz Deixa Uma Alegação da Celsius Contra a Chainalysis ProsseguirBitcoinWorld
Juíza deixa uma alegação da Celsius contra a Chainalysis prosseguir
Uma juíza federal dos EUA rejeitou 15 alegações que o administrador jurídico do processo da Celsius Network apresentou contra a empresa de análise de blockchain Chainalysis, mas deixou uma sobreviver: uma acusação de que a empresa ajudou insiders da Celsius a violarem seus deveres fiduciários. A juíza distrital dos EUA Margaret Garnett negou o pedido da Chainalysis para descartar essa alegação de auxílio e cumplicidade em uma decisão emitida na terça-feira, segundo a Cointelegraph.
A juíza Margaret Garnett rejeitou 15 alegações contra a Chainalysis, mas permitiu que uma acusação de auxílio e cumplicidade prosseguisse, concluindo que a queixa alega de forma adequada que a Chainalysis sabia que um comunicado de imprensa da Celsius de 2020 continha declarações falsas e ajudou a divulgá-las. Doze alegações foram rejeitadas com prejuízo; três alegações de proteção ao consumidor ainda podem ser alteradas até 20 de outubro.
Juiz Deixa Uma Alegação da Celsius Contra a Chainalysis Prosseguir
BitcoinWorld
Juíza deixa uma alegação da Celsius contra a Chainalysis prosseguir
Uma juíza federal dos EUA rejeitou 15 alegações que o administrador jurídico do processo da Celsius Network apresentou contra a empresa de análise de blockchain Chainalysis, mas deixou uma sobreviver: uma acusação de que a empresa ajudou insiders da Celsius a violarem seus deveres fiduciários. A juíza distrital dos EUA Margaret Garnett negou o pedido da Chainalysis para descartar essa alegação de auxílio e cumplicidade em uma decisão emitida na terça-feira, segundo a Cointelegraph.
A juíza Margaret Garnett rejeitou 15 alegações contra a Chainalysis, mas permitiu que uma acusação de auxílio e cumplicidade prosseguisse, concluindo que a queixa alega de forma adequada que a Chainalysis sabia que um comunicado de imprensa da Celsius de 2020 continha declarações falsas e ajudou a divulgá-las. Doze alegações foram rejeitadas com prejuízo; três alegações de proteção ao consumidor ainda podem ser alteradas até 20 de outubro.
Juíza deixa uma alegação da Celsius contra a Chainalysis prosseguir
Uma juíza federal dos EUA rejeitou 15 alegações que o administrador jurídico do processo da Celsius Network apresentou contra a empresa de análise de blockchain Chainalysis, mas deixou uma sobreviver: uma acusação de que a empresa ajudou insiders da Celsius a violarem seus deveres fiduciários. A juíza distrital dos EUA Margaret Garnett negou o pedido da Chainalysis para descartar essa alegação de auxílio e cumplicidade em uma decisão emitida na terça-feira, segundo a Cointelegraph.
A juíza Margaret Garnett rejeitou 15 alegações contra a Chainalysis, mas permitiu que uma acusação de auxílio e cumplicidade prosseguisse, concluindo que a queixa alega de forma adequada que a Chainalysis sabia que um comunicado de imprensa da Celsius de 2020 continha declarações falsas e ajudou a divulgá-las. Doze alegações foram rejeitadas com prejuízo; três alegações de proteção ao consumidor ainda podem ser alteradas até 20 de outubro.
2
1
1
236
·
--
O volume de altcoins atinge 4x o do Bitcoin enquanto Doctor Profit sai das altcoinsO Volume de Altcoins em BitcoinWorld atinge 4x o do Bitcoin, enquanto Doctor Profit sai das altcoins
O volume de negociação à vista de altcoins está agora em quatro vezes o nível do Bitcoin, e pelo menos um trader proeminente decidiu que isso é um motivo para sair, e não para comprar. Doctor Profit, um analista acompanhado no X, disse que vendeu ONDO com lucro de 73%, fechou HBAR com um ganho menor e não tem interesse em comprar altcoins enquanto as condições permanecerem tão quentes, de acordo com a Cryptopotato.
O volume de negociação à vista de altcoins agora está quatro vezes maior do que o do Bitcoin, e o trader Doctor Profit vendeu ONDO com lucro de 73%, fechou HBAR e abriu posições vendidas de Bitcoin a US$ 86.200. A capitalização de mercado de altcoins, incluindo Ethereum, acompanhada como Total2, absorveu mais de US$ 371 bilhões em entradas desde junho de 2026, um aumento de 45%.
O volume de altcoins atinge 4x o do Bitcoin enquanto Doctor Profit sai das altcoins
O Volume de Altcoins em BitcoinWorld atinge 4x o do Bitcoin, enquanto Doctor Profit sai das altcoins
O volume de negociação à vista de altcoins está agora em quatro vezes o nível do Bitcoin, e pelo menos um trader proeminente decidiu que isso é um motivo para sair, e não para comprar. Doctor Profit, um analista acompanhado no X, disse que vendeu ONDO com lucro de 73%, fechou HBAR com um ganho menor e não tem interesse em comprar altcoins enquanto as condições permanecerem tão quentes, de acordo com a Cryptopotato.
O volume de negociação à vista de altcoins agora está quatro vezes maior do que o do Bitcoin, e o trader Doctor Profit vendeu ONDO com lucro de 73%, fechou HBAR e abriu posições vendidas de Bitcoin a US$ 86.200. A capitalização de mercado de altcoins, incluindo Ethereum, acompanhada como Total2, absorveu mais de US$ 371 bilhões em entradas desde junho de 2026, um aumento de 45%.
O volume de negociação à vista de altcoins está agora em quatro vezes o nível do Bitcoin, e pelo menos um trader proeminente decidiu que isso é um motivo para sair, e não para comprar. Doctor Profit, um analista acompanhado no X, disse que vendeu ONDO com lucro de 73%, fechou HBAR com um ganho menor e não tem interesse em comprar altcoins enquanto as condições permanecerem tão quentes, de acordo com a Cryptopotato.
O volume de negociação à vista de altcoins agora está quatro vezes maior do que o do Bitcoin, e o trader Doctor Profit vendeu ONDO com lucro de 73%, fechou HBAR e abriu posições vendidas de Bitcoin a US$ 86.200. A capitalização de mercado de altcoins, incluindo Ethereum, acompanhada como Total2, absorveu mais de US$ 371 bilhões em entradas desde junho de 2026, um aumento de 45%.
1
1.1k
Inicia sessão para explorar mais conteúdos
Junta-te a utilizadores de criptomoedas de todo o mundo na Binance Square
⚡️ Obtém informações úteis e recentes sobre criptomoedas.
💬 Com a confiança da maior exchange de criptomoedas do mundo.
👍 Descobre perspetivas reais de criadores verificados.
E-mail/Número de telefone
Tópicos em Tendência
SolanaTokenizedStockVolumeTops$4.4BInSeptember
0 visualizações
1 a discutir
🚨 SOLANA ACABOU DE REGISTRAR US$ 4,4 BILHÕES EM VOLUME DE AÇÕES TOKENIZADAS — EM UM MÊS.
Setembro de 2026 viu o volume de negociação de ações tokenizadas na Solana ultrapassar US$ 4,4 BILHÕES, com DEXs como Raydium e Orca ajudando a impulsionar a atividade.
E isto não é apenas mais um título de volume de memecoin.
Ações tokenizadas estão efetivamente trazendo ações tradicionais para mercados on-chain 24/7 — fracionadas, programáveis e capazes de liquidação com stablecoins.
O quadro geral está ficando mais difícil de ignorar: a oferta de equity tokenizada da Solana recentemente cruzou US$ 620M, enquanto o ecossistema mais amplo de RWA avançou para além de US$ 4,5B.
O $SOL começou como a “cadeia cripto rápida”.
Agora, silenciosamente, ele está competindo para se tornar infraestrutura para mercados de capitais da internet.
US$ 4,4B/mês pode parecer pequeno perto de Wall Street.
Mas e se as ações tokenizadas continuarem a se compor a partir daqui?
A verdadeira questão não é se as ações se movem on-chain — é qual cadeia captura o volume. 👀
#SolanaTokenizedStockVolumeTops$4.4BInSeptember #BitcoinSpotETFsDraw$6.34BInflowsInQ3 #EthereumValidatorExitQueueJumps392% #IMFApprovesElSalvador$138MWithBitcoinWaiver #SECHaltsCryptoETFReviewsAmidFundingLapse
KimHotbae
·1 gostos
·131 visualizações
BitcoinSpotETFsDraw$6.34BInflowsInQ3
7,605 visualizações
114 a discutir
EthereumValidatorExitQueueJumps392%
141,436 visualizações
1,135 a discutir