

BitcoinPierre
440 Publicações

BitcoinPierre
Denunciar
Bloquear Utilizador
0 A seguir
11 Seguidores
42 Gostaram
Publicações
Ver tradução
🔥 BITCOIN $85K SELL WALL IS GONE
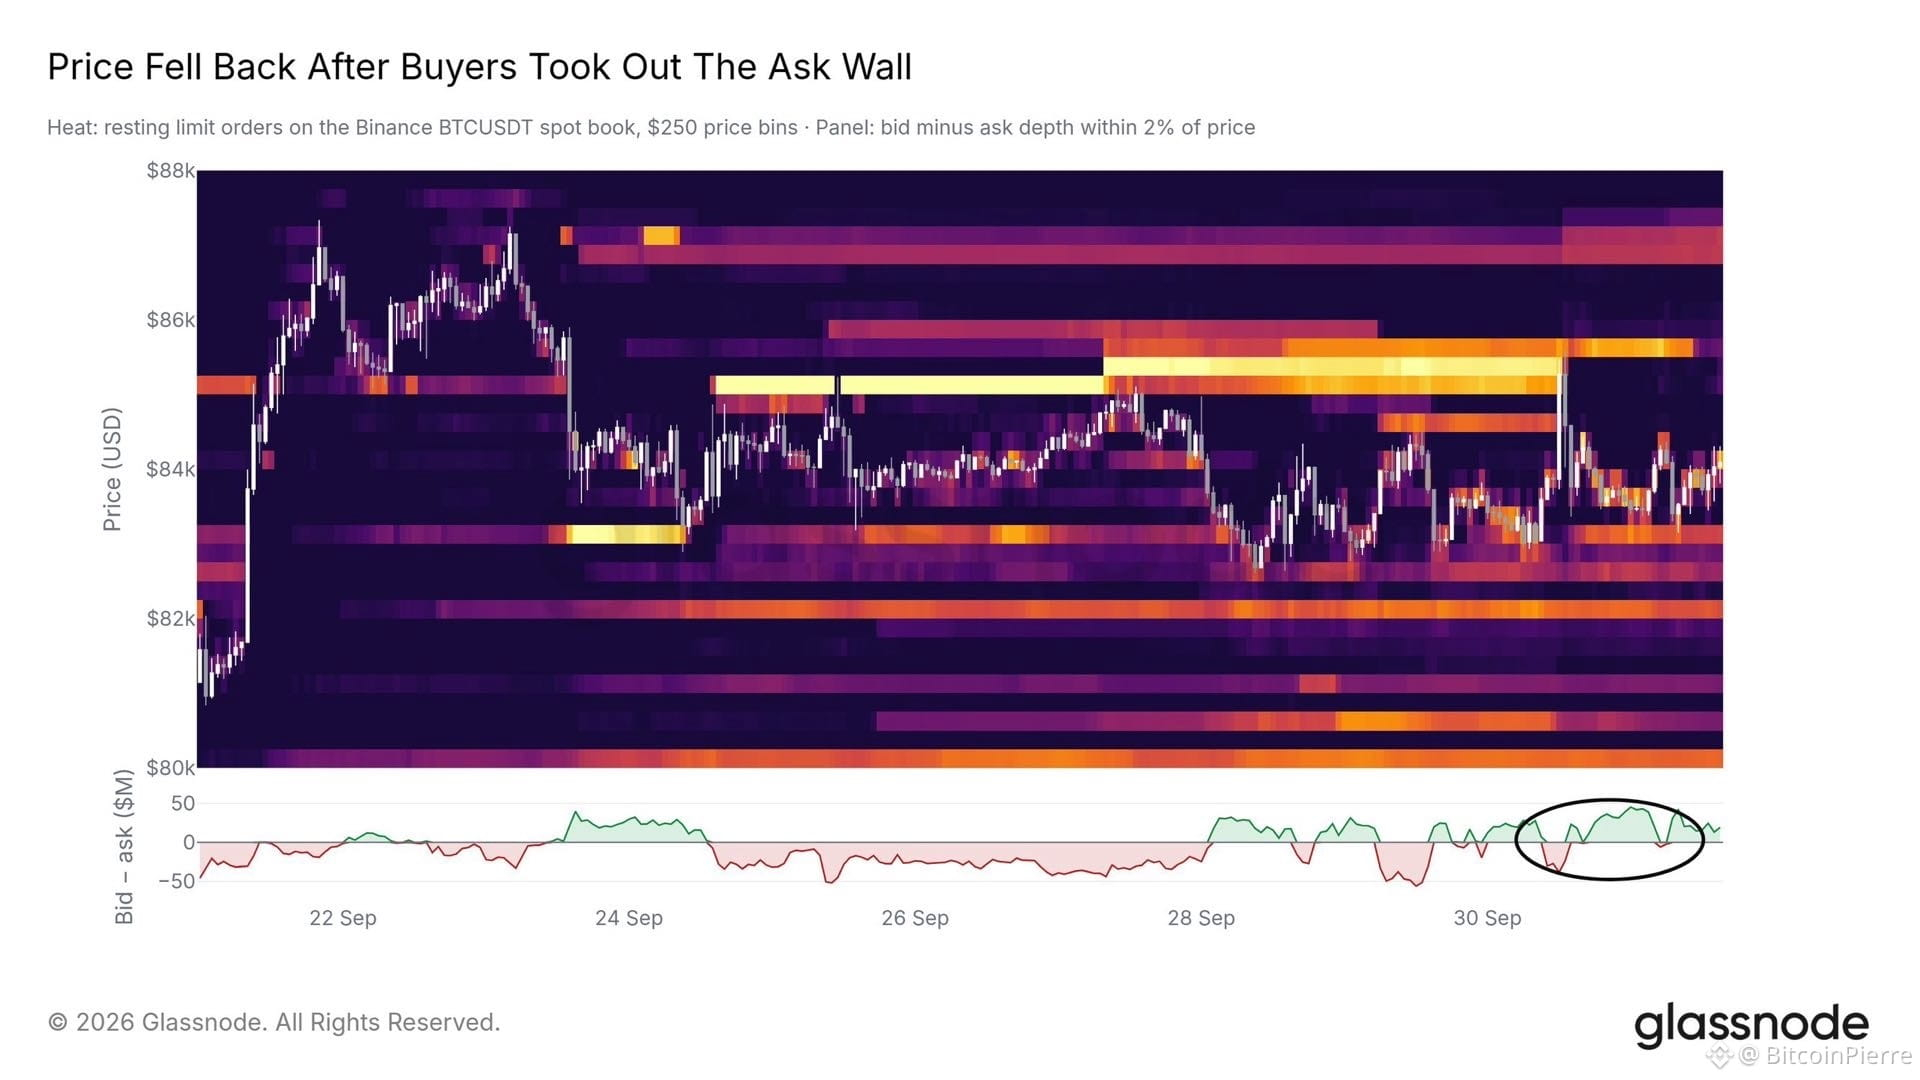
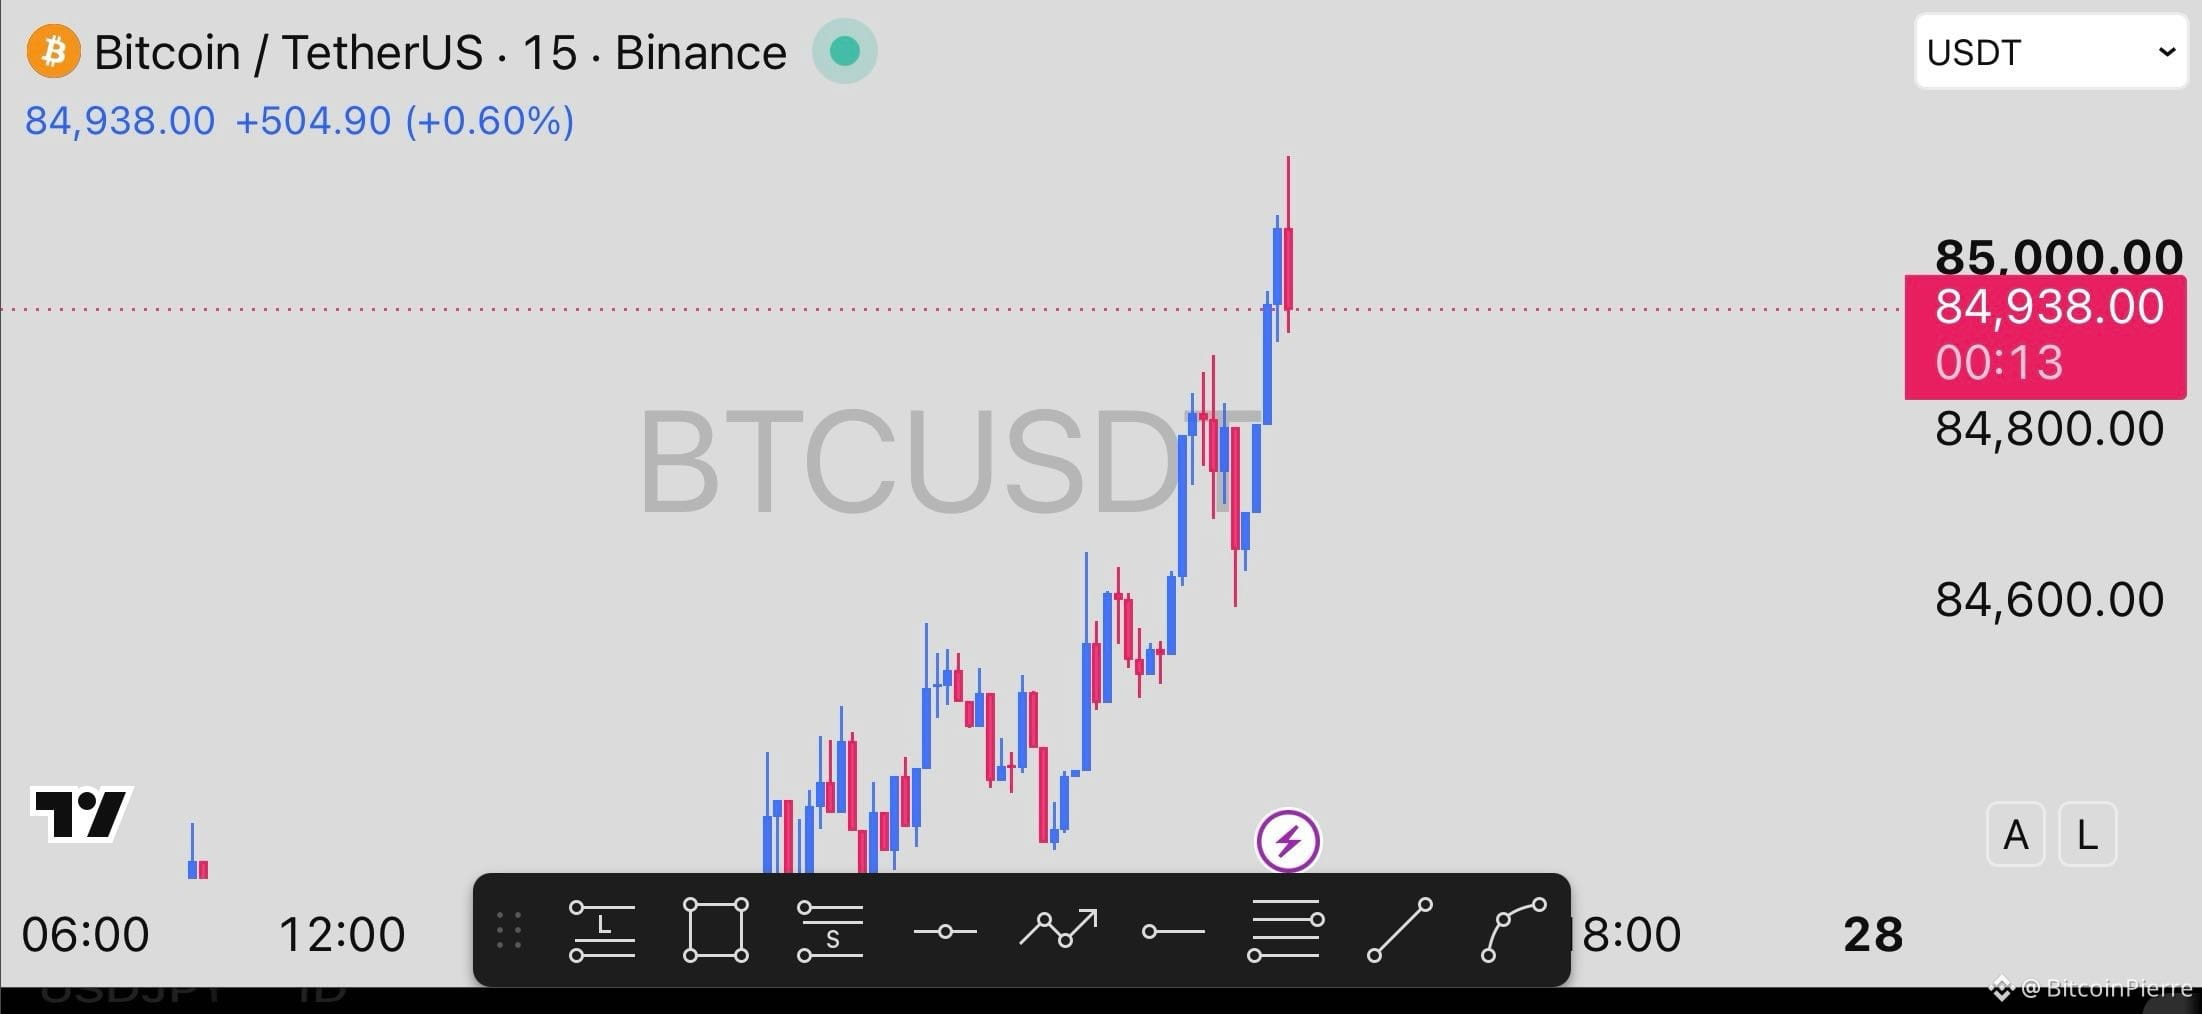
Bitcoin buyers finally absorbed the major $85,000 sell wall yesterday after nearly a week of failed attempts to break through it.
Now, the remaining ask liquidity above BTC appears to have thinned significantly, removing some of the immediate resistance that was sitting above the market.
That matters because when large sell orders disappear, there is less overhead supply for buyers to absorb. If fresh demand continues coming in, BTC can potentially move through the upper levels much faster.
Of course, thin sell side liquidity can work both ways. It can accelerate upside when buyers are active, but it can also make price more volatile if demand suddenly disappears.
The $85K wall has been cleared. Now the market needs to show whether buyers can take advantage of the thinner liquidity above.
#BTC Price Analysis# #BTC Above 60K# $BTC $ETH
🔥 BITCOIN $85K SELL WALL IS GONE
Bitcoin buyers finally absorbed the major $85,000 sell wall yesterday after nearly a week of failed attempts to break through it.
Now, the remaining ask liquidity above BTC appears to have thinned significantly, removing some of the immediate resistance that was sitting above the market.
That matters because when large sell orders disappear, there is less overhead supply for buyers to absorb. If fresh demand continues coming in, BTC can potentially move through the upper levels much faster.
Of course, thin sell side liquidity can work both ways. It can accelerate upside when buyers are active, but it can also make price more volatile if demand suddenly disappears.
The $85K wall has been cleared. Now the market needs to show whether buyers can take advantage of the thinner liquidity above.
#BTC Price Analysis# #BTC Above 60K# $BTC $ETH
Bitcoin buyers finally absorbed the major $85,000 sell wall yesterday after nearly a week of failed attempts to break through it.
Now, the remaining ask liquidity above BTC appears to have thinned significantly, removing some of the immediate resistance that was sitting above the market.
That matters because when large sell orders disappear, there is less overhead supply for buyers to absorb. If fresh demand continues coming in, BTC can potentially move through the upper levels much faster.
Of course, thin sell side liquidity can work both ways. It can accelerate upside when buyers are active, but it can also make price more volatile if demand suddenly disappears.
The $85K wall has been cleared. Now the market needs to show whether buyers can take advantage of the thinner liquidity above.
#BTC Price Analysis# #BTC Above 60K# $BTC $ETH
Ver tradução
🚨 STABLECOINS COULD BE ENTERING A MASSIVE GROWTH PHASE
Bitwise CIO Matt Hougan says stablecoins are going “much, much higher,” and new research from the San Francisco Fed gives the sector another reason to pay attention.
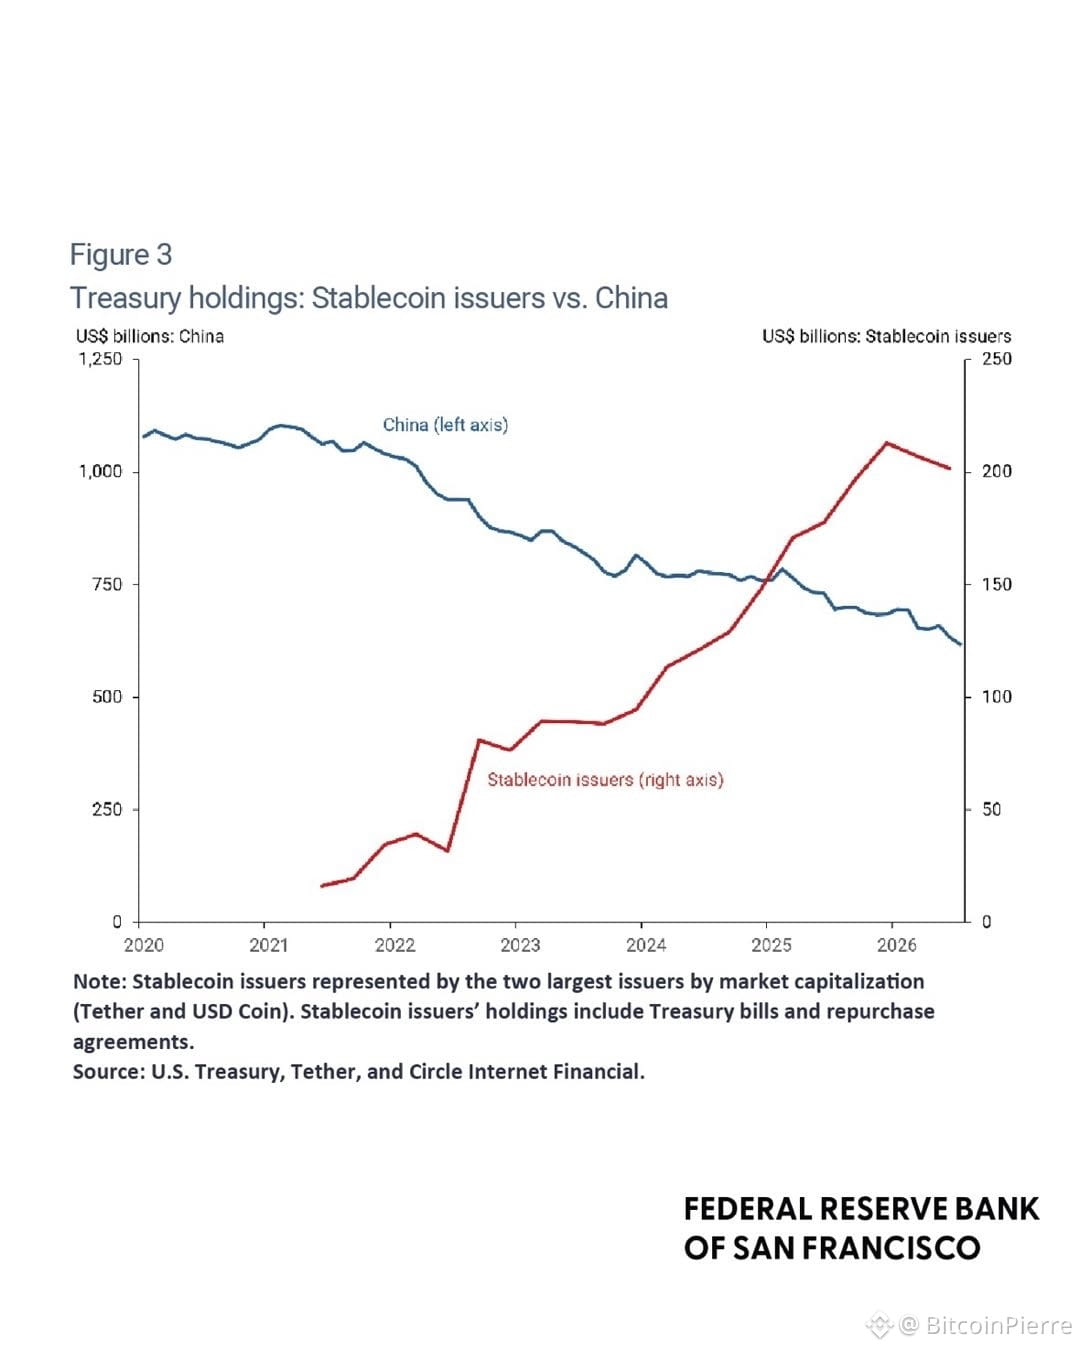
Stablecoin issuers have increased their U.S. Treasury holdings by roughly $200B over the past five years, offsetting more than 40% of the decline in China’s Treasury holdings.
The Fed estimates that if the current trend continues, stablecoin issuers could hold around $400B in short-term Treasuries by 2030.
That means stablecoins aren’t just becoming a bigger part of crypto. They’re increasingly becoming a meaningful source of demand for U.S. government debt.
The stablecoin market may be much bigger than a crypto liquidity story.
#BTC Price Analysis# #Macro Insights# $USDC $BTC
🚨 STABLECOINS COULD BE ENTERING A MASSIVE GROWTH PHASE
Bitwise CIO Matt Hougan says stablecoins are going “much, much higher,” and new research from the San Francisco Fed gives the sector another reason to pay attention.
Stablecoin issuers have increased their U.S. Treasury holdings by roughly $200B over the past five years, offsetting more than 40% of the decline in China’s Treasury holdings.
The Fed estimates that if the current trend continues, stablecoin issuers could hold around $400B in short-term Treasuries by 2030.
That means stablecoins aren’t just becoming a bigger part of crypto. They’re increasingly becoming a meaningful source of demand for U.S. government debt.
The stablecoin market may be much bigger than a crypto liquidity story.
#BTC Price Analysis# #Macro Insights# $USDC $BTC
Bitwise CIO Matt Hougan says stablecoins are going “much, much higher,” and new research from the San Francisco Fed gives the sector another reason to pay attention.
Stablecoin issuers have increased their U.S. Treasury holdings by roughly $200B over the past five years, offsetting more than 40% of the decline in China’s Treasury holdings.
The Fed estimates that if the current trend continues, stablecoin issuers could hold around $400B in short-term Treasuries by 2030.
That means stablecoins aren’t just becoming a bigger part of crypto. They’re increasingly becoming a meaningful source of demand for U.S. government debt.
The stablecoin market may be much bigger than a crypto liquidity story.
#BTC Price Analysis# #Macro Insights# $USDC $BTC

2
🔥 O BITCOIN ACABOU DE TER SEU MELHOR 3º TRIMESTRE DESDE 2017
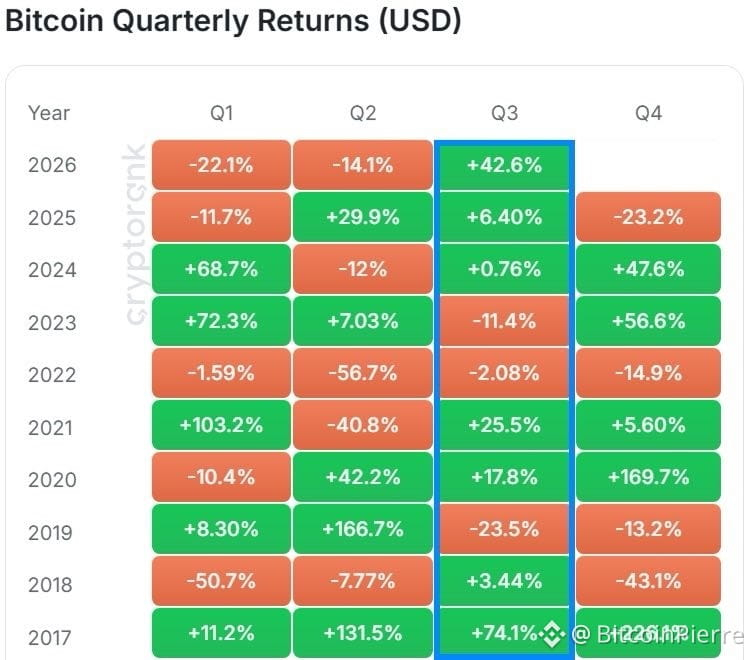
O Bitcoin ganhou cerca de 42,6% no 3º trimestre de 2026, marcando seu melhor desempenho no terceiro trimestre em nove anos.
O que torna o movimento ainda mais notável é o quanto o BTC teve de recuperar. O Bitcoin registrou perdas tanto no 1º quanto no 2º trimestre, colocando uma pressão significativa sobre o mercado antes que a recuperação no terceiro trimestre mudasse o cenário.
O 3º trimestre efetivamente se tornou o trimestre em que o Bitcoin retomou o ritmo, com a alta ajudando a apagar grande parte da fraqueza vista na primeira metade do ano.
Agora o foco muda para o 4º trimestre.
Depois de seu melhor 3º trimestre desde 2017, o Bitcoin consegue levar esse impulso para o último trimestre de 2026?
#AnáliseDePreçoDoBTC# #InsightsDeMacroeconomia# $BTC $ETH
🔥 O BITCOIN ACABOU DE TER SEU MELHOR 3º TRIMESTRE DESDE 2017
O Bitcoin ganhou cerca de 42,6% no 3º trimestre de 2026, marcando seu melhor desempenho no terceiro trimestre em nove anos.
O que torna o movimento ainda mais notável é o quanto o BTC teve de recuperar. O Bitcoin registrou perdas tanto no 1º quanto no 2º trimestre, colocando uma pressão significativa sobre o mercado antes que a recuperação no terceiro trimestre mudasse o cenário.
O 3º trimestre efetivamente se tornou o trimestre em que o Bitcoin retomou o ritmo, com a alta ajudando a apagar grande parte da fraqueza vista na primeira metade do ano.
Agora o foco muda para o 4º trimestre.
Depois de seu melhor 3º trimestre desde 2017, o Bitcoin consegue levar esse impulso para o último trimestre de 2026?
#AnáliseDePreçoDoBTC# #InsightsDeMacroeconomia# $BTC $ETH
O Bitcoin ganhou cerca de 42,6% no 3º trimestre de 2026, marcando seu melhor desempenho no terceiro trimestre em nove anos.
O que torna o movimento ainda mais notável é o quanto o BTC teve de recuperar. O Bitcoin registrou perdas tanto no 1º quanto no 2º trimestre, colocando uma pressão significativa sobre o mercado antes que a recuperação no terceiro trimestre mudasse o cenário.
O 3º trimestre efetivamente se tornou o trimestre em que o Bitcoin retomou o ritmo, com a alta ajudando a apagar grande parte da fraqueza vista na primeira metade do ano.
Agora o foco muda para o 4º trimestre.
Depois de seu melhor 3º trimestre desde 2017, o Bitcoin consegue levar esse impulso para o último trimestre de 2026?
#AnáliseDePreçoDoBTC# #InsightsDeMacroeconomia# $BTC $ETH
73
🔥 O BRASIL ESTÁ COLOCANDO REGISTROS TRADICIONAIS DE FUNDOS NO LIVRO-RAZÃO DA XRP
A operadora de infraestrutura de mercados financeiros do Brasil, a CSD BR, fez parceria com a Ripple para espelhar registros de propriedade de títulos no público XRP Ledger, começando com cotas do fundo de investimento da BTG Pactual.
A parte importante é que isso vai além de um simples teste de blockchain. Os sistemas atuais da CSD BR continuarão sendo o registro oficial de propriedade, enquanto o XRPL fornece uma camada adicional para verificação e auditoria em tempo quase real.
A CSD BR administra mais de 22 trilhões de BRL em ativos registrados, embora todo esse montante não esteja sendo tokenizado no XRPL. A primeira fase é limitada a cotas selecionadas de fundos da BTG Pactual.
Se o primeiro lançamento funcionar, a parceria pretende explorar emissão e negociação nativas de ativos onchain, incluindo recebíveis de imóveis no Brasil e do agronegócio.
A infraestrutura financeira tradicional está começando a usar blockchains públicas como parte do sistema real, e não apenas como prova de conceito.
#Análise de Preço do BTC# #Insights de Macro# $XRP $BTC
🔥 O BRASIL ESTÁ COLOCANDO REGISTROS TRADICIONAIS DE FUNDOS NO LIVRO-RAZÃO DA XRP
A operadora de infraestrutura de mercados financeiros do Brasil, a CSD BR, fez parceria com a Ripple para espelhar registros de propriedade de títulos no público XRP Ledger, começando com cotas do fundo de investimento da BTG Pactual.
A parte importante é que isso vai além de um simples teste de blockchain. Os sistemas atuais da CSD BR continuarão sendo o registro oficial de propriedade, enquanto o XRPL fornece uma camada adicional para verificação e auditoria em tempo quase real.
A CSD BR administra mais de 22 trilhões de BRL em ativos registrados, embora todo esse montante não esteja sendo tokenizado no XRPL. A primeira fase é limitada a cotas selecionadas de fundos da BTG Pactual.
Se o primeiro lançamento funcionar, a parceria pretende explorar emissão e negociação nativas de ativos onchain, incluindo recebíveis de imóveis no Brasil e do agronegócio.
A infraestrutura financeira tradicional está começando a usar blockchains públicas como parte do sistema real, e não apenas como prova de conceito.
#Análise de Preço do BTC# #Insights de Macro# $XRP $BTC
A operadora de infraestrutura de mercados financeiros do Brasil, a CSD BR, fez parceria com a Ripple para espelhar registros de propriedade de títulos no público XRP Ledger, começando com cotas do fundo de investimento da BTG Pactual.
A parte importante é que isso vai além de um simples teste de blockchain. Os sistemas atuais da CSD BR continuarão sendo o registro oficial de propriedade, enquanto o XRPL fornece uma camada adicional para verificação e auditoria em tempo quase real.
A CSD BR administra mais de 22 trilhões de BRL em ativos registrados, embora todo esse montante não esteja sendo tokenizado no XRPL. A primeira fase é limitada a cotas selecionadas de fundos da BTG Pactual.
Se o primeiro lançamento funcionar, a parceria pretende explorar emissão e negociação nativas de ativos onchain, incluindo recebíveis de imóveis no Brasil e do agronegócio.
A infraestrutura financeira tradicional está começando a usar blockchains públicas como parte do sistema real, e não apenas como prova de conceito.
#Análise de Preço do BTC# #Insights de Macro# $XRP $BTC
52
O ETF da Bitwise de NEAR ($NRR) está oficialmente sendo negociado hoje na NYSE Arca, oferecendo a investidores dos EUA exposição direta à vista (spot) do NEAR por meio de um produto negociado em bolsa tradicional.
O que torna esse lançamento mais interessante é o componente de staking. A Bitwise planeja fazer staking das participações em NEAR do fundo internamente, com as recompensas de staking sendo acumuladas aos acionistas por meio do NAV do fundo. O ETF tem uma taxa de administração de 0,75%.
Isso adiciona NEAR à lista crescente de ativos cripto que passam a ter acesso à infraestrutura de ETFs nos EUA além de Bitcoin e Ethereum.
Exposição à vista + staking em um único produto. Agora o mercado verá quanta demanda os investidores dos EUA têm por NEAR.
#BTC Price Analysis# #Macro Insights# $NEAR $BTC
O ETF da Bitwise de NEAR ($NRR) está oficialmente sendo negociado hoje na NYSE Arca, oferecendo a investidores dos EUA exposição direta à vista (spot) do NEAR por meio de um produto negociado em bolsa tradicional.
O que torna esse lançamento mais interessante é o componente de staking. A Bitwise planeja fazer staking das participações em NEAR do fundo internamente, com as recompensas de staking sendo acumuladas aos acionistas por meio do NAV do fundo. O ETF tem uma taxa de administração de 0,75%.
Isso adiciona NEAR à lista crescente de ativos cripto que passam a ter acesso à infraestrutura de ETFs nos EUA além de Bitcoin e Ethereum.
Exposição à vista + staking em um único produto. Agora o mercado verá quanta demanda os investidores dos EUA têm por NEAR.
#BTC Price Analysis# #Macro Insights# $NEAR $BTC
O que torna esse lançamento mais interessante é o componente de staking. A Bitwise planeja fazer staking das participações em NEAR do fundo internamente, com as recompensas de staking sendo acumuladas aos acionistas por meio do NAV do fundo. O ETF tem uma taxa de administração de 0,75%.
Isso adiciona NEAR à lista crescente de ativos cripto que passam a ter acesso à infraestrutura de ETFs nos EUA além de Bitcoin e Ethereum.
Exposição à vista + staking em um único produto. Agora o mercado verá quanta demanda os investidores dos EUA têm por NEAR.
#BTC Price Analysis# #Macro Insights# $NEAR $BTC
29
🔥 AAVE PODE ESTAR SENDO CONSIDERADA PARA UM TOKEN BURN
O fundador da Aave, Stani Kulechov, diz que um mecanismo de queima de tokens está sendo considerado para o Aavenomics 3.0, potencialmente adicionando uma redução permanente de oferta ao modelo atual de recompra da Aave.
A Aave já usou receita do protocolo para recomprar AAVE, mas esses tokens foram mantidos em vez de serem queimados.
Se o novo modelo avançar, alguns desses tokens recomprados podem passar a ser permanentemente removidos de circulação.
Isso coloca imediatamente as dinâmicas de oferta de AAVE de volta em foco.
Recompras são uma coisa. Recompras + queimas podem mudar a história da tokenomics.
#Análise do Preço do BTC# #Insights do Macro# $AAVE $BTC
🔥 AAVE PODE ESTAR SENDO CONSIDERADA PARA UM TOKEN BURN
O fundador da Aave, Stani Kulechov, diz que um mecanismo de queima de tokens está sendo considerado para o Aavenomics 3.0, potencialmente adicionando uma redução permanente de oferta ao modelo atual de recompra da Aave.
A Aave já usou receita do protocolo para recomprar AAVE, mas esses tokens foram mantidos em vez de serem queimados.
Se o novo modelo avançar, alguns desses tokens recomprados podem passar a ser permanentemente removidos de circulação.
Isso coloca imediatamente as dinâmicas de oferta de AAVE de volta em foco.
Recompras são uma coisa. Recompras + queimas podem mudar a história da tokenomics.
#Análise do Preço do BTC# #Insights do Macro# $AAVE $BTC
O fundador da Aave, Stani Kulechov, diz que um mecanismo de queima de tokens está sendo considerado para o Aavenomics 3.0, potencialmente adicionando uma redução permanente de oferta ao modelo atual de recompra da Aave.
A Aave já usou receita do protocolo para recomprar AAVE, mas esses tokens foram mantidos em vez de serem queimados.
Se o novo modelo avançar, alguns desses tokens recomprados podem passar a ser permanentemente removidos de circulação.
Isso coloca imediatamente as dinâmicas de oferta de AAVE de volta em foco.
Recompras são uma coisa. Recompras + queimas podem mudar a história da tokenomics.
#Análise do Preço do BTC# #Insights do Macro# $AAVE $BTC

45
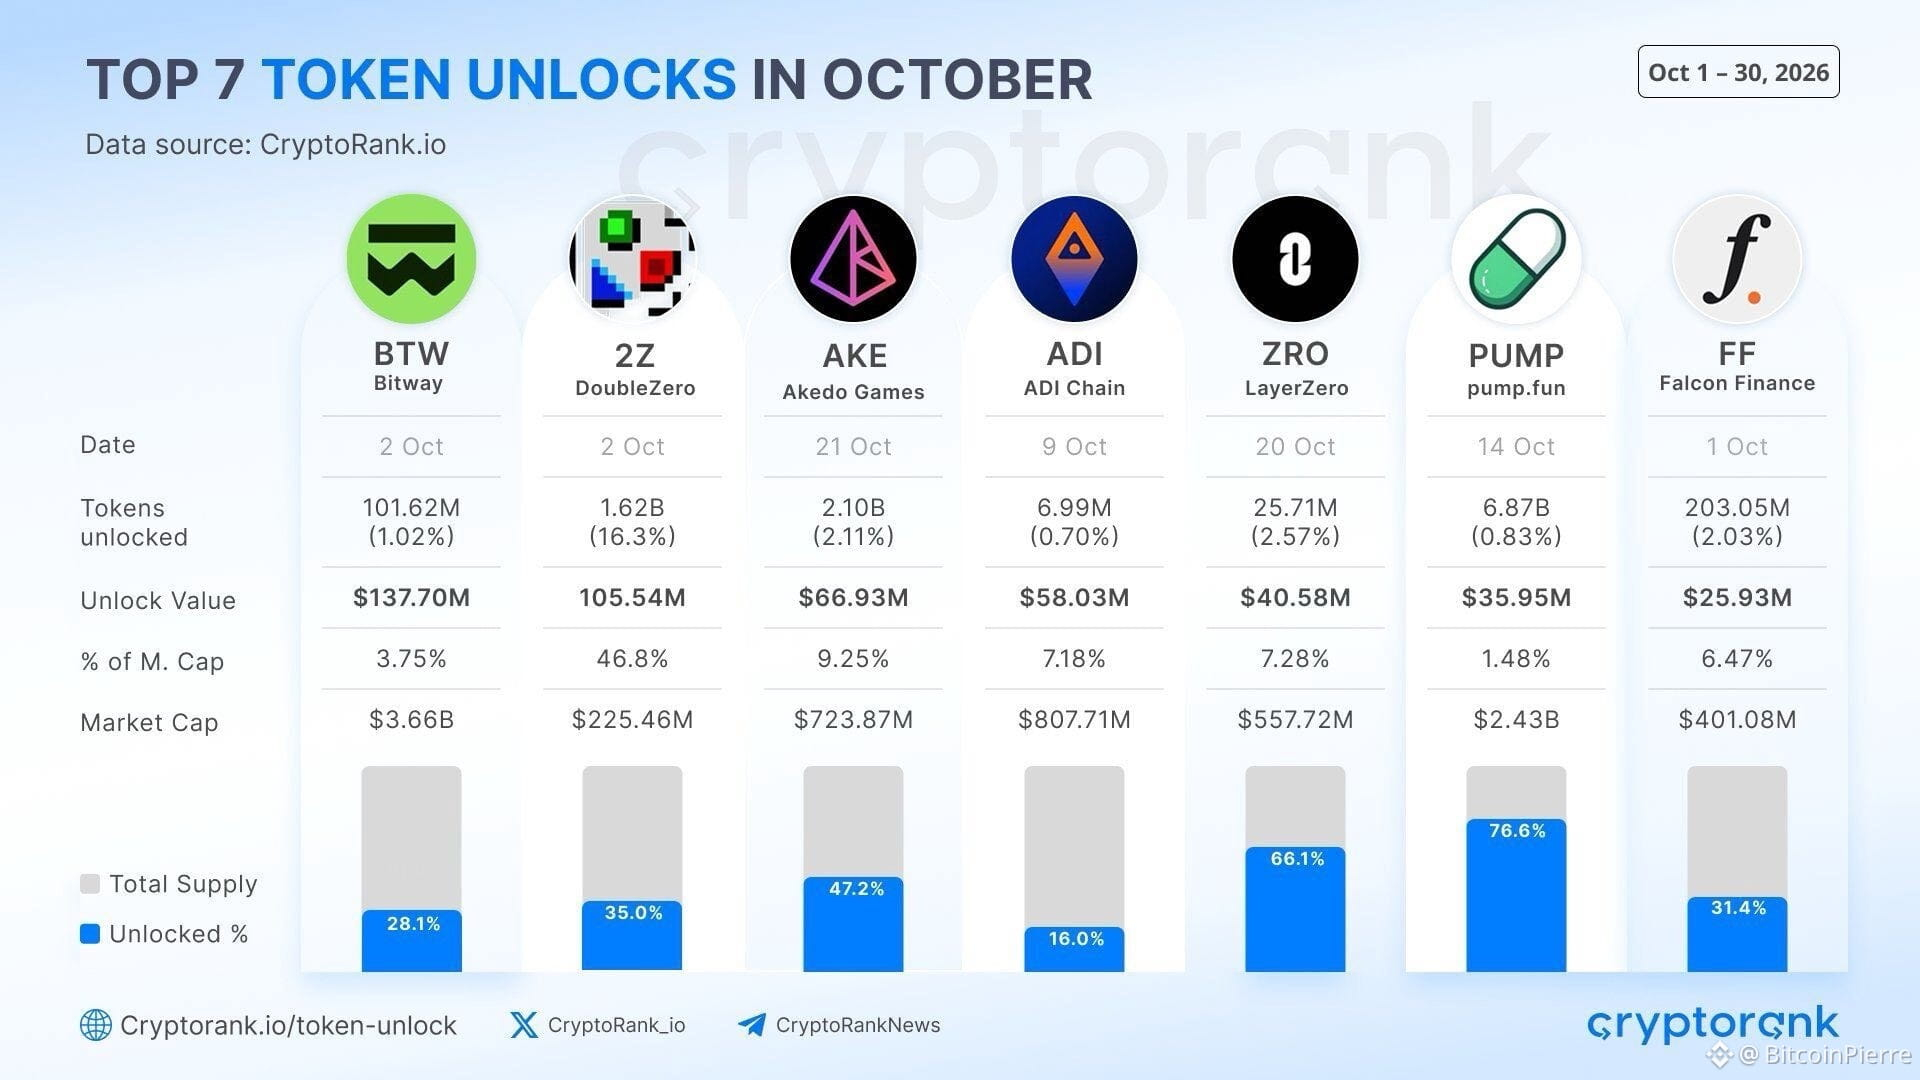
Os sete principais desbloqueios de tokens agendados para outubro valem aproximadamente US$ 470,66 milhões, com BTW liderando em US$ 137,7 milhões.
Outros grandes desbloqueios incluem 2Z em US$ 105,5 milhões, AKE em US$ 66,9 milhões e ADI em US$ 58 milhões.
Os números importam porque tokens recém-desbloqueados podem aumentar a oferta em circulação e gerar pressão adicional de venda se os destinatários decidirem realizar lucros.
Mas um desbloqueio não significa automaticamente um despejo. O impacto real depende de quem recebe os tokens, quanto entra no mercado e se a demanda consegue absorver a nova oferta.
Chegará mais de US$ 470 milhões em oferta. Outubro pode ficar interessante para esses tokens.
#BTC Price Analysis# #Altcoin Season# $AAVE
Os sete principais desbloqueios de tokens agendados para outubro valem aproximadamente US$ 470,66 milhões, com BTW liderando em US$ 137,7 milhões.
Outros grandes desbloqueios incluem 2Z em US$ 105,5 milhões, AKE em US$ 66,9 milhões e ADI em US$ 58 milhões.
Os números importam porque tokens recém-desbloqueados podem aumentar a oferta em circulação e gerar pressão adicional de venda se os destinatários decidirem realizar lucros.
Mas um desbloqueio não significa automaticamente um despejo. O impacto real depende de quem recebe os tokens, quanto entra no mercado e se a demanda consegue absorver a nova oferta.
Chegará mais de US$ 470 milhões em oferta. Outubro pode ficar interessante para esses tokens.
#BTC Price Analysis# #Altcoin Season# $AAVE
Outros grandes desbloqueios incluem 2Z em US$ 105,5 milhões, AKE em US$ 66,9 milhões e ADI em US$ 58 milhões.
Os números importam porque tokens recém-desbloqueados podem aumentar a oferta em circulação e gerar pressão adicional de venda se os destinatários decidirem realizar lucros.
Mas um desbloqueio não significa automaticamente um despejo. O impacto real depende de quem recebe os tokens, quanto entra no mercado e se a demanda consegue absorver a nova oferta.
Chegará mais de US$ 470 milhões em oferta. Outubro pode ficar interessante para esses tokens.
#BTC Price Analysis# #Altcoin Season# $AAVE
120
A Kakao Pay Securities assinou acordos separados com a Ondo Finance e a Dinari para explorar a tokenização de ações sul-coreanas para investidores no exterior.
A ideia é criar um caminho baseado em blockchain para que investidores internacionais ganhem exposição a empresas listadas na Coreia do Sul, com as parcerias analisando custódia, emissão de tokens, resgate e direitos dos acionistas.
Isso ainda é uma exploração, não um lançamento comercial. As empresas primeiro avaliarão os requisitos técnicos e regulatórios antes de decidirem se avançam.
Mas a direção é significativa.
As ações coreanas podem ser o próximo ativo tradicional a se aprofundar nos mercados globais onchain.
#Análise de Preço do BTC# #Insights de Macroeconomia# $ONDO $HBAR
A Kakao Pay Securities assinou acordos separados com a Ondo Finance e a Dinari para explorar a tokenização de ações sul-coreanas para investidores no exterior.
A ideia é criar um caminho baseado em blockchain para que investidores internacionais ganhem exposição a empresas listadas na Coreia do Sul, com as parcerias analisando custódia, emissão de tokens, resgate e direitos dos acionistas.
Isso ainda é uma exploração, não um lançamento comercial. As empresas primeiro avaliarão os requisitos técnicos e regulatórios antes de decidirem se avançam.
Mas a direção é significativa.
As ações coreanas podem ser o próximo ativo tradicional a se aprofundar nos mercados globais onchain.
#Análise de Preço do BTC# #Insights de Macroeconomia# $ONDO $HBAR
A ideia é criar um caminho baseado em blockchain para que investidores internacionais ganhem exposição a empresas listadas na Coreia do Sul, com as parcerias analisando custódia, emissão de tokens, resgate e direitos dos acionistas.
Isso ainda é uma exploração, não um lançamento comercial. As empresas primeiro avaliarão os requisitos técnicos e regulatórios antes de decidirem se avançam.
Mas a direção é significativa.
As ações coreanas podem ser o próximo ativo tradicional a se aprofundar nos mercados globais onchain.
#Análise de Preço do BTC# #Insights de Macroeconomia# $ONDO $HBAR
65
🔥 ACABOU DE SAIR: O LINK ETF DA BITWISE DÁ MAIS UM PASSO À FRENTE
A SEC apresentou um novo formulário regulatório para o Chainlink ETF da Bitwise, vinculado ao LINK .
O fundo, que é negociado sob o ticker CLNK, foi criado para dar aos investidores exposição ao LINK por meio de um produto negociado em bolsa tradicional. As solicitações à SEC confirmam que o fundo está registrado para negociação na NYSE Arca. 
Este é mais um desenvolvimento importante na busca por levar altcoins aos mercados tradicionais de investimentos.
#Análise de Preço do BTC# #Insights do Macro# $LINK $HBAR
🔥 ACABOU DE SAIR: O LINK ETF DA BITWISE DÁ MAIS UM PASSO À FRENTE
A SEC apresentou um novo formulário regulatório para o Chainlink ETF da Bitwise, vinculado ao LINK .
O fundo, que é negociado sob o ticker CLNK, foi criado para dar aos investidores exposição ao LINK por meio de um produto negociado em bolsa tradicional. As solicitações à SEC confirmam que o fundo está registrado para negociação na NYSE Arca. 
Este é mais um desenvolvimento importante na busca por levar altcoins aos mercados tradicionais de investimentos.
#Análise de Preço do BTC# #Insights do Macro# $LINK $HBAR
A SEC apresentou um novo formulário regulatório para o Chainlink ETF da Bitwise, vinculado ao LINK .
O fundo, que é negociado sob o ticker CLNK, foi criado para dar aos investidores exposição ao LINK por meio de um produto negociado em bolsa tradicional. As solicitações à SEC confirmam que o fundo está registrado para negociação na NYSE Arca. 
Este é mais um desenvolvimento importante na busca por levar altcoins aos mercados tradicionais de investimentos.
#Análise de Preço do BTC# #Insights do Macro# $LINK $HBAR
8
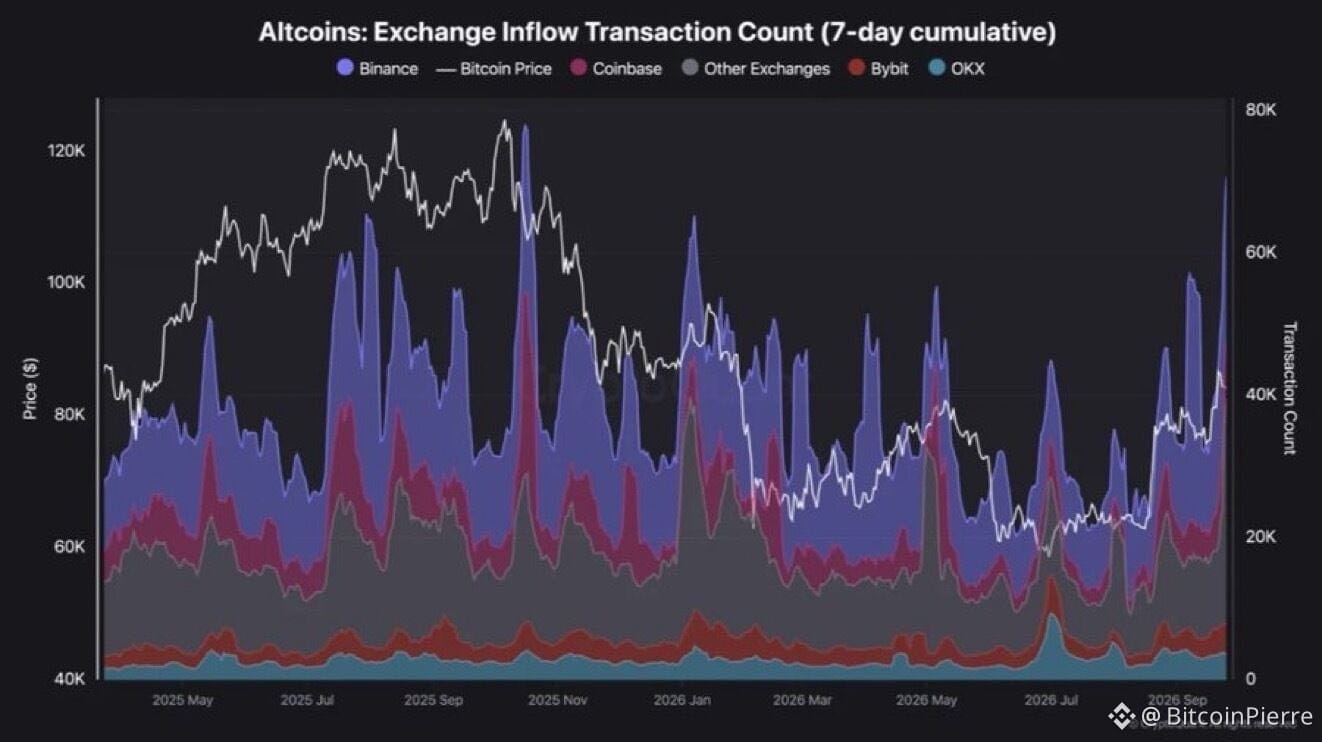
🔥 87% DAS ALTS DA BINANCE TORNARAM-SE BULLISH
O analista da CryptoQuant, Darkfost, diz que 87% das altcoins listadas na Binance agora estão sendo negociadas acima de suas médias móveis de 200 dias, uma grande reversão em relação a agosto, quando cerca de 80% ainda estavam abaixo desse nível.
A recuperação tem sido ampla, com o Total2 adicionando mais de US$ 371B desde junho, mas há um porém.
Darkfost também está vendo sinais iniciais de alerta de euforia em altcoins, incluindo aumento nos depósitos nas exchanges e enfraquecimento dos sinais de momentum. Historicamente, movimentos tão abrangentes podem se tornar difíceis de sustentar.
87% bullish. A alta é real, mas os sinais de alerta também.
#BTC Price Analysis# #Macro Insights# $BTC $ETH
🔥 87% DAS ALTS DA BINANCE TORNARAM-SE BULLISH
O analista da CryptoQuant, Darkfost, diz que 87% das altcoins listadas na Binance agora estão sendo negociadas acima de suas médias móveis de 200 dias, uma grande reversão em relação a agosto, quando cerca de 80% ainda estavam abaixo desse nível.
A recuperação tem sido ampla, com o Total2 adicionando mais de US$ 371B desde junho, mas há um porém.
Darkfost também está vendo sinais iniciais de alerta de euforia em altcoins, incluindo aumento nos depósitos nas exchanges e enfraquecimento dos sinais de momentum. Historicamente, movimentos tão abrangentes podem se tornar difíceis de sustentar.
87% bullish. A alta é real, mas os sinais de alerta também.
#BTC Price Analysis# #Macro Insights# $BTC $ETH
O analista da CryptoQuant, Darkfost, diz que 87% das altcoins listadas na Binance agora estão sendo negociadas acima de suas médias móveis de 200 dias, uma grande reversão em relação a agosto, quando cerca de 80% ainda estavam abaixo desse nível.
A recuperação tem sido ampla, com o Total2 adicionando mais de US$ 371B desde junho, mas há um porém.
Darkfost também está vendo sinais iniciais de alerta de euforia em altcoins, incluindo aumento nos depósitos nas exchanges e enfraquecimento dos sinais de momentum. Historicamente, movimentos tão abrangentes podem se tornar difíceis de sustentar.
87% bullish. A alta é real, mas os sinais de alerta também.
#BTC Price Analysis# #Macro Insights# $BTC $ETH
2
Para usuários que transferem liquidez de Ethereum, BNB Chain ou Base para o TON DeFi, a rota que você escolhe pode mudar o que realmente recebe na outra ponta.
A abordagem tradicional é uma ponte, bloqueio ou queima do ativo de origem e, em seguida, receber um Jetton envolto (wrapped) no TON. Isso pode funcionar, mas adiciona outra camada de exposição a contratos e deixa os usuários gerenciando uma representação envolta.
Existe outro modelo.
A Omniston usa uma arquitetura de troca atômica (atomic swap) baseada em resolvers e HTLCs pareados. Em vez de mover uma versão envolta através de uma ponte, o usuário pode trocar diretamente por um ativo nativo do TON. O resolver bloqueia o ativo de destino, enquanto o ativo do lado de origem é protegido pelo HTLC correspondente.
Essa diferença importa além da arquitetura técnica. Se o objetivo é entrar no TON DeFi e usar o ativo imediatamente, receber o ativo nativo de destino elimina uma etapa extra.
Assim que estiver no TON, os usuários podem acessar swaps, pools de liquidez e outras oportunidades de DeFi, aproveitando os custos de transação geralmente baixos do TON.
Para qualquer pessoa que transfira capital de cadeias EVM para o TON, entender a rota é tão importante quanto fazer a transferência.
Swaps entre cadeias: https://app.ston.fi/swap?mode=cross-chain&in=ton%3AUSD%E2%82%AE
#BTC Price Analysis# #Macro Insights# $GRAM $HBAR
Para usuários que transferem liquidez de Ethereum, BNB Chain ou Base para o TON DeFi, a rota que você escolhe pode mudar o que realmente recebe na outra ponta.
A abordagem tradicional é uma ponte, bloqueio ou queima do ativo de origem e, em seguida, receber um Jetton envolto (wrapped) no TON. Isso pode funcionar, mas adiciona outra camada de exposição a contratos e deixa os usuários gerenciando uma representação envolta.
Existe outro modelo.
A Omniston usa uma arquitetura de troca atômica (atomic swap) baseada em resolvers e HTLCs pareados. Em vez de mover uma versão envolta através de uma ponte, o usuário pode trocar diretamente por um ativo nativo do TON. O resolver bloqueia o ativo de destino, enquanto o ativo do lado de origem é protegido pelo HTLC correspondente.
Essa diferença importa além da arquitetura técnica. Se o objetivo é entrar no TON DeFi e usar o ativo imediatamente, receber o ativo nativo de destino elimina uma etapa extra.
Assim que estiver no TON, os usuários podem acessar swaps, pools de liquidez e outras oportunidades de DeFi, aproveitando os custos de transação geralmente baixos do TON.
Para qualquer pessoa que transfira capital de cadeias EVM para o TON, entender a rota é tão importante quanto fazer a transferência.
Swaps entre cadeias: https://app.ston.fi/swap?mode=cross-chain&in=ton%3AUSD%E2%82%AE
#BTC Price Analysis# #Macro Insights# $GRAM $HBAR
A abordagem tradicional é uma ponte, bloqueio ou queima do ativo de origem e, em seguida, receber um Jetton envolto (wrapped) no TON. Isso pode funcionar, mas adiciona outra camada de exposição a contratos e deixa os usuários gerenciando uma representação envolta.
Existe outro modelo.
A Omniston usa uma arquitetura de troca atômica (atomic swap) baseada em resolvers e HTLCs pareados. Em vez de mover uma versão envolta através de uma ponte, o usuário pode trocar diretamente por um ativo nativo do TON. O resolver bloqueia o ativo de destino, enquanto o ativo do lado de origem é protegido pelo HTLC correspondente.
Essa diferença importa além da arquitetura técnica. Se o objetivo é entrar no TON DeFi e usar o ativo imediatamente, receber o ativo nativo de destino elimina uma etapa extra.
Assim que estiver no TON, os usuários podem acessar swaps, pools de liquidez e outras oportunidades de DeFi, aproveitando os custos de transação geralmente baixos do TON.
Para qualquer pessoa que transfira capital de cadeias EVM para o TON, entender a rota é tão importante quanto fazer a transferência.
Swaps entre cadeias: https://app.ston.fi/swap?mode=cross-chain&in=ton%3AUSD%E2%82%AE
#BTC Price Analysis# #Macro Insights# $GRAM $HBAR
2
🔥 A ESTRATÉGIA ACABOU DE ADICIONAR MAIS 1.666 BTC
Segundo informações, a Strategy comprou 1.666 BTC, elevando suas participações totais em Bitcoin para 847.666 BTC.
A medida ocorre enquanto o Bitcoin continua sendo negociado na faixa das meados de US$ 80 mil, com a Strategy mais uma vez usando a fraqueza do mercado para aumentar sua posição já massiva em BTC.
Com 847.666 BTC, a Strategy agora controla cerca de 4% do fornecimento máximo de 21 milhões de Bitcoin, reforçando sua posição como o maior detentor corporativo de Bitcoin.
A estratégia de acumulação da empresa segue entre as apostas corporativas em cripto mais acompanhadas.
$BTC $ETH #BTC Price Analysis# #Macro Insights#
🔥 A ESTRATÉGIA ACABOU DE ADICIONAR MAIS 1.666 BTC
Segundo informações, a Strategy comprou 1.666 BTC, elevando suas participações totais em Bitcoin para 847.666 BTC.
A medida ocorre enquanto o Bitcoin continua sendo negociado na faixa das meados de US$ 80 mil, com a Strategy mais uma vez usando a fraqueza do mercado para aumentar sua posição já massiva em BTC.
Com 847.666 BTC, a Strategy agora controla cerca de 4% do fornecimento máximo de 21 milhões de Bitcoin, reforçando sua posição como o maior detentor corporativo de Bitcoin.
A estratégia de acumulação da empresa segue entre as apostas corporativas em cripto mais acompanhadas.
$BTC $ETH #BTC Price Analysis# #Macro Insights#
Segundo informações, a Strategy comprou 1.666 BTC, elevando suas participações totais em Bitcoin para 847.666 BTC.
A medida ocorre enquanto o Bitcoin continua sendo negociado na faixa das meados de US$ 80 mil, com a Strategy mais uma vez usando a fraqueza do mercado para aumentar sua posição já massiva em BTC.
Com 847.666 BTC, a Strategy agora controla cerca de 4% do fornecimento máximo de 21 milhões de Bitcoin, reforçando sua posição como o maior detentor corporativo de Bitcoin.
A estratégia de acumulação da empresa segue entre as apostas corporativas em cripto mais acompanhadas.
$BTC $ETH #BTC Price Analysis# #Macro Insights#

31
O trader veterano Peter Brandt diz que os gráficos do XRP, por si só, sempre foram motivos suficientes para ele considerar apostar no token.
O mais recente gráfico de Brandt se concentra na estrutura de longo prazo do preço do XRP, enquanto ele deixa claro que ter interesse no XRP não exige lealdade cega ao ativo.
O XRP também tem atraído atenção de grandes detentores e de ETFs à vista, adicionando mais uma camada ao cenário atual.
#Análise do Preço do BTC# #XRP $XRP $BTC
O trader veterano Peter Brandt diz que os gráficos do XRP, por si só, sempre foram motivos suficientes para ele considerar apostar no token.
O mais recente gráfico de Brandt se concentra na estrutura de longo prazo do preço do XRP, enquanto ele deixa claro que ter interesse no XRP não exige lealdade cega ao ativo.
O XRP também tem atraído atenção de grandes detentores e de ETFs à vista, adicionando mais uma camada ao cenário atual.
#Análise do Preço do BTC# #XRP $XRP $BTC
O mais recente gráfico de Brandt se concentra na estrutura de longo prazo do preço do XRP, enquanto ele deixa claro que ter interesse no XRP não exige lealdade cega ao ativo.
O XRP também tem atraído atenção de grandes detentores e de ETFs à vista, adicionando mais uma camada ao cenário atual.
#Análise do Preço do BTC# #XRP $XRP $BTC

29
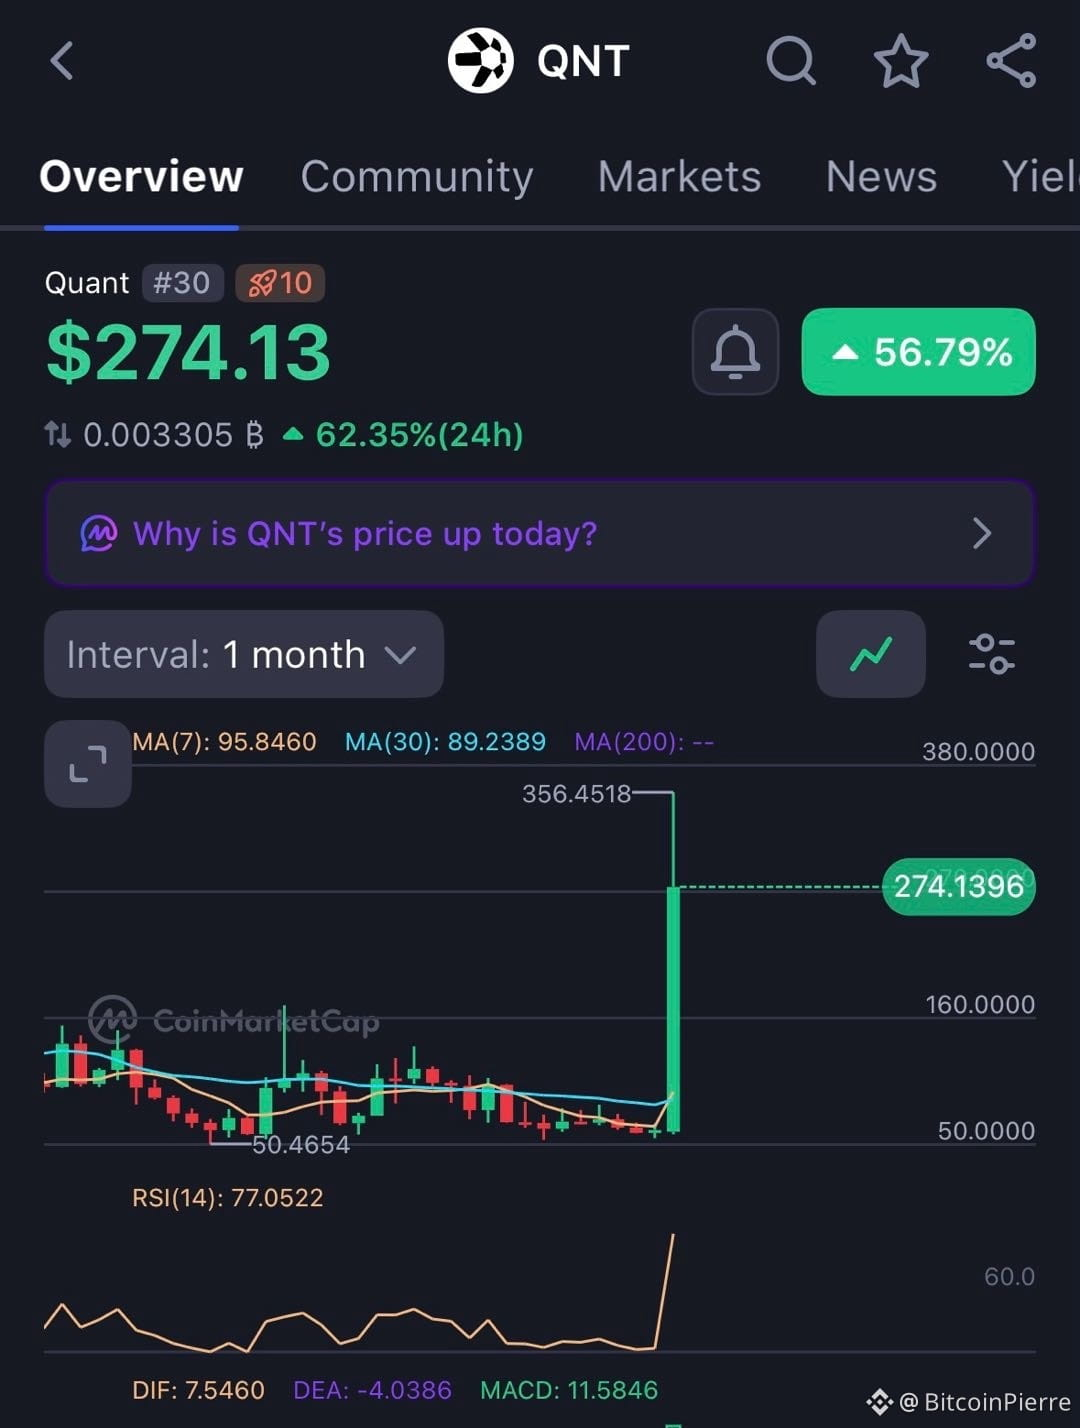
🔥 QNT ESTÁ ABSOLUTAMENTE VOANDO
O QNT da Quant entrou em uma sequência absurda, com o token disparando mais de 300% na última semana e chegando brevemente a ultrapassar US$ 350 hoje.
O movimento vem depois que o The Clearing House selecionou a tecnologia da Quant para sua Iniciativa de Dinheiro On Chain, com foco na liquidação de depósitos tokenizados entre grandes instituições financeiras. Bancos do Reino Unido também concluíram pilotos ao vivo de pagamentos tokenizados em libras usando a plataforma da Quant.
Essa combinação de manchetes sobre grandes infraestruturas financeiras e um impulso explosivo colocou o QNT novamente com força no radar dos traders.
Mas, depois de um movimento tão violento, a volatilidade pode ir para os dois lados.
#Análise de Preço do BTC# #Insights de Macro# $QNT $BTC
🔥 QNT ESTÁ ABSOLUTAMENTE VOANDO
O QNT da Quant entrou em uma sequência absurda, com o token disparando mais de 300% na última semana e chegando brevemente a ultrapassar US$ 350 hoje.
O movimento vem depois que o The Clearing House selecionou a tecnologia da Quant para sua Iniciativa de Dinheiro On Chain, com foco na liquidação de depósitos tokenizados entre grandes instituições financeiras. Bancos do Reino Unido também concluíram pilotos ao vivo de pagamentos tokenizados em libras usando a plataforma da Quant.
Essa combinação de manchetes sobre grandes infraestruturas financeiras e um impulso explosivo colocou o QNT novamente com força no radar dos traders.
Mas, depois de um movimento tão violento, a volatilidade pode ir para os dois lados.
#Análise de Preço do BTC# #Insights de Macro# $QNT $BTC
O QNT da Quant entrou em uma sequência absurda, com o token disparando mais de 300% na última semana e chegando brevemente a ultrapassar US$ 350 hoje.
O movimento vem depois que o The Clearing House selecionou a tecnologia da Quant para sua Iniciativa de Dinheiro On Chain, com foco na liquidação de depósitos tokenizados entre grandes instituições financeiras. Bancos do Reino Unido também concluíram pilotos ao vivo de pagamentos tokenizados em libras usando a plataforma da Quant.
Essa combinação de manchetes sobre grandes infraestruturas financeiras e um impulso explosivo colocou o QNT novamente com força no radar dos traders.
Mas, depois de um movimento tão violento, a volatilidade pode ir para os dois lados.
#Análise de Preço do BTC# #Insights de Macro# $QNT $BTC
57
🚨 O ETHEREUM PODE ESTAR ENTRANDO EM UMA NOVA ERA
Vitalik Buterin diz que Hegotá, a atualização planejada do Ethereum para 2027, pode ser o último “fork” “normal” da rede antes que o desenvolvimento mude para uma arquitetura muito mais pesada em criptografia.
Após Hegotá, o roadmap passa a focar cada vez mais em STARKs recursivos, verificação formal automatizada e criptografia resistente a ameaças quânticas.
O objetivo é maior do que apenas tornar o Ethereum mais rápido. Buterin imagina o Ethereum evoluindo para um “computador mundial criptográfico”, onde os nós podem verificar computações complexas por meio de provas, em vez de terem que reexecutar tudo por conta própria.
O Ethereum já está se preparando para a ameaça quântica, com infraestrutura central de pós-quantum mirando cerca de 2029.
#BTC Price Analysis# #Macro Insights# $ETH $QNT
🚨 O ETHEREUM PODE ESTAR ENTRANDO EM UMA NOVA ERA
Vitalik Buterin diz que Hegotá, a atualização planejada do Ethereum para 2027, pode ser o último “fork” “normal” da rede antes que o desenvolvimento mude para uma arquitetura muito mais pesada em criptografia.
Após Hegotá, o roadmap passa a focar cada vez mais em STARKs recursivos, verificação formal automatizada e criptografia resistente a ameaças quânticas.
O objetivo é maior do que apenas tornar o Ethereum mais rápido. Buterin imagina o Ethereum evoluindo para um “computador mundial criptográfico”, onde os nós podem verificar computações complexas por meio de provas, em vez de terem que reexecutar tudo por conta própria.
O Ethereum já está se preparando para a ameaça quântica, com infraestrutura central de pós-quantum mirando cerca de 2029.
#BTC Price Analysis# #Macro Insights# $ETH $QNT
Vitalik Buterin diz que Hegotá, a atualização planejada do Ethereum para 2027, pode ser o último “fork” “normal” da rede antes que o desenvolvimento mude para uma arquitetura muito mais pesada em criptografia.
Após Hegotá, o roadmap passa a focar cada vez mais em STARKs recursivos, verificação formal automatizada e criptografia resistente a ameaças quânticas.
O objetivo é maior do que apenas tornar o Ethereum mais rápido. Buterin imagina o Ethereum evoluindo para um “computador mundial criptográfico”, onde os nós podem verificar computações complexas por meio de provas, em vez de terem que reexecutar tudo por conta própria.
O Ethereum já está se preparando para a ameaça quântica, com infraestrutura central de pós-quantum mirando cerca de 2029.
#BTC Price Analysis# #Macro Insights# $ETH $QNT

72
🔥 AS ALTCOINS ESTÃO VOANDO ABSOLUTAMENTE
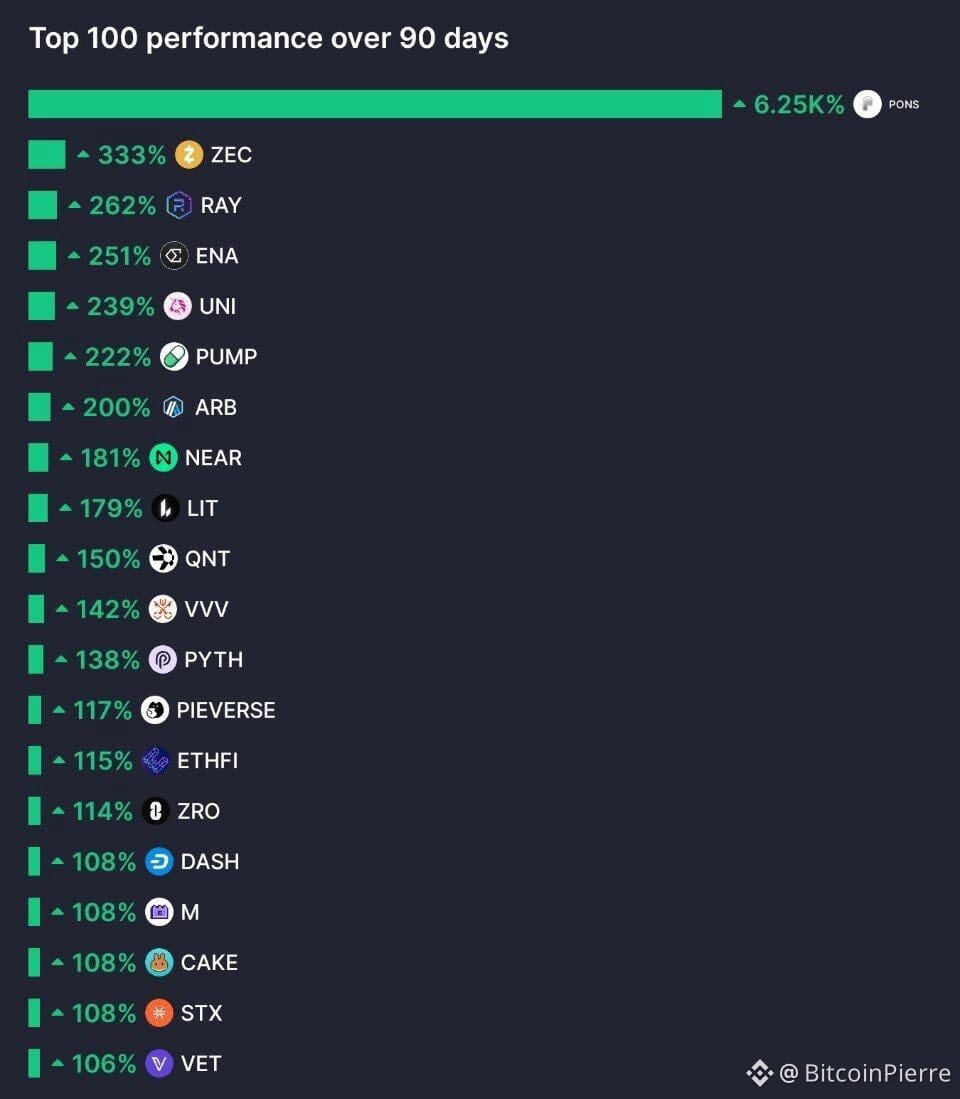
Entre as 100 principais altcoins, apenas 9 estão no vermelho nos últimos 90 dias, enquanto 22 tiveram alta de pelo menos 100%.
Isso é um sinal bem claro de que a força não está limitada apenas a algumas poucas moedas de grande capitalização. Uma parte ampla do mercado de altcoins tem superado o desempenho nos últimos três meses.
Isso também coloca a rotação atual do mercado em perspectiva. O Índice de Altcoin Season da CryptoRank usa as 100 principais alts e considera que é altseason quando pelo menos 75% superam o BTC em 90 dias.
Só 9 no vermelho. 22 com alta de 100%+.
A verdadeira questão agora é se essa amplitude pode continuar ou se os movimentos das altcoins mais fortes estão começando a ficar superaquecidos.
#Análise do Preço do BTC# #Insights Macroeconômicos# $BTC $ZEC
🔥 AS ALTCOINS ESTÃO VOANDO ABSOLUTAMENTE
Entre as 100 principais altcoins, apenas 9 estão no vermelho nos últimos 90 dias, enquanto 22 tiveram alta de pelo menos 100%.
Isso é um sinal bem claro de que a força não está limitada apenas a algumas poucas moedas de grande capitalização. Uma parte ampla do mercado de altcoins tem superado o desempenho nos últimos três meses.
Isso também coloca a rotação atual do mercado em perspectiva. O Índice de Altcoin Season da CryptoRank usa as 100 principais alts e considera que é altseason quando pelo menos 75% superam o BTC em 90 dias.
Só 9 no vermelho. 22 com alta de 100%+.
A verdadeira questão agora é se essa amplitude pode continuar ou se os movimentos das altcoins mais fortes estão começando a ficar superaquecidos.
#Análise do Preço do BTC# #Insights Macroeconômicos# $BTC $ZEC
Entre as 100 principais altcoins, apenas 9 estão no vermelho nos últimos 90 dias, enquanto 22 tiveram alta de pelo menos 100%.
Isso é um sinal bem claro de que a força não está limitada apenas a algumas poucas moedas de grande capitalização. Uma parte ampla do mercado de altcoins tem superado o desempenho nos últimos três meses.
Isso também coloca a rotação atual do mercado em perspectiva. O Índice de Altcoin Season da CryptoRank usa as 100 principais alts e considera que é altseason quando pelo menos 75% superam o BTC em 90 dias.
Só 9 no vermelho. 22 com alta de 100%+.
A verdadeira questão agora é se essa amplitude pode continuar ou se os movimentos das altcoins mais fortes estão começando a ficar superaquecidos.
#Análise do Preço do BTC# #Insights Macroeconômicos# $BTC $ZEC
40
Os utilizadores raramente se importam com qual fornecedor de infraestrutura trata um swap. O que interessa é que a negociação funcione de forma suave dentro da carteira ou da aplicação que eles já usam.
Isso torna a integração da Omniston com o MoonPay Trade um desenvolvimento de infraestrutura importante para a TON.
O MoonPay Trade oferece a programadores e empresas uma API unificada para execução onchain, liquidação, conversão de ativos e pagamentos em mais de 200 cadeias e protocolos. Com a Omniston conectada, seu agregador agora pode acessar negociações de TON intrachain por meio dessa infraestrutura.
Isso significa que parceiros do MoonPay Trade que suportam ativos de TON podem, potencialmente, trazer esses ativos diretamente para suas próprias experiências de negociação, sem precisar construir uma infraestrutura separada de liquidez para TON.
Isso abre um caminho de crescimento diferente para a TON. Em vez de depender apenas de utilizadores que vêm diretamente às aplicações nativas de TON, a sua liquidez pode tornar-se acessível através de carteiras e plataformas que já atendem um público cripto mais amplo.
Para a STON.fi, a integração também aprofunda sua infraestrutura na camada onchain mais ampla.
A parte interessante não é apenas mais uma integração. É o número crescente de lugares onde os utilizadores podem interagir com a TON sem precisar pensar na infraestrutura por baixo.
#Análise de Preço BTC# #Insights Macroeconômicos# $GRAM $ZEC
Os utilizadores raramente se importam com qual fornecedor de infraestrutura trata um swap. O que interessa é que a negociação funcione de forma suave dentro da carteira ou da aplicação que eles já usam.
Isso torna a integração da Omniston com o MoonPay Trade um desenvolvimento de infraestrutura importante para a TON.
O MoonPay Trade oferece a programadores e empresas uma API unificada para execução onchain, liquidação, conversão de ativos e pagamentos em mais de 200 cadeias e protocolos. Com a Omniston conectada, seu agregador agora pode acessar negociações de TON intrachain por meio dessa infraestrutura.
Isso significa que parceiros do MoonPay Trade que suportam ativos de TON podem, potencialmente, trazer esses ativos diretamente para suas próprias experiências de negociação, sem precisar construir uma infraestrutura separada de liquidez para TON.
Isso abre um caminho de crescimento diferente para a TON. Em vez de depender apenas de utilizadores que vêm diretamente às aplicações nativas de TON, a sua liquidez pode tornar-se acessível através de carteiras e plataformas que já atendem um público cripto mais amplo.
Para a STON.fi, a integração também aprofunda sua infraestrutura na camada onchain mais ampla.
A parte interessante não é apenas mais uma integração. É o número crescente de lugares onde os utilizadores podem interagir com a TON sem precisar pensar na infraestrutura por baixo.
#Análise de Preço BTC# #Insights Macroeconômicos# $GRAM $ZEC
Isso torna a integração da Omniston com o MoonPay Trade um desenvolvimento de infraestrutura importante para a TON.
O MoonPay Trade oferece a programadores e empresas uma API unificada para execução onchain, liquidação, conversão de ativos e pagamentos em mais de 200 cadeias e protocolos. Com a Omniston conectada, seu agregador agora pode acessar negociações de TON intrachain por meio dessa infraestrutura.
Isso significa que parceiros do MoonPay Trade que suportam ativos de TON podem, potencialmente, trazer esses ativos diretamente para suas próprias experiências de negociação, sem precisar construir uma infraestrutura separada de liquidez para TON.
Isso abre um caminho de crescimento diferente para a TON. Em vez de depender apenas de utilizadores que vêm diretamente às aplicações nativas de TON, a sua liquidez pode tornar-se acessível através de carteiras e plataformas que já atendem um público cripto mais amplo.
Para a STON.fi, a integração também aprofunda sua infraestrutura na camada onchain mais ampla.
A parte interessante não é apenas mais uma integração. É o número crescente de lugares onde os utilizadores podem interagir com a TON sem precisar pensar na infraestrutura por baixo.
#Análise de Preço BTC# #Insights Macroeconômicos# $GRAM $ZEC
108
Se o BTC fechar acima de US$ 78.300 hoje, isso marcaria um segundo fechamento semanal consecutivo acima da média móvel de 50 semanas.
Isso importa porque a média móvel de 50 semanas historicamente tem atuado como um grande teto durante os mercados de baixa do Bitcoin. A Galaxy Research descreveu uma quebra sustentada acima dela como um forte sinal de que o fundo do ciclo pode estar em formação.
Mas um único indicador não confirma que um mercado de baixa acabou. O ponto-chave é se o BTC consegue continuar sustentando-se acima da média móvel após a ruptura.
Um segundo fechamento semanal seria um sinal técnico importante.
#BTC Price Analysis# #Macro Insights# $BTC $ETH
Se o BTC fechar acima de US$ 78.300 hoje, isso marcaria um segundo fechamento semanal consecutivo acima da média móvel de 50 semanas.
Isso importa porque a média móvel de 50 semanas historicamente tem atuado como um grande teto durante os mercados de baixa do Bitcoin. A Galaxy Research descreveu uma quebra sustentada acima dela como um forte sinal de que o fundo do ciclo pode estar em formação.
Mas um único indicador não confirma que um mercado de baixa acabou. O ponto-chave é se o BTC consegue continuar sustentando-se acima da média móvel após a ruptura.
Um segundo fechamento semanal seria um sinal técnico importante.
#BTC Price Analysis# #Macro Insights# $BTC $ETH
Isso importa porque a média móvel de 50 semanas historicamente tem atuado como um grande teto durante os mercados de baixa do Bitcoin. A Galaxy Research descreveu uma quebra sustentada acima dela como um forte sinal de que o fundo do ciclo pode estar em formação.
Mas um único indicador não confirma que um mercado de baixa acabou. O ponto-chave é se o BTC consegue continuar sustentando-se acima da média móvel após a ruptura.
Um segundo fechamento semanal seria um sinal técnico importante.
#BTC Price Analysis# #Macro Insights# $BTC $ETH
50
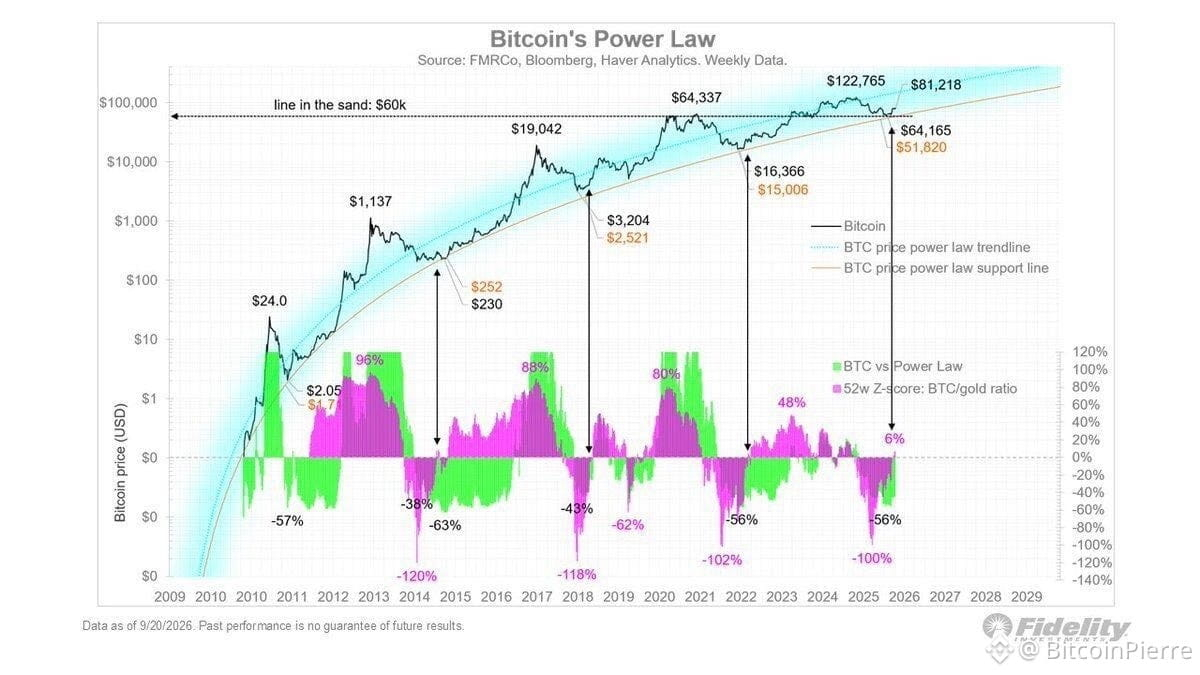
A Fidelity, Jurrien Timmer, diz que o Bitcoin entrou em um novo mercado altista cíclico depois de manter o patamar de US$ 60 mil, que ele considera um suporte-chave de longo prazo.
Agora, o modelo de lei de potência dele aponta para US$ 300 mil até 2029.
A chamada é notável porque Timmer foi bem mais cauteloso no começo deste ano, quando o BTC estava se aproximando da parte inferior do modelo dele.
Agora, ele vê a estrutura do mercado mudando.
É claro, US$ 300 mil é uma meta baseada em modelo, não um resultado garantido. O Bitcoin ainda precisa demonstrar que a recuperação pode se transformar em uma tendência de alta sustentada.
US$ 60 mil mantidos. Timmer diz que o próximo ciclo pode já estar em andamento.
#Análise do Preço do BTC# #BTC Acima de 60K# $BTC $ZEC
A Fidelity, Jurrien Timmer, diz que o Bitcoin entrou em um novo mercado altista cíclico depois de manter o patamar de US$ 60 mil, que ele considera um suporte-chave de longo prazo.
Agora, o modelo de lei de potência dele aponta para US$ 300 mil até 2029.
A chamada é notável porque Timmer foi bem mais cauteloso no começo deste ano, quando o BTC estava se aproximando da parte inferior do modelo dele.
Agora, ele vê a estrutura do mercado mudando.
É claro, US$ 300 mil é uma meta baseada em modelo, não um resultado garantido. O Bitcoin ainda precisa demonstrar que a recuperação pode se transformar em uma tendência de alta sustentada.
US$ 60 mil mantidos. Timmer diz que o próximo ciclo pode já estar em andamento.
#Análise do Preço do BTC# #BTC Acima de 60K# $BTC $ZEC
Agora, o modelo de lei de potência dele aponta para US$ 300 mil até 2029.
A chamada é notável porque Timmer foi bem mais cauteloso no começo deste ano, quando o BTC estava se aproximando da parte inferior do modelo dele.
Agora, ele vê a estrutura do mercado mudando.
É claro, US$ 300 mil é uma meta baseada em modelo, não um resultado garantido. O Bitcoin ainda precisa demonstrar que a recuperação pode se transformar em uma tendência de alta sustentada.
US$ 60 mil mantidos. Timmer diz que o próximo ciclo pode já estar em andamento.
#Análise do Preço do BTC# #BTC Acima de 60K# $BTC $ZEC
58
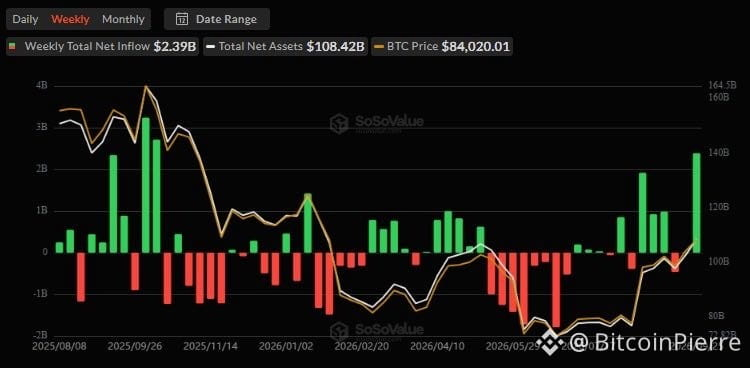
Os ETFs de Bitcoin à vista dos EUA registraram US$ 2,39 bilhões em entradas líquidas na última semana, com o seu melhor desempenho semanal desde outubro de 2025.
Todas as cinco sessões de negociação tiveram fluxos positivos, com quase US$ 1 bilhão entrando nos fundos apenas na segunda-feira.
O que torna isso ainda mais interessante é o quadro mais amplo: as entradas recolocaram os ETFs de Bitcoin em território positivo em 2026, depois de terem ficado cerca de US$ 5,8 bilhões no vermelho no início deste ano.
A demanda institucional está claramente voltando a aumentar.
#BTC Price Analysis# #Macro Insights# $BTC $ETH
Os ETFs de Bitcoin à vista dos EUA registraram US$ 2,39 bilhões em entradas líquidas na última semana, com o seu melhor desempenho semanal desde outubro de 2025.
Todas as cinco sessões de negociação tiveram fluxos positivos, com quase US$ 1 bilhão entrando nos fundos apenas na segunda-feira.
O que torna isso ainda mais interessante é o quadro mais amplo: as entradas recolocaram os ETFs de Bitcoin em território positivo em 2026, depois de terem ficado cerca de US$ 5,8 bilhões no vermelho no início deste ano.
A demanda institucional está claramente voltando a aumentar.
#BTC Price Analysis# #Macro Insights# $BTC $ETH
Todas as cinco sessões de negociação tiveram fluxos positivos, com quase US$ 1 bilhão entrando nos fundos apenas na segunda-feira.
O que torna isso ainda mais interessante é o quadro mais amplo: as entradas recolocaram os ETFs de Bitcoin em território positivo em 2026, depois de terem ficado cerca de US$ 5,8 bilhões no vermelho no início deste ano.
A demanda institucional está claramente voltando a aumentar.
#BTC Price Analysis# #Macro Insights# $BTC $ETH
74
Inicia sessão para explorar mais conteúdos
Junta-te a utilizadores de criptomoedas de todo o mundo na Binance Square
⚡️ Obtém informações úteis e recentes sobre criptomoedas.
💬 Com a confiança da maior exchange de criptomoedas do mundo.
👍 Descobre perspetivas reais de criadores verificados.
E-mail/Número de telefone
Tópicos em Tendência
NFPWatch
10.4M visualizações
16,732 a discutir
Notícias de Cripto | Bitcoin se Aproxima de US$ 85 mil à medida que os Rendimento dos Treasuries Caem antes do Relatório NFP dos EUA
Binance News
·5 gostos
·4.4k visualizações
BitcoinRisesToward$85K
1,910 visualizações
25 a discutir
AmazonPlansToSell$8BNvidiaChips
677 visualizações
28 a discutir