
asiftahsin
2.3k Publicações

asiftahsin
Denunciar
Bloquear Utilizador
Share Crypto Related Market Analysis, Share Crypto Related knowledge for my follower(brother and Sister)
32 A seguir
335 Seguidores
1.3K+ Gostaram
Publicações
Tudo
Cotações
·
--
Artigo
Ver tradução
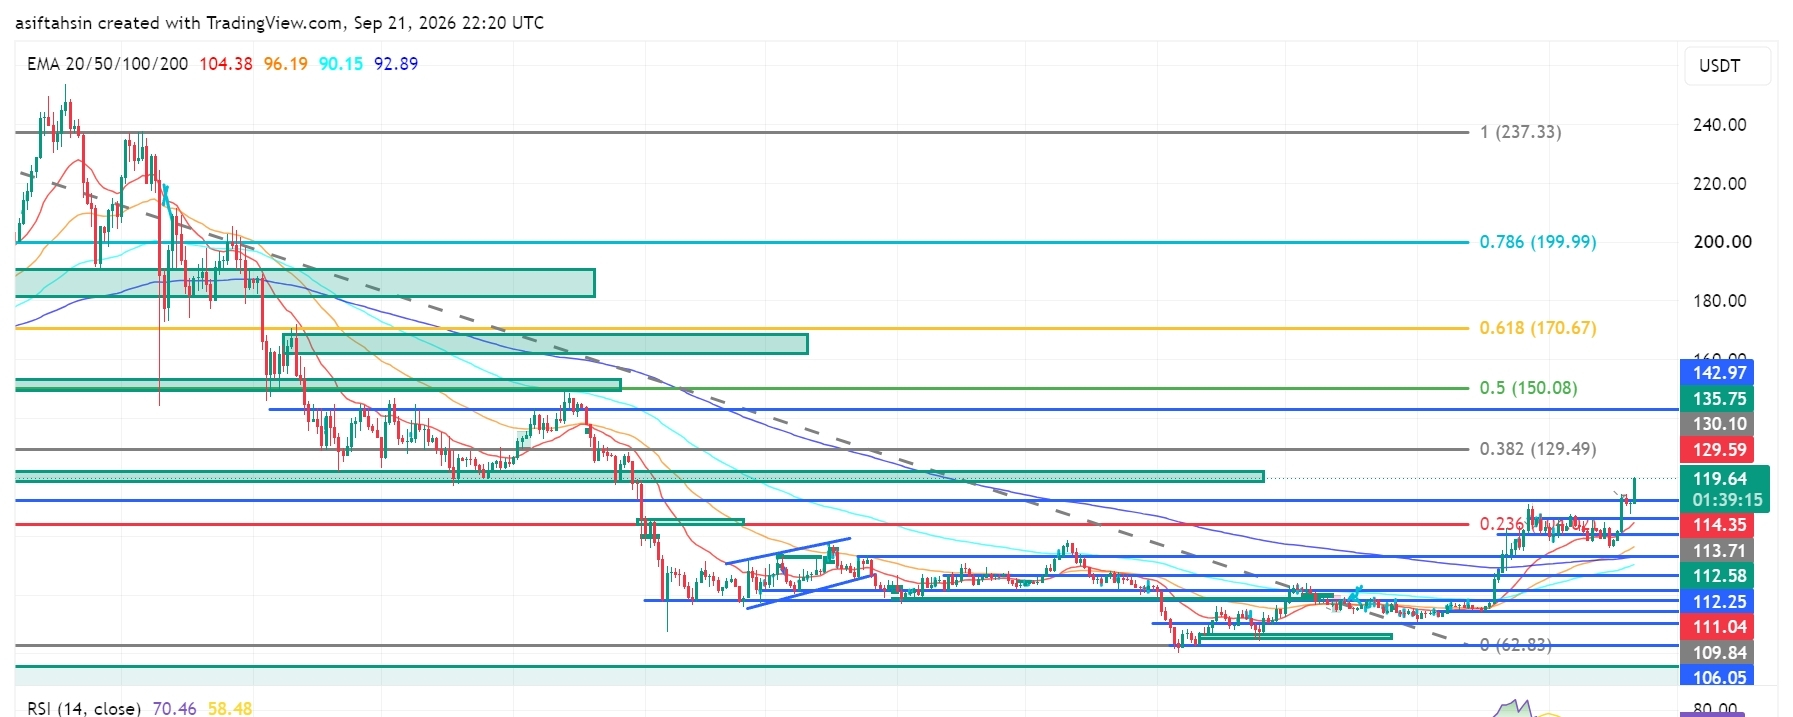
SOL Technical Outlook: Solana Pushes Toward $120 as Breakout Structure StrengthensSOL is currently trading around $119.61, holding well above the $112–$114 region after a strong recovery from the $104–$110 support zone.
The broader structure has improved significantly, with SOL reclaiming the $110–$114 area and now testing the $119–$120 resistance zone. A sustained breakout above this region would bring the higher Fibonacci levels back into focus.
📈 EMA Structure
20 EMA: $104.38
50 EMA: $96.19
100 EMA: $90.15
200 EMA: $92.89
SOL is trading significantly above all four major EMAs.
The 20 EMA remains above the 50 EMA, while the 50 EMA is also above the 200 EMA. This alignment reflects a strong recovery structure and improving medium-term trend.
The $104–$106 region is now an important deeper support zone, while the $110–$114 area has developed into a key structural support region after the recent breakout.
📐 Fibonacci Levels
0.236: $114.35
0.382: $129.49
0.5: $150.08
0.618: $170.67
0.786: $199.99
1.0: $237.33
SOL has reclaimed the 0.236 Fibonacci level around $114.35 and is now trading above it.
The next major Fibonacci resistance is $129.49, followed by $150.08.
🟢 Bullish Scenario
Immediate resistance is around:
$119.61 → $120
A clean breakout and sustained close above the $119–$120 zone could open the path toward:
$129.49 → $135.75 → $142.97 → $150.08
The $129.49 level is the next major Fibonacci resistance. A successful breakout and retest above $129.49 would strengthen the continuation structure and put the $150.08 level into focus.
Above $150.08, the higher Fibonacci references are:
$170.67 → $199.99 → $237.33
🔴 Pullback Scenario
Key support levels:
$114.35
$113.71
$112.58
$112.25
$111.04
$109.84
$106.05
$104.38
$96.19
$92.89
$90.15
The $111–$114 zone is particularly important.
A pullback into this area followed by a successful hold would keep the breakout structure constructive. Losing $109.84–$106.05 would indicate deeper consolidation, while a sustained move below the $104.38 20 EMA would significantly weaken the current recovery structure.
🧠 Market Structure & Liquidity
Liquidity Sweep → Accumulation → Higher Lows → Breakout → Expansion → Retest → Consolidation → Continuation
SOL has moved through several important structural phases, recovering from the June low around $62.83, building higher lows, reclaiming the $100 area, and then breaking above the previous $110–$114 resistance region.
The current move toward $120 represents another expansion phase, with $119–$120 acting as the immediate decision zone.
📊 RSI Momentum
RSI: 70.46
RSI MA: 58.48
RSI has moved above 70, showing strong bullish momentum but also entering an overbought region.
This does not automatically mean a reversal. However, after the recent expansion, SOL could experience short-term consolidation or a pullback before attempting another leg higher.
The key will be whether RSI can remain elevated while price holds the $114–$119 structure.
🎯 Key Levels
Resistance:
$119.61 → $120 → $129.49 → $135.75 → $142.97 → $150.08 → $170.67 → $199.99
Support:
$114.35 → $113.71 → $112.58 → $112.25 → $111.04 → $109.84 → $106.05 → $104.38
Major EMA Support:
$104.38 / $96.19 / $92.89 / $90.15
📌 Final Outlook
SOL has strengthened considerably after reclaiming the $110–$114 region and pushing toward $120.
The key battle now is $119–$120.
A sustained breakout above this zone could open the path toward $129.49, followed by $135.75–$142.97 and the major $150.08 Fibonacci level.
On the downside, $111–$114 is the first major retest zone. Holding this area would keep the breakout structure intact, while a deeper move below $106.05–$104.38 would weaken the current setup.
Bias: Recovery structure remains strong above $104.38. A sustained breakout above $119–$120 could open the path toward $129.49, with $150.08 as the next major Fibonacci objective.
$SOL
{future}(SOLUSDT)
SOL Technical Outlook: Solana Pushes Toward $120 as Breakout Structure Strengthens
SOL is currently trading around $119.61, holding well above the $112–$114 region after a strong recovery from the $104–$110 support zone.
The broader structure has improved significantly, with SOL reclaiming the $110–$114 area and now testing the $119–$120 resistance zone. A sustained breakout above this region would bring the higher Fibonacci levels back into focus.
📈 EMA Structure
20 EMA: $104.38
50 EMA: $96.19
100 EMA: $90.15
200 EMA: $92.89
SOL is trading significantly above all four major EMAs.
The 20 EMA remains above the 50 EMA, while the 50 EMA is also above the 200 EMA. This alignment reflects a strong recovery structure and improving medium-term trend.
The $104–$106 region is now an important deeper support zone, while the $110–$114 area has developed into a key structural support region after the recent breakout.
📐 Fibonacci Levels
0.236: $114.35
0.382: $129.49
0.5: $150.08
0.618: $170.67
0.786: $199.99
1.0: $237.33
SOL has reclaimed the 0.236 Fibonacci level around $114.35 and is now trading above it.
The next major Fibonacci resistance is $129.49, followed by $150.08.
🟢 Bullish Scenario
Immediate resistance is around:
$119.61 → $120
A clean breakout and sustained close above the $119–$120 zone could open the path toward:
$129.49 → $135.75 → $142.97 → $150.08
The $129.49 level is the next major Fibonacci resistance. A successful breakout and retest above $129.49 would strengthen the continuation structure and put the $150.08 level into focus.
Above $150.08, the higher Fibonacci references are:
$170.67 → $199.99 → $237.33
🔴 Pullback Scenario
Key support levels:
$114.35
$113.71
$112.58
$112.25
$111.04
$109.84
$106.05
$104.38
$96.19
$92.89
$90.15
The $111–$114 zone is particularly important.
A pullback into this area followed by a successful hold would keep the breakout structure constructive. Losing $109.84–$106.05 would indicate deeper consolidation, while a sustained move below the $104.38 20 EMA would significantly weaken the current recovery structure.
🧠 Market Structure & Liquidity
Liquidity Sweep → Accumulation → Higher Lows → Breakout → Expansion → Retest → Consolidation → Continuation
SOL has moved through several important structural phases, recovering from the June low around $62.83, building higher lows, reclaiming the $100 area, and then breaking above the previous $110–$114 resistance region.
The current move toward $120 represents another expansion phase, with $119–$120 acting as the immediate decision zone.
📊 RSI Momentum
RSI: 70.46
RSI MA: 58.48
RSI has moved above 70, showing strong bullish momentum but also entering an overbought region.
This does not automatically mean a reversal. However, after the recent expansion, SOL could experience short-term consolidation or a pullback before attempting another leg higher.
The key will be whether RSI can remain elevated while price holds the $114–$119 structure.
🎯 Key Levels
Resistance:
$119.61 → $120 → $129.49 → $135.75 → $142.97 → $150.08 → $170.67 → $199.99
Support:
$114.35 → $113.71 → $112.58 → $112.25 → $111.04 → $109.84 → $106.05 → $104.38
Major EMA Support:
$104.38 / $96.19 / $92.89 / $90.15
📌 Final Outlook
SOL has strengthened considerably after reclaiming the $110–$114 region and pushing toward $120.
The key battle now is $119–$120.
A sustained breakout above this zone could open the path toward $129.49, followed by $135.75–$142.97 and the major $150.08 Fibonacci level.
On the downside, $111–$114 is the first major retest zone. Holding this area would keep the breakout structure intact, while a deeper move below $106.05–$104.38 would weaken the current setup.
Bias: Recovery structure remains strong above $104.38. A sustained breakout above $119–$120 could open the path toward $129.49, with $150.08 as the next major Fibonacci objective.
$SOL
The broader structure has improved significantly, with SOL reclaiming the $110–$114 area and now testing the $119–$120 resistance zone. A sustained breakout above this region would bring the higher Fibonacci levels back into focus.
📈 EMA Structure
20 EMA: $104.38
50 EMA: $96.19
100 EMA: $90.15
200 EMA: $92.89
SOL is trading significantly above all four major EMAs.
The 20 EMA remains above the 50 EMA, while the 50 EMA is also above the 200 EMA. This alignment reflects a strong recovery structure and improving medium-term trend.
The $104–$106 region is now an important deeper support zone, while the $110–$114 area has developed into a key structural support region after the recent breakout.
📐 Fibonacci Levels
0.236: $114.35
0.382: $129.49
0.5: $150.08
0.618: $170.67
0.786: $199.99
1.0: $237.33
SOL has reclaimed the 0.236 Fibonacci level around $114.35 and is now trading above it.
The next major Fibonacci resistance is $129.49, followed by $150.08.
🟢 Bullish Scenario
Immediate resistance is around:
$119.61 → $120
A clean breakout and sustained close above the $119–$120 zone could open the path toward:
$129.49 → $135.75 → $142.97 → $150.08
The $129.49 level is the next major Fibonacci resistance. A successful breakout and retest above $129.49 would strengthen the continuation structure and put the $150.08 level into focus.
Above $150.08, the higher Fibonacci references are:
$170.67 → $199.99 → $237.33
🔴 Pullback Scenario
Key support levels:
$114.35
$113.71
$112.58
$112.25
$111.04
$109.84
$106.05
$104.38
$96.19
$92.89
$90.15
The $111–$114 zone is particularly important.
A pullback into this area followed by a successful hold would keep the breakout structure constructive. Losing $109.84–$106.05 would indicate deeper consolidation, while a sustained move below the $104.38 20 EMA would significantly weaken the current recovery structure.
🧠 Market Structure & Liquidity
Liquidity Sweep → Accumulation → Higher Lows → Breakout → Expansion → Retest → Consolidation → Continuation
SOL has moved through several important structural phases, recovering from the June low around $62.83, building higher lows, reclaiming the $100 area, and then breaking above the previous $110–$114 resistance region.
The current move toward $120 represents another expansion phase, with $119–$120 acting as the immediate decision zone.
📊 RSI Momentum
RSI: 70.46
RSI MA: 58.48
RSI has moved above 70, showing strong bullish momentum but also entering an overbought region.
This does not automatically mean a reversal. However, after the recent expansion, SOL could experience short-term consolidation or a pullback before attempting another leg higher.
The key will be whether RSI can remain elevated while price holds the $114–$119 structure.
🎯 Key Levels
Resistance:
$119.61 → $120 → $129.49 → $135.75 → $142.97 → $150.08 → $170.67 → $199.99
Support:
$114.35 → $113.71 → $112.58 → $112.25 → $111.04 → $109.84 → $106.05 → $104.38
Major EMA Support:
$104.38 / $96.19 / $92.89 / $90.15
📌 Final Outlook
SOL has strengthened considerably after reclaiming the $110–$114 region and pushing toward $120.
The key battle now is $119–$120.
A sustained breakout above this zone could open the path toward $129.49, followed by $135.75–$142.97 and the major $150.08 Fibonacci level.
On the downside, $111–$114 is the first major retest zone. Holding this area would keep the breakout structure intact, while a deeper move below $106.05–$104.38 would weaken the current setup.
Bias: Recovery structure remains strong above $104.38. A sustained breakout above $119–$120 could open the path toward $129.49, with $150.08 as the next major Fibonacci objective.
$SOL
35
·
--
Artigo
Ver tradução
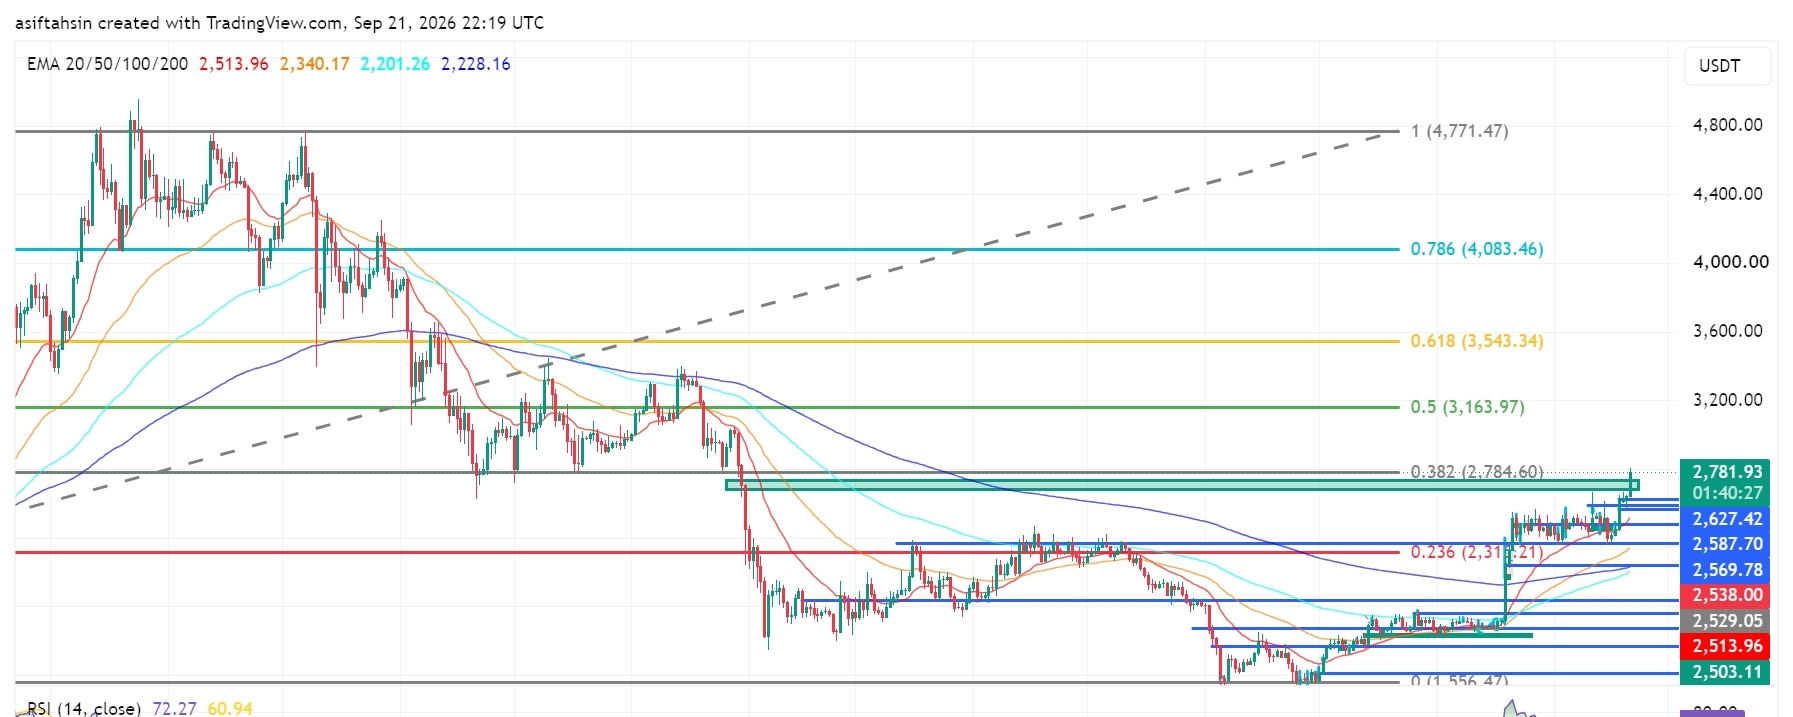
ETH Technical Outlook: Ethereum Reclaims $2.78K as Breakout Structure StrengthensETH is currently trading around $2,781.93, pushing into the major $2,784.60 Fibonacci resistance after a strong recovery from the $2,475–$2,500 area.
The broader structure has improved significantly, with ETH reclaiming the $2,500–$2,600 region and breaking above the previous consolidation range. A sustained breakout above $2,784.60 would bring the higher Fibonacci levels into focus.
📈 EMA Structure
20 EMA: $2,513.96
50 EMA: $2,340.17
100 EMA: $2,201.26
200 EMA: $2,228.16
ETH is trading well above all four major EMAs.
The 20 EMA remains above the 50 EMA, while the 100 EMA and 200 EMA are positioned significantly lower. This alignment reflects a strong recovery structure and improving medium-term momentum.
The $2,500–$2,540 region is now an important EMA/support zone.
📐 Fibonacci Levels
0.236: $2,315.21
0.382: $2,784.60
0.5: $3,163.97
0.618: $3,543.34
0.786: $4,083.46
1.0: $4,771.47
ETH is currently testing the 0.382 Fibonacci level at $2,784.60.
A clean breakout and sustained close above this level would shift attention toward $3,163.97, followed by the higher Fibonacci extensions.
🟢 Bullish Scenario
Immediate resistance sits around:
$2,784.60 → $2,800
A confirmed breakout above this area could open the path toward:
$3,163.97 → $3,543.34 → $4,083.46 → $4,771.47
The first major objective is the 0.5 Fibonacci level at $3,163.97. If ETH can establish support above $2,784.60 after the breakout, the recovery structure would become substantially stronger.
🔴 Pullback Scenario
Key support levels:
$2,672.47
$2,627.42
$2,587.70
$2,569.78
$2,538.00
$2,529.05
$2,513.96
$2,503.11
$2,479.06
$2,475.84
The $2,570–$2,630 zone is particularly important for a healthy retest.
Holding this area after a breakout would allow ETH to consolidate before another attempt higher. A deeper move below $2,500 would weaken the current breakout structure and bring the lower support zone back into focus.
🧠 Market Structure & Liquidity
Liquidity Sweep → Accumulation → Higher Lows → Breakout → Expansion → Retest → Consolidation → Continuation
ETH has transitioned from the prolonged decline into a clear recovery structure. The recent move above the $2,600–$2,670 region represents an important expansion phase, while the current move toward $2,784.60 is testing the next major structural resistance.
📊 RSI Momentum
RSI: 72.27
RSI MA: 60.94
RSI has moved above 70, showing strong momentum but also indicating that ETH is entering an overbought zone on this chart.
That does not automatically mean a reversal; however, after such a strong expansion, a short-term consolidation or pullback would be technically normal before another continuation attempt.
🎯 Key Levels
Resistance:
$2,784.60 → $2,800 → $3,163.97 → $3,543.34 → $4,083.46 → $4,771.47
Support:
$2,672.47 → $2,627.42 → $2,587.70 → $2,569.78 → $2,538 → $2,513.96 → $2,503.11 → $2,479.06
Major EMA Support:
$2,513.96 / $2,340.17 / $2,228.16 / $2,201.26
📌 Final Outlook
ETH has strengthened considerably after reclaiming the $2,500–$2,600 region and pushing toward the $2,784.60 Fibonacci resistance.
The key battle now is $2,784.60–$2,800.
A sustained breakout above this zone could open the path toward $3,163.97, followed by $3,543.34 and potentially $4,083.46.
On the downside, $2,570–$2,630 is the first major retest zone, while $2,500–$2,514 remains critical structural support.
Bias: Recovery structure remains strong above $2,500. A sustained breakout above $2,784.60 could open the path toward $3,163.97, with $3,543.34 as the next major Fibonacci level.
$ETH
{future}(ETHUSDT)
ETH Technical Outlook: Ethereum Reclaims $2.78K as Breakout Structure Strengthens
ETH is currently trading around $2,781.93, pushing into the major $2,784.60 Fibonacci resistance after a strong recovery from the $2,475–$2,500 area.
The broader structure has improved significantly, with ETH reclaiming the $2,500–$2,600 region and breaking above the previous consolidation range. A sustained breakout above $2,784.60 would bring the higher Fibonacci levels into focus.
📈 EMA Structure
20 EMA: $2,513.96
50 EMA: $2,340.17
100 EMA: $2,201.26
200 EMA: $2,228.16
ETH is trading well above all four major EMAs.
The 20 EMA remains above the 50 EMA, while the 100 EMA and 200 EMA are positioned significantly lower. This alignment reflects a strong recovery structure and improving medium-term momentum.
The $2,500–$2,540 region is now an important EMA/support zone.
📐 Fibonacci Levels
0.236: $2,315.21
0.382: $2,784.60
0.5: $3,163.97
0.618: $3,543.34
0.786: $4,083.46
1.0: $4,771.47
ETH is currently testing the 0.382 Fibonacci level at $2,784.60.
A clean breakout and sustained close above this level would shift attention toward $3,163.97, followed by the higher Fibonacci extensions.
🟢 Bullish Scenario
Immediate resistance sits around:
$2,784.60 → $2,800
A confirmed breakout above this area could open the path toward:
$3,163.97 → $3,543.34 → $4,083.46 → $4,771.47
The first major objective is the 0.5 Fibonacci level at $3,163.97. If ETH can establish support above $2,784.60 after the breakout, the recovery structure would become substantially stronger.
🔴 Pullback Scenario
Key support levels:
$2,672.47
$2,627.42
$2,587.70
$2,569.78
$2,538.00
$2,529.05
$2,513.96
$2,503.11
$2,479.06
$2,475.84
The $2,570–$2,630 zone is particularly important for a healthy retest.
Holding this area after a breakout would allow ETH to consolidate before another attempt higher. A deeper move below $2,500 would weaken the current breakout structure and bring the lower support zone back into focus.
🧠 Market Structure & Liquidity
Liquidity Sweep → Accumulation → Higher Lows → Breakout → Expansion → Retest → Consolidation → Continuation
ETH has transitioned from the prolonged decline into a clear recovery structure. The recent move above the $2,600–$2,670 region represents an important expansion phase, while the current move toward $2,784.60 is testing the next major structural resistance.
📊 RSI Momentum
RSI: 72.27
RSI MA: 60.94
RSI has moved above 70, showing strong momentum but also indicating that ETH is entering an overbought zone on this chart.
That does not automatically mean a reversal; however, after such a strong expansion, a short-term consolidation or pullback would be technically normal before another continuation attempt.
🎯 Key Levels
Resistance:
$2,784.60 → $2,800 → $3,163.97 → $3,543.34 → $4,083.46 → $4,771.47
Support:
$2,672.47 → $2,627.42 → $2,587.70 → $2,569.78 → $2,538 → $2,513.96 → $2,503.11 → $2,479.06
Major EMA Support:
$2,513.96 / $2,340.17 / $2,228.16 / $2,201.26
📌 Final Outlook
ETH has strengthened considerably after reclaiming the $2,500–$2,600 region and pushing toward the $2,784.60 Fibonacci resistance.
The key battle now is $2,784.60–$2,800.
A sustained breakout above this zone could open the path toward $3,163.97, followed by $3,543.34 and potentially $4,083.46.
On the downside, $2,570–$2,630 is the first major retest zone, while $2,500–$2,514 remains critical structural support.
Bias: Recovery structure remains strong above $2,500. A sustained breakout above $2,784.60 could open the path toward $3,163.97, with $3,543.34 as the next major Fibonacci level.
$ETH
The broader structure has improved significantly, with ETH reclaiming the $2,500–$2,600 region and breaking above the previous consolidation range. A sustained breakout above $2,784.60 would bring the higher Fibonacci levels into focus.
📈 EMA Structure
20 EMA: $2,513.96
50 EMA: $2,340.17
100 EMA: $2,201.26
200 EMA: $2,228.16
ETH is trading well above all four major EMAs.
The 20 EMA remains above the 50 EMA, while the 100 EMA and 200 EMA are positioned significantly lower. This alignment reflects a strong recovery structure and improving medium-term momentum.
The $2,500–$2,540 region is now an important EMA/support zone.
📐 Fibonacci Levels
0.236: $2,315.21
0.382: $2,784.60
0.5: $3,163.97
0.618: $3,543.34
0.786: $4,083.46
1.0: $4,771.47
ETH is currently testing the 0.382 Fibonacci level at $2,784.60.
A clean breakout and sustained close above this level would shift attention toward $3,163.97, followed by the higher Fibonacci extensions.
🟢 Bullish Scenario
Immediate resistance sits around:
$2,784.60 → $2,800
A confirmed breakout above this area could open the path toward:
$3,163.97 → $3,543.34 → $4,083.46 → $4,771.47
The first major objective is the 0.5 Fibonacci level at $3,163.97. If ETH can establish support above $2,784.60 after the breakout, the recovery structure would become substantially stronger.
🔴 Pullback Scenario
Key support levels:
$2,672.47
$2,627.42
$2,587.70
$2,569.78
$2,538.00
$2,529.05
$2,513.96
$2,503.11
$2,479.06
$2,475.84
The $2,570–$2,630 zone is particularly important for a healthy retest.
Holding this area after a breakout would allow ETH to consolidate before another attempt higher. A deeper move below $2,500 would weaken the current breakout structure and bring the lower support zone back into focus.
🧠 Market Structure & Liquidity
Liquidity Sweep → Accumulation → Higher Lows → Breakout → Expansion → Retest → Consolidation → Continuation
ETH has transitioned from the prolonged decline into a clear recovery structure. The recent move above the $2,600–$2,670 region represents an important expansion phase, while the current move toward $2,784.60 is testing the next major structural resistance.
📊 RSI Momentum
RSI: 72.27
RSI MA: 60.94
RSI has moved above 70, showing strong momentum but also indicating that ETH is entering an overbought zone on this chart.
That does not automatically mean a reversal; however, after such a strong expansion, a short-term consolidation or pullback would be technically normal before another continuation attempt.
🎯 Key Levels
Resistance:
$2,784.60 → $2,800 → $3,163.97 → $3,543.34 → $4,083.46 → $4,771.47
Support:
$2,672.47 → $2,627.42 → $2,587.70 → $2,569.78 → $2,538 → $2,513.96 → $2,503.11 → $2,479.06
Major EMA Support:
$2,513.96 / $2,340.17 / $2,228.16 / $2,201.26
📌 Final Outlook
ETH has strengthened considerably after reclaiming the $2,500–$2,600 region and pushing toward the $2,784.60 Fibonacci resistance.
The key battle now is $2,784.60–$2,800.
A sustained breakout above this zone could open the path toward $3,163.97, followed by $3,543.34 and potentially $4,083.46.
On the downside, $2,570–$2,630 is the first major retest zone, while $2,500–$2,514 remains critical structural support.
Bias: Recovery structure remains strong above $2,500. A sustained breakout above $2,784.60 could open the path toward $3,163.97, with $3,543.34 as the next major Fibonacci level.
$ETH
58
·
--
Artigo
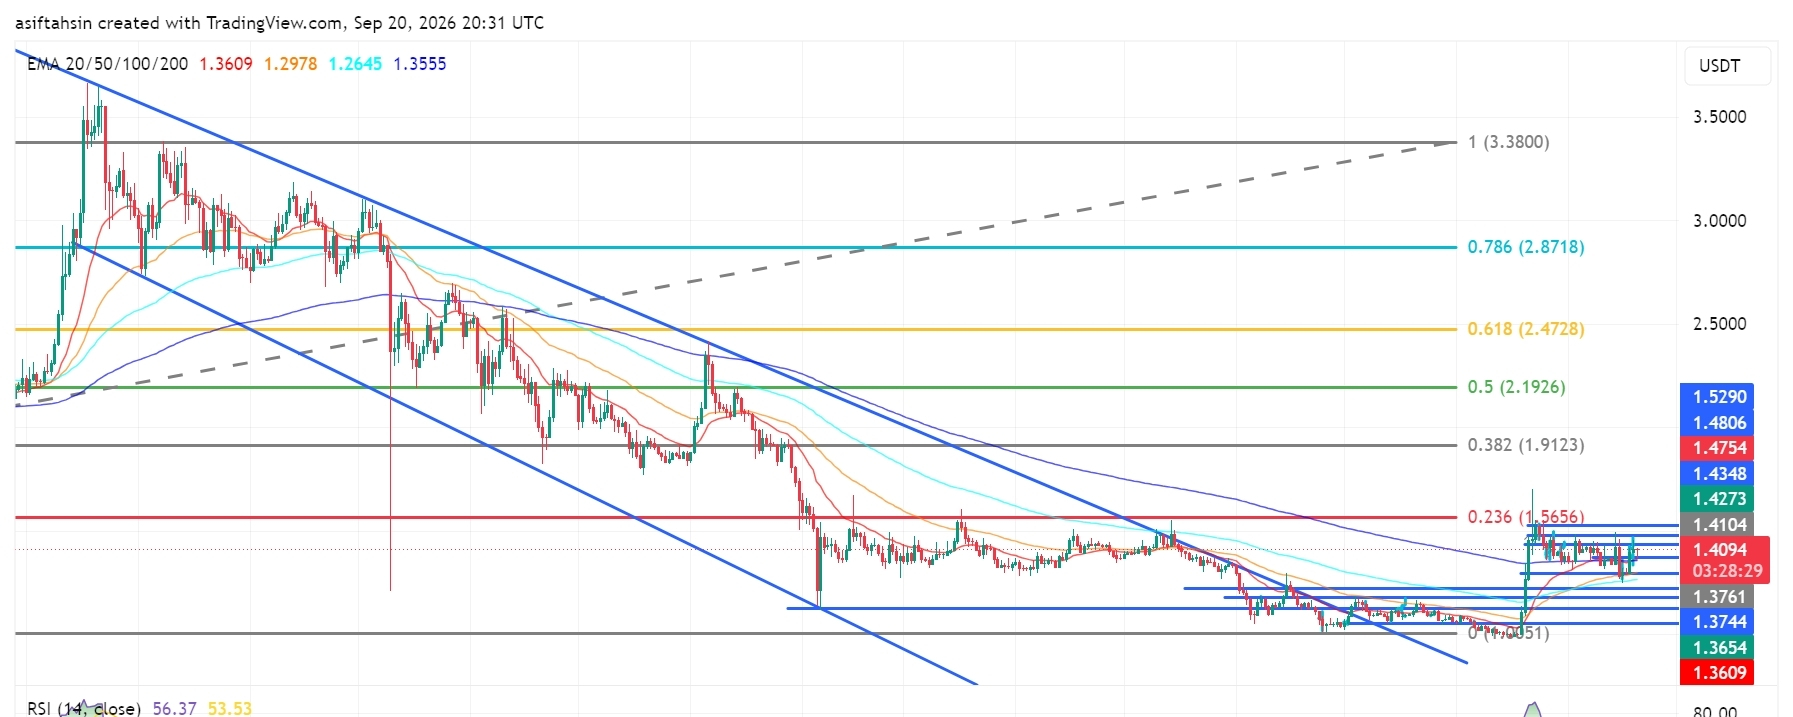
Perspectiva Técnica do XRP: XRP Mantém-se Acima de US$ 1,40 enquanto a Estrutura de Recuperação se FortalecePerspectiva Técnica do XRP: XRP Mantém-se Acima de US$ 1,40 enquanto a Estrutura de Recuperação se Fortalece
O XRP está sendo negociado atualmente por volta de US$ 1,41, mantendo-se acima da região de US$ 1,37–US$ 1,40 após a recente recuperação da área de suporte de US$ 1,25–US$ 1,30.
A estrutura mais ampla melhorou, com o preço recuperando a região de US$ 1,40 e voltando para a zona de resistência principal de US$ 1,41–US$ 1,48. Um movimento sustentado através dessa área colocaria novamente em foco os níveis de Fibonacci mais altos.
Os comentários recentes do mercado também identificaram a região de US$ 1,40 como um nível importante de resistência/recuperação, embora o momento de curto prazo permaneça sensível nessa zona.
Perspectiva Técnica do XRP: XRP Mantém-se Acima de US$ 1,40 enquanto a Estrutura de Recuperação se Fortalece
Perspectiva Técnica do XRP: XRP Mantém-se Acima de US$ 1,40 enquanto a Estrutura de Recuperação se Fortalece
O XRP está sendo negociado atualmente por volta de US$ 1,41, mantendo-se acima da região de US$ 1,37–US$ 1,40 após a recente recuperação da área de suporte de US$ 1,25–US$ 1,30.
A estrutura mais ampla melhorou, com o preço recuperando a região de US$ 1,40 e voltando para a zona de resistência principal de US$ 1,41–US$ 1,48. Um movimento sustentado através dessa área colocaria novamente em foco os níveis de Fibonacci mais altos.
Os comentários recentes do mercado também identificaram a região de US$ 1,40 como um nível importante de resistência/recuperação, embora o momento de curto prazo permaneça sensível nessa zona.
O XRP está sendo negociado atualmente por volta de US$ 1,41, mantendo-se acima da região de US$ 1,37–US$ 1,40 após a recente recuperação da área de suporte de US$ 1,25–US$ 1,30.
A estrutura mais ampla melhorou, com o preço recuperando a região de US$ 1,40 e voltando para a zona de resistência principal de US$ 1,41–US$ 1,48. Um movimento sustentado através dessa área colocaria novamente em foco os níveis de Fibonacci mais altos.
Os comentários recentes do mercado também identificaram a região de US$ 1,40 como um nível importante de resistência/recuperação, embora o momento de curto prazo permaneça sensível nessa zona.
2
1.2k
·
--
Artigo
Ver tradução
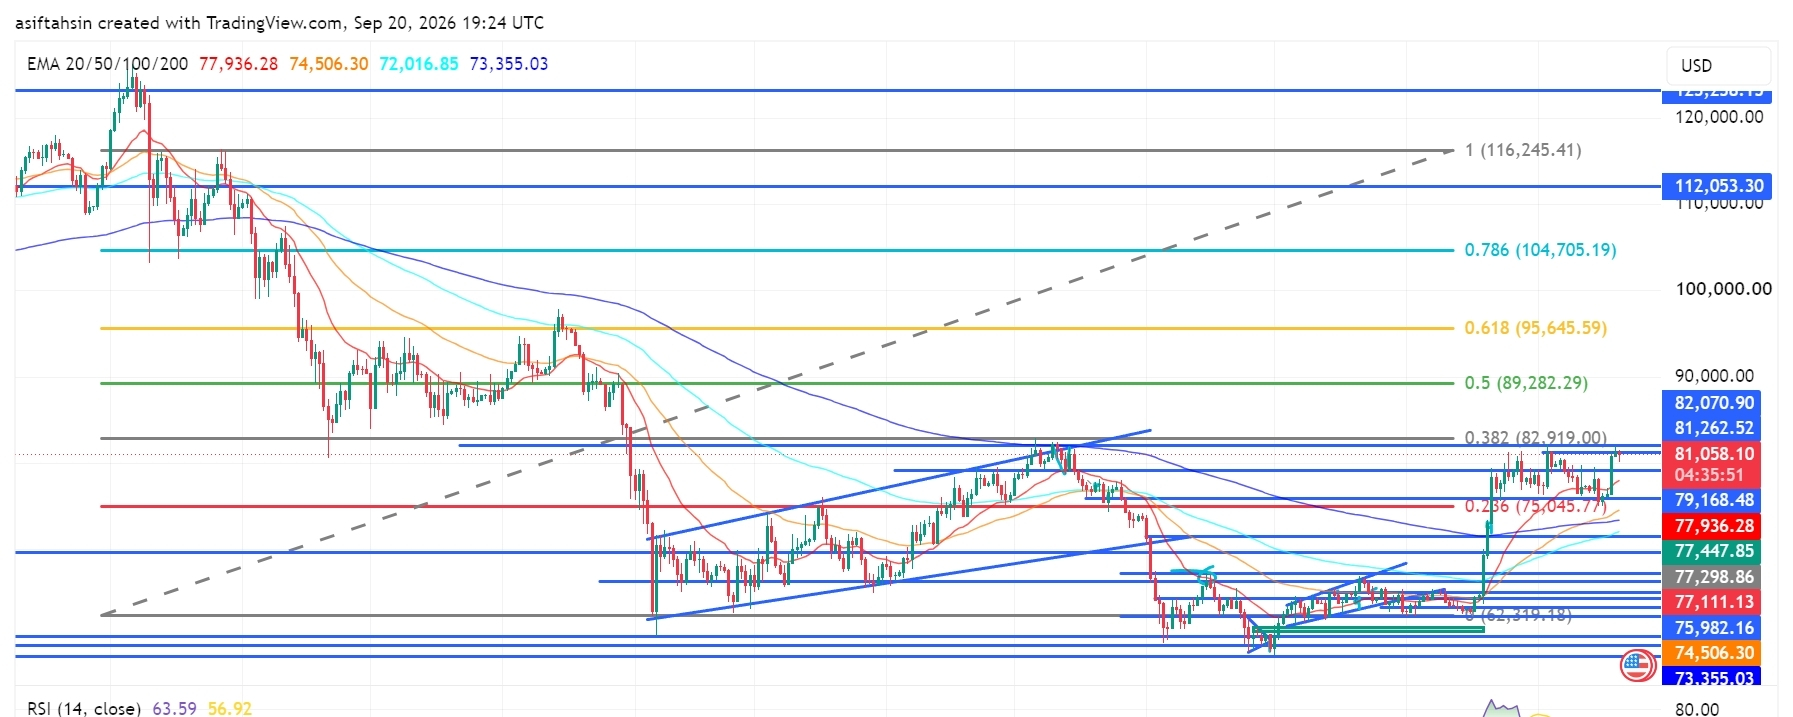
BTC Technical Outlook: Bitcoin Reclaims $81K as Recovery Structure StrengthensBTC is currently trading around $81,058, holding above the $79K–$80K region after the recent recovery from the $72K–$75K support area.
The broader structure has improved, with price reclaiming the $80K area and moving back toward the major $81.26K–$82.92K resistance zone. A sustained move through this area would put the higher Fibonacci levels back into focus.
📈 EMA Structure
20 EMA: $77,936.12
50 EMA: $74,506.24
100 EMA: $72,016.82
200 EMA: $73,355.02
BTC is currently trading well above the 20 EMA at $77,936.
The recovery above the 50 EMA at $74,506, 100 EMA at $72,016, and 200 EMA at $73,355 keeps the broader recovery structure constructive.
The 20 EMA remains above the longer-term EMA levels, showing improving short-term structure.
The $77.9K area remains an important dynamic support during any short-term pullback.
📐 Fibonacci Levels
Key Fibonacci levels:
0.236: $75,045.77
0.382: $82,919.00
0.5: $89,282.29
0.618: $95,645.59
0.786: $104,705.19
1.0: $116,245.41
BTC is currently trading above the 0.236 Fibonacci level at $75,045.77.
The next major Fibonacci reference is $82,919 — 0.382 Fib.
A sustained move above the $81K–$82.9K resistance area could bring $89,282 into focus, followed by $95,645.
🟢 Bullish Scenario
BTC has recovered strongly from the lower support structure and is now consolidating around $80K–$81K.
Immediate resistance:
$81,262.52
$82,070.90
$82,919.00 — 0.382 Fibonacci
$89,282.29 — 0.5 Fibonacci
$95,645.59 — 0.618 Fibonacci
A clean breakout and sustained close above $82K–$82.92K would provide stronger confirmation of continued recovery.
🎯 Target 1: $82,070.90
🎯 Target 2: $82,919.00 — 0.382 Fibonacci
🎯 Target 3: $89,282.29 — 0.5 Fibonacci
🎯 Target 4: $95,645.59 — 0.618 Fibonacci
🎯 Target 5: $104,705.19 — 0.786 Fibonacci
🎯 Target 6: $112,053.30
🎯 Target 7: $116,245.41 — 1.0 Fibonacci
A confirmed move through the $82.92K zone could strengthen the medium-term recovery structure and bring the $89K–$95K region into focus.
🔴 Pullback Scenario
After the recent expansion from the $75K region toward $81K, a retest of the breakout area would be normal.
Key supports:
$79,168.48
$77,936.12 — 20 EMA
$77,447.85
$77,298.86
$77,111.13
$75,982.16
$75,045.77 — 0.236 Fibonacci
$74,506.24 — 50 EMA
$73,355.02 — 200 EMA
$72,016.82 — 100 EMA
The $77K–$79K zone is particularly important.
If BTC continues to hold this area during a pullback, the current recovery structure remains active.
A sustained loss of $75,045 would weaken the current structure and bring the lower EMA support region back into focus.
🧠 Market Structure & Liquidity
BTC has formed a recovery structure after sweeping liquidity around the $72K–$75K region.
The recent move produced a strong recovery through $75K, followed by a breakout toward $80K–$81K.
BTC is now moving through an important:
Liquidity Sweep → Accumulation → Higher Lows → Breakout → Expansion → Retest → Consolidation → Continuation
structure.
The major upside liquidity and resistance are concentrated around the $81.26K–$82.92K region.
A decisive move through this area would place $89,282 as the next major Fibonacci reference.
📊 RSI Momentum
RSI (14): 63.59
RSI MA: 56.92
RSI has moved above the neutral 50 level and remains firmly in positive territory after the recent expansion.
The current reading around 63.59 shows stronger short-term momentum while remaining below the traditional 70 overbought threshold.
A sustained RSI above 60 would keep momentum supportive, while a move back below 50 would indicate increasing short-term weakness.
🎯 Key Levels
🔴 Major Resistance:
$81,262.52 → $82,070.90 → $82,919.00 → $89,282.29 → $95,645.59
🟢 Major Support:
$79,168.48 → $77,936.12 → $77,447.85 → $77,298.86 → $77,111.13 → $75,982.16 → $75,045.77
📉 Dynamic EMA Support:
$77,936.12 — 20 EMA | $74,506.24 — 50 EMA | $73,355.02 — 200 EMA | $72,016.82 — 100 EMA
🚀 Upside References:
$82,919 → $89,282 → $95,645 → $104,705 → $112,053 → $116,245
📌 Final Outlook
BTC's broader structure has strengthened after the recent recovery, with price now holding around $81K and above the major $75K–$79K support structure.
The $77K–$79K area is now an important short-term support region, while $81.26K–$82.92K remains the immediate major resistance zone.
A confirmed move above $82,919 could open the path toward $89,282, followed by $95,645 and $104,705.
However, rejection from the upper resistance area followed by a sustained loss of $75,045 would weaken the current recovery structure and bring the lower support zones back into focus.
Bias: 🟢 Recovery structure intact above $75,045. A sustained move above $82,919 could open the path toward $89,282, with $95,645 as the next major Fibonacci reference.
$BTC
{future}(BTCUSDT)
BTC Technical Outlook: Bitcoin Reclaims $81K as Recovery Structure Strengthens
BTC is currently trading around $81,058, holding above the $79K–$80K region after the recent recovery from the $72K–$75K support area.
The broader structure has improved, with price reclaiming the $80K area and moving back toward the major $81.26K–$82.92K resistance zone. A sustained move through this area would put the higher Fibonacci levels back into focus.
📈 EMA Structure
20 EMA: $77,936.12
50 EMA: $74,506.24
100 EMA: $72,016.82
200 EMA: $73,355.02
BTC is currently trading well above the 20 EMA at $77,936.
The recovery above the 50 EMA at $74,506, 100 EMA at $72,016, and 200 EMA at $73,355 keeps the broader recovery structure constructive.
The 20 EMA remains above the longer-term EMA levels, showing improving short-term structure.
The $77.9K area remains an important dynamic support during any short-term pullback.
📐 Fibonacci Levels
Key Fibonacci levels:
0.236: $75,045.77
0.382: $82,919.00
0.5: $89,282.29
0.618: $95,645.59
0.786: $104,705.19
1.0: $116,245.41
BTC is currently trading above the 0.236 Fibonacci level at $75,045.77.
The next major Fibonacci reference is $82,919 — 0.382 Fib.
A sustained move above the $81K–$82.9K resistance area could bring $89,282 into focus, followed by $95,645.
🟢 Bullish Scenario
BTC has recovered strongly from the lower support structure and is now consolidating around $80K–$81K.
Immediate resistance:
$81,262.52
$82,070.90
$82,919.00 — 0.382 Fibonacci
$89,282.29 — 0.5 Fibonacci
$95,645.59 — 0.618 Fibonacci
A clean breakout and sustained close above $82K–$82.92K would provide stronger confirmation of continued recovery.
🎯 Target 1: $82,070.90
🎯 Target 2: $82,919.00 — 0.382 Fibonacci
🎯 Target 3: $89,282.29 — 0.5 Fibonacci
🎯 Target 4: $95,645.59 — 0.618 Fibonacci
🎯 Target 5: $104,705.19 — 0.786 Fibonacci
🎯 Target 6: $112,053.30
🎯 Target 7: $116,245.41 — 1.0 Fibonacci
A confirmed move through the $82.92K zone could strengthen the medium-term recovery structure and bring the $89K–$95K region into focus.
🔴 Pullback Scenario
After the recent expansion from the $75K region toward $81K, a retest of the breakout area would be normal.
Key supports:
$79,168.48
$77,936.12 — 20 EMA
$77,447.85
$77,298.86
$77,111.13
$75,982.16
$75,045.77 — 0.236 Fibonacci
$74,506.24 — 50 EMA
$73,355.02 — 200 EMA
$72,016.82 — 100 EMA
The $77K–$79K zone is particularly important.
If BTC continues to hold this area during a pullback, the current recovery structure remains active.
A sustained loss of $75,045 would weaken the current structure and bring the lower EMA support region back into focus.
🧠 Market Structure & Liquidity
BTC has formed a recovery structure after sweeping liquidity around the $72K–$75K region.
The recent move produced a strong recovery through $75K, followed by a breakout toward $80K–$81K.
BTC is now moving through an important:
Liquidity Sweep → Accumulation → Higher Lows → Breakout → Expansion → Retest → Consolidation → Continuation
structure.
The major upside liquidity and resistance are concentrated around the $81.26K–$82.92K region.
A decisive move through this area would place $89,282 as the next major Fibonacci reference.
📊 RSI Momentum
RSI (14): 63.59
RSI MA: 56.92
RSI has moved above the neutral 50 level and remains firmly in positive territory after the recent expansion.
The current reading around 63.59 shows stronger short-term momentum while remaining below the traditional 70 overbought threshold.
A sustained RSI above 60 would keep momentum supportive, while a move back below 50 would indicate increasing short-term weakness.
🎯 Key Levels
🔴 Major Resistance:
$81,262.52 → $82,070.90 → $82,919.00 → $89,282.29 → $95,645.59
🟢 Major Support:
$79,168.48 → $77,936.12 → $77,447.85 → $77,298.86 → $77,111.13 → $75,982.16 → $75,045.77
📉 Dynamic EMA Support:
$77,936.12 — 20 EMA | $74,506.24 — 50 EMA | $73,355.02 — 200 EMA | $72,016.82 — 100 EMA
🚀 Upside References:
$82,919 → $89,282 → $95,645 → $104,705 → $112,053 → $116,245
📌 Final Outlook
BTC's broader structure has strengthened after the recent recovery, with price now holding around $81K and above the major $75K–$79K support structure.
The $77K–$79K area is now an important short-term support region, while $81.26K–$82.92K remains the immediate major resistance zone.
A confirmed move above $82,919 could open the path toward $89,282, followed by $95,645 and $104,705.
However, rejection from the upper resistance area followed by a sustained loss of $75,045 would weaken the current recovery structure and bring the lower support zones back into focus.
Bias: 🟢 Recovery structure intact above $75,045. A sustained move above $82,919 could open the path toward $89,282, with $95,645 as the next major Fibonacci reference.
$BTC
The broader structure has improved, with price reclaiming the $80K area and moving back toward the major $81.26K–$82.92K resistance zone. A sustained move through this area would put the higher Fibonacci levels back into focus.
📈 EMA Structure
20 EMA: $77,936.12
50 EMA: $74,506.24
100 EMA: $72,016.82
200 EMA: $73,355.02
BTC is currently trading well above the 20 EMA at $77,936.
The recovery above the 50 EMA at $74,506, 100 EMA at $72,016, and 200 EMA at $73,355 keeps the broader recovery structure constructive.
The 20 EMA remains above the longer-term EMA levels, showing improving short-term structure.
The $77.9K area remains an important dynamic support during any short-term pullback.
📐 Fibonacci Levels
Key Fibonacci levels:
0.236: $75,045.77
0.382: $82,919.00
0.5: $89,282.29
0.618: $95,645.59
0.786: $104,705.19
1.0: $116,245.41
BTC is currently trading above the 0.236 Fibonacci level at $75,045.77.
The next major Fibonacci reference is $82,919 — 0.382 Fib.
A sustained move above the $81K–$82.9K resistance area could bring $89,282 into focus, followed by $95,645.
🟢 Bullish Scenario
BTC has recovered strongly from the lower support structure and is now consolidating around $80K–$81K.
Immediate resistance:
$81,262.52
$82,070.90
$82,919.00 — 0.382 Fibonacci
$89,282.29 — 0.5 Fibonacci
$95,645.59 — 0.618 Fibonacci
A clean breakout and sustained close above $82K–$82.92K would provide stronger confirmation of continued recovery.
🎯 Target 1: $82,070.90
🎯 Target 2: $82,919.00 — 0.382 Fibonacci
🎯 Target 3: $89,282.29 — 0.5 Fibonacci
🎯 Target 4: $95,645.59 — 0.618 Fibonacci
🎯 Target 5: $104,705.19 — 0.786 Fibonacci
🎯 Target 6: $112,053.30
🎯 Target 7: $116,245.41 — 1.0 Fibonacci
A confirmed move through the $82.92K zone could strengthen the medium-term recovery structure and bring the $89K–$95K region into focus.
🔴 Pullback Scenario
After the recent expansion from the $75K region toward $81K, a retest of the breakout area would be normal.
Key supports:
$79,168.48
$77,936.12 — 20 EMA
$77,447.85
$77,298.86
$77,111.13
$75,982.16
$75,045.77 — 0.236 Fibonacci
$74,506.24 — 50 EMA
$73,355.02 — 200 EMA
$72,016.82 — 100 EMA
The $77K–$79K zone is particularly important.
If BTC continues to hold this area during a pullback, the current recovery structure remains active.
A sustained loss of $75,045 would weaken the current structure and bring the lower EMA support region back into focus.
🧠 Market Structure & Liquidity
BTC has formed a recovery structure after sweeping liquidity around the $72K–$75K region.
The recent move produced a strong recovery through $75K, followed by a breakout toward $80K–$81K.
BTC is now moving through an important:
Liquidity Sweep → Accumulation → Higher Lows → Breakout → Expansion → Retest → Consolidation → Continuation
structure.
The major upside liquidity and resistance are concentrated around the $81.26K–$82.92K region.
A decisive move through this area would place $89,282 as the next major Fibonacci reference.
📊 RSI Momentum
RSI (14): 63.59
RSI MA: 56.92
RSI has moved above the neutral 50 level and remains firmly in positive territory after the recent expansion.
The current reading around 63.59 shows stronger short-term momentum while remaining below the traditional 70 overbought threshold.
A sustained RSI above 60 would keep momentum supportive, while a move back below 50 would indicate increasing short-term weakness.
🎯 Key Levels
🔴 Major Resistance:
$81,262.52 → $82,070.90 → $82,919.00 → $89,282.29 → $95,645.59
🟢 Major Support:
$79,168.48 → $77,936.12 → $77,447.85 → $77,298.86 → $77,111.13 → $75,982.16 → $75,045.77
📉 Dynamic EMA Support:
$77,936.12 — 20 EMA | $74,506.24 — 50 EMA | $73,355.02 — 200 EMA | $72,016.82 — 100 EMA
🚀 Upside References:
$82,919 → $89,282 → $95,645 → $104,705 → $112,053 → $116,245
📌 Final Outlook
BTC's broader structure has strengthened after the recent recovery, with price now holding around $81K and above the major $75K–$79K support structure.
The $77K–$79K area is now an important short-term support region, while $81.26K–$82.92K remains the immediate major resistance zone.
A confirmed move above $82,919 could open the path toward $89,282, followed by $95,645 and $104,705.
However, rejection from the upper resistance area followed by a sustained loss of $75,045 would weaken the current recovery structure and bring the lower support zones back into focus.
Bias: 🟢 Recovery structure intact above $75,045. A sustained move above $82,919 could open the path toward $89,282, with $95,645 as the next major Fibonacci reference.
$BTC
43
·
--
Artigo
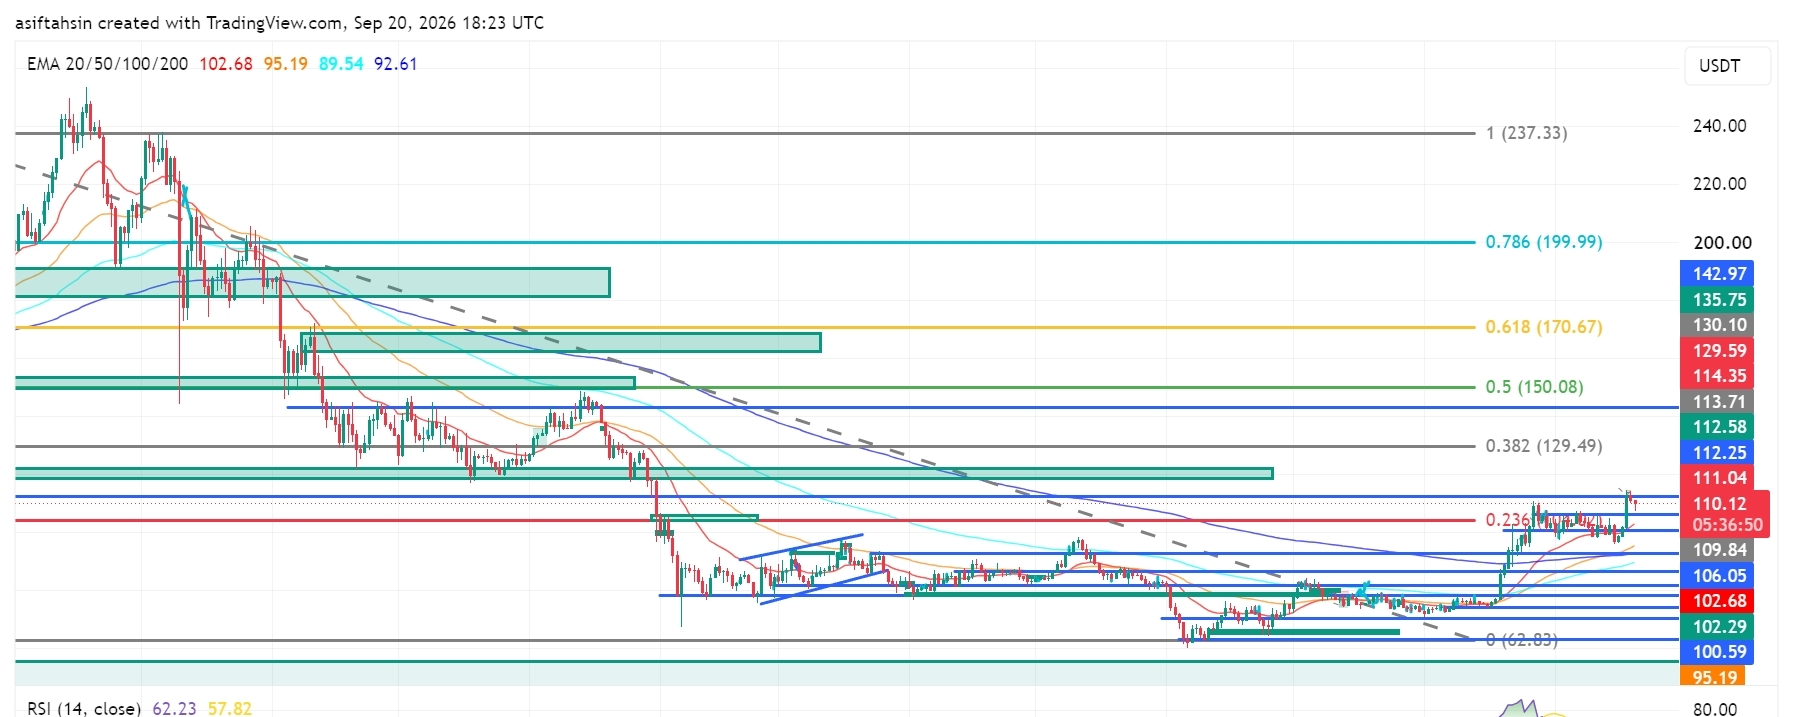
Perspectiva Técnica da SOL: Solana Recupera US$ 110 com a Estrutura da Recuperação se FortalecendoA SOL está atualmente sendo negociada por volta de US$ 110,1, mantendo-se acima da região de US$ 106–US$ 109 após a recente recuperação da área de suporte de US$ 92–US$ 100.
A estrutura mais ampla melhorou, com o preço recuperando a faixa dos US$ 100 e voltando em direção à zona de resistência principal de US$ 111–US$ 114. Um movimento sustentado acima dessa área colocaria novamente em foco os níveis de Fibonacci mais altos.
📈 Estrutura das Médias Móveis (EMA)
Média móvel 20: US$ 102,68
Média móvel 50: US$ 95,19
Média móvel 100: US$ 89,54
Média móvel 200: US$ 92,61
A SOL está atualmente sendo negociada bem acima da média móvel de 20 em US$ 102,68.
A recuperação acima da média móvel de 50 em US$ 95,19, da média móvel de 100 em US$ 89,54 e da média móvel de 200 em US$ 92,61 mantém a estrutura mais ampla da recuperação construtiva.
Perspectiva Técnica da SOL: Solana Recupera US$ 110 com a Estrutura da Recuperação se Fortalecendo
A SOL está atualmente sendo negociada por volta de US$ 110,1, mantendo-se acima da região de US$ 106–US$ 109 após a recente recuperação da área de suporte de US$ 92–US$ 100.
A estrutura mais ampla melhorou, com o preço recuperando a faixa dos US$ 100 e voltando em direção à zona de resistência principal de US$ 111–US$ 114. Um movimento sustentado acima dessa área colocaria novamente em foco os níveis de Fibonacci mais altos.
📈 Estrutura das Médias Móveis (EMA)
Média móvel 20: US$ 102,68
Média móvel 50: US$ 95,19
Média móvel 100: US$ 89,54
Média móvel 200: US$ 92,61
A SOL está atualmente sendo negociada bem acima da média móvel de 20 em US$ 102,68.
A recuperação acima da média móvel de 50 em US$ 95,19, da média móvel de 100 em US$ 89,54 e da média móvel de 200 em US$ 92,61 mantém a estrutura mais ampla da recuperação construtiva.
A estrutura mais ampla melhorou, com o preço recuperando a faixa dos US$ 100 e voltando em direção à zona de resistência principal de US$ 111–US$ 114. Um movimento sustentado acima dessa área colocaria novamente em foco os níveis de Fibonacci mais altos.
📈 Estrutura das Médias Móveis (EMA)
Média móvel 20: US$ 102,68
Média móvel 50: US$ 95,19
Média móvel 100: US$ 89,54
Média móvel 200: US$ 92,61
A SOL está atualmente sendo negociada bem acima da média móvel de 20 em US$ 102,68.
A recuperação acima da média móvel de 50 em US$ 95,19, da média móvel de 100 em US$ 89,54 e da média móvel de 200 em US$ 92,61 mantém a estrutura mais ampla da recuperação construtiva.
1k
·
--
Artigo
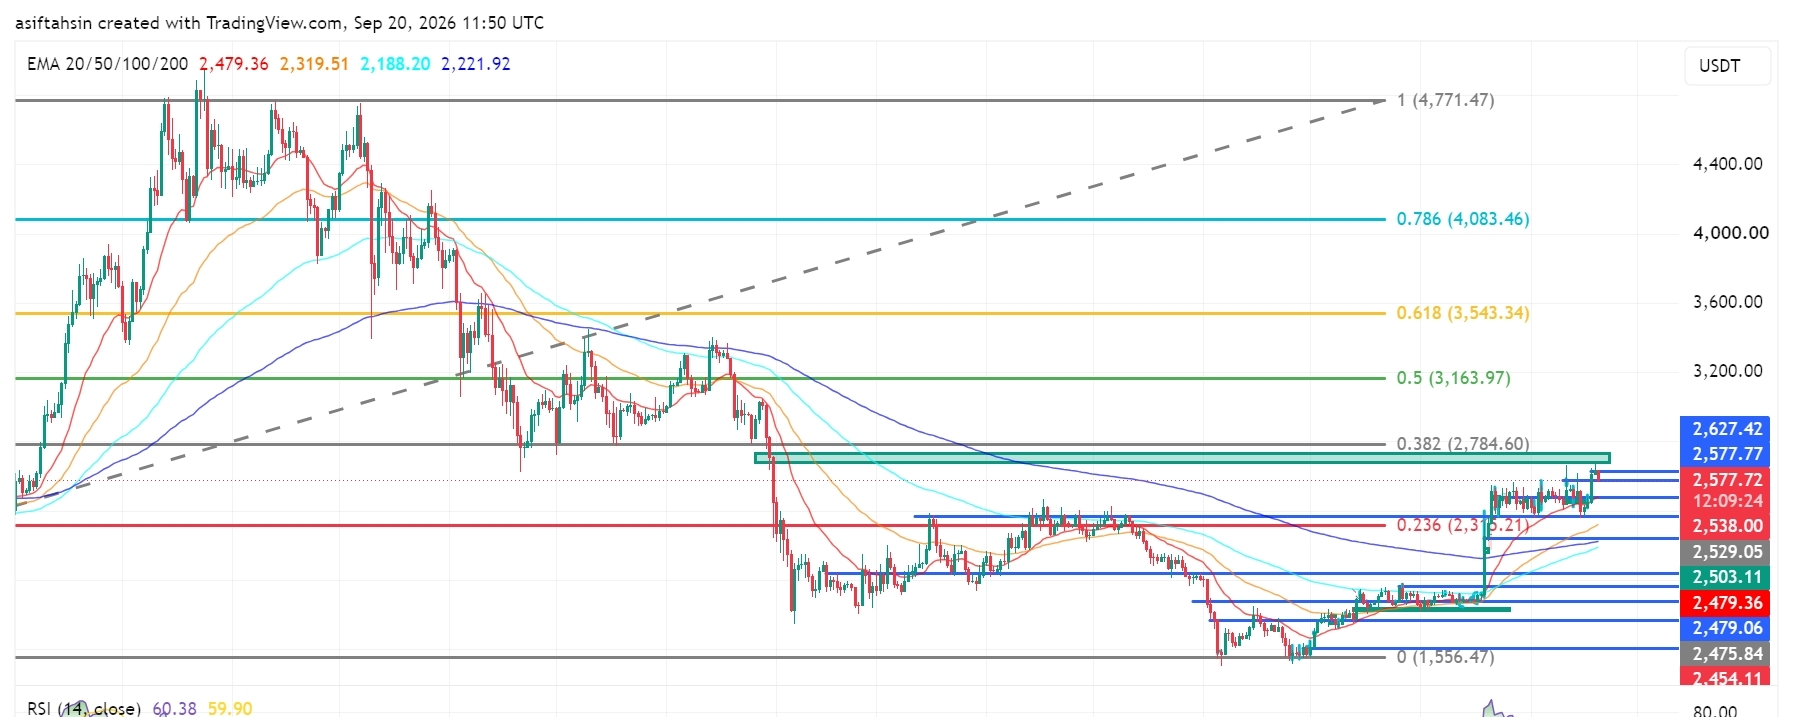
Perspectiva Técnica do ETH: Ethereum se mantém perto de US$ 2,58K enquanto a recuperação continuaO ETH está sendo negociado atualmente em torno de US$ 2.577, mantendo-se acima da área de suporte de US$ 2.500–US$ 2.540 após a recente recuperação da zona de demanda de US$ 2.280–US$ 2.360.
A estrutura de recuperação mais ampla continua construtiva, com o preço agora se aproximando da importante zona de resistência de US$ 2.627–US$ 2.785. O nível de US$ 2.784,60 é a principal referência de Fibonacci de 0,382 no gráfico.
📈 Estrutura da EMA
20 EMA: $2,479.36
50 EMA: $2,319.51
100 EMA: $2,188.20
200 EMA: $2,221.92
O ETH está sendo negociado atualmente bem acima da 20 EMA em US$ 2.479,36.
A recuperação acima da 50 EMA em US$ 2.319,51, 100 EMA em US$ 2.188,20 e 200 EMA em US$ 2.221,92 mantém a estrutura de recuperação mais ampla construtiva.
Perspectiva Técnica do ETH: Ethereum se mantém perto de US$ 2,58K enquanto a recuperação continua
O ETH está sendo negociado atualmente em torno de US$ 2.577, mantendo-se acima da área de suporte de US$ 2.500–US$ 2.540 após a recente recuperação da zona de demanda de US$ 2.280–US$ 2.360.
A estrutura de recuperação mais ampla continua construtiva, com o preço agora se aproximando da importante zona de resistência de US$ 2.627–US$ 2.785. O nível de US$ 2.784,60 é a principal referência de Fibonacci de 0,382 no gráfico.
📈 Estrutura da EMA
20 EMA: $2,479.36
50 EMA: $2,319.51
100 EMA: $2,188.20
200 EMA: $2,221.92
O ETH está sendo negociado atualmente bem acima da 20 EMA em US$ 2.479,36.
A recuperação acima da 50 EMA em US$ 2.319,51, 100 EMA em US$ 2.188,20 e 200 EMA em US$ 2.221,92 mantém a estrutura de recuperação mais ampla construtiva.
A estrutura de recuperação mais ampla continua construtiva, com o preço agora se aproximando da importante zona de resistência de US$ 2.627–US$ 2.785. O nível de US$ 2.784,60 é a principal referência de Fibonacci de 0,382 no gráfico.
📈 Estrutura da EMA
20 EMA: $2,479.36
50 EMA: $2,319.51
100 EMA: $2,188.20
200 EMA: $2,221.92
O ETH está sendo negociado atualmente bem acima da 20 EMA em US$ 2.479,36.
A recuperação acima da 50 EMA em US$ 2.319,51, 100 EMA em US$ 2.188,20 e 200 EMA em US$ 2.221,92 mantém a estrutura de recuperação mais ampla construtiva.
65
·
--
Artigo
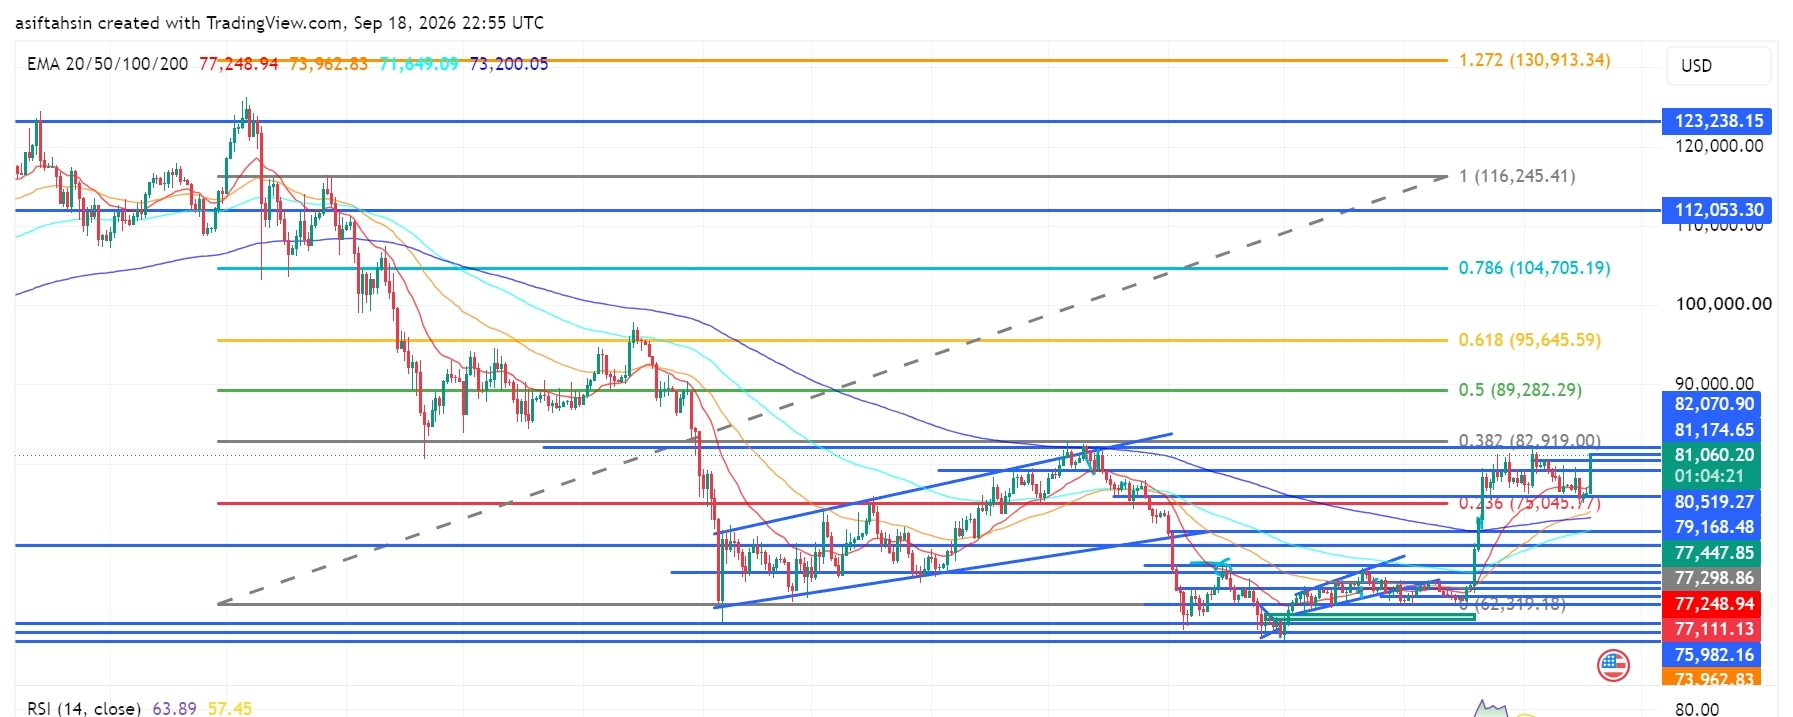
Perspectiva Técnica do BTC: Bitcoin Recupera US$ 81 mil à medida que a Estrutura da Recuperação se FortaleceAtualmente, o BTC está sendo negociado em torno de US$ 81.060, mantendo-se acima da região de US$ 79.000–US$ 80.000 após a recente recuperação da zona de demanda de US$ 73.000–US$ 76.000.
A estrutura mais ampla melhorou, com o preço recuperando a faixa de US$ 80 mil e voltando em direção à zona de resistência principal de US$ 82.070–US$ 82.919. Um movimento sustentado através dessa área traria novamente os níveis de Fibonacci mais altos para o foco.
📈 Estrutura da Média Móvel Exponencial (EMA)
20 EMA: US$ 77.248,95
50 EMA: US$ 73.962,83
100 EMA: US$ 71.649,09
200 EMA: US$ 73.200,05
Atualmente, o BTC está sendo negociado bem acima da 20 EMA em US$ 77.248,95.
Perspectiva Técnica do BTC: Bitcoin Recupera US$ 81 mil à medida que a Estrutura da Recuperação se Fortalece
Atualmente, o BTC está sendo negociado em torno de US$ 81.060, mantendo-se acima da região de US$ 79.000–US$ 80.000 após a recente recuperação da zona de demanda de US$ 73.000–US$ 76.000.
A estrutura mais ampla melhorou, com o preço recuperando a faixa de US$ 80 mil e voltando em direção à zona de resistência principal de US$ 82.070–US$ 82.919. Um movimento sustentado através dessa área traria novamente os níveis de Fibonacci mais altos para o foco.
📈 Estrutura da Média Móvel Exponencial (EMA)
20 EMA: US$ 77.248,95
50 EMA: US$ 73.962,83
100 EMA: US$ 71.649,09
200 EMA: US$ 73.200,05
Atualmente, o BTC está sendo negociado bem acima da 20 EMA em US$ 77.248,95.
A estrutura mais ampla melhorou, com o preço recuperando a faixa de US$ 80 mil e voltando em direção à zona de resistência principal de US$ 82.070–US$ 82.919. Um movimento sustentado através dessa área traria novamente os níveis de Fibonacci mais altos para o foco.
📈 Estrutura da Média Móvel Exponencial (EMA)
20 EMA: US$ 77.248,95
50 EMA: US$ 73.962,83
100 EMA: US$ 71.649,09
200 EMA: US$ 73.200,05
Atualmente, o BTC está sendo negociado bem acima da 20 EMA em US$ 77.248,95.
12
·
--
Artigo
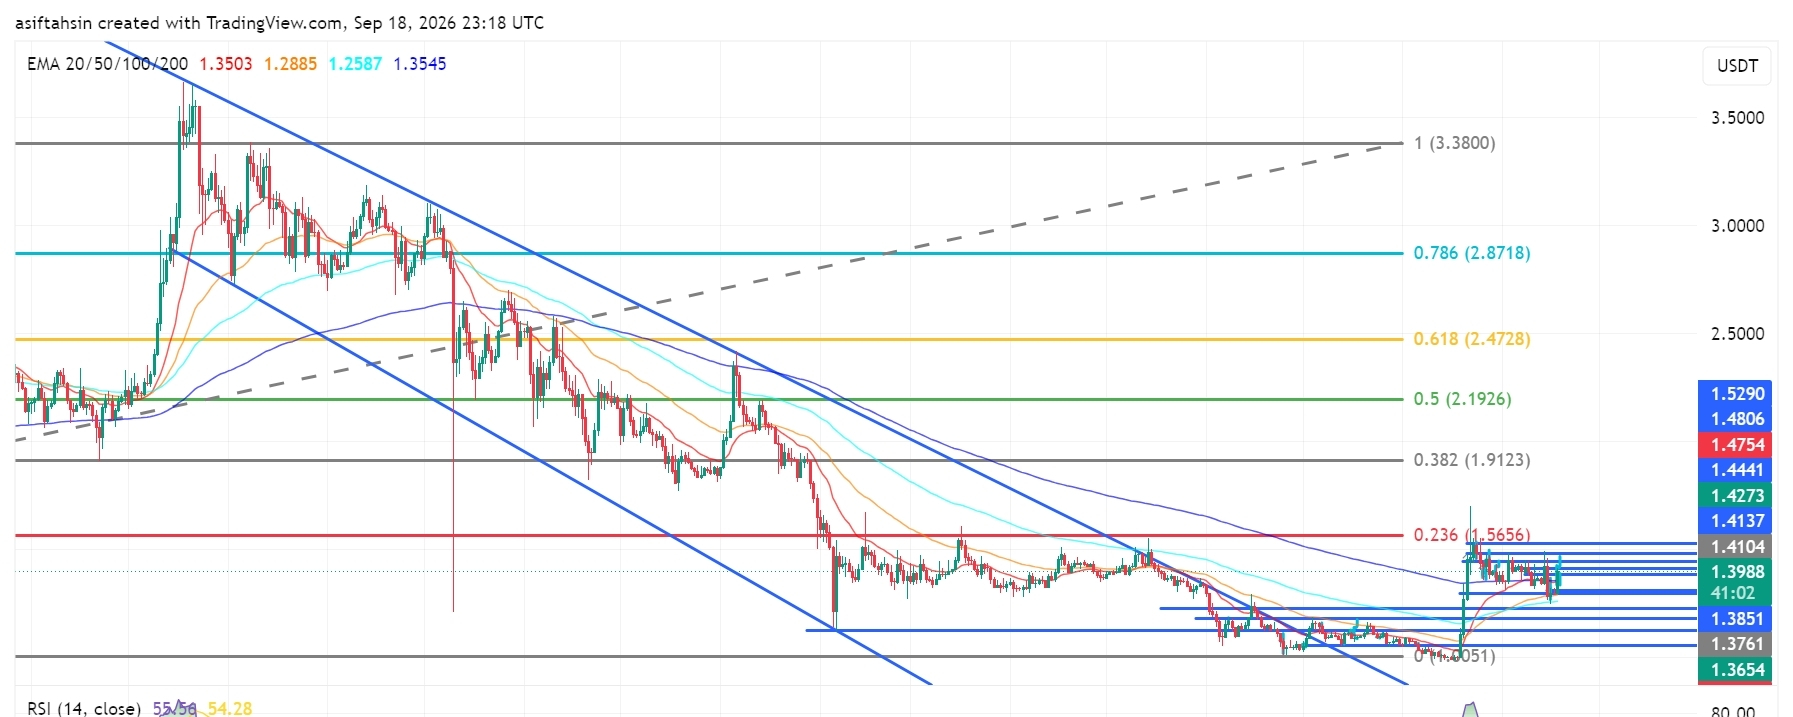
Perspectiva Técnica do XRP: XRP Mantém-se Próximo de $1.40 Enquanto os Touros Defendem a RupturaO XRP está atualmente por volta de $1.40, consolidando após uma forte recuperação das mínimas de agosto e uma ruptura acentuada da estrutura descendente anterior.
A estrutura mais ampla melhorou significativamente, com o XRP sendo negociado acima das EMAs de 20, 50 e 100. No entanto, o preço agora enfrenta um importante cluster de resistência na faixa de $1.41–$1.43. Os touros precisam de uma ruptura limpa acima dessa zona para confirmar uma nova expansão para cima.
📈 Estrutura das EMAs
20 EMA: $1.3503
50 EMA: $1.2885
100 EMA: $1.2586
200 EMA: $1.3545
O XRP está atualmente sendo negociado acima de todas as quatro principais EMAs, mantendo a estrutura de recuperação construtiva.
Perspectiva Técnica do XRP: XRP Mantém-se Próximo de $1.40 Enquanto os Touros Defendem a Ruptura
O XRP está atualmente por volta de $1.40, consolidando após uma forte recuperação das mínimas de agosto e uma ruptura acentuada da estrutura descendente anterior.
A estrutura mais ampla melhorou significativamente, com o XRP sendo negociado acima das EMAs de 20, 50 e 100. No entanto, o preço agora enfrenta um importante cluster de resistência na faixa de $1.41–$1.43. Os touros precisam de uma ruptura limpa acima dessa zona para confirmar uma nova expansão para cima.
📈 Estrutura das EMAs
20 EMA: $1.3503
50 EMA: $1.2885
100 EMA: $1.2586
200 EMA: $1.3545
O XRP está atualmente sendo negociado acima de todas as quatro principais EMAs, mantendo a estrutura de recuperação construtiva.
A estrutura mais ampla melhorou significativamente, com o XRP sendo negociado acima das EMAs de 20, 50 e 100. No entanto, o preço agora enfrenta um importante cluster de resistência na faixa de $1.41–$1.43. Os touros precisam de uma ruptura limpa acima dessa zona para confirmar uma nova expansão para cima.
📈 Estrutura das EMAs
20 EMA: $1.3503
50 EMA: $1.2885
100 EMA: $1.2586
200 EMA: $1.3545
O XRP está atualmente sendo negociado acima de todas as quatro principais EMAs, mantendo a estrutura de recuperação construtiva.
276
·
--
Artigo
Ver tradução
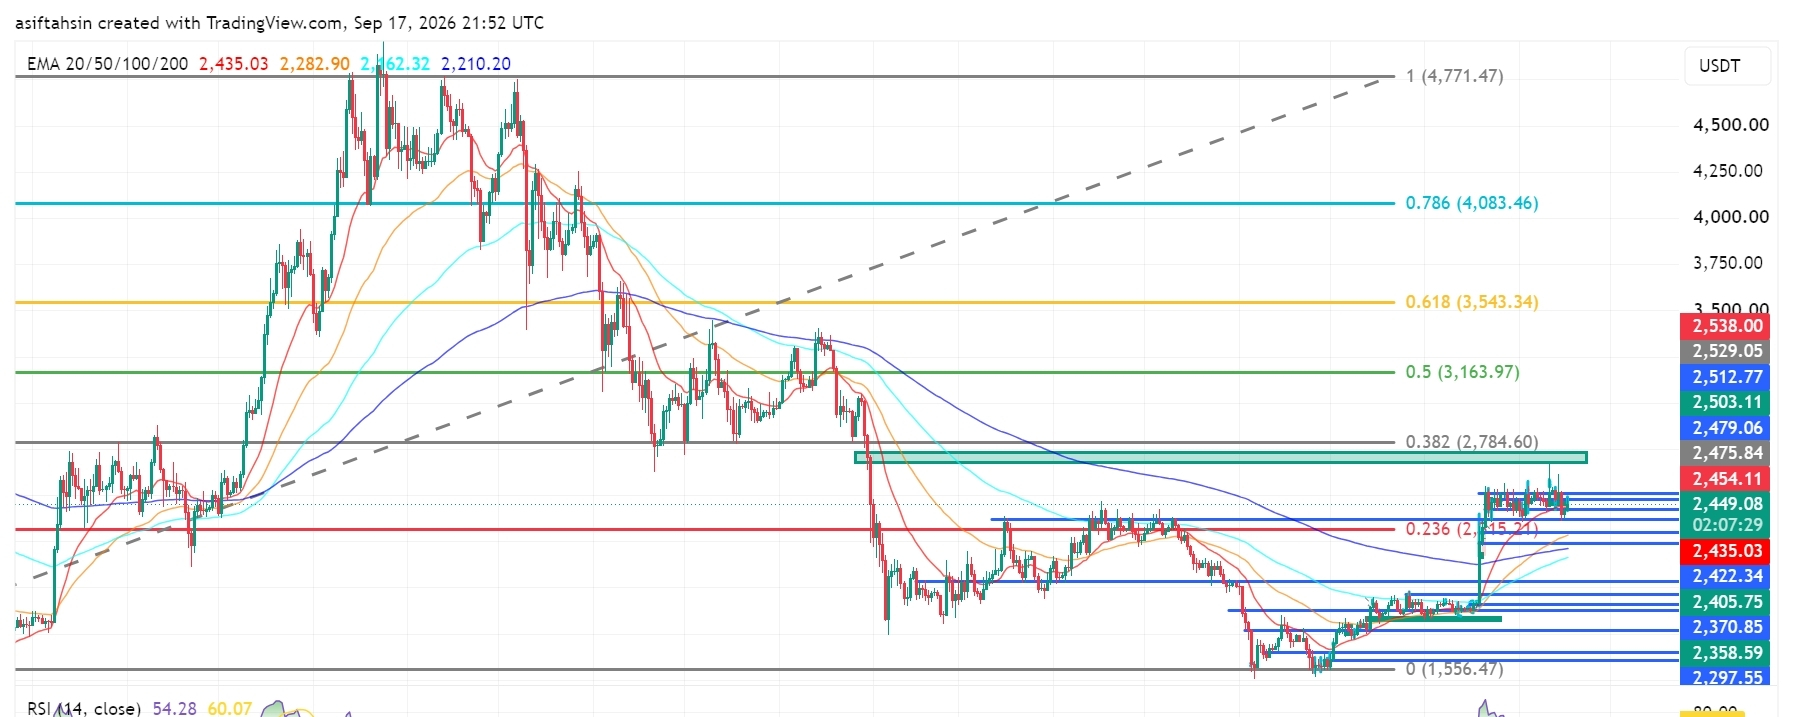
ETH Technical Outlook: Ethereum Holds Above $2.4K as Recovery Structure BuildsETH is currently trading around $2,450, holding above the $2,405–$2,435 support area after the recent recovery from the $2,300–$2,360 demand zone.
The broader structure is improving, but ETH is now consolidating below the $2,475–$2,538 resistance cluster. The next major chart area is around $2,784.60, which aligns with the 0.382 Fibonacci level.
📈 EMA Structure
20 EMA: $2,435.06
50 EMA: $2,282.92
100 EMA: $2,162.32
200 EMA: $2,210.20
ETH is currently trading above the 20 EMA at $2,435.06.
The recovery above the 50 EMA at $2,282.92, 100 EMA at $2,162.32, and 200 EMA at $2,210.20 keeps the broader recovery structure constructive.
A sustained hold above the 20 EMA would support short-term momentum, while losing the $2,210–$2,283 area would weaken the current structure.
📐 Fibonacci Levels
Key Fibonacci levels:
0.236: $2,315.21
0.382: $2,784.60
0.5: $3,163.97
0.618: $3,543.34
0.786: $4,083.46
1.0: $4,771.47
ETH is currently holding well above the 0.236 Fibonacci level at $2,315.21.
The next major Fibonacci resistance is $2,784.60 — 0.382 Fib.
A sustained move through the $2,475–$2,538 resistance structure could place the $2,784.60 region into focus.
🟢 Bullish Scenario
ETH is consolidating after the recent recovery and is currently holding above the $2,435 area.
Immediate resistance:
$2,454.11
$2,475.84
$2,479.06
$2,503.11
$2,512.77
$2,529.05
$2,538.00
$2,784.60 — 0.382 Fibonacci
A clean breakout and sustained close above the $2,529–$2,538 zone would provide stronger confirmation of continued recovery.
🎯 Target 1: $2,475.84
🎯 Target 2: $2,503.11
🎯 Target 3: $2,529.05
🎯 Target 4: $2,538.00
🎯 Target 5: $2,784.60 — 0.382 Fibonacci
🎯 Target 6: $3,163.97 — 0.5 Fibonacci
A confirmed move above $2,538 could strengthen the medium-term recovery structure and bring the $2,784–$3,164 region into focus.
🔴 Pullback Scenario
After the recent recovery, a retest of the breakout area would be normal.
Key supports:
$2,449.37
$2,435.06 — 20 EMA
$2,422.34
$2,405.75
$2,370.85
$2,358.59
$2,297.55
$2,282.92 — 50 EMA
$2,210.20 — 200 EMA
The $2,405–$2,435 zone is particularly important.
If ETH continues to hold this area during a pullback, the current recovery structure remains active.
A sustained loss of $2,282.92 would weaken the broader structure and could expose the $2,210–$2,162 area.
🧠 Market Structure & Liquidity
ETH has formed a clear recovery structure after sweeping liquidity around the $2,280–$2,360 region.
The recent move produced a strong recovery followed by a breakout above the previous consolidation area.
ETH is now moving through an important:
Recovery → Breakout → Retest → Consolidation
structure.
The major upside liquidity is concentrated around $2,475–$2,538. A decisive move through this zone would place $2,784.60 as the next major Fibonacci reference.
📊 RSI Momentum
RSI (14): 54.28
RSI remains above the neutral 50 level after the recent recovery.
The current reading shows moderately positive momentum, while the RSI signal line is around 60.07.
A sustained RSI move above 55–60 would indicate improving momentum toward the upper resistance area.
A move back below 50 would indicate increasing short-term momentum weakness.
🎯 Key Levels
🔴 Major Resistance: $2,454.11 → $2,475.84 → $2,503.11 → $2,529.05 → $2,538.00
🟢 Major Support: $2,435.06 → $2,422.34 → $2,405.75 → $2,370.85 → $2,358.59
📉 Dynamic EMA Support: $2,435.06 — 20 EMA | $2,282.92 — 50 EMA | $2,210.20 — 200 EMA | $2,162.32 — 100 EMA
🚀 Upside References: $2,538 → $2,784.60 → $3,163.97 → $3,543.34
📌 Final Outlook
ETH's broader structure remains constructive after the recent recovery, with price holding above the $2,405–$2,435 area.
The $2,405–$2,435 zone is now an important short-term support region. As long as ETH maintains this area, the current recovery structure remains active.
The immediate battle is around $2,475–$2,538. A confirmed move above $2,538 could open the path toward $2,784.60, followed by $3,163.97.
However, rejection from resistance followed by a sustained loss of $2,282.92 would weaken the broader structure and increase the possibility of a deeper retracement toward the $2,210–$2,162 area.
Bias: 🟢 Recovery structure intact above $2,282.92. A breakout above $2,538 could open the path toward $2,784.60, with $3,163.97 as the next major Fibonacci reference.
$ETH
{future}(ETHUSDT)
ETH Technical Outlook: Ethereum Holds Above $2.4K as Recovery Structure Builds
ETH is currently trading around $2,450, holding above the $2,405–$2,435 support area after the recent recovery from the $2,300–$2,360 demand zone.
The broader structure is improving, but ETH is now consolidating below the $2,475–$2,538 resistance cluster. The next major chart area is around $2,784.60, which aligns with the 0.382 Fibonacci level.
📈 EMA Structure
20 EMA: $2,435.06
50 EMA: $2,282.92
100 EMA: $2,162.32
200 EMA: $2,210.20
ETH is currently trading above the 20 EMA at $2,435.06.
The recovery above the 50 EMA at $2,282.92, 100 EMA at $2,162.32, and 200 EMA at $2,210.20 keeps the broader recovery structure constructive.
A sustained hold above the 20 EMA would support short-term momentum, while losing the $2,210–$2,283 area would weaken the current structure.
📐 Fibonacci Levels
Key Fibonacci levels:
0.236: $2,315.21
0.382: $2,784.60
0.5: $3,163.97
0.618: $3,543.34
0.786: $4,083.46
1.0: $4,771.47
ETH is currently holding well above the 0.236 Fibonacci level at $2,315.21.
The next major Fibonacci resistance is $2,784.60 — 0.382 Fib.
A sustained move through the $2,475–$2,538 resistance structure could place the $2,784.60 region into focus.
🟢 Bullish Scenario
ETH is consolidating after the recent recovery and is currently holding above the $2,435 area.
Immediate resistance:
$2,454.11
$2,475.84
$2,479.06
$2,503.11
$2,512.77
$2,529.05
$2,538.00
$2,784.60 — 0.382 Fibonacci
A clean breakout and sustained close above the $2,529–$2,538 zone would provide stronger confirmation of continued recovery.
🎯 Target 1: $2,475.84
🎯 Target 2: $2,503.11
🎯 Target 3: $2,529.05
🎯 Target 4: $2,538.00
🎯 Target 5: $2,784.60 — 0.382 Fibonacci
🎯 Target 6: $3,163.97 — 0.5 Fibonacci
A confirmed move above $2,538 could strengthen the medium-term recovery structure and bring the $2,784–$3,164 region into focus.
🔴 Pullback Scenario
After the recent recovery, a retest of the breakout area would be normal.
Key supports:
$2,449.37
$2,435.06 — 20 EMA
$2,422.34
$2,405.75
$2,370.85
$2,358.59
$2,297.55
$2,282.92 — 50 EMA
$2,210.20 — 200 EMA
The $2,405–$2,435 zone is particularly important.
If ETH continues to hold this area during a pullback, the current recovery structure remains active.
A sustained loss of $2,282.92 would weaken the broader structure and could expose the $2,210–$2,162 area.
🧠 Market Structure & Liquidity
ETH has formed a clear recovery structure after sweeping liquidity around the $2,280–$2,360 region.
The recent move produced a strong recovery followed by a breakout above the previous consolidation area.
ETH is now moving through an important:
Recovery → Breakout → Retest → Consolidation
structure.
The major upside liquidity is concentrated around $2,475–$2,538. A decisive move through this zone would place $2,784.60 as the next major Fibonacci reference.
📊 RSI Momentum
RSI (14): 54.28
RSI remains above the neutral 50 level after the recent recovery.
The current reading shows moderately positive momentum, while the RSI signal line is around 60.07.
A sustained RSI move above 55–60 would indicate improving momentum toward the upper resistance area.
A move back below 50 would indicate increasing short-term momentum weakness.
🎯 Key Levels
🔴 Major Resistance: $2,454.11 → $2,475.84 → $2,503.11 → $2,529.05 → $2,538.00
🟢 Major Support: $2,435.06 → $2,422.34 → $2,405.75 → $2,370.85 → $2,358.59
📉 Dynamic EMA Support: $2,435.06 — 20 EMA | $2,282.92 — 50 EMA | $2,210.20 — 200 EMA | $2,162.32 — 100 EMA
🚀 Upside References: $2,538 → $2,784.60 → $3,163.97 → $3,543.34
📌 Final Outlook
ETH's broader structure remains constructive after the recent recovery, with price holding above the $2,405–$2,435 area.
The $2,405–$2,435 zone is now an important short-term support region. As long as ETH maintains this area, the current recovery structure remains active.
The immediate battle is around $2,475–$2,538. A confirmed move above $2,538 could open the path toward $2,784.60, followed by $3,163.97.
However, rejection from resistance followed by a sustained loss of $2,282.92 would weaken the broader structure and increase the possibility of a deeper retracement toward the $2,210–$2,162 area.
Bias: 🟢 Recovery structure intact above $2,282.92. A breakout above $2,538 could open the path toward $2,784.60, with $3,163.97 as the next major Fibonacci reference.
$ETH
The broader structure is improving, but ETH is now consolidating below the $2,475–$2,538 resistance cluster. The next major chart area is around $2,784.60, which aligns with the 0.382 Fibonacci level.
📈 EMA Structure
20 EMA: $2,435.06
50 EMA: $2,282.92
100 EMA: $2,162.32
200 EMA: $2,210.20
ETH is currently trading above the 20 EMA at $2,435.06.
The recovery above the 50 EMA at $2,282.92, 100 EMA at $2,162.32, and 200 EMA at $2,210.20 keeps the broader recovery structure constructive.
A sustained hold above the 20 EMA would support short-term momentum, while losing the $2,210–$2,283 area would weaken the current structure.
📐 Fibonacci Levels
Key Fibonacci levels:
0.236: $2,315.21
0.382: $2,784.60
0.5: $3,163.97
0.618: $3,543.34
0.786: $4,083.46
1.0: $4,771.47
ETH is currently holding well above the 0.236 Fibonacci level at $2,315.21.
The next major Fibonacci resistance is $2,784.60 — 0.382 Fib.
A sustained move through the $2,475–$2,538 resistance structure could place the $2,784.60 region into focus.
🟢 Bullish Scenario
ETH is consolidating after the recent recovery and is currently holding above the $2,435 area.
Immediate resistance:
$2,454.11
$2,475.84
$2,479.06
$2,503.11
$2,512.77
$2,529.05
$2,538.00
$2,784.60 — 0.382 Fibonacci
A clean breakout and sustained close above the $2,529–$2,538 zone would provide stronger confirmation of continued recovery.
🎯 Target 1: $2,475.84
🎯 Target 2: $2,503.11
🎯 Target 3: $2,529.05
🎯 Target 4: $2,538.00
🎯 Target 5: $2,784.60 — 0.382 Fibonacci
🎯 Target 6: $3,163.97 — 0.5 Fibonacci
A confirmed move above $2,538 could strengthen the medium-term recovery structure and bring the $2,784–$3,164 region into focus.
🔴 Pullback Scenario
After the recent recovery, a retest of the breakout area would be normal.
Key supports:
$2,449.37
$2,435.06 — 20 EMA
$2,422.34
$2,405.75
$2,370.85
$2,358.59
$2,297.55
$2,282.92 — 50 EMA
$2,210.20 — 200 EMA
The $2,405–$2,435 zone is particularly important.
If ETH continues to hold this area during a pullback, the current recovery structure remains active.
A sustained loss of $2,282.92 would weaken the broader structure and could expose the $2,210–$2,162 area.
🧠 Market Structure & Liquidity
ETH has formed a clear recovery structure after sweeping liquidity around the $2,280–$2,360 region.
The recent move produced a strong recovery followed by a breakout above the previous consolidation area.
ETH is now moving through an important:
Recovery → Breakout → Retest → Consolidation
structure.
The major upside liquidity is concentrated around $2,475–$2,538. A decisive move through this zone would place $2,784.60 as the next major Fibonacci reference.
📊 RSI Momentum
RSI (14): 54.28
RSI remains above the neutral 50 level after the recent recovery.
The current reading shows moderately positive momentum, while the RSI signal line is around 60.07.
A sustained RSI move above 55–60 would indicate improving momentum toward the upper resistance area.
A move back below 50 would indicate increasing short-term momentum weakness.
🎯 Key Levels
🔴 Major Resistance: $2,454.11 → $2,475.84 → $2,503.11 → $2,529.05 → $2,538.00
🟢 Major Support: $2,435.06 → $2,422.34 → $2,405.75 → $2,370.85 → $2,358.59
📉 Dynamic EMA Support: $2,435.06 — 20 EMA | $2,282.92 — 50 EMA | $2,210.20 — 200 EMA | $2,162.32 — 100 EMA
🚀 Upside References: $2,538 → $2,784.60 → $3,163.97 → $3,543.34
📌 Final Outlook
ETH's broader structure remains constructive after the recent recovery, with price holding above the $2,405–$2,435 area.
The $2,405–$2,435 zone is now an important short-term support region. As long as ETH maintains this area, the current recovery structure remains active.
The immediate battle is around $2,475–$2,538. A confirmed move above $2,538 could open the path toward $2,784.60, followed by $3,163.97.
However, rejection from resistance followed by a sustained loss of $2,282.92 would weaken the broader structure and increase the possibility of a deeper retracement toward the $2,210–$2,162 area.
Bias: 🟢 Recovery structure intact above $2,282.92. A breakout above $2,538 could open the path toward $2,784.60, with $3,163.97 as the next major Fibonacci reference.
$ETH
75
·
--
Artigo
Ver tradução
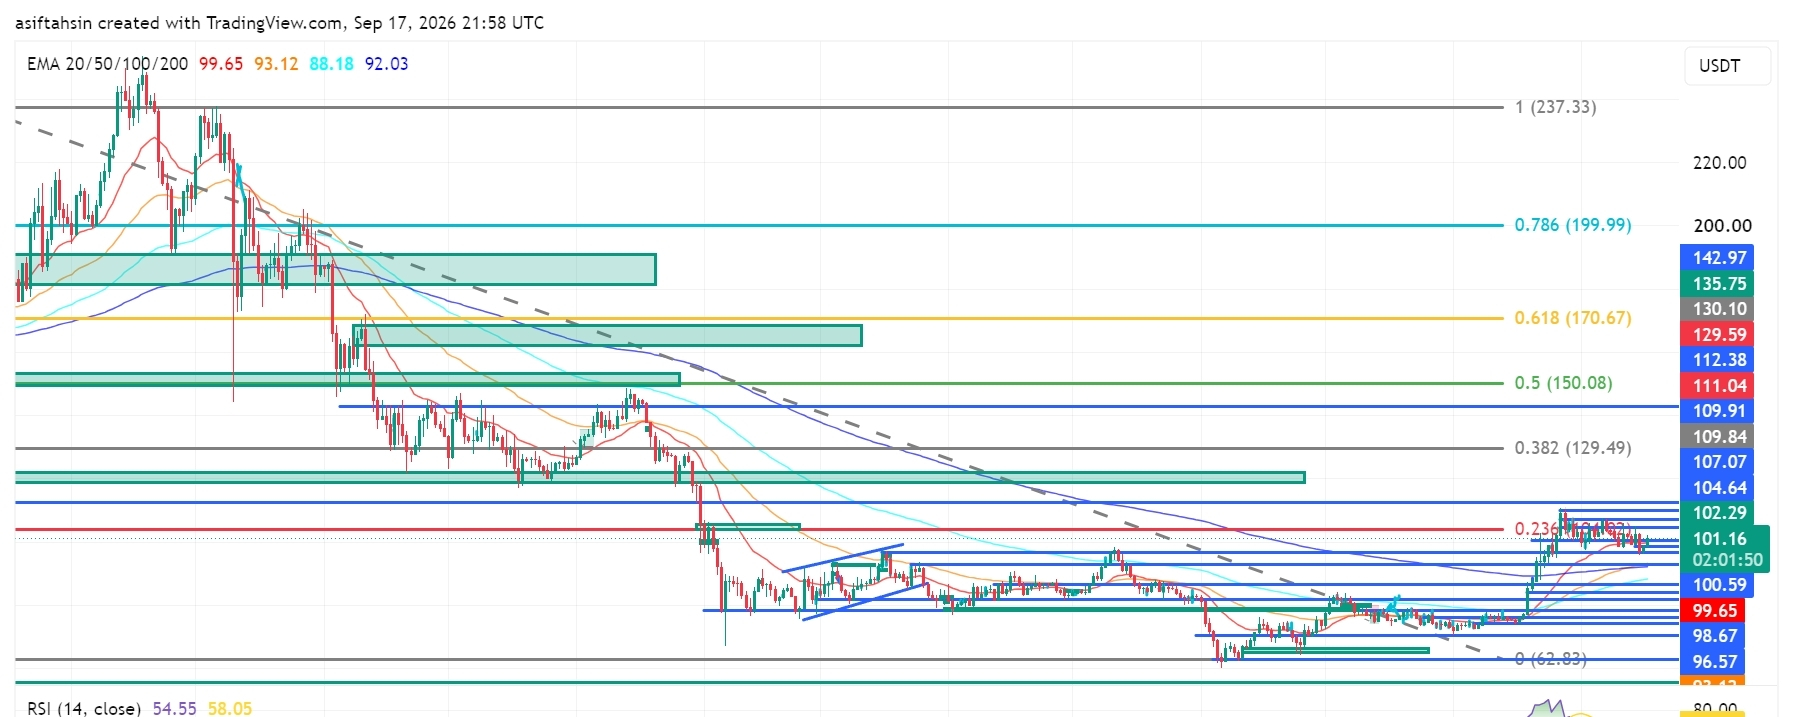
SOL Technical Outlook: Solana Holds Above $100 as Bulls Defend the RecoverySOL is currently trading around $101.16, holding above the $99–$100 breakout zone after the recent bullish expansion from the $92–$94 demand area.
The broader recovery structure remains constructive, but SOL is now consolidating below the $102.29–$107.07 resistance cluster. Bulls need to reclaim this area and break the $109.91–$112.38 zone for the next major upside expansion.
📈 EMA Structure
- 20 EMA: $99.65
- 50 EMA: $93.12
- 100 EMA: $88.18
- 200 EMA: $92.03
SOL is currently trading above the 20 EMA at $99.65.
The recovery above the 50 EMA at $93.12 and 200 EMA at $92.03 keeps the broader recovery structure intact.
A sustained hold above the 20 EMA would support short-term momentum, while losing the $93.12–$92.03 area would weaken the current structure.
📐 Fibonacci Levels
Key Fibonacci levels:
- 0.236: $104.64
- 0.382: $129.49
- 0.5: $150.08
- 0.618: $170.67
- 0.786: $199.99
- 1.0: $237.33
SOL is currently trading below the 0.236 Fibonacci level at $104.64.
The next major Fibonacci resistance is $129.49 — 0.382 Fib.
A sustained breakout through the $104–$112 resistance structure could open the path toward the $129.49 region.
🟢 Bullish Scenario
SOL is consolidating after the recent recovery and is currently maintaining acceptance above the $100 area.
Immediate resistance:
- $102.29
- $104.64 — 0.236 Fibonacci
- $107.07
- $109.84
- $109.91
- $111.04
- $112.38
A clean breakout and sustained close above $111.04–$112.38 would provide stronger confirmation of bullish continuation.
🎯 Target 1: $104.64
🎯 Target 2: $107.07
🎯 Target 3: $109.91
🎯 Target 4: $112.38
🎯 Target 5: $129.49 — 0.382 Fibonacci
🎯 Target 6: $150.08 — 0.5 Fibonacci
A confirmed breakout above the $111–$112 zone could strengthen the medium-term recovery structure and potentially accelerate SOL toward the $129–$150 region.
🔴 Pullback Scenario
After the recent bullish expansion, a retest of the breakout area would be normal.
Key supports:
- $100.59
- $99.65 — 20 EMA
- $98.67
- $96.57
- $93.12 — 50 EMA
- $92.94
- $92.03 — 200 EMA
- $88.18 — 100 EMA
The $96–$100 zone is particularly important.
If SOL continues to hold this area during a pullback, the current recovery structure remains active.
A sustained loss of $92.03 would weaken the current structure and could expose the $88.18 support zone.
🧠 Market Structure & Liquidity
SOL has formed a clear recovery structure after sweeping liquidity around the $92–$94 demand region.
The recent move produced a market-structure shift followed by a breakout and higher-low formation.
SOL is now moving through an important:
Breakout → Retest → Consolidation → Continuation
structure.
The major upside liquidity is concentrated around $102–$112. A decisive breakout above this zone would place $129.49 as the next major Fibonacci reference.
📊 RSI Momentum
RSI (14): 54.55
RSI remains above the neutral 50 level after cooling from the recent bullish expansion.
The current reading shows moderately positive momentum without reaching an extreme zone.
A sustained RSI move above 55–60 would indicate improving momentum toward the upper resistance area.
A move back below 50 would indicate increasing short-term momentum weakness.
🎯 Key Levels
🔴 Major Resistance: $102.29 → $104.64 → $107.07 → $109.91 → $111.04 → $112.38
🟢 Major Support: $100.59 → $99.65 → $98.67 → $96.57 → $93.12 → $92.03
📉 Dynamic EMA Support: $99.65 — 20 EMA | $93.12 — 50 EMA | $92.03 — 200 EMA | $88.18 — 100 EMA
🚀 Upside Targets: $112.38 → $129.49 → $150.08 → $170.67
📌 Final Outlook
SOL's broader structure remains constructive after the recent breakout, with price holding above the $99–$100 region.
The $96–$100 area is now an important short-term support region. As long as SOL maintains this area, the current recovery structure remains active.
The immediate battle is around $102–$112. A confirmed breakout above $112.38 could open the path toward $129.49, followed by $150.08 and potentially $170.67.
However, rejection from resistance followed by a sustained loss of $92.03 would weaken the current structure and increase the possibility of a deeper retracement toward the $88.18 area.
Bias: 🟢 Recovery structure intact above $92.03. A breakout above $112.38 could open the path toward $129.49, with $150.08 as the next major Fibonacci target.
$SOL
{future}(SOLUSDT)
SOL Technical Outlook: Solana Holds Above $100 as Bulls Defend the Recovery
SOL is currently trading around $101.16, holding above the $99–$100 breakout zone after the recent bullish expansion from the $92–$94 demand area.
The broader recovery structure remains constructive, but SOL is now consolidating below the $102.29–$107.07 resistance cluster. Bulls need to reclaim this area and break the $109.91–$112.38 zone for the next major upside expansion.
📈 EMA Structure
- 20 EMA: $99.65
- 50 EMA: $93.12
- 100 EMA: $88.18
- 200 EMA: $92.03
SOL is currently trading above the 20 EMA at $99.65.
The recovery above the 50 EMA at $93.12 and 200 EMA at $92.03 keeps the broader recovery structure intact.
A sustained hold above the 20 EMA would support short-term momentum, while losing the $93.12–$92.03 area would weaken the current structure.
📐 Fibonacci Levels
Key Fibonacci levels:
- 0.236: $104.64
- 0.382: $129.49
- 0.5: $150.08
- 0.618: $170.67
- 0.786: $199.99
- 1.0: $237.33
SOL is currently trading below the 0.236 Fibonacci level at $104.64.
The next major Fibonacci resistance is $129.49 — 0.382 Fib.
A sustained breakout through the $104–$112 resistance structure could open the path toward the $129.49 region.
🟢 Bullish Scenario
SOL is consolidating after the recent recovery and is currently maintaining acceptance above the $100 area.
Immediate resistance:
- $102.29
- $104.64 — 0.236 Fibonacci
- $107.07
- $109.84
- $109.91
- $111.04
- $112.38
A clean breakout and sustained close above $111.04–$112.38 would provide stronger confirmation of bullish continuation.
🎯 Target 1: $104.64
🎯 Target 2: $107.07
🎯 Target 3: $109.91
🎯 Target 4: $112.38
🎯 Target 5: $129.49 — 0.382 Fibonacci
🎯 Target 6: $150.08 — 0.5 Fibonacci
A confirmed breakout above the $111–$112 zone could strengthen the medium-term recovery structure and potentially accelerate SOL toward the $129–$150 region.
🔴 Pullback Scenario
After the recent bullish expansion, a retest of the breakout area would be normal.
Key supports:
- $100.59
- $99.65 — 20 EMA
- $98.67
- $96.57
- $93.12 — 50 EMA
- $92.94
- $92.03 — 200 EMA
- $88.18 — 100 EMA
The $96–$100 zone is particularly important.
If SOL continues to hold this area during a pullback, the current recovery structure remains active.
A sustained loss of $92.03 would weaken the current structure and could expose the $88.18 support zone.
🧠 Market Structure & Liquidity
SOL has formed a clear recovery structure after sweeping liquidity around the $92–$94 demand region.
The recent move produced a market-structure shift followed by a breakout and higher-low formation.
SOL is now moving through an important:
Breakout → Retest → Consolidation → Continuation
structure.
The major upside liquidity is concentrated around $102–$112. A decisive breakout above this zone would place $129.49 as the next major Fibonacci reference.
📊 RSI Momentum
RSI (14): 54.55
RSI remains above the neutral 50 level after cooling from the recent bullish expansion.
The current reading shows moderately positive momentum without reaching an extreme zone.
A sustained RSI move above 55–60 would indicate improving momentum toward the upper resistance area.
A move back below 50 would indicate increasing short-term momentum weakness.
🎯 Key Levels
🔴 Major Resistance: $102.29 → $104.64 → $107.07 → $109.91 → $111.04 → $112.38
🟢 Major Support: $100.59 → $99.65 → $98.67 → $96.57 → $93.12 → $92.03
📉 Dynamic EMA Support: $99.65 — 20 EMA | $93.12 — 50 EMA | $92.03 — 200 EMA | $88.18 — 100 EMA
🚀 Upside Targets: $112.38 → $129.49 → $150.08 → $170.67
📌 Final Outlook
SOL's broader structure remains constructive after the recent breakout, with price holding above the $99–$100 region.
The $96–$100 area is now an important short-term support region. As long as SOL maintains this area, the current recovery structure remains active.
The immediate battle is around $102–$112. A confirmed breakout above $112.38 could open the path toward $129.49, followed by $150.08 and potentially $170.67.
However, rejection from resistance followed by a sustained loss of $92.03 would weaken the current structure and increase the possibility of a deeper retracement toward the $88.18 area.
Bias: 🟢 Recovery structure intact above $92.03. A breakout above $112.38 could open the path toward $129.49, with $150.08 as the next major Fibonacci target.
$SOL
The broader recovery structure remains constructive, but SOL is now consolidating below the $102.29–$107.07 resistance cluster. Bulls need to reclaim this area and break the $109.91–$112.38 zone for the next major upside expansion.
📈 EMA Structure
- 20 EMA: $99.65
- 50 EMA: $93.12
- 100 EMA: $88.18
- 200 EMA: $92.03
SOL is currently trading above the 20 EMA at $99.65.
The recovery above the 50 EMA at $93.12 and 200 EMA at $92.03 keeps the broader recovery structure intact.
A sustained hold above the 20 EMA would support short-term momentum, while losing the $93.12–$92.03 area would weaken the current structure.
📐 Fibonacci Levels
Key Fibonacci levels:
- 0.236: $104.64
- 0.382: $129.49
- 0.5: $150.08
- 0.618: $170.67
- 0.786: $199.99
- 1.0: $237.33
SOL is currently trading below the 0.236 Fibonacci level at $104.64.
The next major Fibonacci resistance is $129.49 — 0.382 Fib.
A sustained breakout through the $104–$112 resistance structure could open the path toward the $129.49 region.
🟢 Bullish Scenario
SOL is consolidating after the recent recovery and is currently maintaining acceptance above the $100 area.
Immediate resistance:
- $102.29
- $104.64 — 0.236 Fibonacci
- $107.07
- $109.84
- $109.91
- $111.04
- $112.38
A clean breakout and sustained close above $111.04–$112.38 would provide stronger confirmation of bullish continuation.
🎯 Target 1: $104.64
🎯 Target 2: $107.07
🎯 Target 3: $109.91
🎯 Target 4: $112.38
🎯 Target 5: $129.49 — 0.382 Fibonacci
🎯 Target 6: $150.08 — 0.5 Fibonacci
A confirmed breakout above the $111–$112 zone could strengthen the medium-term recovery structure and potentially accelerate SOL toward the $129–$150 region.
🔴 Pullback Scenario
After the recent bullish expansion, a retest of the breakout area would be normal.
Key supports:
- $100.59
- $99.65 — 20 EMA
- $98.67
- $96.57
- $93.12 — 50 EMA
- $92.94
- $92.03 — 200 EMA
- $88.18 — 100 EMA
The $96–$100 zone is particularly important.
If SOL continues to hold this area during a pullback, the current recovery structure remains active.
A sustained loss of $92.03 would weaken the current structure and could expose the $88.18 support zone.
🧠 Market Structure & Liquidity
SOL has formed a clear recovery structure after sweeping liquidity around the $92–$94 demand region.
The recent move produced a market-structure shift followed by a breakout and higher-low formation.
SOL is now moving through an important:
Breakout → Retest → Consolidation → Continuation
structure.
The major upside liquidity is concentrated around $102–$112. A decisive breakout above this zone would place $129.49 as the next major Fibonacci reference.
📊 RSI Momentum
RSI (14): 54.55
RSI remains above the neutral 50 level after cooling from the recent bullish expansion.
The current reading shows moderately positive momentum without reaching an extreme zone.
A sustained RSI move above 55–60 would indicate improving momentum toward the upper resistance area.
A move back below 50 would indicate increasing short-term momentum weakness.
🎯 Key Levels
🔴 Major Resistance: $102.29 → $104.64 → $107.07 → $109.91 → $111.04 → $112.38
🟢 Major Support: $100.59 → $99.65 → $98.67 → $96.57 → $93.12 → $92.03
📉 Dynamic EMA Support: $99.65 — 20 EMA | $93.12 — 50 EMA | $92.03 — 200 EMA | $88.18 — 100 EMA
🚀 Upside Targets: $112.38 → $129.49 → $150.08 → $170.67
📌 Final Outlook
SOL's broader structure remains constructive after the recent breakout, with price holding above the $99–$100 region.
The $96–$100 area is now an important short-term support region. As long as SOL maintains this area, the current recovery structure remains active.
The immediate battle is around $102–$112. A confirmed breakout above $112.38 could open the path toward $129.49, followed by $150.08 and potentially $170.67.
However, rejection from resistance followed by a sustained loss of $92.03 would weaken the current structure and increase the possibility of a deeper retracement toward the $88.18 area.
Bias: 🟢 Recovery structure intact above $92.03. A breakout above $112.38 could open the path toward $129.49, with $150.08 as the next major Fibonacci target.
$SOL
73
·
--
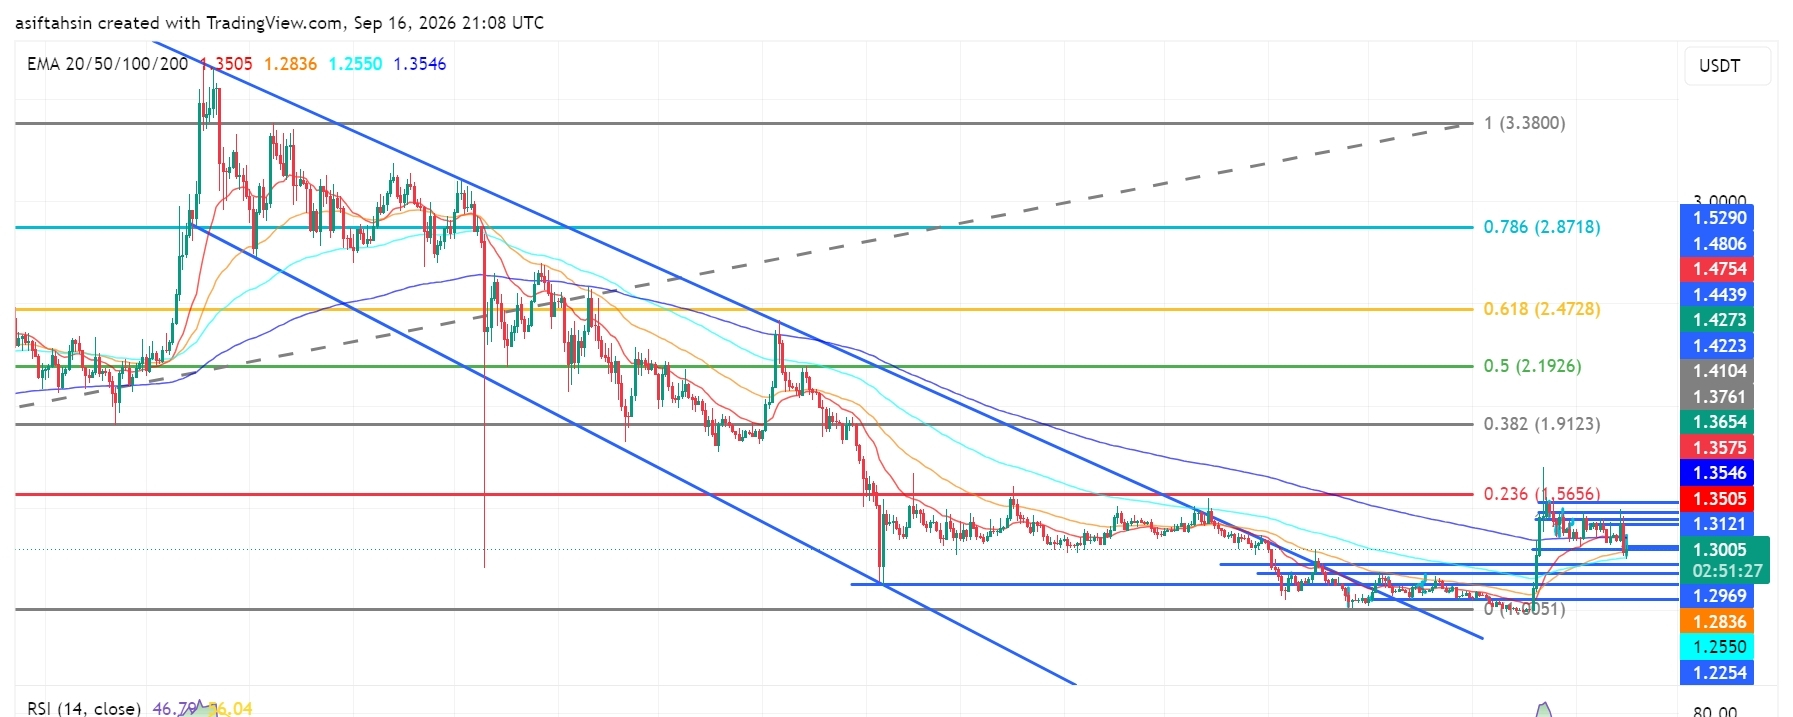
Artigo
Perspectiva Técnica da XRP: XRP Consolida Perto de US$ 1,30 Após Forte QuedaA XRP está sendo negociada em torno de US$ 1,30 no gráfico após uma forte rejeição da região de US$ 1,35–US$ 1,43. O preço voltou em direção à área de rompimento, enquanto o gráfico mais amplo ainda permanece em fase de recuperação da zona de US$ 1,20–US$ 1,25. O momentum atual é neutro, com o RSI abaixo de 50.
📈 Estrutura da EMA
20 EMA: US$ 1.3505
50 EMA: US$ 1.2836
100 EMA: US$ 1.2550
200 EMA: US$ 1.3546
A XRP está atualmente abaixo das EMAs de 20 e 200, enquanto as EMAs de 50 e 100 permanecem abaixo do preço. Recuperar a região de US$ 1,35 melhoraria a estrutura de curto prazo.
Perspectiva Técnica da XRP: XRP Consolida Perto de US$ 1,30 Após Forte Queda
A XRP está sendo negociada em torno de US$ 1,30 no gráfico após uma forte rejeição da região de US$ 1,35–US$ 1,43. O preço voltou em direção à área de rompimento, enquanto o gráfico mais amplo ainda permanece em fase de recuperação da zona de US$ 1,20–US$ 1,25. O momentum atual é neutro, com o RSI abaixo de 50.
📈 Estrutura da EMA
20 EMA: US$ 1.3505
50 EMA: US$ 1.2836
100 EMA: US$ 1.2550
200 EMA: US$ 1.3546
A XRP está atualmente abaixo das EMAs de 20 e 200, enquanto as EMAs de 50 e 100 permanecem abaixo do preço. Recuperar a região de US$ 1,35 melhoraria a estrutura de curto prazo.
📈 Estrutura da EMA
20 EMA: US$ 1.3505
50 EMA: US$ 1.2836
100 EMA: US$ 1.2550
200 EMA: US$ 1.3546
A XRP está atualmente abaixo das EMAs de 20 e 200, enquanto as EMAs de 50 e 100 permanecem abaixo do preço. Recuperar a região de US$ 1,35 melhoraria a estrutura de curto prazo.
1
3
787
·
--
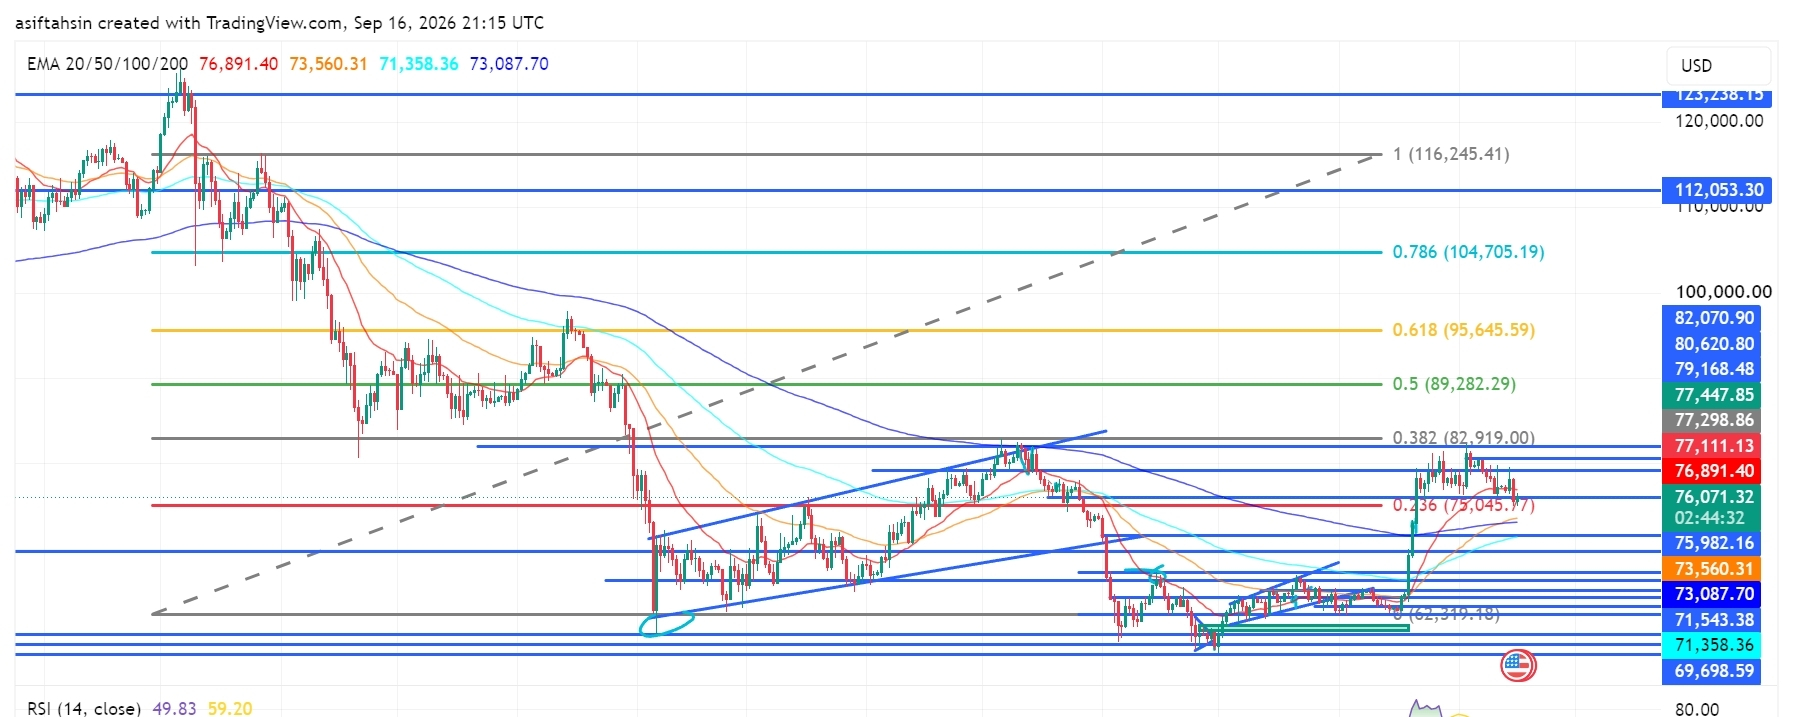
Artigo
Ver tradução
BTC Technical Outlook: Bitcoin Consolidates Below $77K as Bulls Defend the RecoveryBitcoin is trading around $76.9K, consolidating after the recent recovery from the $69K–$71K demand area. Price remains above the major $75K support zone, but momentum has cooled as BTC struggles below the $77.1K–$82.9K resistance region. The next breakout or breakdown should determine the short-term direction.
📈 EMA Structure
20 EMA: $76,891
50 EMA: $73,560
100 EMA: $71,358
200 EMA: $73,088
BTC is currently sitting around the 20 EMA, while the 50/100/200 EMAs remain below price. Holding above $75K keeps the broader recovery structure intact, but losing the 20 EMA could bring a deeper retest.
📐 Fibonacci Levels
0.236: $75,045
0.382: $82,919
0.5: $89,282
0.618: $95,646
0.786: $104,705
1.0: $116,245
The $75,045–$76K zone is the immediate defensive area. A clean break above $82,919 would open the higher Fibonacci levels.
🟢 Bullish Scenario
BTC needs to reclaim and hold above: $77,111 → $77,299 → $77,448 → $79,168 → $80,621 → $82,071
A decisive breakout above $82,919 would strengthen the recovery structure and expose: $89,282 → $95,646 → $104,705
🔴 Pullback Scenario
If BTC fails to reclaim the $77K area, watch: $76,071 → $75,982 → $75,045
A sustained breakdown below $75,045 would weaken the recovery and could bring $73,560 → $73,088 → $71,543 → $71,358 into focus.
🧠 Market Structure & Liquidity
The chart shows a strong recovery from the $69K–$71K demand zone, followed by a breakout toward $82K and now a consolidation phase.
BTC is currently trading between major liquidity zones. The $82K–$83K area remains significant overhead liquidity, while the $75K area is the key downside defense.
📊 RSI Momentum
RSI: 49.83
Momentum has cooled back toward neutral after the previous recovery. RSI remaining near 50 means BTC currently lacks strong directional momentum.
🎯 Key Levels
Resistance: $77,111 → $77,448 → $79,168 → $80,621 → $82,071 → $82,919
Support: $76,071 → $75,982 → $75,045 → $73,560 → $73,088 → $71,543
📌 Final Outlook
BTC remains in a recovery/consolidation structure above $75K, but bulls need to reclaim $77K–$80K and eventually break $82,919 to resume the larger upside move.
Above $82,919: $89,282 → $95,646 → $104,705
Below $75,045: recovery structure weakens and deeper support becomes relevant.
Recent market data also places BTC around the mid-$75K range, consistent with the chart’s key $75K support area.
$BTC
{future}(BTCUSDT)
BTC Technical Outlook: Bitcoin Consolidates Below $77K as Bulls Defend the Recovery
Bitcoin is trading around $76.9K, consolidating after the recent recovery from the $69K–$71K demand area. Price remains above the major $75K support zone, but momentum has cooled as BTC struggles below the $77.1K–$82.9K resistance region. The next breakout or breakdown should determine the short-term direction.
📈 EMA Structure
20 EMA: $76,891
50 EMA: $73,560
100 EMA: $71,358
200 EMA: $73,088
BTC is currently sitting around the 20 EMA, while the 50/100/200 EMAs remain below price. Holding above $75K keeps the broader recovery structure intact, but losing the 20 EMA could bring a deeper retest.
📐 Fibonacci Levels
0.236: $75,045
0.382: $82,919
0.5: $89,282
0.618: $95,646
0.786: $104,705
1.0: $116,245
The $75,045–$76K zone is the immediate defensive area. A clean break above $82,919 would open the higher Fibonacci levels.
🟢 Bullish Scenario
BTC needs to reclaim and hold above: $77,111 → $77,299 → $77,448 → $79,168 → $80,621 → $82,071
A decisive breakout above $82,919 would strengthen the recovery structure and expose: $89,282 → $95,646 → $104,705
🔴 Pullback Scenario
If BTC fails to reclaim the $77K area, watch: $76,071 → $75,982 → $75,045
A sustained breakdown below $75,045 would weaken the recovery and could bring $73,560 → $73,088 → $71,543 → $71,358 into focus.
🧠 Market Structure & Liquidity
The chart shows a strong recovery from the $69K–$71K demand zone, followed by a breakout toward $82K and now a consolidation phase.
BTC is currently trading between major liquidity zones. The $82K–$83K area remains significant overhead liquidity, while the $75K area is the key downside defense.
📊 RSI Momentum
RSI: 49.83
Momentum has cooled back toward neutral after the previous recovery. RSI remaining near 50 means BTC currently lacks strong directional momentum.
🎯 Key Levels
Resistance: $77,111 → $77,448 → $79,168 → $80,621 → $82,071 → $82,919
Support: $76,071 → $75,982 → $75,045 → $73,560 → $73,088 → $71,543
📌 Final Outlook
BTC remains in a recovery/consolidation structure above $75K, but bulls need to reclaim $77K–$80K and eventually break $82,919 to resume the larger upside move.
Above $82,919: $89,282 → $95,646 → $104,705
Below $75,045: recovery structure weakens and deeper support becomes relevant.
Recent market data also places BTC around the mid-$75K range, consistent with the chart’s key $75K support area.
$BTC
📈 EMA Structure
20 EMA: $76,891
50 EMA: $73,560
100 EMA: $71,358
200 EMA: $73,088
BTC is currently sitting around the 20 EMA, while the 50/100/200 EMAs remain below price. Holding above $75K keeps the broader recovery structure intact, but losing the 20 EMA could bring a deeper retest.
📐 Fibonacci Levels
0.236: $75,045
0.382: $82,919
0.5: $89,282
0.618: $95,646
0.786: $104,705
1.0: $116,245
The $75,045–$76K zone is the immediate defensive area. A clean break above $82,919 would open the higher Fibonacci levels.
🟢 Bullish Scenario
BTC needs to reclaim and hold above: $77,111 → $77,299 → $77,448 → $79,168 → $80,621 → $82,071
A decisive breakout above $82,919 would strengthen the recovery structure and expose: $89,282 → $95,646 → $104,705
🔴 Pullback Scenario
If BTC fails to reclaim the $77K area, watch: $76,071 → $75,982 → $75,045
A sustained breakdown below $75,045 would weaken the recovery and could bring $73,560 → $73,088 → $71,543 → $71,358 into focus.
🧠 Market Structure & Liquidity
The chart shows a strong recovery from the $69K–$71K demand zone, followed by a breakout toward $82K and now a consolidation phase.
BTC is currently trading between major liquidity zones. The $82K–$83K area remains significant overhead liquidity, while the $75K area is the key downside defense.
📊 RSI Momentum
RSI: 49.83
Momentum has cooled back toward neutral after the previous recovery. RSI remaining near 50 means BTC currently lacks strong directional momentum.
🎯 Key Levels
Resistance: $77,111 → $77,448 → $79,168 → $80,621 → $82,071 → $82,919
Support: $76,071 → $75,982 → $75,045 → $73,560 → $73,088 → $71,543
📌 Final Outlook
BTC remains in a recovery/consolidation structure above $75K, but bulls need to reclaim $77K–$80K and eventually break $82,919 to resume the larger upside move.
Above $82,919: $89,282 → $95,646 → $104,705
Below $75,045: recovery structure weakens and deeper support becomes relevant.
Recent market data also places BTC around the mid-$75K range, consistent with the chart’s key $75K support area.
$BTC
61
·
--
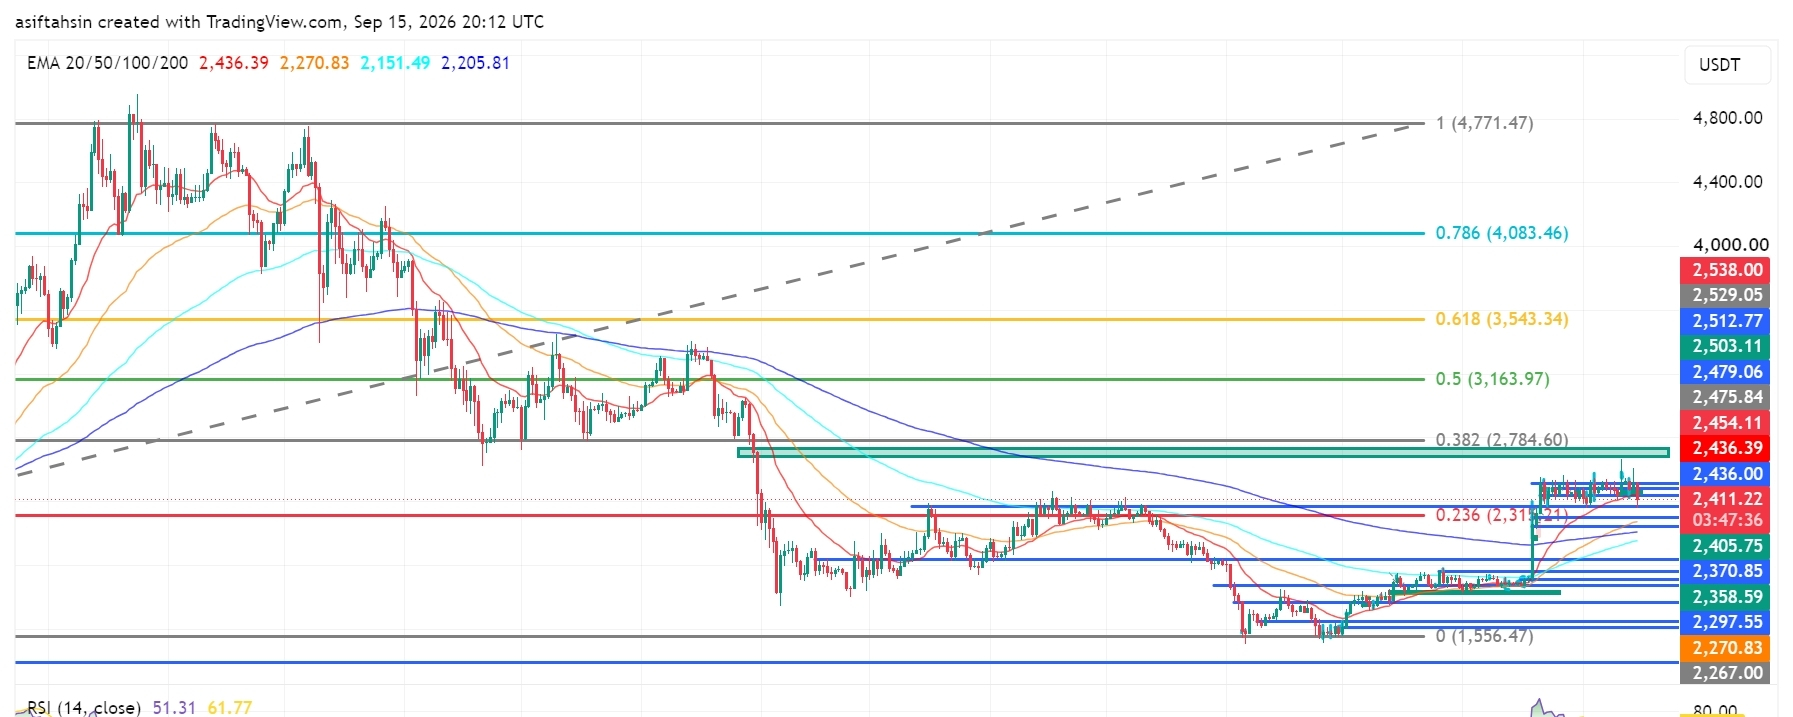
Artigo
Perspectiva Técnica da SOL: Solana se mantém perto de US$ 100 enquanto os touros defendem o rompimentoA SOL está atualmente sendo negociada perto de US$ 99,6, segurando-se próximo à zona de rompimento de US$ 99–US$ 100 após a recente expansão de alta a partir da área de demanda de US$ 92–US$ 94.
A estrutura mais ampla da recuperação continua construtiva, mas a SOL agora está consolidando abaixo do cluster de resistência de US$ 100,59–US$ 104,64. Os touros precisam recuperar essa região e romper a faixa de US$ 107,07–US$ 109,91 para a próxima grande expansão de alta.
📈 Estrutura de Médias Móveis (EMAs)
20 EMA: US$ 99,62
EMA 50: US$ 92,58
EMA 100: US$ 87,71
EMA 200: US$ 91,88
A SOL está atualmente testando a média móvel exponencial (20 EMA) em US$ 99,62.
Perspectiva Técnica da SOL: Solana se mantém perto de US$ 100 enquanto os touros defendem o rompimento
A SOL está atualmente sendo negociada perto de US$ 99,6, segurando-se próximo à zona de rompimento de US$ 99–US$ 100 após a recente expansão de alta a partir da área de demanda de US$ 92–US$ 94.
A estrutura mais ampla da recuperação continua construtiva, mas a SOL agora está consolidando abaixo do cluster de resistência de US$ 100,59–US$ 104,64. Os touros precisam recuperar essa região e romper a faixa de US$ 107,07–US$ 109,91 para a próxima grande expansão de alta.
📈 Estrutura de Médias Móveis (EMAs)
20 EMA: US$ 99,62
EMA 50: US$ 92,58
EMA 100: US$ 87,71
EMA 200: US$ 91,88
A SOL está atualmente testando a média móvel exponencial (20 EMA) em US$ 99,62.
A estrutura mais ampla da recuperação continua construtiva, mas a SOL agora está consolidando abaixo do cluster de resistência de US$ 100,59–US$ 104,64. Os touros precisam recuperar essa região e romper a faixa de US$ 107,07–US$ 109,91 para a próxima grande expansão de alta.
📈 Estrutura de Médias Móveis (EMAs)
20 EMA: US$ 99,62
EMA 50: US$ 92,58
EMA 100: US$ 87,71
EMA 200: US$ 91,88
A SOL está atualmente testando a média móvel exponencial (20 EMA) em US$ 99,62.
62
·
--
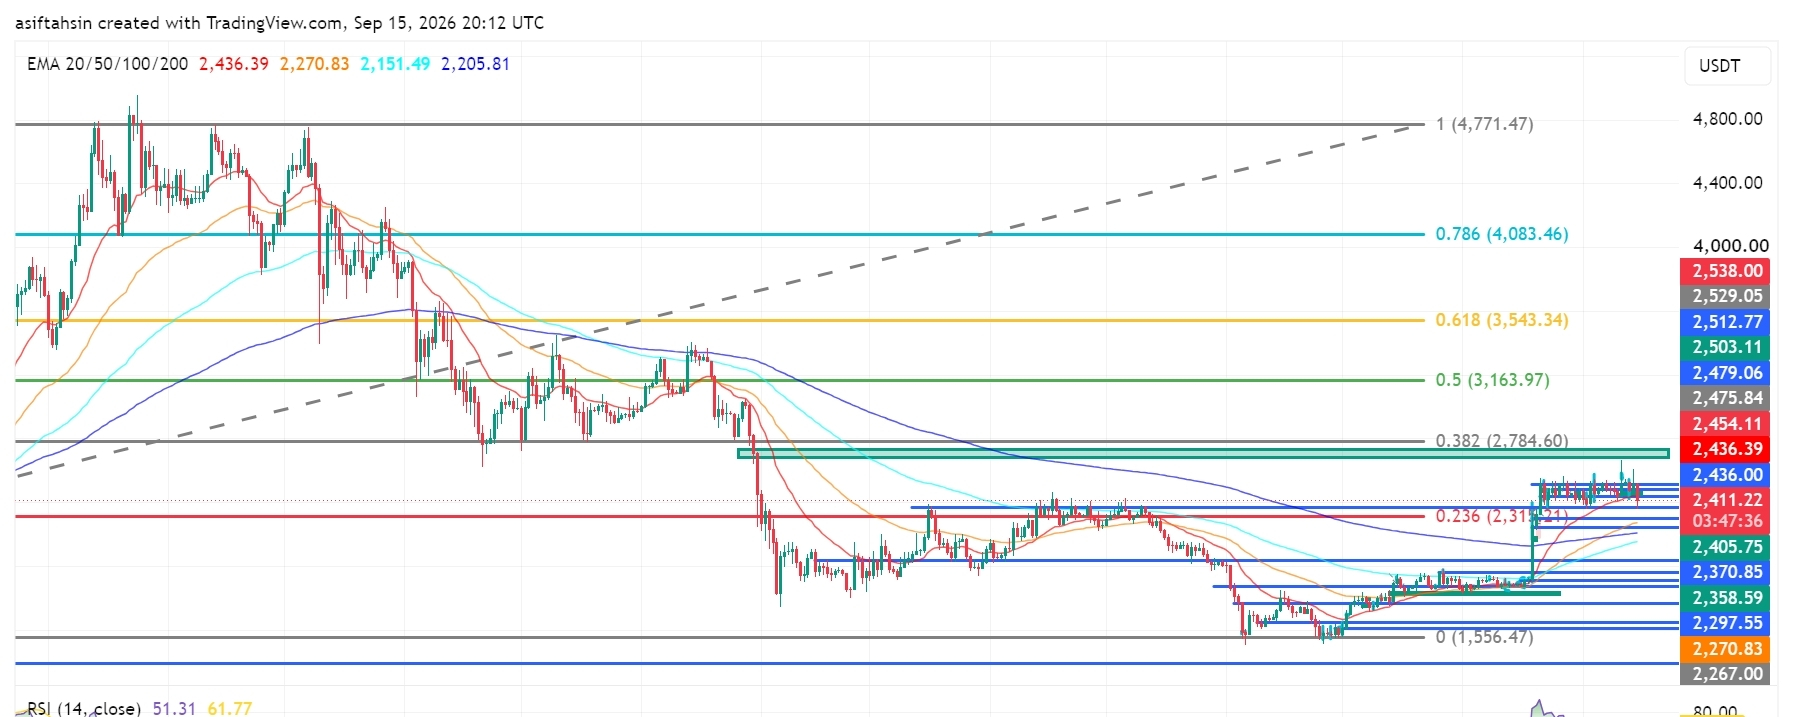
Artigo
Ver tradução
ETH Technical Outlook: Ethereum Holds Above $2.4K as Bulls Defend the RecoveryETH is currently trading around $2.41K, holding above the $2.40K–$2.41K support area after the recent recovery from the $2.27K–$2.30K demand zone.
The broader recovery structure remains constructive, but ETH is now consolidating below the $2.436K–$2.454K resistance cluster. Bulls need to reclaim this area and break $2,538 for the next major upside expansion.
📈 EMA Structure
20 EMA: $2,436.39
50 EMA: $2,270.83
100 EMA: $2,151.49
200 EMA: $2,205.81
ETH remains above the 50, 100 and 200 EMAs.
The 20 EMA at $2,436.39 is currently the key short-term resistance. A sustained reclaim above this level would strengthen the bullish recovery structure.
The 200 EMA at $2,205.81 remains an important dynamic support.
📐 Fibonacci Levels
Key Fibonacci levels:
0.236: $2,315.21
0.382: $2,784.60
0.5: $3,163.97
0.618: $3,543.34
0.786: $4,083.46
1.0: $4,771.47
ETH has reclaimed the 0.236 Fibonacci region at $2,315.21, while the next major Fibonacci resistance is $2,784.60 — 0.382 Fib.
A sustained breakout above the current resistance structure could open the path toward the $2.78K region.
🟢 Bullish Scenario
ETH is consolidating after the recent recovery and is currently building acceptance around the $2.4K area.
Immediate resistance:
$2,436.39 — 20 EMA
$2,454.11
$2,475.84
$2,503.11
$2,512.77
$2,529.05
$2,538.00
A clean breakout and sustained close above $2,538 would provide stronger confirmation of bullish continuation.
🎯 Target 1: $2,475.84
🎯 Target 2: $2,503.11
🎯 Target 3: $2,538
🎯 Target 4: $2,784.60 — 0.382 Fibonacci
🎯 Target 5: $3,163.97 — 0.5 Fibonacci
A confirmed breakout above $2,538 could strengthen the medium-term structure and potentially accelerate ETH toward the $2.78K–$3.16K region.
🔴 Pullback Scenario
After the recent recovery, consolidation or a retest of the breakout area would be normal.
Key supports:
$2,405.75
$2,370.85
$2,358.59
$2,297.55
$2,270.83 — 50 EMA
$2,205.81 — 200 EMA
$2,151.49 — 100 EMA
The $2,358–$2,405 zone is particularly important.
If ETH continues to hold this area during a pullback, the current recovery structure remains valid.
A sustained loss of $2,315.21 would weaken the bullish setup and could expose the $2,270–$2,205 support zone.
🧠 Market Structure & Liquidity
ETH has formed a clear recovery structure after sweeping liquidity around the $2.27K–$2.30K demand region.
The recent move produced a market-structure shift followed by a breakout and higher-low formation.
ETH is now moving through an important:
Breakout → Retest → Consolidation → Continuation
structure.
The major upside liquidity remains around $2,436–$2,538. A decisive breakout above this zone would place $2,784.60 as the next major Fibonacci target.
📊 RSI Momentum
RSI (14): 51.31
RSI has cooled toward the neutral 50 level, showing that short-term momentum has weakened after the previous recovery.
A sustained RSI hold above 50–55 would favor another bullish attempt toward the resistance zone.
A breakdown below 50 would indicate increasing short-term momentum weakness.
🎯 Key Levels
🔴 Major Resistance: $2,436.39 → $2,454.11 → $2,475.84 → $2,503.11 → $2,538
🟢 Major Support: $2,405.75 → $2,370.85 → $2,358.59 → $2,297.55
📉 Dynamic EMA Support: $2,270.83 — 50 EMA | $2,205.81 — 200 EMA
🚀 Upside Targets: $2,538 → $2,784.60 → $3,163.97 → $3,543.34
📌 Final Outlook
ETH's broader structure remains constructive after the recent recovery, but price is currently consolidating below the $2.436K–$2.538K resistance zone.
The $2.358K–$2.405K area is now the key short-term support region. As long as ETH holds above this zone, the current recovery structure remains active.
The immediate battle is around $2,436–$2,538. A confirmed breakout above $2,538 could open the path toward $2,784.60, followed by $3,163.97 and potentially $3,543.34.
However, rejection from resistance followed by a sustained loss of $2,315.21 would weaken the bullish structure and increase the risk of a deeper retracement toward the $2,270–$2,205 area.
Bias: 🟢 Bullish above $2,315.21. A breakout above $2,538 could open the path toward $2,784.60, with $3,163.97 as the next major Fibonacci target.
$ETH
{future}(ETHUSDT)
ETH Technical Outlook: Ethereum Holds Above $2.4K as Bulls Defend the Recovery
ETH is currently trading around $2.41K, holding above the $2.40K–$2.41K support area after the recent recovery from the $2.27K–$2.30K demand zone.
The broader recovery structure remains constructive, but ETH is now consolidating below the $2.436K–$2.454K resistance cluster. Bulls need to reclaim this area and break $2,538 for the next major upside expansion.
📈 EMA Structure
20 EMA: $2,436.39
50 EMA: $2,270.83
100 EMA: $2,151.49
200 EMA: $2,205.81
ETH remains above the 50, 100 and 200 EMAs.
The 20 EMA at $2,436.39 is currently the key short-term resistance. A sustained reclaim above this level would strengthen the bullish recovery structure.
The 200 EMA at $2,205.81 remains an important dynamic support.
📐 Fibonacci Levels
Key Fibonacci levels:
0.236: $2,315.21
0.382: $2,784.60
0.5: $3,163.97
0.618: $3,543.34
0.786: $4,083.46
1.0: $4,771.47
ETH has reclaimed the 0.236 Fibonacci region at $2,315.21, while the next major Fibonacci resistance is $2,784.60 — 0.382 Fib.
A sustained breakout above the current resistance structure could open the path toward the $2.78K region.
🟢 Bullish Scenario
ETH is consolidating after the recent recovery and is currently building acceptance around the $2.4K area.
Immediate resistance:
$2,436.39 — 20 EMA
$2,454.11
$2,475.84
$2,503.11
$2,512.77
$2,529.05
$2,538.00
A clean breakout and sustained close above $2,538 would provide stronger confirmation of bullish continuation.
🎯 Target 1: $2,475.84
🎯 Target 2: $2,503.11
🎯 Target 3: $2,538
🎯 Target 4: $2,784.60 — 0.382 Fibonacci
🎯 Target 5: $3,163.97 — 0.5 Fibonacci
A confirmed breakout above $2,538 could strengthen the medium-term structure and potentially accelerate ETH toward the $2.78K–$3.16K region.
🔴 Pullback Scenario
After the recent recovery, consolidation or a retest of the breakout area would be normal.
Key supports:
$2,405.75
$2,370.85
$2,358.59
$2,297.55
$2,270.83 — 50 EMA
$2,205.81 — 200 EMA
$2,151.49 — 100 EMA
The $2,358–$2,405 zone is particularly important.
If ETH continues to hold this area during a pullback, the current recovery structure remains valid.
A sustained loss of $2,315.21 would weaken the bullish setup and could expose the $2,270–$2,205 support zone.
🧠 Market Structure & Liquidity
ETH has formed a clear recovery structure after sweeping liquidity around the $2.27K–$2.30K demand region.
The recent move produced a market-structure shift followed by a breakout and higher-low formation.
ETH is now moving through an important:
Breakout → Retest → Consolidation → Continuation
structure.
The major upside liquidity remains around $2,436–$2,538. A decisive breakout above this zone would place $2,784.60 as the next major Fibonacci target.
📊 RSI Momentum
RSI (14): 51.31
RSI has cooled toward the neutral 50 level, showing that short-term momentum has weakened after the previous recovery.
A sustained RSI hold above 50–55 would favor another bullish attempt toward the resistance zone.
A breakdown below 50 would indicate increasing short-term momentum weakness.
🎯 Key Levels
🔴 Major Resistance: $2,436.39 → $2,454.11 → $2,475.84 → $2,503.11 → $2,538
🟢 Major Support: $2,405.75 → $2,370.85 → $2,358.59 → $2,297.55
📉 Dynamic EMA Support: $2,270.83 — 50 EMA | $2,205.81 — 200 EMA
🚀 Upside Targets: $2,538 → $2,784.60 → $3,163.97 → $3,543.34
📌 Final Outlook
ETH's broader structure remains constructive after the recent recovery, but price is currently consolidating below the $2.436K–$2.538K resistance zone.
The $2.358K–$2.405K area is now the key short-term support region. As long as ETH holds above this zone, the current recovery structure remains active.
The immediate battle is around $2,436–$2,538. A confirmed breakout above $2,538 could open the path toward $2,784.60, followed by $3,163.97 and potentially $3,543.34.
However, rejection from resistance followed by a sustained loss of $2,315.21 would weaken the bullish structure and increase the risk of a deeper retracement toward the $2,270–$2,205 area.
Bias: 🟢 Bullish above $2,315.21. A breakout above $2,538 could open the path toward $2,784.60, with $3,163.97 as the next major Fibonacci target.
$ETH
The broader recovery structure remains constructive, but ETH is now consolidating below the $2.436K–$2.454K resistance cluster. Bulls need to reclaim this area and break $2,538 for the next major upside expansion.
📈 EMA Structure
20 EMA: $2,436.39
50 EMA: $2,270.83
100 EMA: $2,151.49
200 EMA: $2,205.81
ETH remains above the 50, 100 and 200 EMAs.
The 20 EMA at $2,436.39 is currently the key short-term resistance. A sustained reclaim above this level would strengthen the bullish recovery structure.
The 200 EMA at $2,205.81 remains an important dynamic support.
📐 Fibonacci Levels
Key Fibonacci levels:
0.236: $2,315.21
0.382: $2,784.60
0.5: $3,163.97
0.618: $3,543.34
0.786: $4,083.46
1.0: $4,771.47
ETH has reclaimed the 0.236 Fibonacci region at $2,315.21, while the next major Fibonacci resistance is $2,784.60 — 0.382 Fib.
A sustained breakout above the current resistance structure could open the path toward the $2.78K region.
🟢 Bullish Scenario
ETH is consolidating after the recent recovery and is currently building acceptance around the $2.4K area.
Immediate resistance:
$2,436.39 — 20 EMA
$2,454.11
$2,475.84
$2,503.11
$2,512.77
$2,529.05
$2,538.00
A clean breakout and sustained close above $2,538 would provide stronger confirmation of bullish continuation.
🎯 Target 1: $2,475.84
🎯 Target 2: $2,503.11
🎯 Target 3: $2,538
🎯 Target 4: $2,784.60 — 0.382 Fibonacci
🎯 Target 5: $3,163.97 — 0.5 Fibonacci
A confirmed breakout above $2,538 could strengthen the medium-term structure and potentially accelerate ETH toward the $2.78K–$3.16K region.
🔴 Pullback Scenario
After the recent recovery, consolidation or a retest of the breakout area would be normal.
Key supports:
$2,405.75
$2,370.85
$2,358.59
$2,297.55
$2,270.83 — 50 EMA
$2,205.81 — 200 EMA
$2,151.49 — 100 EMA
The $2,358–$2,405 zone is particularly important.
If ETH continues to hold this area during a pullback, the current recovery structure remains valid.
A sustained loss of $2,315.21 would weaken the bullish setup and could expose the $2,270–$2,205 support zone.
🧠 Market Structure & Liquidity
ETH has formed a clear recovery structure after sweeping liquidity around the $2.27K–$2.30K demand region.
The recent move produced a market-structure shift followed by a breakout and higher-low formation.
ETH is now moving through an important:
Breakout → Retest → Consolidation → Continuation
structure.
The major upside liquidity remains around $2,436–$2,538. A decisive breakout above this zone would place $2,784.60 as the next major Fibonacci target.
📊 RSI Momentum
RSI (14): 51.31
RSI has cooled toward the neutral 50 level, showing that short-term momentum has weakened after the previous recovery.
A sustained RSI hold above 50–55 would favor another bullish attempt toward the resistance zone.
A breakdown below 50 would indicate increasing short-term momentum weakness.
🎯 Key Levels
🔴 Major Resistance: $2,436.39 → $2,454.11 → $2,475.84 → $2,503.11 → $2,538
🟢 Major Support: $2,405.75 → $2,370.85 → $2,358.59 → $2,297.55
📉 Dynamic EMA Support: $2,270.83 — 50 EMA | $2,205.81 — 200 EMA
🚀 Upside Targets: $2,538 → $2,784.60 → $3,163.97 → $3,543.34
📌 Final Outlook
ETH's broader structure remains constructive after the recent recovery, but price is currently consolidating below the $2.436K–$2.538K resistance zone.
The $2.358K–$2.405K area is now the key short-term support region. As long as ETH holds above this zone, the current recovery structure remains active.
The immediate battle is around $2,436–$2,538. A confirmed breakout above $2,538 could open the path toward $2,784.60, followed by $3,163.97 and potentially $3,543.34.
However, rejection from resistance followed by a sustained loss of $2,315.21 would weaken the bullish structure and increase the risk of a deeper retracement toward the $2,270–$2,205 area.
Bias: 🟢 Bullish above $2,315.21. A breakout above $2,538 could open the path toward $2,784.60, with $3,163.97 as the next major Fibonacci target.
$ETH
63
·
--
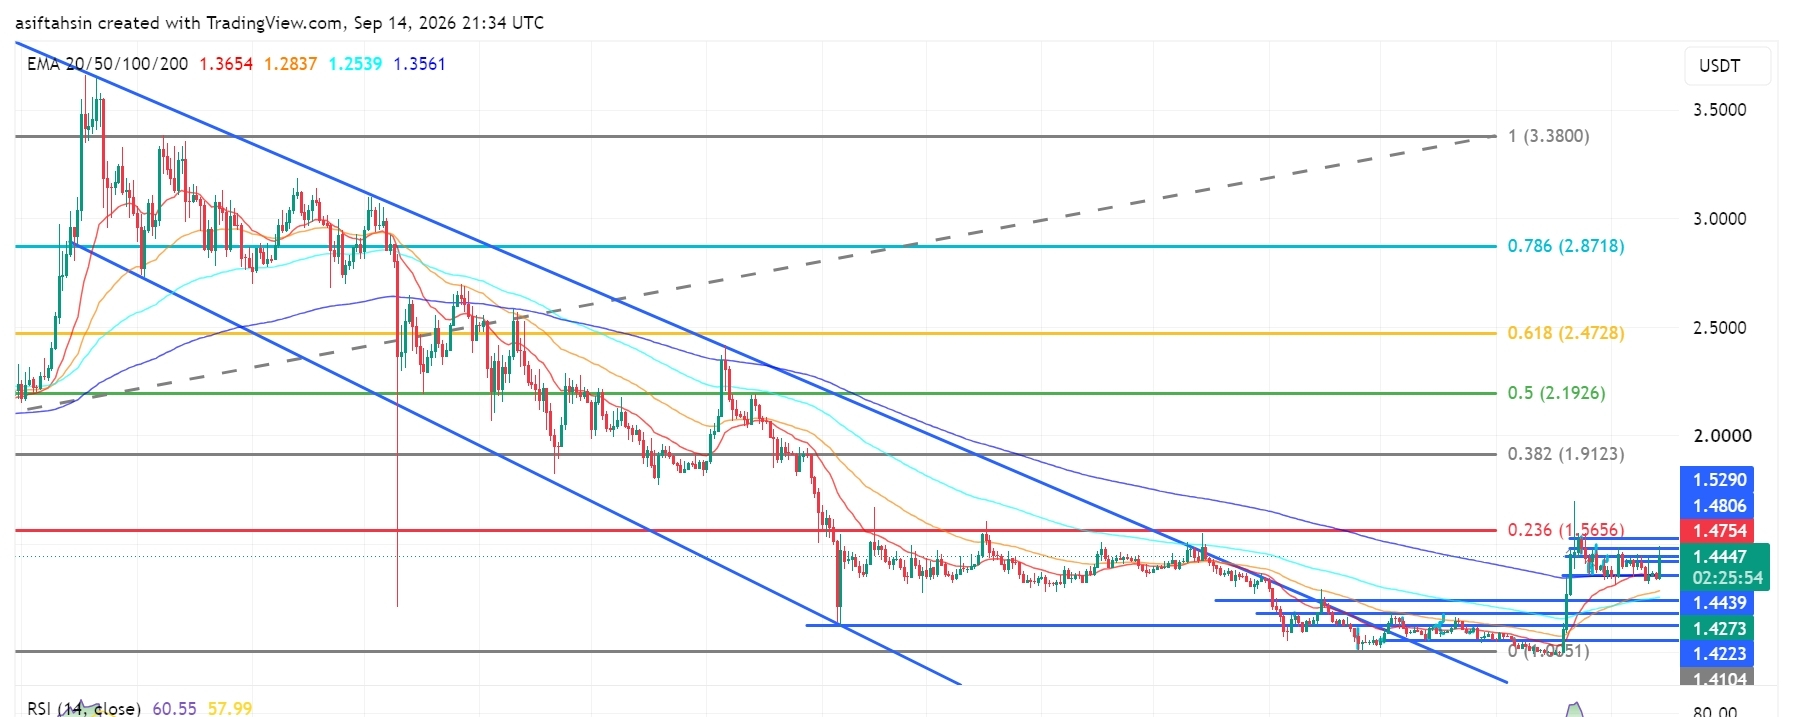
Artigo
Perspectiva Técnica do XRP: XRP Mantém-se Acima de US$ 1,40 enquanto os Touros Miram US$ 1,56O XRP está atualmente sendo negociado em torno de US$ 1,44, consolidando acima do importante nível psicológico de US$ 1,40 após uma forte recuperação das mínimas de junho a julho.
A estrutura mais ampla melhorou significativamente, com o XRP agora sendo negociado acima de todas as quatro principais EMAs. No entanto, o preço está se aproximando de um importante cluster de resistência na faixa de US$ 1,475–1,53. Os touros precisam de uma ruptura limpa acima dessa área para abrir caminho em direção à resistência de Fibonacci de US$ 1,5656.
📈 Estrutura de EMA
EMA 20: US$ 1,3653
EMA 50: US$ 1,2837
EMA 100: US$ 1,2539
EMA 200: US$ 1,3561
Perspectiva Técnica do XRP: XRP Mantém-se Acima de US$ 1,40 enquanto os Touros Miram US$ 1,56
O XRP está atualmente sendo negociado em torno de US$ 1,44, consolidando acima do importante nível psicológico de US$ 1,40 após uma forte recuperação das mínimas de junho a julho.
A estrutura mais ampla melhorou significativamente, com o XRP agora sendo negociado acima de todas as quatro principais EMAs. No entanto, o preço está se aproximando de um importante cluster de resistência na faixa de US$ 1,475–1,53. Os touros precisam de uma ruptura limpa acima dessa área para abrir caminho em direção à resistência de Fibonacci de US$ 1,5656.
📈 Estrutura de EMA
EMA 20: US$ 1,3653
EMA 50: US$ 1,2837
EMA 100: US$ 1,2539
EMA 200: US$ 1,3561
A estrutura mais ampla melhorou significativamente, com o XRP agora sendo negociado acima de todas as quatro principais EMAs. No entanto, o preço está se aproximando de um importante cluster de resistência na faixa de US$ 1,475–1,53. Os touros precisam de uma ruptura limpa acima dessa área para abrir caminho em direção à resistência de Fibonacci de US$ 1,5656.
📈 Estrutura de EMA
EMA 20: US$ 1,3653
EMA 50: US$ 1,2837
EMA 100: US$ 1,2539
EMA 200: US$ 1,3561
2
1
1.2k
·
--
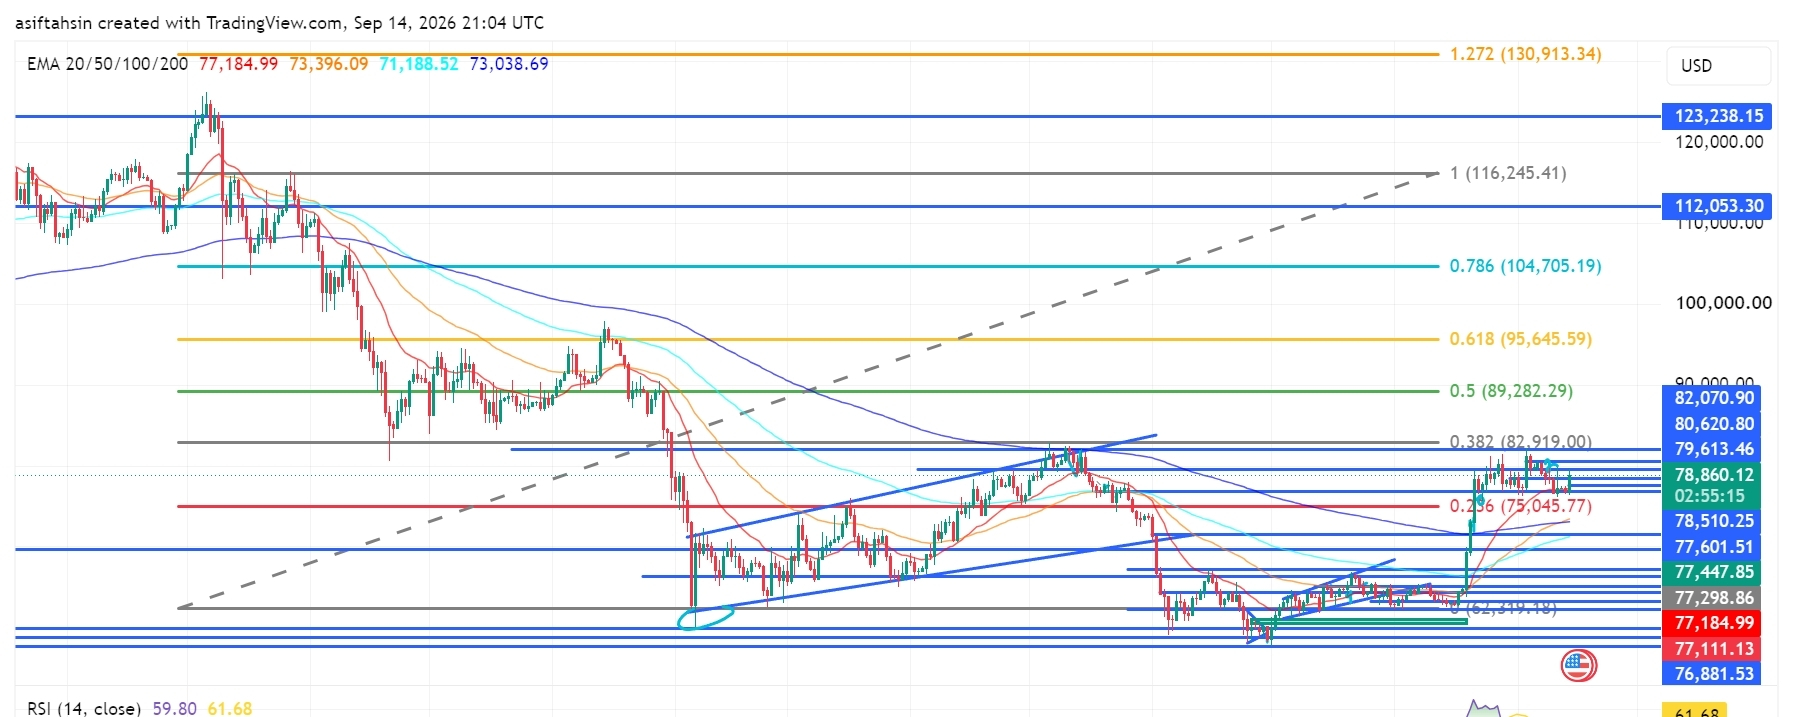
Artigo
Ver tradução
Bitcoin (BTC) Technical Outlook: BTC Holds Above $78K as Bulls Target $80K–$83K ResistanceBTC is currently trading around $78,860, consolidating above the $78K level after a strong recovery from the June lows.
The broader structure remains constructive, with BTC trading above all four major EMAs. However, price is now approaching a significant resistance cluster around $79,613–$82,070. Bulls need a clean breakout above this zone to open the path toward the $82,919 Fibonacci resistance and potentially higher levels.
📈 EMA Structure
20 EMA: $77,182.98
50 EMA: $73,395.26
100 EMA: $71,188.10
200 EMA: $73,038.48
BTC remains above all four major EMAs, keeping the medium-term recovery structure bullish.
The $77,182.98 20 EMA is now the key dynamic support. As long as BTC remains above this level, buyers maintain control of the current recovery.
📐 Fibonacci Levels
0.236: $75,045.77
0.382: $82,919.00
0.5: $89,282.29
0.618: $95,645.59
0.786: $104,705.19
1.0: $116,245.41
1.272: $130,913.34
The $82,919 0.382 Fibonacci level is the next major upside objective after the current resistance cluster.
🟢 Bullish Scenario
BTC is consolidating just below the $79,613–$82,070 resistance area.
A clean breakout and sustained close above $82,070 could trigger another bullish expansion.
🎯 Target 1: $82,070
🎯 Target 2: $82,919
🎯 Target 3: $89,282
🎯 Target 4: $95,645
🎯 Target 5: $104,705
🎯 Target 6: $116,245
A decisive reclaim of $82,919 would be an important confirmation that BTC is transitioning into a stronger medium-term recovery phase.
🔴 Pullback Scenario
If BTC fails to break the $79,613–$82,070 resistance cluster, a short-term pullback could develop.
Key supports:
$78,510.25
$77,601.51
$77,447.85
$77,298.86
$77,182.98 — 20 EMA
$77,111.13
$76,881.53
$75,045.77 — 0.236 Fib
The $77,600–$77,180 region is particularly important. A successful retest here could provide a base for another attempt at the $80K+ resistance zone.
A sustained break below the 20 EMA at $77,182.98 would weaken the short-term bullish structure.
🧠 Market Structure & Liquidity
BTC's recent structure can be viewed as:
Liquidity Sweep → Accumulation → Higher Lows → Breakout → Reclaim → Consolidation → Potential Continuation
The June low created a major liquidity event, followed by accumulation and a gradual recovery.
BTC subsequently broke higher from the July–August consolidation structure and reclaimed the $75K area. Price is now consolidating near $79K, with the next major structural test sitting between $79,613 and $82,070.
A breakout above this region would put the $82,919 Fibonacci level into focus.
📊 RSI Momentum
RSI: 59.80
RSI MA: 61.68
RSI remains above 50, confirming that bullish momentum is still present.
However, RSI is currently slightly below its moving average, suggesting that momentum has cooled from the recent upside move. A renewed move above 62–65 would strengthen the continuation setup.
🎯 Key Levels
Resistance:
$79,613.46 → $80,620.80 → $82,070.90 → $82,919 → $89,282.29 → $95,645.59
Support:
$78,510.25 → $77,601.51 → $77,447.85 → $77,298.86 → $77,182.98 → $77,111.13 → $76,881.53 → $75,045.77
📌 Final Outlook
BTC remains in a constructive recovery structure while holding above the $77K area and all four major EMAs.
The immediate battle is $79,613–$82,070. A decisive breakout above this zone could push BTC toward $82,919 → $89,282 → $95,645, while a sustained reclaim of $82,919 could open the path toward the higher Fibonacci levels.
On the downside, $77,182.98 is the key dynamic support. As long as BTC holds above this level, the broader bullish recovery remains intact.
Bias: 🟢 Bullish above $77,183 | Stronger above $82,070
$BTC
{future}(BTCUSDT)
Bitcoin (BTC) Technical Outlook: BTC Holds Above $78K as Bulls Target $80K–$83K Resistance
BTC is currently trading around $78,860, consolidating above the $78K level after a strong recovery from the June lows.
The broader structure remains constructive, with BTC trading above all four major EMAs. However, price is now approaching a significant resistance cluster around $79,613–$82,070. Bulls need a clean breakout above this zone to open the path toward the $82,919 Fibonacci resistance and potentially higher levels.
📈 EMA Structure
20 EMA: $77,182.98
50 EMA: $73,395.26
100 EMA: $71,188.10
200 EMA: $73,038.48
BTC remains above all four major EMAs, keeping the medium-term recovery structure bullish.
The $77,182.98 20 EMA is now the key dynamic support. As long as BTC remains above this level, buyers maintain control of the current recovery.
📐 Fibonacci Levels
0.236: $75,045.77
0.382: $82,919.00
0.5: $89,282.29
0.618: $95,645.59
0.786: $104,705.19
1.0: $116,245.41
1.272: $130,913.34
The $82,919 0.382 Fibonacci level is the next major upside objective after the current resistance cluster.
🟢 Bullish Scenario
BTC is consolidating just below the $79,613–$82,070 resistance area.
A clean breakout and sustained close above $82,070 could trigger another bullish expansion.
🎯 Target 1: $82,070
🎯 Target 2: $82,919
🎯 Target 3: $89,282
🎯 Target 4: $95,645
🎯 Target 5: $104,705
🎯 Target 6: $116,245
A decisive reclaim of $82,919 would be an important confirmation that BTC is transitioning into a stronger medium-term recovery phase.
🔴 Pullback Scenario
If BTC fails to break the $79,613–$82,070 resistance cluster, a short-term pullback could develop.
Key supports:
$78,510.25
$77,601.51
$77,447.85
$77,298.86
$77,182.98 — 20 EMA
$77,111.13
$76,881.53
$75,045.77 — 0.236 Fib
The $77,600–$77,180 region is particularly important. A successful retest here could provide a base for another attempt at the $80K+ resistance zone.
A sustained break below the 20 EMA at $77,182.98 would weaken the short-term bullish structure.
🧠 Market Structure & Liquidity
BTC's recent structure can be viewed as:
Liquidity Sweep → Accumulation → Higher Lows → Breakout → Reclaim → Consolidation → Potential Continuation
The June low created a major liquidity event, followed by accumulation and a gradual recovery.
BTC subsequently broke higher from the July–August consolidation structure and reclaimed the $75K area. Price is now consolidating near $79K, with the next major structural test sitting between $79,613 and $82,070.
A breakout above this region would put the $82,919 Fibonacci level into focus.
📊 RSI Momentum
RSI: 59.80
RSI MA: 61.68
RSI remains above 50, confirming that bullish momentum is still present.
However, RSI is currently slightly below its moving average, suggesting that momentum has cooled from the recent upside move. A renewed move above 62–65 would strengthen the continuation setup.
🎯 Key Levels
Resistance:
$79,613.46 → $80,620.80 → $82,070.90 → $82,919 → $89,282.29 → $95,645.59
Support:
$78,510.25 → $77,601.51 → $77,447.85 → $77,298.86 → $77,182.98 → $77,111.13 → $76,881.53 → $75,045.77
📌 Final Outlook
BTC remains in a constructive recovery structure while holding above the $77K area and all four major EMAs.
The immediate battle is $79,613–$82,070. A decisive breakout above this zone could push BTC toward $82,919 → $89,282 → $95,645, while a sustained reclaim of $82,919 could open the path toward the higher Fibonacci levels.
On the downside, $77,182.98 is the key dynamic support. As long as BTC holds above this level, the broader bullish recovery remains intact.
Bias: 🟢 Bullish above $77,183 | Stronger above $82,070
$BTC
The broader structure remains constructive, with BTC trading above all four major EMAs. However, price is now approaching a significant resistance cluster around $79,613–$82,070. Bulls need a clean breakout above this zone to open the path toward the $82,919 Fibonacci resistance and potentially higher levels.
📈 EMA Structure
20 EMA: $77,182.98
50 EMA: $73,395.26
100 EMA: $71,188.10
200 EMA: $73,038.48
BTC remains above all four major EMAs, keeping the medium-term recovery structure bullish.
The $77,182.98 20 EMA is now the key dynamic support. As long as BTC remains above this level, buyers maintain control of the current recovery.
📐 Fibonacci Levels
0.236: $75,045.77
0.382: $82,919.00
0.5: $89,282.29
0.618: $95,645.59
0.786: $104,705.19
1.0: $116,245.41
1.272: $130,913.34
The $82,919 0.382 Fibonacci level is the next major upside objective after the current resistance cluster.
🟢 Bullish Scenario
BTC is consolidating just below the $79,613–$82,070 resistance area.
A clean breakout and sustained close above $82,070 could trigger another bullish expansion.
🎯 Target 1: $82,070
🎯 Target 2: $82,919
🎯 Target 3: $89,282
🎯 Target 4: $95,645
🎯 Target 5: $104,705
🎯 Target 6: $116,245
A decisive reclaim of $82,919 would be an important confirmation that BTC is transitioning into a stronger medium-term recovery phase.
🔴 Pullback Scenario
If BTC fails to break the $79,613–$82,070 resistance cluster, a short-term pullback could develop.
Key supports:
$78,510.25
$77,601.51
$77,447.85
$77,298.86
$77,182.98 — 20 EMA
$77,111.13
$76,881.53
$75,045.77 — 0.236 Fib
The $77,600–$77,180 region is particularly important. A successful retest here could provide a base for another attempt at the $80K+ resistance zone.
A sustained break below the 20 EMA at $77,182.98 would weaken the short-term bullish structure.
🧠 Market Structure & Liquidity
BTC's recent structure can be viewed as:
Liquidity Sweep → Accumulation → Higher Lows → Breakout → Reclaim → Consolidation → Potential Continuation
The June low created a major liquidity event, followed by accumulation and a gradual recovery.
BTC subsequently broke higher from the July–August consolidation structure and reclaimed the $75K area. Price is now consolidating near $79K, with the next major structural test sitting between $79,613 and $82,070.
A breakout above this region would put the $82,919 Fibonacci level into focus.
📊 RSI Momentum
RSI: 59.80
RSI MA: 61.68
RSI remains above 50, confirming that bullish momentum is still present.
However, RSI is currently slightly below its moving average, suggesting that momentum has cooled from the recent upside move. A renewed move above 62–65 would strengthen the continuation setup.
🎯 Key Levels
Resistance:
$79,613.46 → $80,620.80 → $82,070.90 → $82,919 → $89,282.29 → $95,645.59
Support:
$78,510.25 → $77,601.51 → $77,447.85 → $77,298.86 → $77,182.98 → $77,111.13 → $76,881.53 → $75,045.77
📌 Final Outlook
BTC remains in a constructive recovery structure while holding above the $77K area and all four major EMAs.
The immediate battle is $79,613–$82,070. A decisive breakout above this zone could push BTC toward $82,919 → $89,282 → $95,645, while a sustained reclaim of $82,919 could open the path toward the higher Fibonacci levels.
On the downside, $77,182.98 is the key dynamic support. As long as BTC holds above this level, the broader bullish recovery remains intact.
Bias: 🟢 Bullish above $77,183 | Stronger above $82,070
$BTC
69
·
--
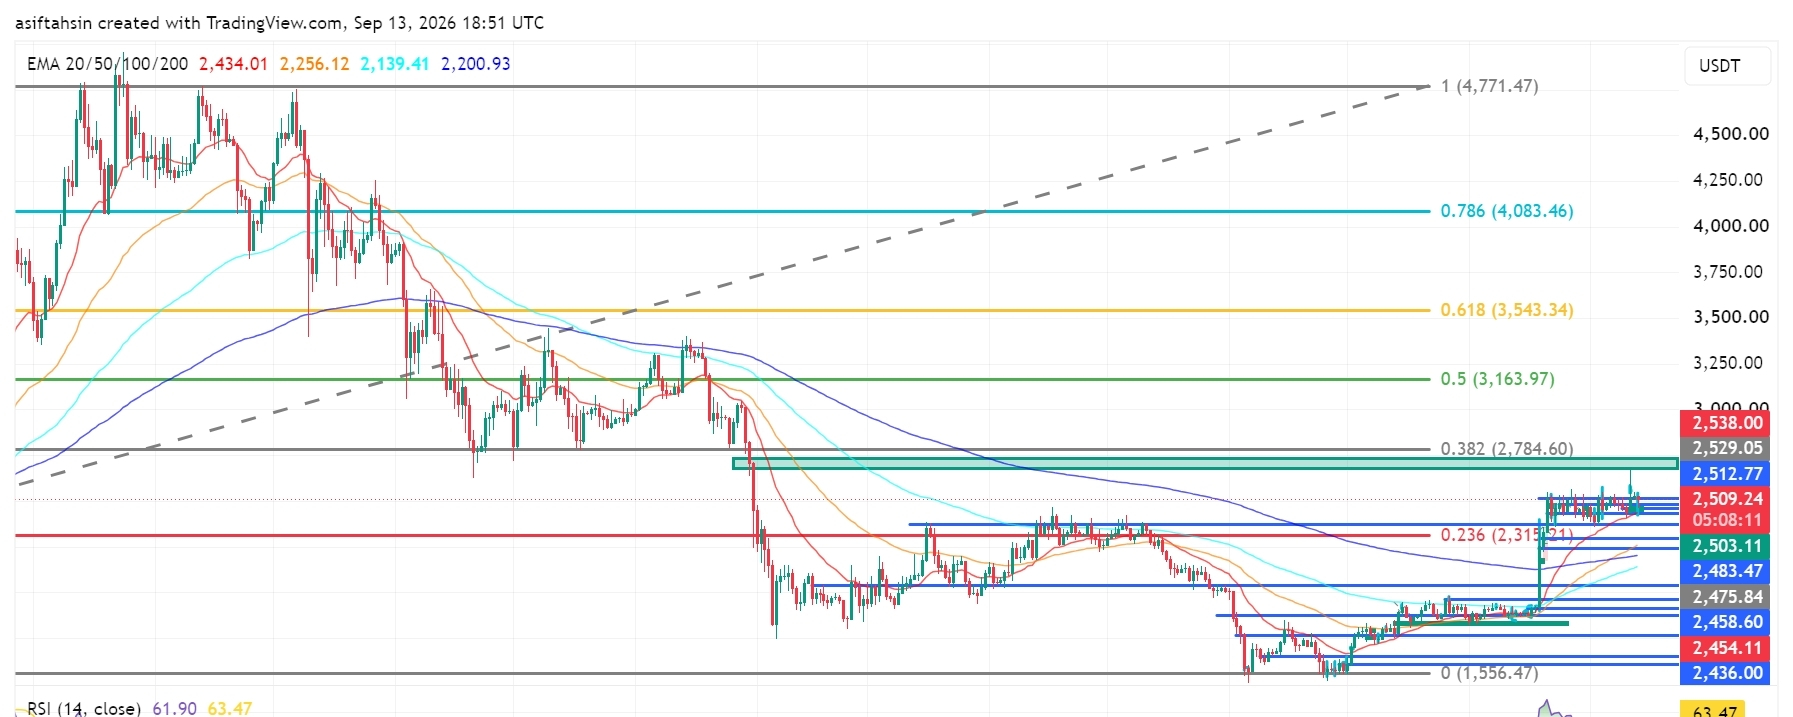
Artigo
Ver tradução
Solana (SOL) Technical Outlook: SOL Holds Above $100 as Bulls Target Higher ResistanceSOL is currently trading around $101.25, consolidating above the psychological $100 level after a strong recovery from the June lows.
The broader structure is showing signs of improvement, with SOL now trading above all four major EMAs. However, price is facing a significant resistance cluster around $102.29–$104.64. Bulls need a clean breakout above this zone to open the path toward the $107–$109 area and the $129.49 Fibonacci resistance.
📈 EMA Structure
20 EMA: $99.76
50 EMA: $92.04
100 EMA: $87.25
200 EMA: $91.74
SOL is currently trading above all four major EMAs, supporting the ongoing recovery structure.
The $99.76 20 EMA is the key dynamic support. As long as SOL remains above this level, buyers maintain control of the current short-term structure.
📐 Fibonacci Levels
0.236: $104.00
0.382: $129.49
0.5: $150.08
0.618: $170.67
0.786: $199.99
1.0: $237.33
The $104.00 0.236 Fibonacci level is the immediate major resistance. A successful reclaim could strengthen the path toward $129.49.
🟢 Bullish Scenario
SOL is consolidating around the $100–$102 region after recovering from the recent lows.
A clean breakout and sustained close above $104.64 could trigger another bullish expansion.
🎯 Target 1: $107.07
🎯 Target 2: $109.84
🎯 Target 3: $112.00
🎯 Target 4: $129.49
🎯 Target 5: $150.08
🎯 Target 6: $170.67
A decisive reclaim of $129.49 would be an important confirmation that SOL is transitioning into a stronger medium-term recovery phase.
🔴 Pullback Scenario
If SOL fails to break the $102.29–$104.64 resistance cluster, a short-term pullback could develop.
Key supports:
$100.59
$99.76
$96.33
$92.94
$92.04
$91.74 — 200 EMA
$87.25 — 100 EMA
$86.69
The $100.59–$99.76 region is particularly important. A successful retest here could provide a base for another attempt at the $104 resistance.
A sustained break below the 20 EMA at $99.76 would weaken the short-term bullish structure.
🧠 Market Structure & Liquidity
SOL's recent structure can be viewed as:
Liquidity Sweep → Accumulation → Higher Lows → MSS/BOS → Breakout → Reclaim → Consolidation → Potential Continuation
The June low created a major liquidity event, followed by a prolonged accumulation phase and gradual recovery.
SOL has now reclaimed the $100 psychological level and is holding above the major EMA cluster.
The next major structural test is $102.29–$104.64, followed by the $107–$112 resistance area.
📊 RSI Momentum
RSI: 56.24
RSI MA: 61.94
RSI remains above 50, indicating that bullish momentum is still present.
However, RSI is currently below its moving average, suggesting that momentum has cooled from the recent upside move. A renewed push above 60–62 would strengthen the continuation setup.
🎯 Key Levels
Resistance:
$102.29 → $104.00 → $104.64 → $107.07 → $109.84 → $112.00 → $129.49
Support:
$100.59 → $99.76 → $96.33 → $92.94 → $92.04 → $91.74 → $87.25 → $86.69
📌 Final Outlook
SOL remains in a constructive recovery structure while holding above the $100 area and all major EMAs.
The immediate battle is $102.29–$104.64. A decisive breakout above this zone could push SOL toward $107 → $109.84 → $112, while a sustained move beyond these levels could open the path toward $129.49.
On the downside, $99.76 is the key dynamic support. As long as SOL holds above this level, the broader recovery structure remains intact.
Bias: 🟢 Bullish above $99.76 | Stronger above $104.64
$SOL
{future}(SOLUSDT)
Solana (SOL) Technical Outlook: SOL Holds Above $100 as Bulls Target Higher Resistance
SOL is currently trading around $101.25, consolidating above the psychological $100 level after a strong recovery from the June lows.
The broader structure is showing signs of improvement, with SOL now trading above all four major EMAs. However, price is facing a significant resistance cluster around $102.29–$104.64. Bulls need a clean breakout above this zone to open the path toward the $107–$109 area and the $129.49 Fibonacci resistance.
📈 EMA Structure
20 EMA: $99.76
50 EMA: $92.04
100 EMA: $87.25
200 EMA: $91.74
SOL is currently trading above all four major EMAs, supporting the ongoing recovery structure.
The $99.76 20 EMA is the key dynamic support. As long as SOL remains above this level, buyers maintain control of the current short-term structure.
📐 Fibonacci Levels
0.236: $104.00
0.382: $129.49
0.5: $150.08
0.618: $170.67
0.786: $199.99
1.0: $237.33
The $104.00 0.236 Fibonacci level is the immediate major resistance. A successful reclaim could strengthen the path toward $129.49.
🟢 Bullish Scenario
SOL is consolidating around the $100–$102 region after recovering from the recent lows.
A clean breakout and sustained close above $104.64 could trigger another bullish expansion.
🎯 Target 1: $107.07
🎯 Target 2: $109.84
🎯 Target 3: $112.00
🎯 Target 4: $129.49
🎯 Target 5: $150.08
🎯 Target 6: $170.67
A decisive reclaim of $129.49 would be an important confirmation that SOL is transitioning into a stronger medium-term recovery phase.
🔴 Pullback Scenario
If SOL fails to break the $102.29–$104.64 resistance cluster, a short-term pullback could develop.
Key supports:
$100.59
$99.76
$96.33
$92.94
$92.04
$91.74 — 200 EMA
$87.25 — 100 EMA
$86.69
The $100.59–$99.76 region is particularly important. A successful retest here could provide a base for another attempt at the $104 resistance.
A sustained break below the 20 EMA at $99.76 would weaken the short-term bullish structure.
🧠 Market Structure & Liquidity
SOL's recent structure can be viewed as:
Liquidity Sweep → Accumulation → Higher Lows → MSS/BOS → Breakout → Reclaim → Consolidation → Potential Continuation
The June low created a major liquidity event, followed by a prolonged accumulation phase and gradual recovery.
SOL has now reclaimed the $100 psychological level and is holding above the major EMA cluster.
The next major structural test is $102.29–$104.64, followed by the $107–$112 resistance area.
📊 RSI Momentum
RSI: 56.24
RSI MA: 61.94
RSI remains above 50, indicating that bullish momentum is still present.
However, RSI is currently below its moving average, suggesting that momentum has cooled from the recent upside move. A renewed push above 60–62 would strengthen the continuation setup.
🎯 Key Levels
Resistance:
$102.29 → $104.00 → $104.64 → $107.07 → $109.84 → $112.00 → $129.49
Support:
$100.59 → $99.76 → $96.33 → $92.94 → $92.04 → $91.74 → $87.25 → $86.69
📌 Final Outlook
SOL remains in a constructive recovery structure while holding above the $100 area and all major EMAs.
The immediate battle is $102.29–$104.64. A decisive breakout above this zone could push SOL toward $107 → $109.84 → $112, while a sustained move beyond these levels could open the path toward $129.49.
On the downside, $99.76 is the key dynamic support. As long as SOL holds above this level, the broader recovery structure remains intact.
Bias: 🟢 Bullish above $99.76 | Stronger above $104.64
$SOL
The broader structure is showing signs of improvement, with SOL now trading above all four major EMAs. However, price is facing a significant resistance cluster around $102.29–$104.64. Bulls need a clean breakout above this zone to open the path toward the $107–$109 area and the $129.49 Fibonacci resistance.
📈 EMA Structure
20 EMA: $99.76
50 EMA: $92.04
100 EMA: $87.25
200 EMA: $91.74
SOL is currently trading above all four major EMAs, supporting the ongoing recovery structure.
The $99.76 20 EMA is the key dynamic support. As long as SOL remains above this level, buyers maintain control of the current short-term structure.
📐 Fibonacci Levels
0.236: $104.00
0.382: $129.49
0.5: $150.08
0.618: $170.67
0.786: $199.99
1.0: $237.33
The $104.00 0.236 Fibonacci level is the immediate major resistance. A successful reclaim could strengthen the path toward $129.49.
🟢 Bullish Scenario
SOL is consolidating around the $100–$102 region after recovering from the recent lows.
A clean breakout and sustained close above $104.64 could trigger another bullish expansion.
🎯 Target 1: $107.07
🎯 Target 2: $109.84
🎯 Target 3: $112.00
🎯 Target 4: $129.49
🎯 Target 5: $150.08
🎯 Target 6: $170.67
A decisive reclaim of $129.49 would be an important confirmation that SOL is transitioning into a stronger medium-term recovery phase.
🔴 Pullback Scenario
If SOL fails to break the $102.29–$104.64 resistance cluster, a short-term pullback could develop.
Key supports:
$100.59
$99.76
$96.33
$92.94
$92.04
$91.74 — 200 EMA
$87.25 — 100 EMA
$86.69
The $100.59–$99.76 region is particularly important. A successful retest here could provide a base for another attempt at the $104 resistance.
A sustained break below the 20 EMA at $99.76 would weaken the short-term bullish structure.
🧠 Market Structure & Liquidity
SOL's recent structure can be viewed as:
Liquidity Sweep → Accumulation → Higher Lows → MSS/BOS → Breakout → Reclaim → Consolidation → Potential Continuation
The June low created a major liquidity event, followed by a prolonged accumulation phase and gradual recovery.
SOL has now reclaimed the $100 psychological level and is holding above the major EMA cluster.
The next major structural test is $102.29–$104.64, followed by the $107–$112 resistance area.
📊 RSI Momentum
RSI: 56.24
RSI MA: 61.94
RSI remains above 50, indicating that bullish momentum is still present.
However, RSI is currently below its moving average, suggesting that momentum has cooled from the recent upside move. A renewed push above 60–62 would strengthen the continuation setup.
🎯 Key Levels
Resistance:
$102.29 → $104.00 → $104.64 → $107.07 → $109.84 → $112.00 → $129.49
Support:
$100.59 → $99.76 → $96.33 → $92.94 → $92.04 → $91.74 → $87.25 → $86.69
📌 Final Outlook
SOL remains in a constructive recovery structure while holding above the $100 area and all major EMAs.
The immediate battle is $102.29–$104.64. A decisive breakout above this zone could push SOL toward $107 → $109.84 → $112, while a sustained move beyond these levels could open the path toward $129.49.
On the downside, $99.76 is the key dynamic support. As long as SOL holds above this level, the broader recovery structure remains intact.
Bias: 🟢 Bullish above $99.76 | Stronger above $104.64
$SOL
61
·
--
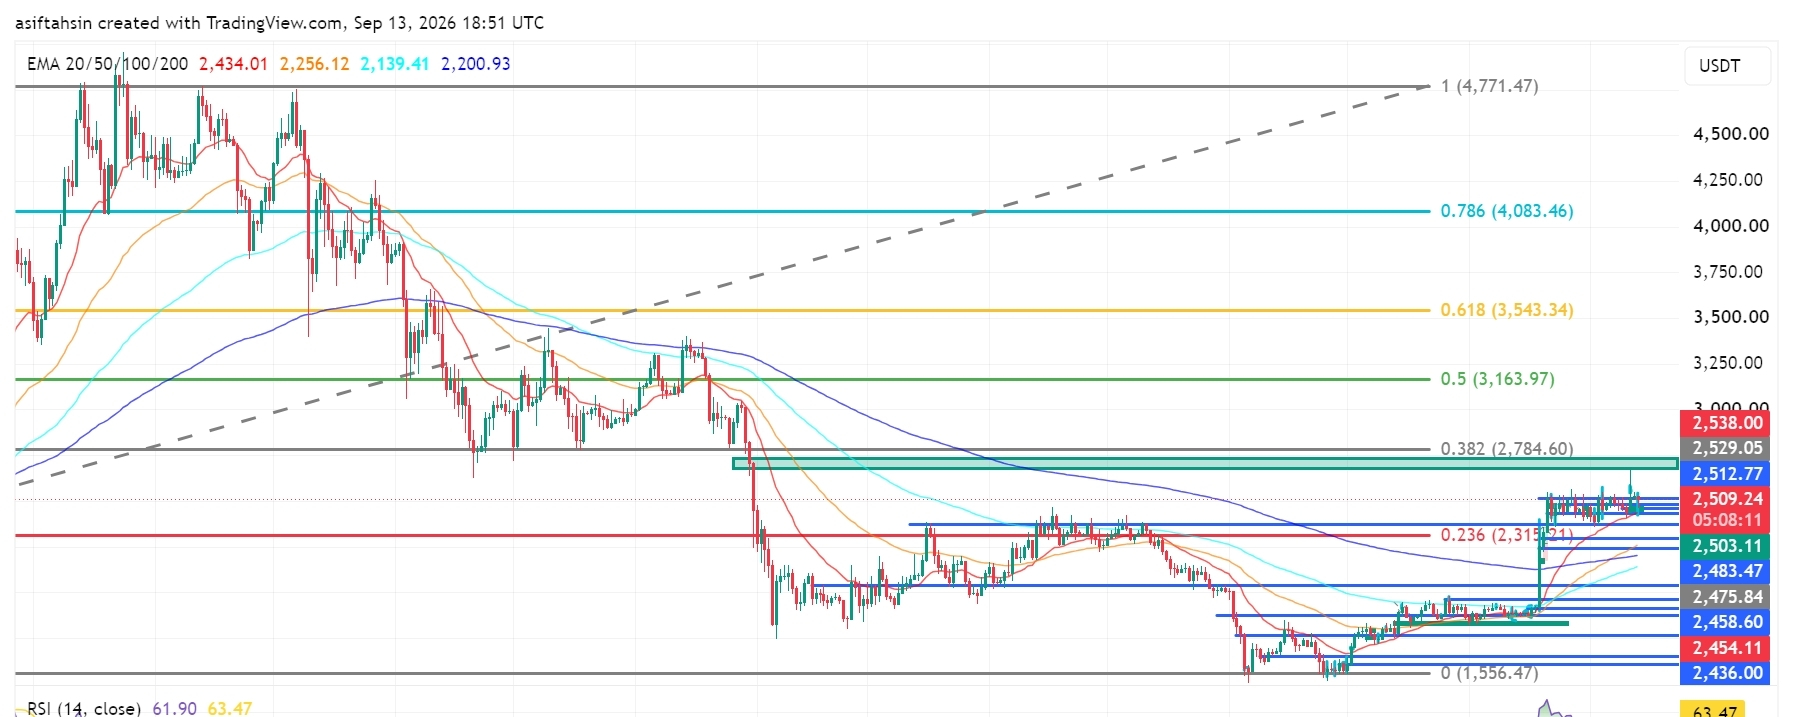
Artigo
Perspectiva Técnica do ETH: Ethereum Fica Acima de US$ 2,5K enquanto os Touros Miram Resistência Mais AltaO ETH está sendo negociado atualmente por volta de US$ 2.509, consolidando acima do nível psicológico de US$ 2.500 após uma forte recuperação das mínimas de junho.
A estrutura geral continua construtiva, com o ETH sendo negociado bem acima de todas as quatro principais EMAs. No entanto, o preço agora está se aproximando de um importante cluster de resistência na faixa de US$ 2.512–2.538. Os touros precisam de uma ruptura limpa acima dessa zona para abrir caminho em direção à resistência de Fibonacci em US$ 2.784.
📈 Estrutura da EMA
20 EMA: US$ 2.434,01
50 EMA: US$ 2.256,12
100 EMA: US$ 2.139,41
200 EMA: US$ 2.200,93
Perspectiva Técnica do ETH: Ethereum Fica Acima de US$ 2,5K enquanto os Touros Miram Resistência Mais Alta
O ETH está sendo negociado atualmente por volta de US$ 2.509, consolidando acima do nível psicológico de US$ 2.500 após uma forte recuperação das mínimas de junho.
A estrutura geral continua construtiva, com o ETH sendo negociado bem acima de todas as quatro principais EMAs. No entanto, o preço agora está se aproximando de um importante cluster de resistência na faixa de US$ 2.512–2.538. Os touros precisam de uma ruptura limpa acima dessa zona para abrir caminho em direção à resistência de Fibonacci em US$ 2.784.
📈 Estrutura da EMA
20 EMA: US$ 2.434,01
50 EMA: US$ 2.256,12
100 EMA: US$ 2.139,41
200 EMA: US$ 2.200,93
A estrutura geral continua construtiva, com o ETH sendo negociado bem acima de todas as quatro principais EMAs. No entanto, o preço agora está se aproximando de um importante cluster de resistência na faixa de US$ 2.512–2.538. Os touros precisam de uma ruptura limpa acima dessa zona para abrir caminho em direção à resistência de Fibonacci em US$ 2.784.
📈 Estrutura da EMA
20 EMA: US$ 2.434,01
50 EMA: US$ 2.256,12
100 EMA: US$ 2.139,41
200 EMA: US$ 2.200,93
83
·
--
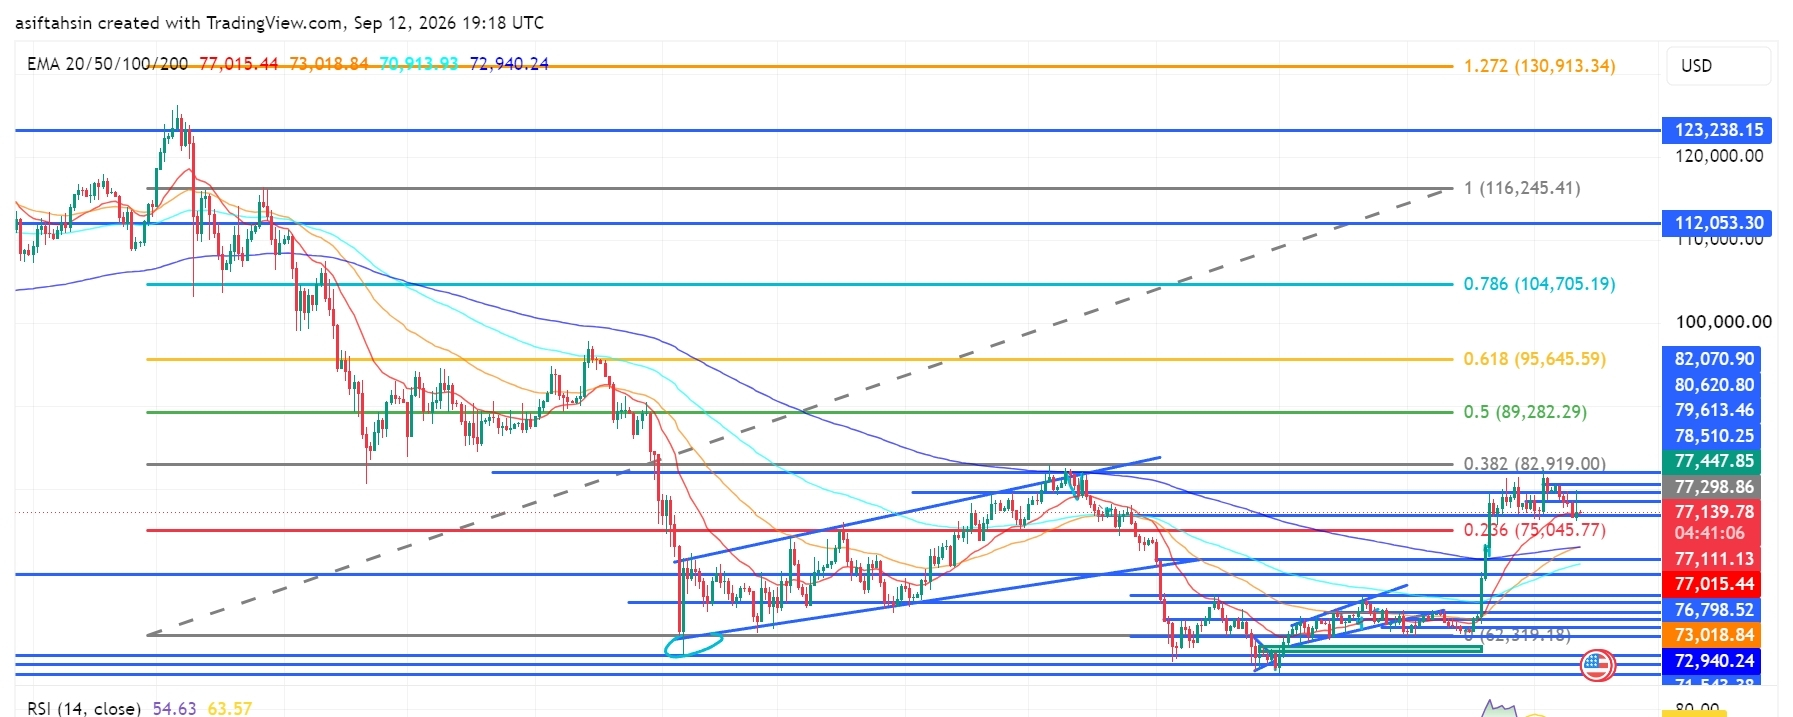
Artigo
Ver tradução
BTC Technical Outlook: Bitcoin Holds Above $77K as Bulls Defend the BreakoutBTC is currently trading around $77.1K, consolidating above the $75K–$77K breakout zone after the recent bullish recovery.
The broader structure remains constructive, but BTC is facing strong resistance around $77.4K–$82.9K. Bulls need to reclaim this resistance cluster and break the $82,919 Fibonacci level to unlock the next major upside expansion.
📈 EMA Structure
20 EMA: $77,015.44
50 EMA: $73,018.84
100 EMA: $70,913.93
200 EMA: $72,940.24
BTC is currently holding just above the 20 EMA, while remaining above the 50, 100 and 200 EMAs.
The $77,015 20 EMA is now an important short-term pivot. Holding above it keeps the recent recovery structure intact.
📐 Fibonacci Levels
0.236: $75,045.77
0.382: $82,919.00
0.5: $89,282.29
0.618: $95,645.59
0.786: $104,705.19
1.0: $116,245.41
1.272: $130,913.34
The $82,919 0.382 Fibonacci level is the key breakout point. A sustained move above it would significantly strengthen the medium-term bullish structure.
🟢 Bullish Scenario
BTC is currently consolidating below the $77.4K–$80.6K resistance cluster.
A clean breakout above $78,510–$79,614 could bring the next resistance levels into play.
🎯 Target 1: $80,620
🎯 Target 2: $82,070
🎯 Target 3: $82,919
🎯 Target 4: $89,282
🎯 Target 5: $95,645
🎯 Target 6: $104,705
If BTC successfully reclaims $82,919, the broader recovery could accelerate toward $89K and $95.6K.
🔴 Pullback Scenario
If BTC fails to break the current resistance zone, sellers could push price back toward the EMA and Fibonacci support structure.
Key supports:
$77,015 — 20 EMA
$76,798
$75,045 — 0.236 Fib
$73,018 — 50 EMA
$72,940 — 200 EMA
$71,543
$70,913 — 100 EMA
The $75,045–$77,015 region is particularly important. A successful retest here could provide the foundation for another attempt at $80K+.
However, losing $72,940–$70,913 would significantly weaken the current recovery structure.
🧠 Market Structure & Liquidity
BTC's recent structure can be viewed as:
Liquidity Sweep → Accumulation → Higher Highs/Higher Lows → Breakout → Retest → Consolidation → Potential Continuation
The June/July lows created a major liquidity area, followed by a strong recovery and breakout through the previous consolidation range.
BTC is now attempting to establish acceptance above $77K. The next major structural test is the $82K–$82.9K region, where previous price action and the 0.382 Fibonacci level converge.
📊 RSI Momentum
RSI: 54.63
RSI MA: 63.57
RSI remains above the neutral 50 level, indicating that bullish momentum is still present.
However, RSI is below its moving average, showing that momentum has cooled from the recent spike. A move back above 60–63 would strengthen the continuation setup.
🎯 Key Levels
Resistance:
$77,447 → $78,510 → $79,614 → $80,620 → $82,070 → $82,919 → $89,282 → $95,645
Support:
$77,015 → $76,798 → $75,045 → $73,018 → $72,940 → $71,543 → $70,913
📌 Final Outlook
BTC remains in a constructive recovery structure while holding above the $75K–$77K zone and the major EMA support cluster.
The immediate battle is $77.4K–$80.6K. A decisive breakout above this region could send BTC toward $82K–$82.9K, while a confirmed break above $82,919 would open the path toward $89.2K → $95.6K → $104.7K.
On the downside, $75,045 is the key Fibonacci support, while $72.9K–$70.9K is the major structural defense.
Bias: 🟢 Bullish above $75,045 | Stronger above $82,919
$BTC
{future}(BTCUSDT)
BTC Technical Outlook: Bitcoin Holds Above $77K as Bulls Defend the Breakout
BTC is currently trading around $77.1K, consolidating above the $75K–$77K breakout zone after the recent bullish recovery.
The broader structure remains constructive, but BTC is facing strong resistance around $77.4K–$82.9K. Bulls need to reclaim this resistance cluster and break the $82,919 Fibonacci level to unlock the next major upside expansion.
📈 EMA Structure
20 EMA: $77,015.44
50 EMA: $73,018.84
100 EMA: $70,913.93
200 EMA: $72,940.24
BTC is currently holding just above the 20 EMA, while remaining above the 50, 100 and 200 EMAs.
The $77,015 20 EMA is now an important short-term pivot. Holding above it keeps the recent recovery structure intact.
📐 Fibonacci Levels
0.236: $75,045.77
0.382: $82,919.00
0.5: $89,282.29
0.618: $95,645.59
0.786: $104,705.19
1.0: $116,245.41
1.272: $130,913.34
The $82,919 0.382 Fibonacci level is the key breakout point. A sustained move above it would significantly strengthen the medium-term bullish structure.
🟢 Bullish Scenario
BTC is currently consolidating below the $77.4K–$80.6K resistance cluster.
A clean breakout above $78,510–$79,614 could bring the next resistance levels into play.
🎯 Target 1: $80,620
🎯 Target 2: $82,070
🎯 Target 3: $82,919
🎯 Target 4: $89,282
🎯 Target 5: $95,645
🎯 Target 6: $104,705
If BTC successfully reclaims $82,919, the broader recovery could accelerate toward $89K and $95.6K.
🔴 Pullback Scenario
If BTC fails to break the current resistance zone, sellers could push price back toward the EMA and Fibonacci support structure.
Key supports:
$77,015 — 20 EMA
$76,798
$75,045 — 0.236 Fib
$73,018 — 50 EMA
$72,940 — 200 EMA
$71,543
$70,913 — 100 EMA
The $75,045–$77,015 region is particularly important. A successful retest here could provide the foundation for another attempt at $80K+.
However, losing $72,940–$70,913 would significantly weaken the current recovery structure.
🧠 Market Structure & Liquidity
BTC's recent structure can be viewed as:
Liquidity Sweep → Accumulation → Higher Highs/Higher Lows → Breakout → Retest → Consolidation → Potential Continuation
The June/July lows created a major liquidity area, followed by a strong recovery and breakout through the previous consolidation range.
BTC is now attempting to establish acceptance above $77K. The next major structural test is the $82K–$82.9K region, where previous price action and the 0.382 Fibonacci level converge.
📊 RSI Momentum
RSI: 54.63
RSI MA: 63.57
RSI remains above the neutral 50 level, indicating that bullish momentum is still present.
However, RSI is below its moving average, showing that momentum has cooled from the recent spike. A move back above 60–63 would strengthen the continuation setup.
🎯 Key Levels
Resistance:
$77,447 → $78,510 → $79,614 → $80,620 → $82,070 → $82,919 → $89,282 → $95,645
Support:
$77,015 → $76,798 → $75,045 → $73,018 → $72,940 → $71,543 → $70,913
📌 Final Outlook
BTC remains in a constructive recovery structure while holding above the $75K–$77K zone and the major EMA support cluster.
The immediate battle is $77.4K–$80.6K. A decisive breakout above this region could send BTC toward $82K–$82.9K, while a confirmed break above $82,919 would open the path toward $89.2K → $95.6K → $104.7K.
On the downside, $75,045 is the key Fibonacci support, while $72.9K–$70.9K is the major structural defense.
Bias: 🟢 Bullish above $75,045 | Stronger above $82,919
$BTC
The broader structure remains constructive, but BTC is facing strong resistance around $77.4K–$82.9K. Bulls need to reclaim this resistance cluster and break the $82,919 Fibonacci level to unlock the next major upside expansion.
📈 EMA Structure
20 EMA: $77,015.44
50 EMA: $73,018.84
100 EMA: $70,913.93
200 EMA: $72,940.24
BTC is currently holding just above the 20 EMA, while remaining above the 50, 100 and 200 EMAs.
The $77,015 20 EMA is now an important short-term pivot. Holding above it keeps the recent recovery structure intact.
📐 Fibonacci Levels
0.236: $75,045.77
0.382: $82,919.00
0.5: $89,282.29
0.618: $95,645.59
0.786: $104,705.19
1.0: $116,245.41
1.272: $130,913.34
The $82,919 0.382 Fibonacci level is the key breakout point. A sustained move above it would significantly strengthen the medium-term bullish structure.
🟢 Bullish Scenario
BTC is currently consolidating below the $77.4K–$80.6K resistance cluster.
A clean breakout above $78,510–$79,614 could bring the next resistance levels into play.
🎯 Target 1: $80,620
🎯 Target 2: $82,070
🎯 Target 3: $82,919
🎯 Target 4: $89,282
🎯 Target 5: $95,645
🎯 Target 6: $104,705
If BTC successfully reclaims $82,919, the broader recovery could accelerate toward $89K and $95.6K.
🔴 Pullback Scenario
If BTC fails to break the current resistance zone, sellers could push price back toward the EMA and Fibonacci support structure.
Key supports:
$77,015 — 20 EMA
$76,798
$75,045 — 0.236 Fib
$73,018 — 50 EMA
$72,940 — 200 EMA
$71,543
$70,913 — 100 EMA
The $75,045–$77,015 region is particularly important. A successful retest here could provide the foundation for another attempt at $80K+.
However, losing $72,940–$70,913 would significantly weaken the current recovery structure.
🧠 Market Structure & Liquidity
BTC's recent structure can be viewed as:
Liquidity Sweep → Accumulation → Higher Highs/Higher Lows → Breakout → Retest → Consolidation → Potential Continuation
The June/July lows created a major liquidity area, followed by a strong recovery and breakout through the previous consolidation range.
BTC is now attempting to establish acceptance above $77K. The next major structural test is the $82K–$82.9K region, where previous price action and the 0.382 Fibonacci level converge.
📊 RSI Momentum
RSI: 54.63
RSI MA: 63.57
RSI remains above the neutral 50 level, indicating that bullish momentum is still present.
However, RSI is below its moving average, showing that momentum has cooled from the recent spike. A move back above 60–63 would strengthen the continuation setup.
🎯 Key Levels
Resistance:
$77,447 → $78,510 → $79,614 → $80,620 → $82,070 → $82,919 → $89,282 → $95,645
Support:
$77,015 → $76,798 → $75,045 → $73,018 → $72,940 → $71,543 → $70,913
📌 Final Outlook
BTC remains in a constructive recovery structure while holding above the $75K–$77K zone and the major EMA support cluster.
The immediate battle is $77.4K–$80.6K. A decisive breakout above this region could send BTC toward $82K–$82.9K, while a confirmed break above $82,919 would open the path toward $89.2K → $95.6K → $104.7K.
On the downside, $75,045 is the key Fibonacci support, while $72.9K–$70.9K is the major structural defense.
Bias: 🟢 Bullish above $75,045 | Stronger above $82,919
$BTC
37
Inicia sessão para explorar mais conteúdos
Junta-te a utilizadores de criptomoedas de todo o mundo na Binance Square
⚡️ Obtém informações úteis e recentes sobre criptomoedas.
💬 Com a confiança da maior exchange de criptomoedas do mundo.
👍 Descobre perspetivas reais de criadores verificados.
E-mail/Número de telefone
Tópicos em Tendência
AIStocksWhatNext
54,120 visualizações
360 a discutir
Participe e ganhe recompensas de tráfego na nossa campanha de hashtag em alta
✨Tópico: Que outras oportunidades de investimento ainda existem enquanto as ações de IA continuam subindo?
👉Como participar:
Publique uma postagem curta ou um artigo com a hashtag #AIStocksWhatNext
Compartilhe se você está otimista ou pessimista e publique suas participações em ações de IA ou suas operações — usar o widget de negociação pode melhorar sua elegibilidade.
Você também pode fortalecer sua postagem compartilhando dados ou gráficos e evitando imagens geradas por IA.
✍️Crie conteúdo com base nos ângulos abaixo:
- A Nvidia diz que as vendas de chips vão dobrar no próximo ano, e as principais empresas de IA continuam registrando receita recorde; o gasto com computação por trás disso é igualmente impressionante. A demanda por IA realmente decolou? E por quanto tempo isso pode durar? As ações de IA estão em alta em todo o mercado. Isso é uma ruptura real ou apenas um repique de curto prazo?
- Líderes da indústria estão pedindo para desacelerar o desenvolvimento de IA, enquanto Trump planeja construir uma “Força de IA”, afirmando que a IA poderia representar 25% do PIB dos EUA no futuro. De que lado você está? O apoio em nível estadual será uma vitória de longo prazo para as ações de IA?
- Você está comprando ações de IA? Compartilhe com nosso widget de compartilhamento de negociações suas operações/posições relacionadas a IA.
⏰Período da campanha:
- 2026-09-22 7:00 - 2026-09-24 4:00 UTC
🎁Recompensa:
- As postagens qualificadas que cumprirem as diretrizes acima e tiverem mais de 100 palavras serão revisadas e poderão receber um impulso aleatório de tráfego de 500 a 3.000 visualizações. Você receberá uma notificação do seu secretário de feed caso sua postagem seja selecionada.
- Tenha a chance de ter seu artigo destacado no Binance Square Official
Precisa de ideias para sua postagem? Visite a página do tópico #AIStocksWhatNext ou a Square Guide on How to Post for Better Reach.
Binance Square Official
·160 gostos
·197.2k visualizações
MuseOvertakesChatGPTAsTopFreeIOSApp
295 visualizações
0 a discutir
TokenizedStockPlatformsCouldLaunchNextQuarter
1,251 visualizações
11 a discutir