

crypto4light 1
411 Publicações

crypto4light 1
Denunciar
Bloquear Utilizador
Crypto community
0 A seguir
0 Seguidores
2 Gostaram
Publicações
Ver tradução
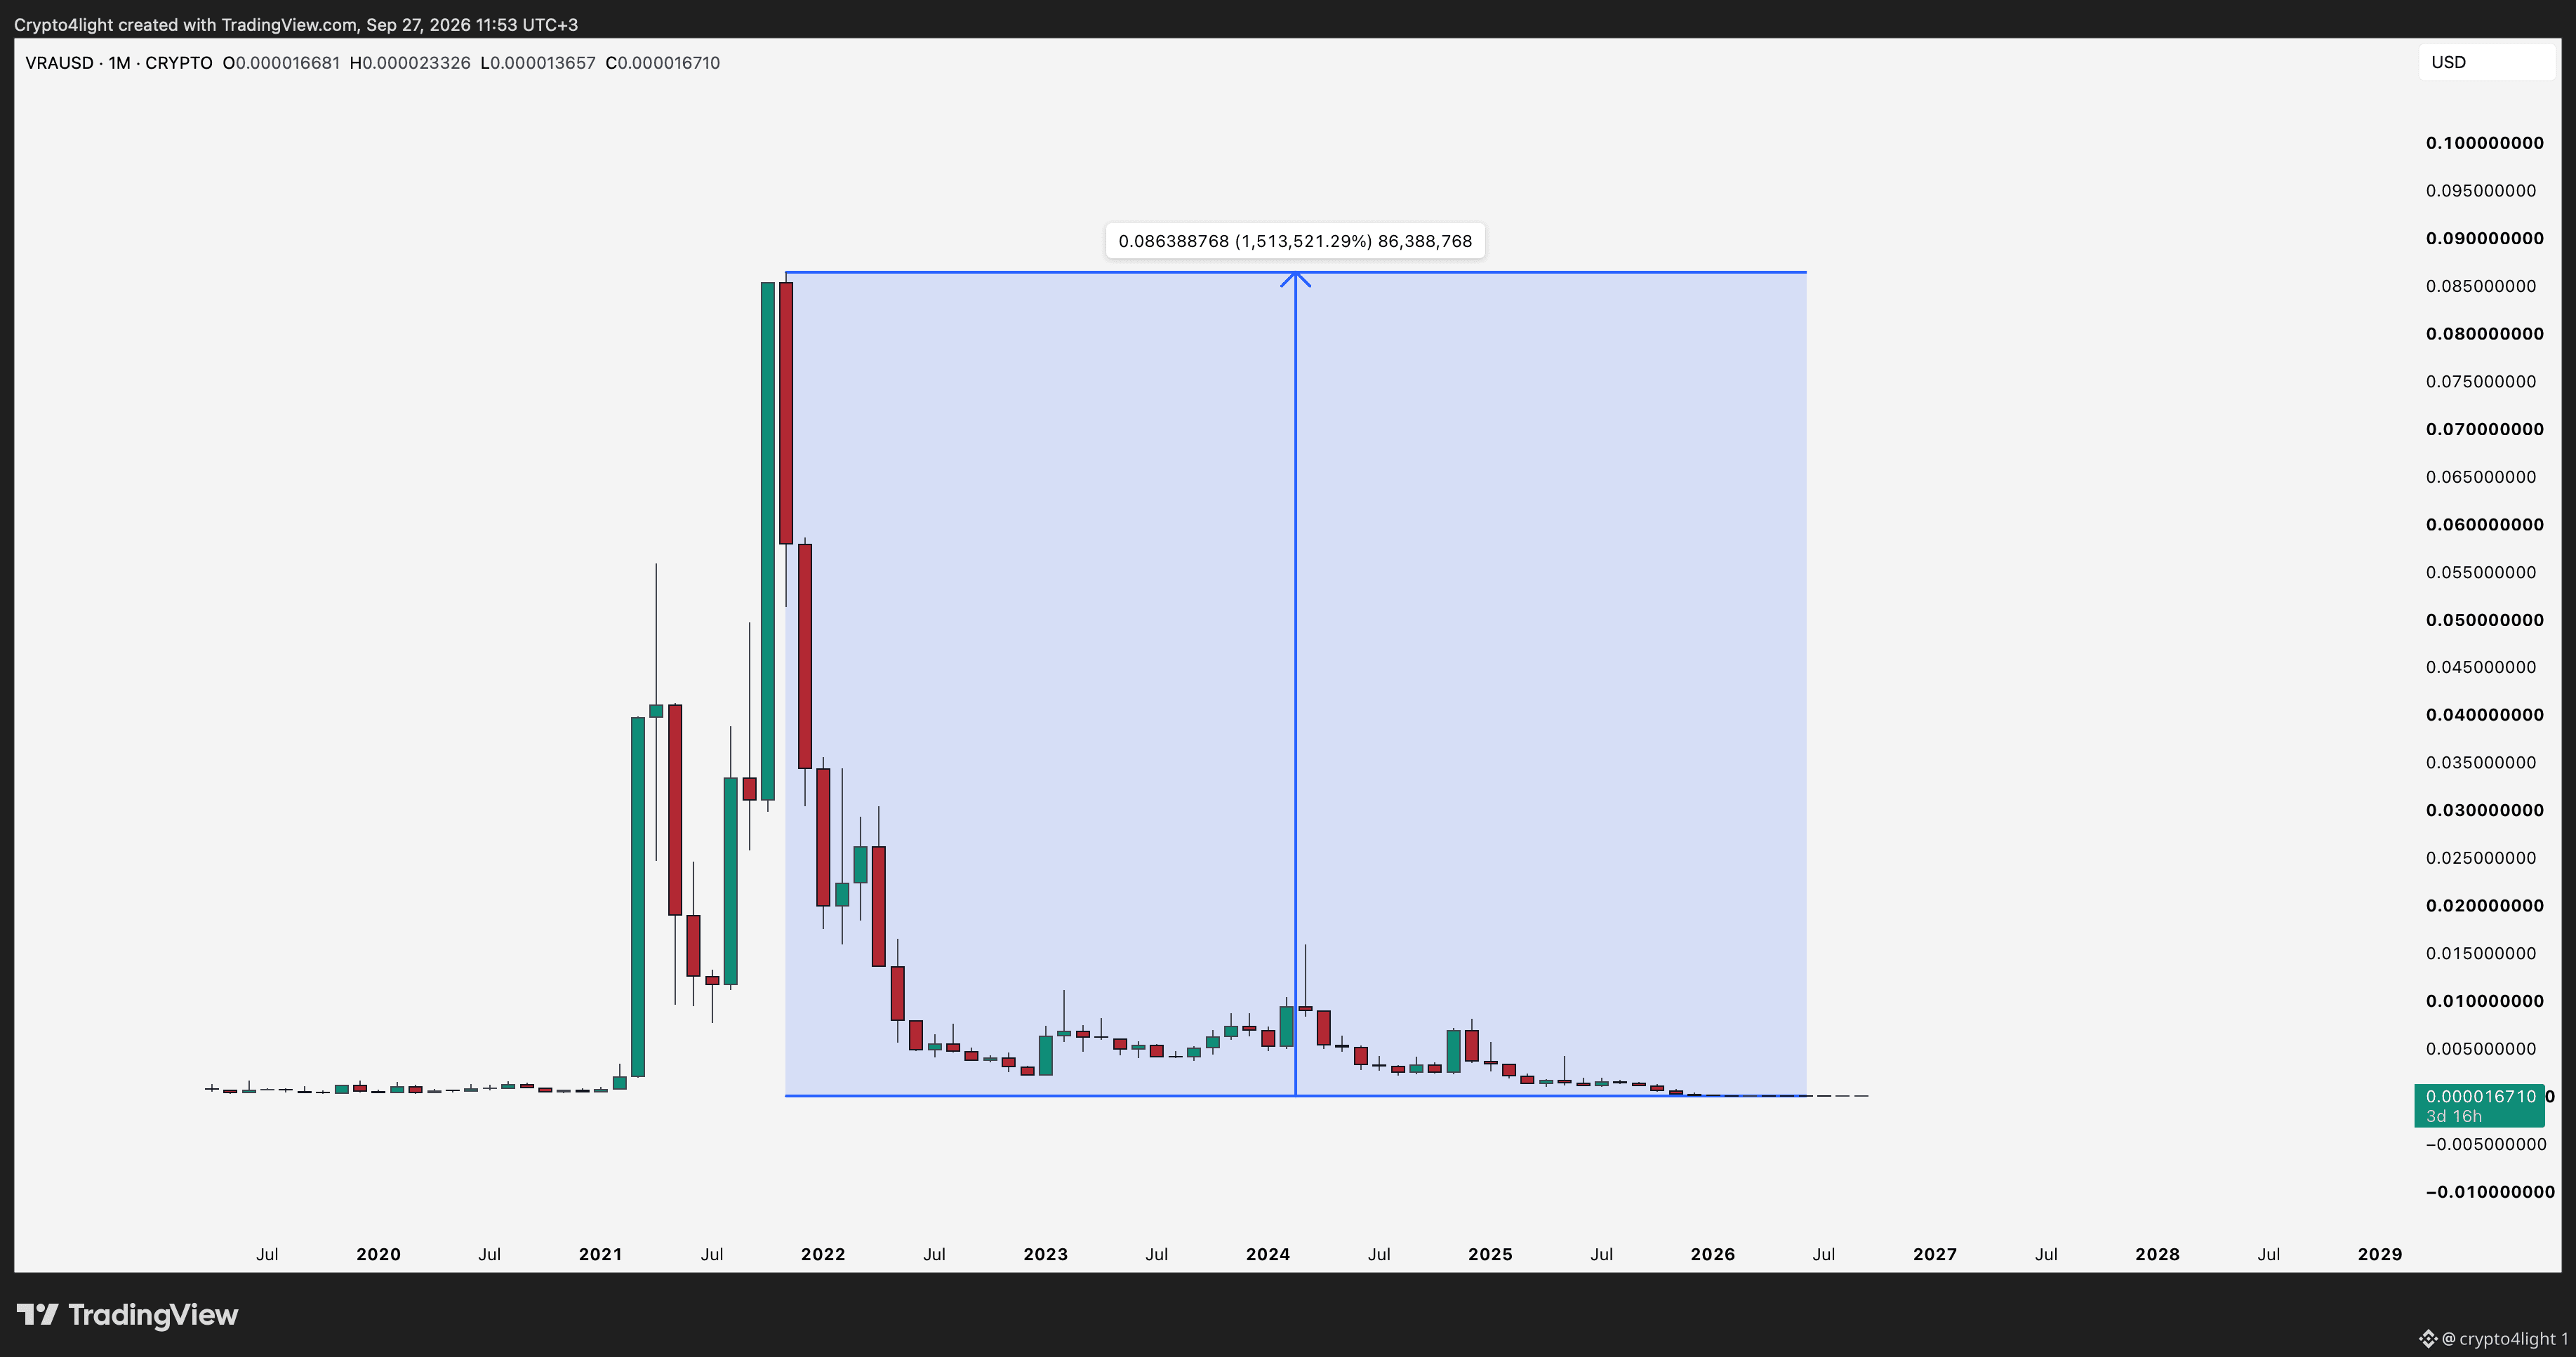
I remember every time I made a video about Verasity, people in the comments called me an idiot and said I didn’t understand anything about the project’s fundamentals. Welcome to reality — not the made-up bullshit the team behind your “favorite” project has been feeding you for the last 5 years! Projects like this can become a cult, almost like a sect. Now, for example, if you bought VRA in 2021 and simply want to break even and get your money back, you’d need a 1,531,521% increase. And then the $VRA cult leader will finally give you your money back! Filter your social media feeds. Filter the influencers you listen to.
I remember every time I made a video about Verasity, people in the comments called me an idiot and said I didn’t understand anything about the project’s fundamentals. Welcome to reality — not the made-up bullshit the team behind your “favorite” project has been feeding you for the last 5 years! Projects like this can become a cult, almost like a sect. Now, for example, if you bought VRA in 2021 and simply want to break even and get your money back, you’d need a 1,531,521% increase. And then the $VRA cult leader will finally give you your money back! Filter your social media feeds. Filter the influencers you listen to.
37
Ver tradução
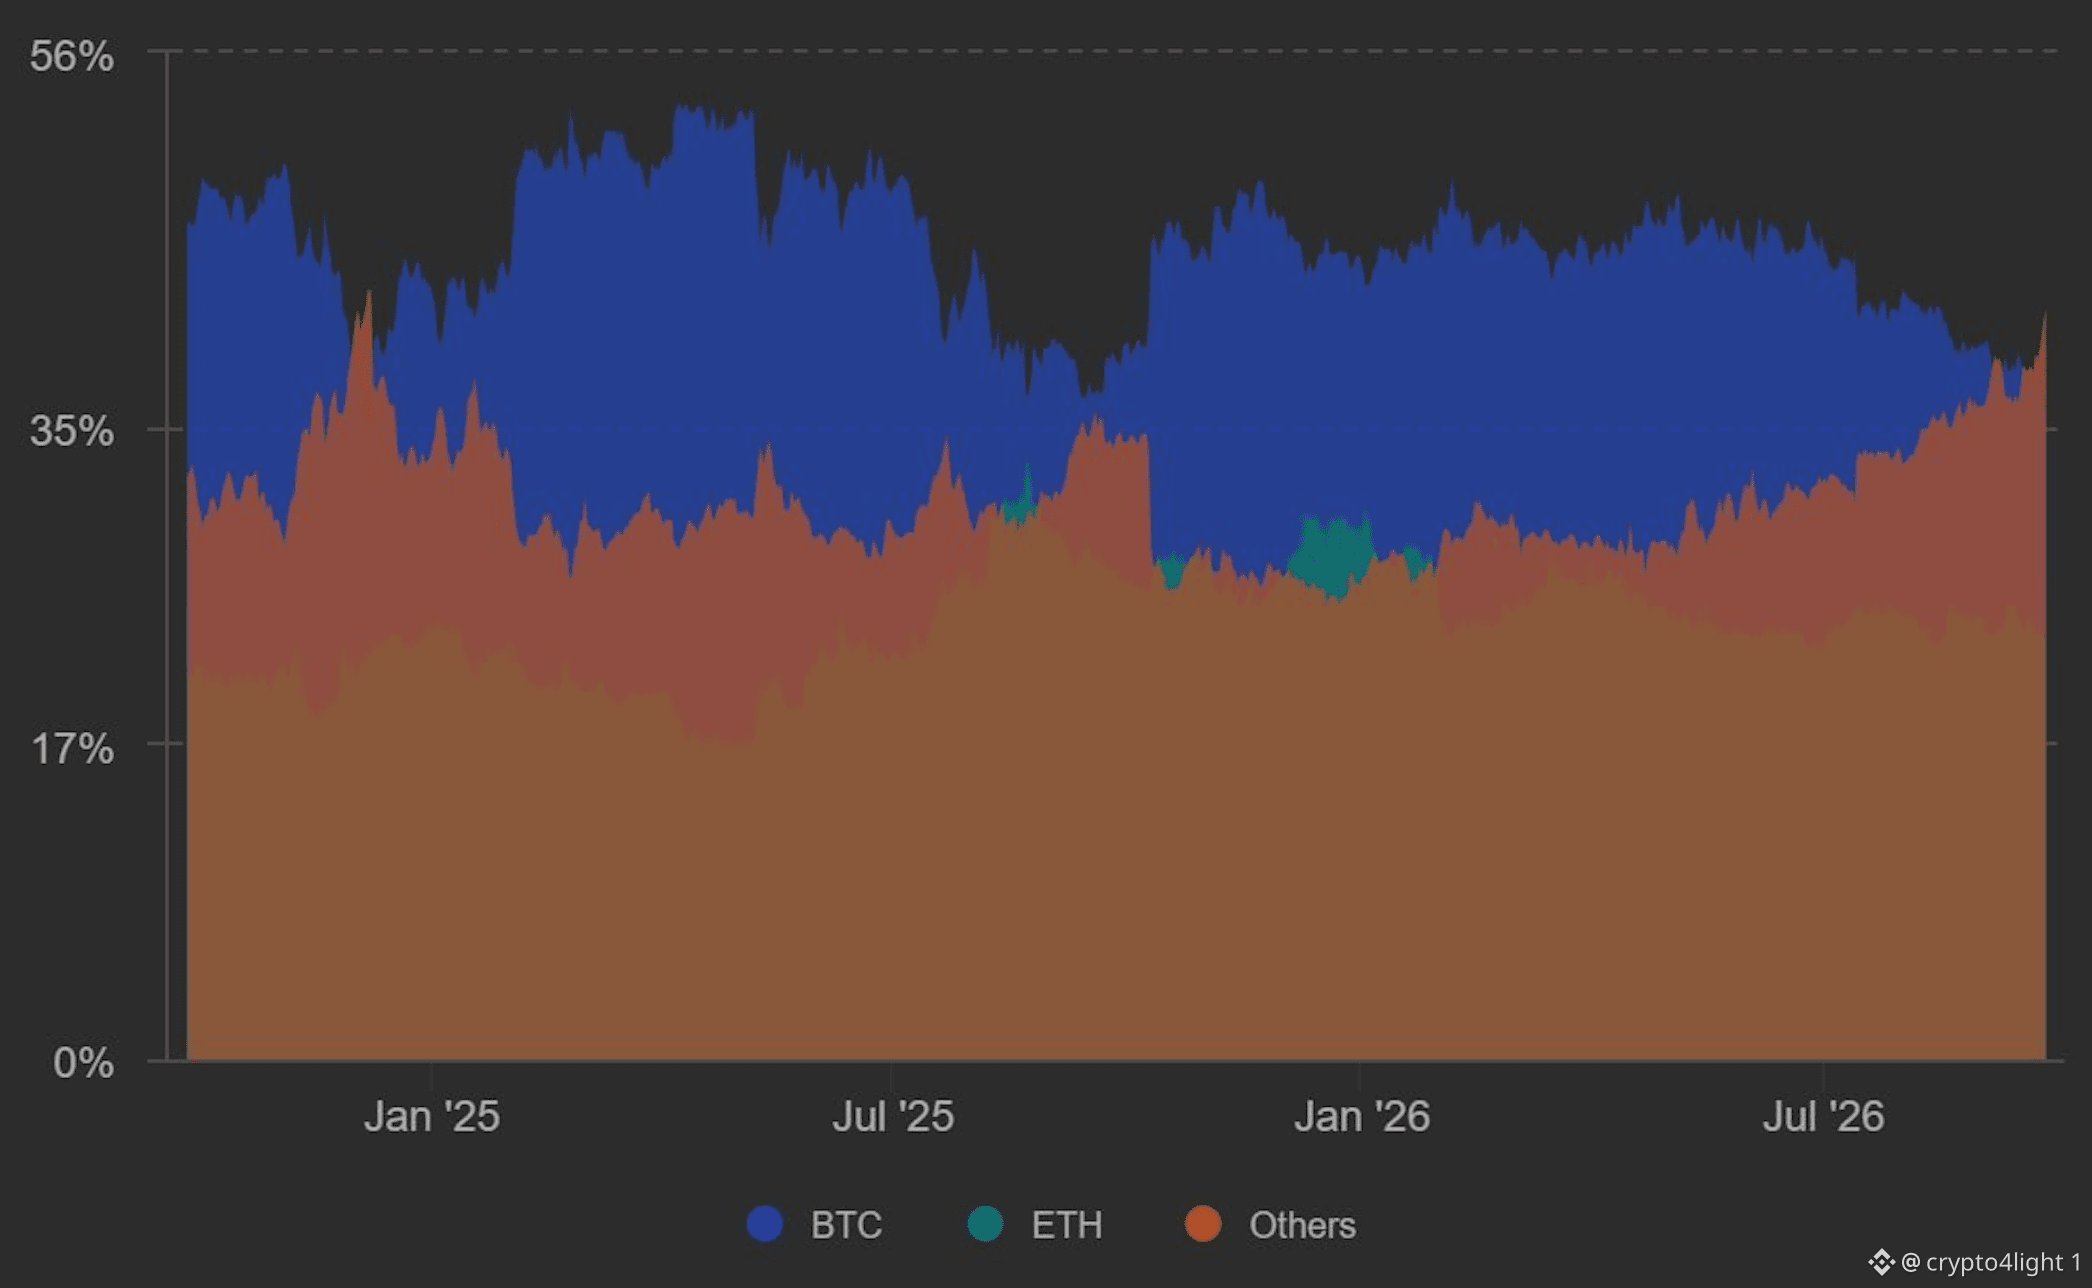
Altcoins Are Turning Into an Extremely High-Risk Market Again The share of open futures positions concentrated in altcoins is now at its highest level since early 2024. This kind of market behavior typically appears when traders start aggressively increasing leverage — one of the classic signs of an overheated and euphoric market. $ETH
Altcoins Are Turning Into an Extremely High-Risk Market Again The share of open futures positions concentrated in altcoins is now at its highest level since early 2024. This kind of market behavior typically appears when traders start aggressively increasing leverage — one of the classic signs of an overheated and euphoric market. $ETH
56
Ver tradução
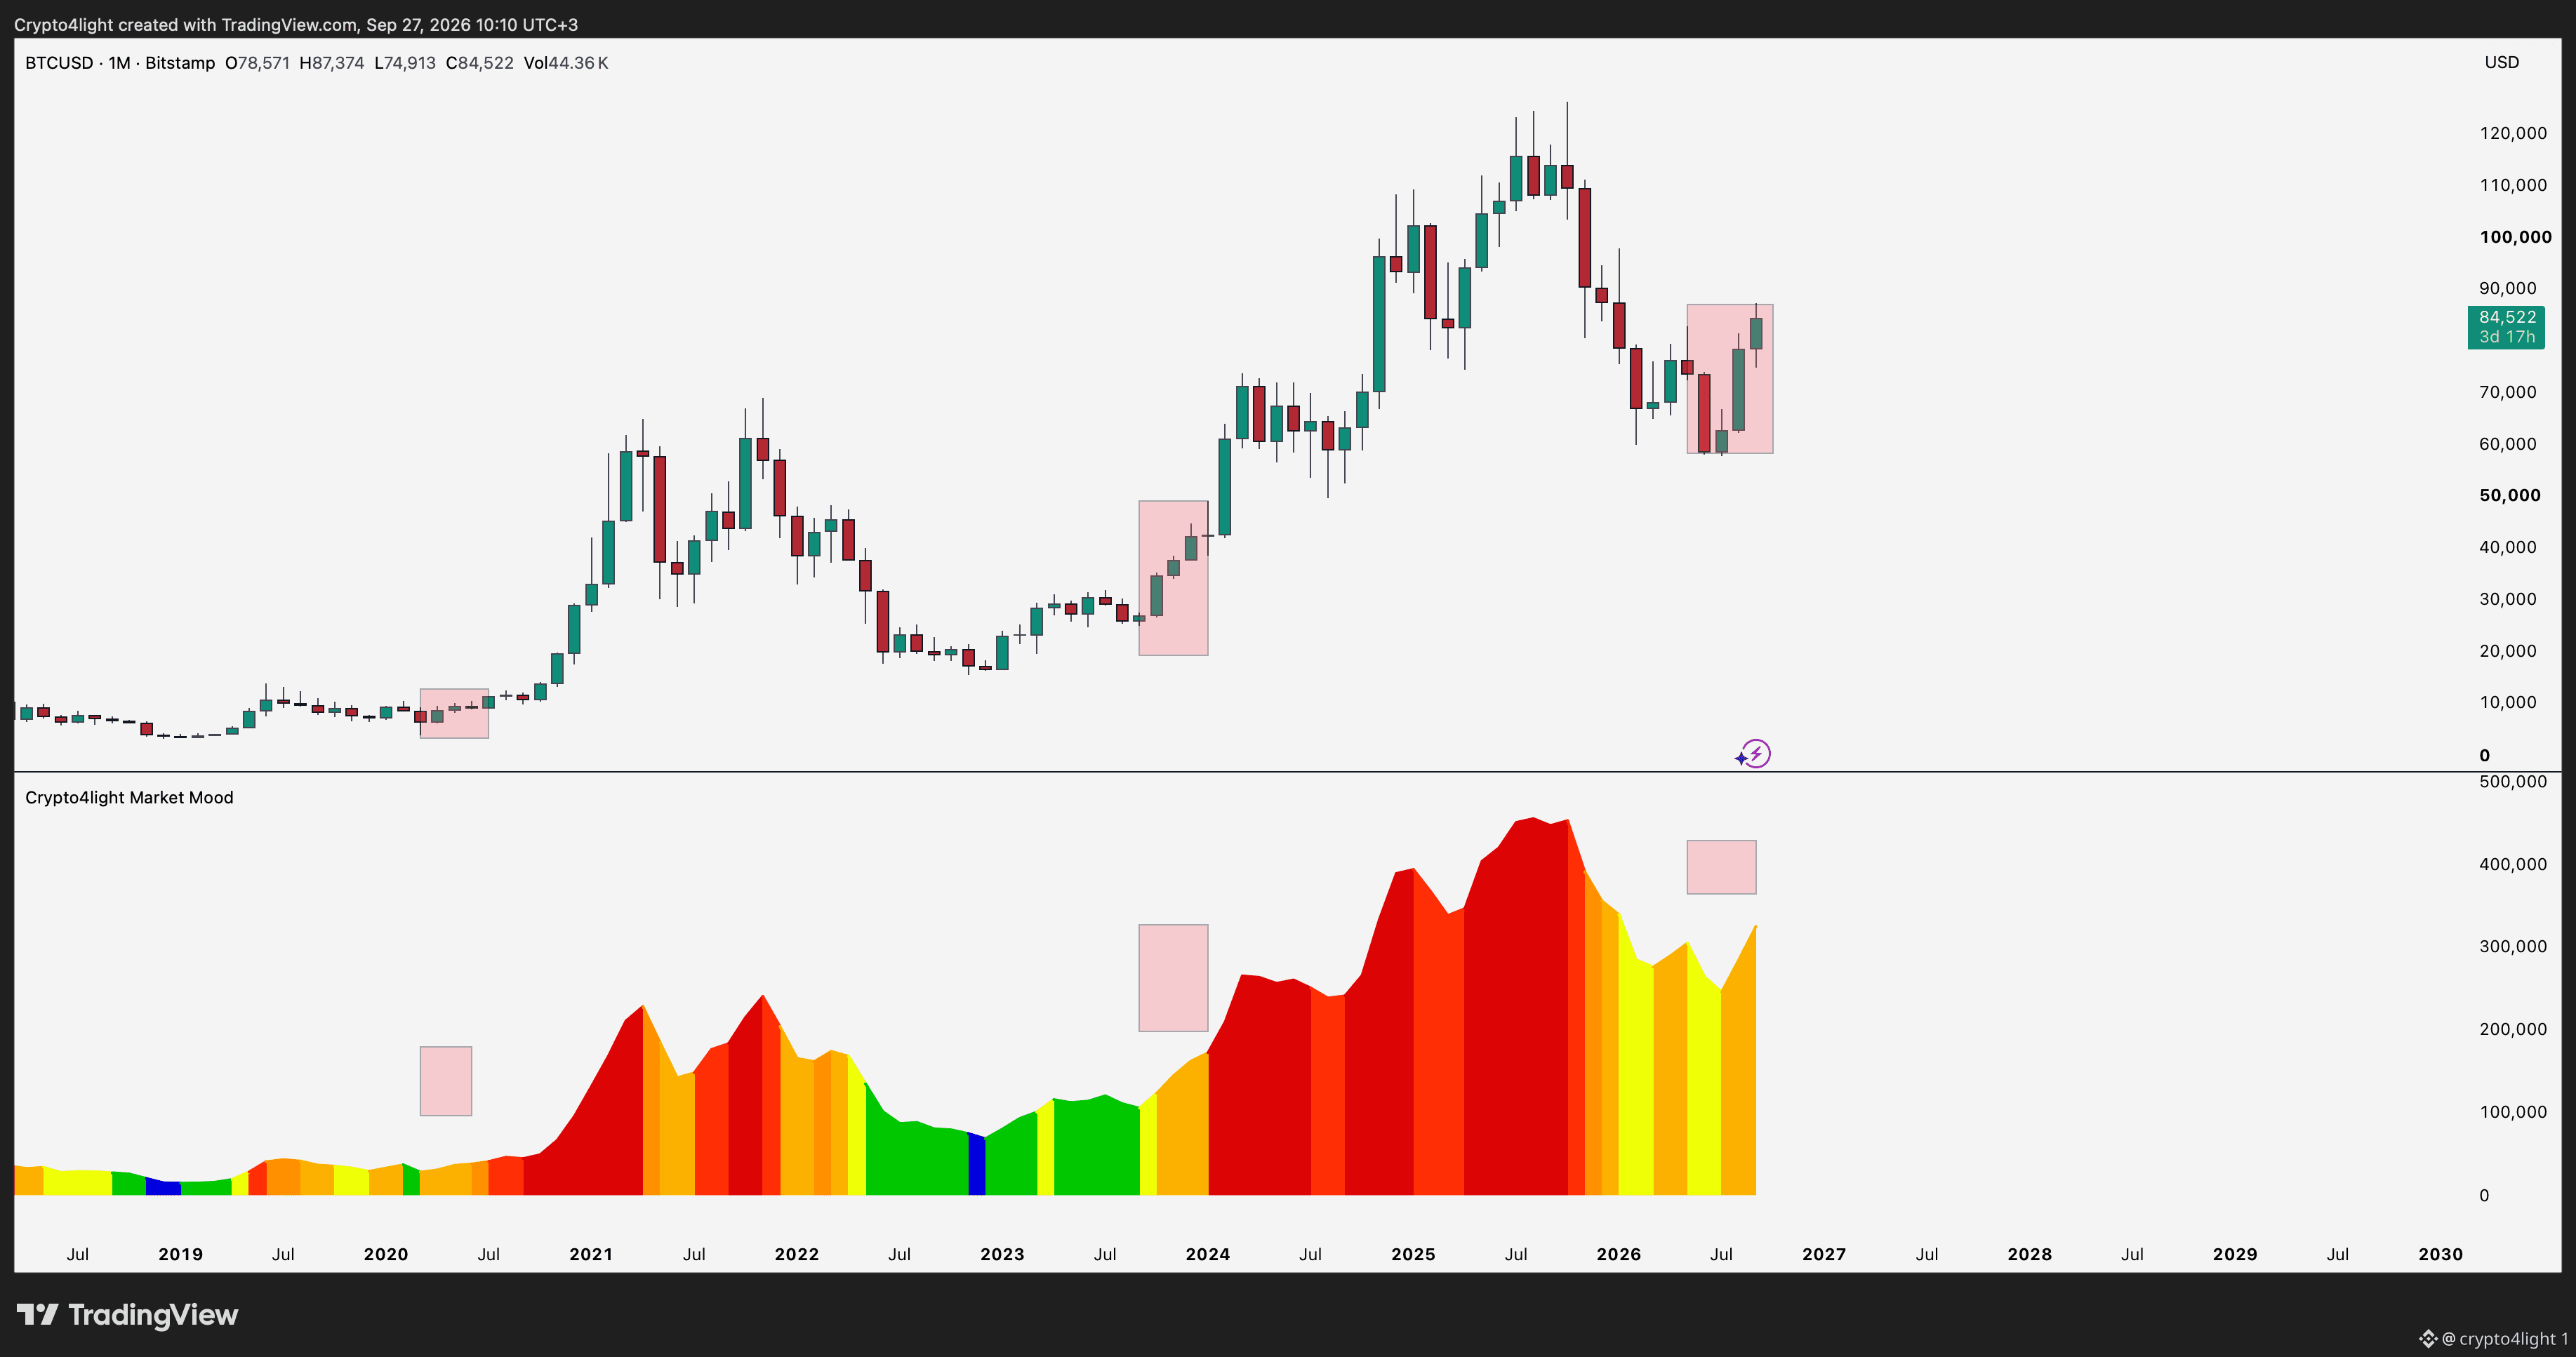
On the Bitcoin monthly chart, my Market Mood indicator is showing a period of positivity and optimism, but we’re not in the euphoria zone yet! A month of correction in October would be ideal, and after that we could gradually move into the euphoria zone. How long it will last and how much Bitcoin will rise from the current levels, nobody knows, but I think the rally could end somewhere around $160,000! $BTC
On the Bitcoin monthly chart, my Market Mood indicator is showing a period of positivity and optimism, but we’re not in the euphoria zone yet! A month of correction in October would be ideal, and after that we could gradually move into the euphoria zone. How long it will last and how much Bitcoin will rise from the current levels, nobody knows, but I think the rally could end somewhere around $160,000! $BTC
62
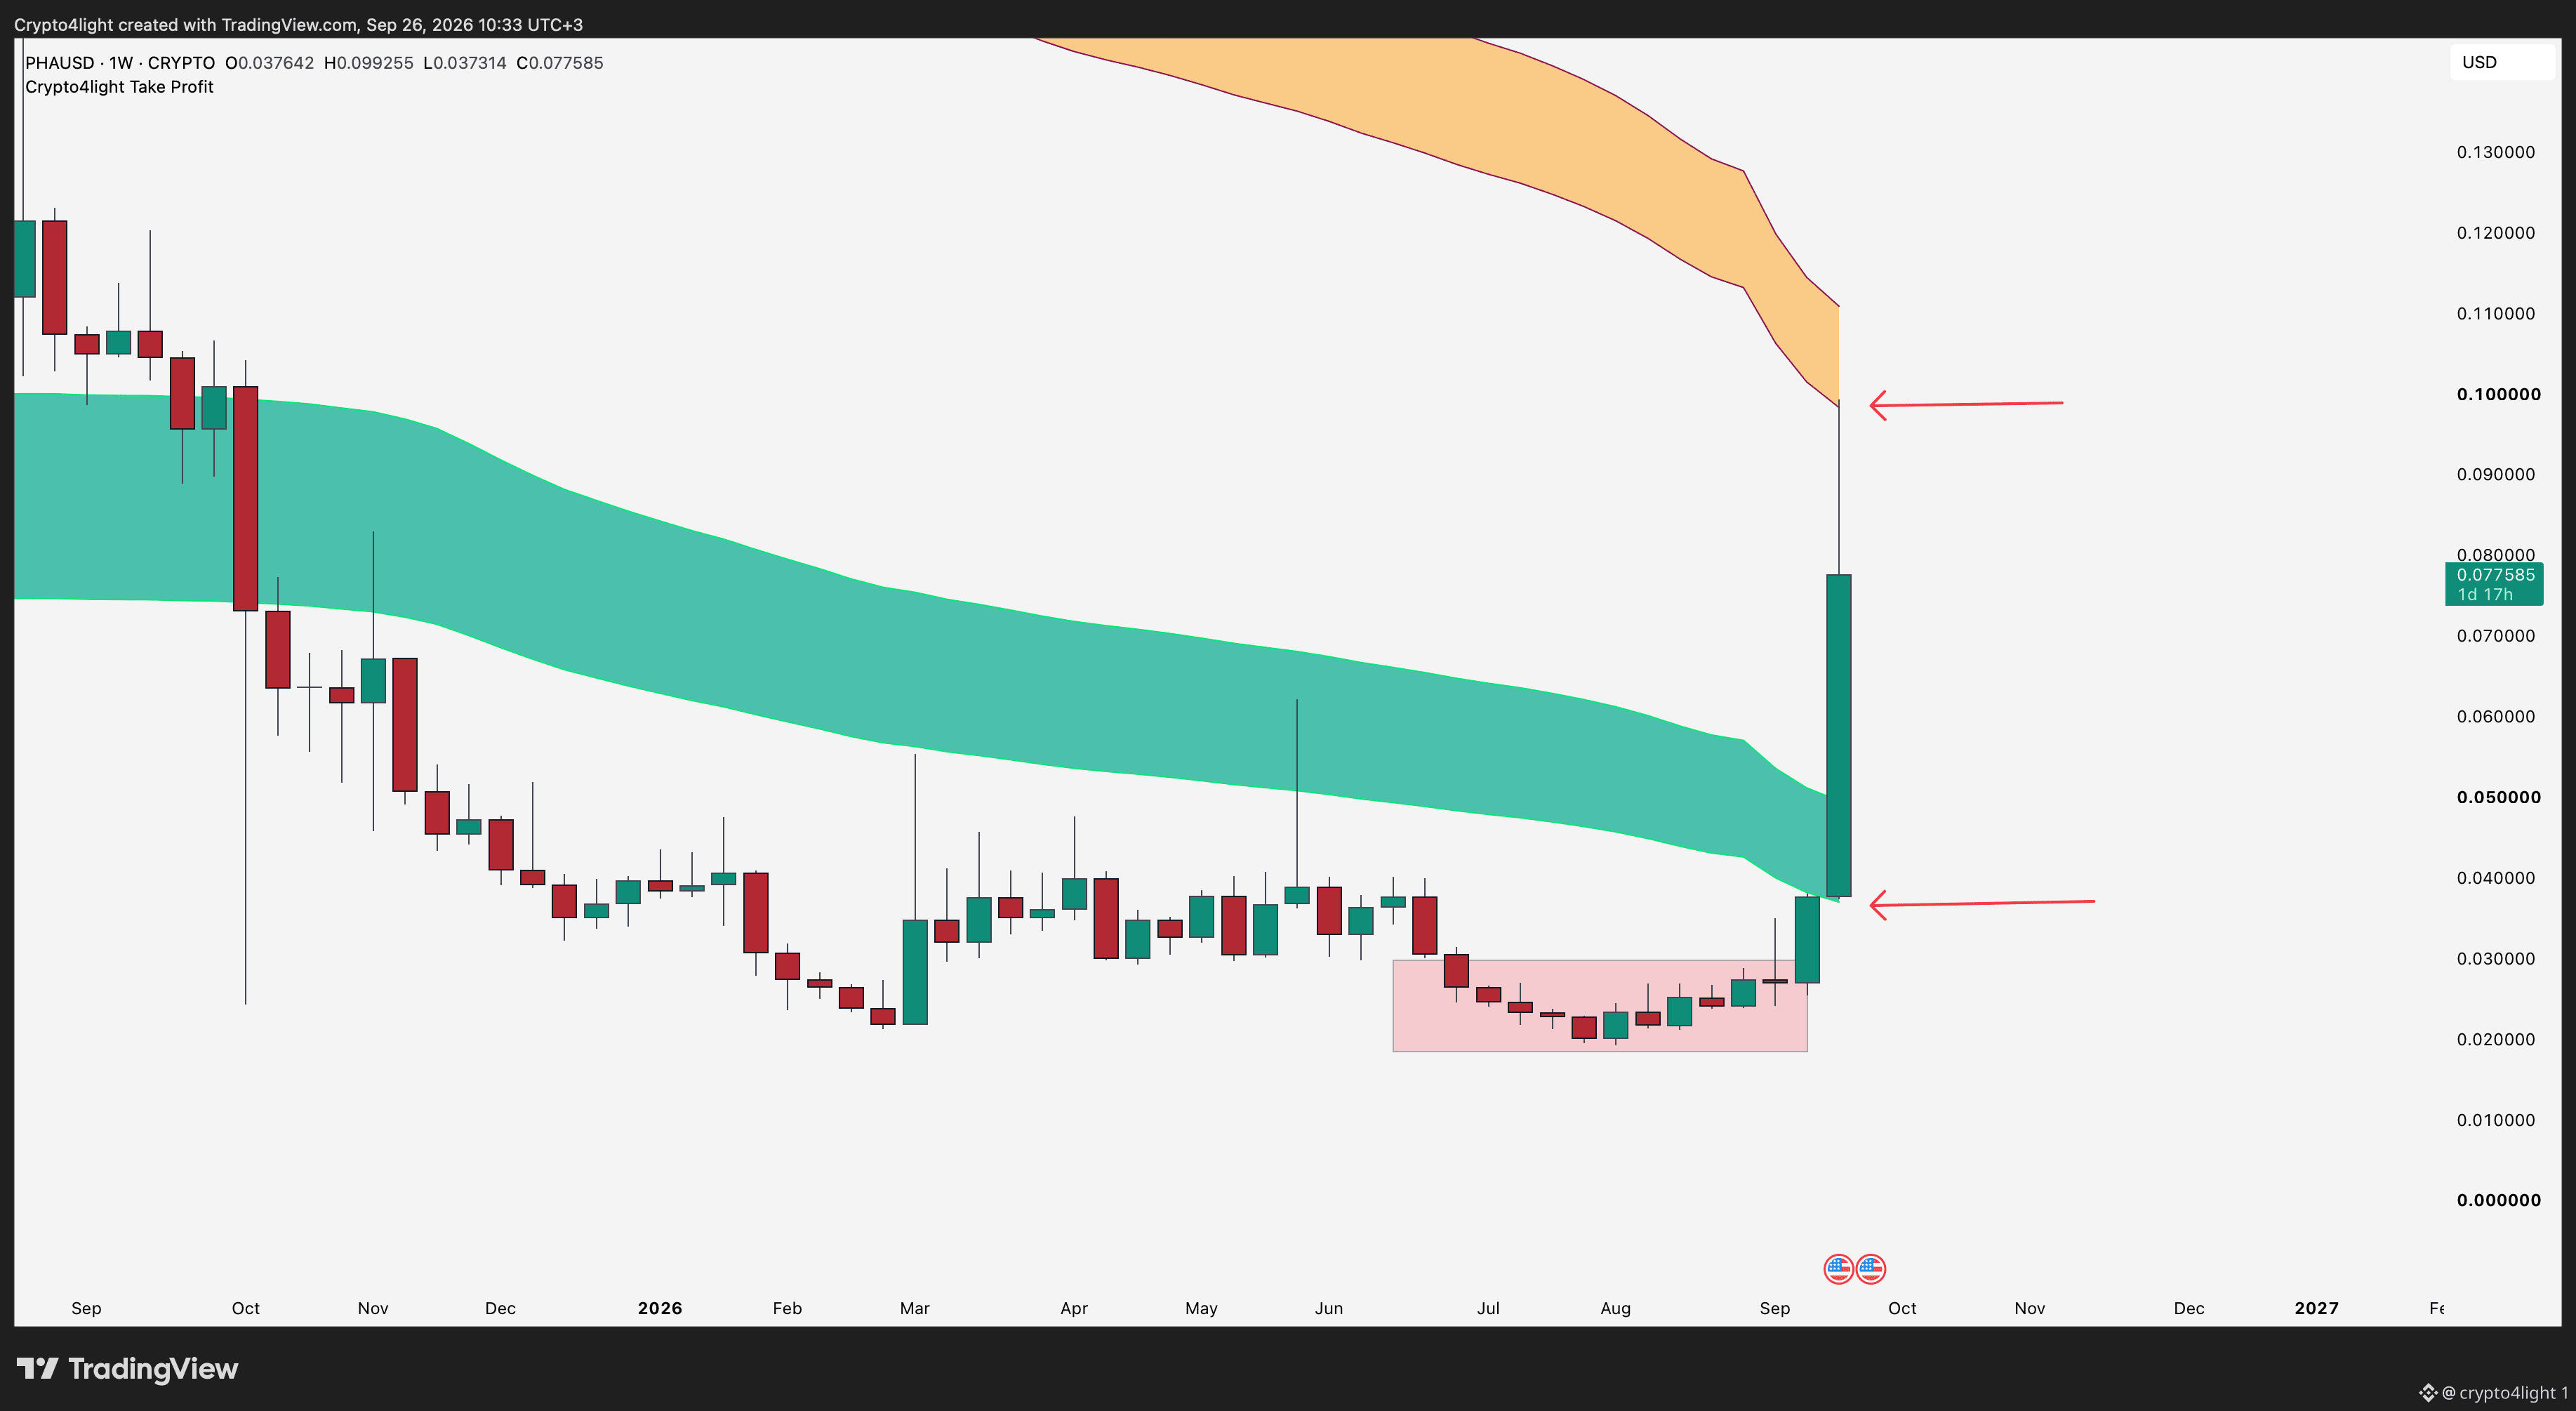
No vídeo de hoje sobre o token PHA, vou mostrar um exemplo claro de como qualquer token, quer você acredite ou não, eventualmente vai chegar e testar a Linha de Take Profit no timeframe semanal! Por que isso é importante? Por exemplo, você perdeu muitos tokens que estão negociando abaixo da Linha de Valor Fundamental, e o token que você estava acompanhando já testou essa linha! Já é tarde demais para comprar? Não! É apenas que o retorno potencial já será menor! Além disso, você precisa estar preparado para o fato de que, após testar a Linha de Valor Fundamental, alguns ativos vão imediatamente fazer um teste de uma única vela da Linha de Take Profit, enquanto alguns ativos terão uma ação de preço mais “chata” e ficarão se movendo de lado por um tempo antes de fazer um movimento de impulso! Lembro que ainda existem vários tokens abaixo da Linha de Valor Fundamental! Faça sua própria pesquisa! $PHA
No vídeo de hoje sobre o token PHA, vou mostrar um exemplo claro de como qualquer token, quer você acredite ou não, eventualmente vai chegar e testar a Linha de Take Profit no timeframe semanal! Por que isso é importante? Por exemplo, você perdeu muitos tokens que estão negociando abaixo da Linha de Valor Fundamental, e o token que você estava acompanhando já testou essa linha! Já é tarde demais para comprar? Não! É apenas que o retorno potencial já será menor! Além disso, você precisa estar preparado para o fato de que, após testar a Linha de Valor Fundamental, alguns ativos vão imediatamente fazer um teste de uma única vela da Linha de Take Profit, enquanto alguns ativos terão uma ação de preço mais “chata” e ficarão se movendo de lado por um tempo antes de fazer um movimento de impulso! Lembro que ainda existem vários tokens abaixo da Linha de Valor Fundamental! Faça sua própria pesquisa! $PHA
67
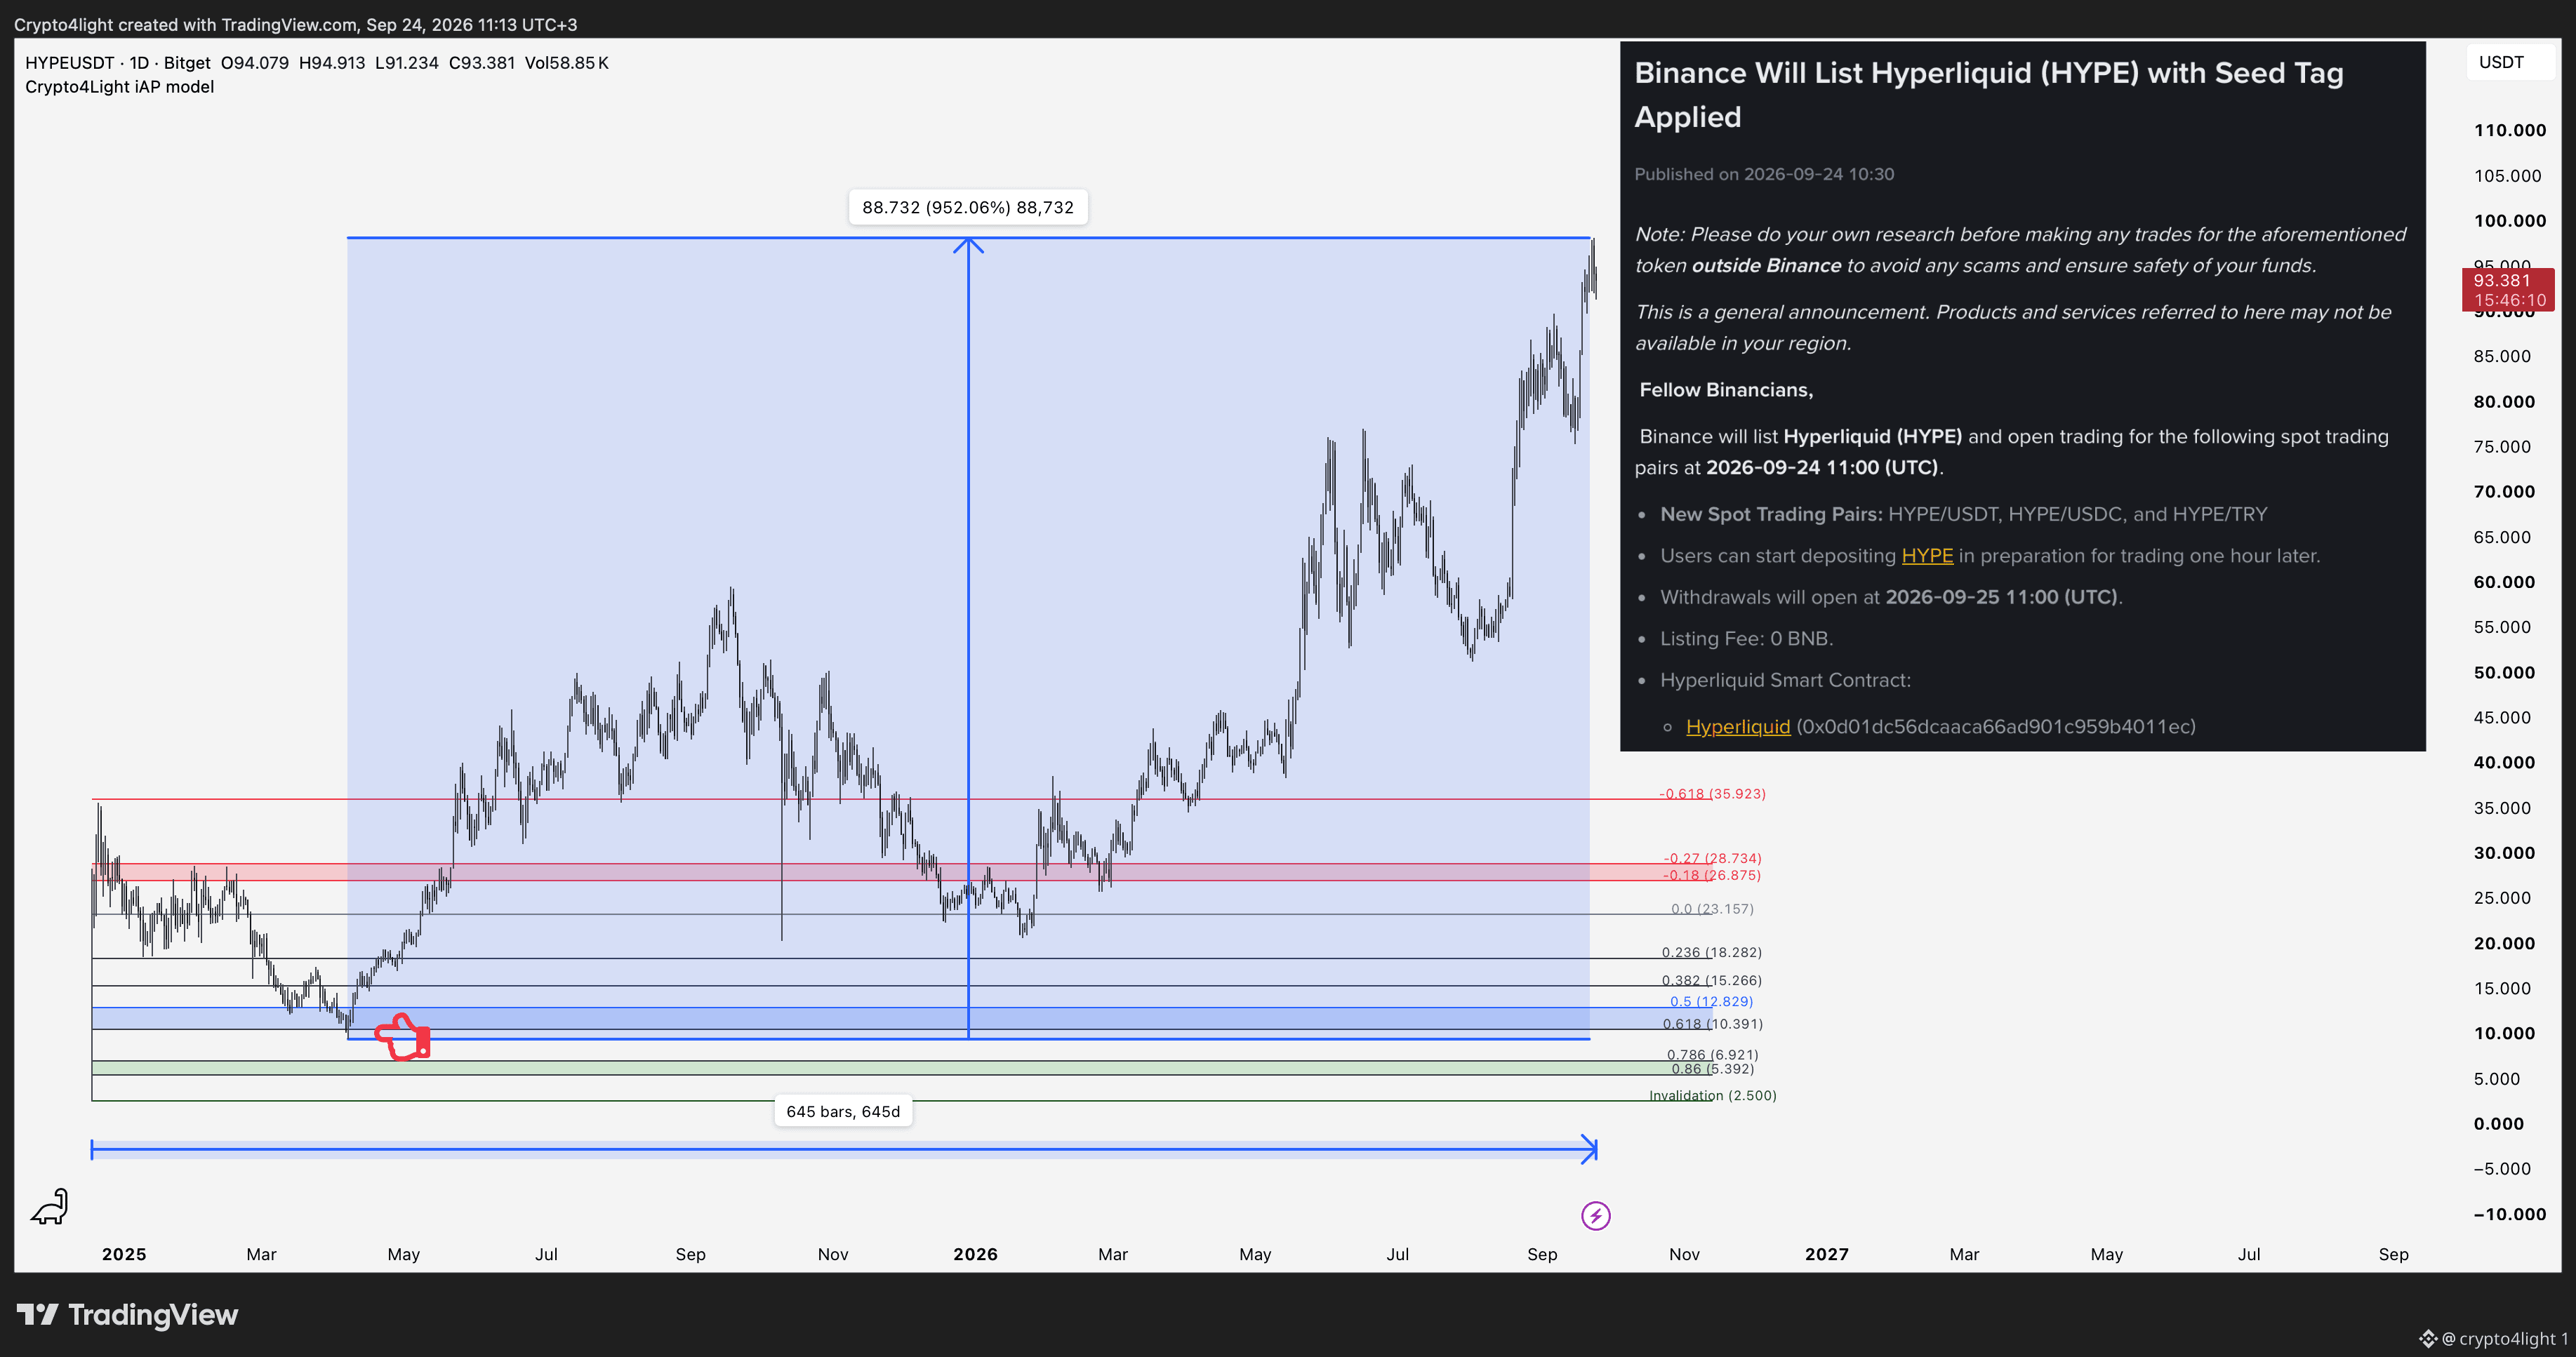
O mesmo padrão de novo! Lembre-se do que aconteceu com os tokens que bombaram antes de serem listados na Binance, e então a Binance de alguma forma magicamente os adicionou para negociação bem perto dos níveis do pico deles?! Bem, acho que $HYPE pode estar indo para o mesmo destino. 1. Meu modelo de iAP se desenrolou perfeitamente na Bitget há 2 anos, começando pela primeira zona de interesse. 2. HYPE já fez várias novas ATHs, e este já é um token com uma grande capitalização de mercado. 3. A Binance esperou mais de 630 dias para finalmente dar atenção à DEX mais popular de toda a indústria? É… claro. 🤌
O mesmo padrão de novo! Lembre-se do que aconteceu com os tokens que bombaram antes de serem listados na Binance, e então a Binance de alguma forma magicamente os adicionou para negociação bem perto dos níveis do pico deles?! Bem, acho que $HYPE pode estar indo para o mesmo destino. 1. Meu modelo de iAP se desenrolou perfeitamente na Bitget há 2 anos, começando pela primeira zona de interesse. 2. HYPE já fez várias novas ATHs, e este já é um token com uma grande capitalização de mercado. 3. A Binance esperou mais de 630 dias para finalmente dar atenção à DEX mais popular de toda a indústria? É… claro. 🤌
72
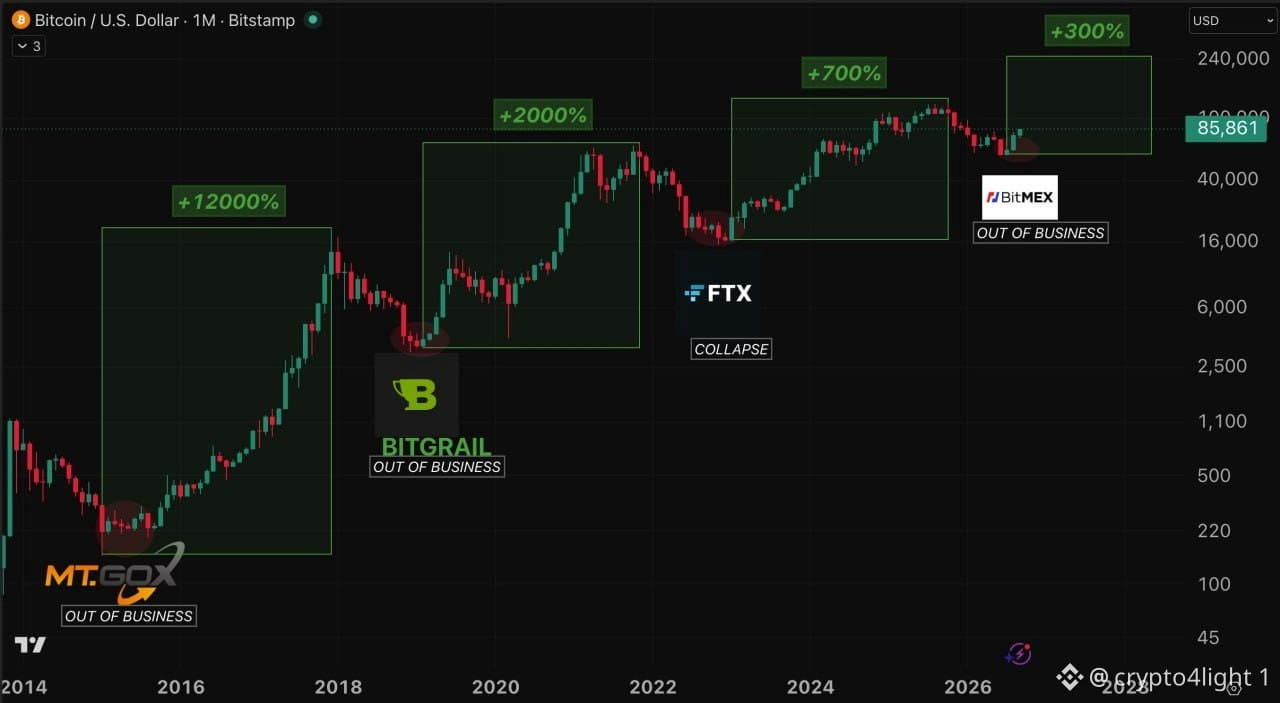
Teoria do Twitter: Crises que formaram o fundo para o $BTC E faz sentido! E desta vez, 3 exchanges encerraram e as pessoas estão esperando 45k...🤌
Teoria do Twitter: Crises que formaram o fundo para o $BTC E faz sentido! E desta vez, 3 exchanges encerraram e as pessoas estão esperando 45k...🤌
1
58
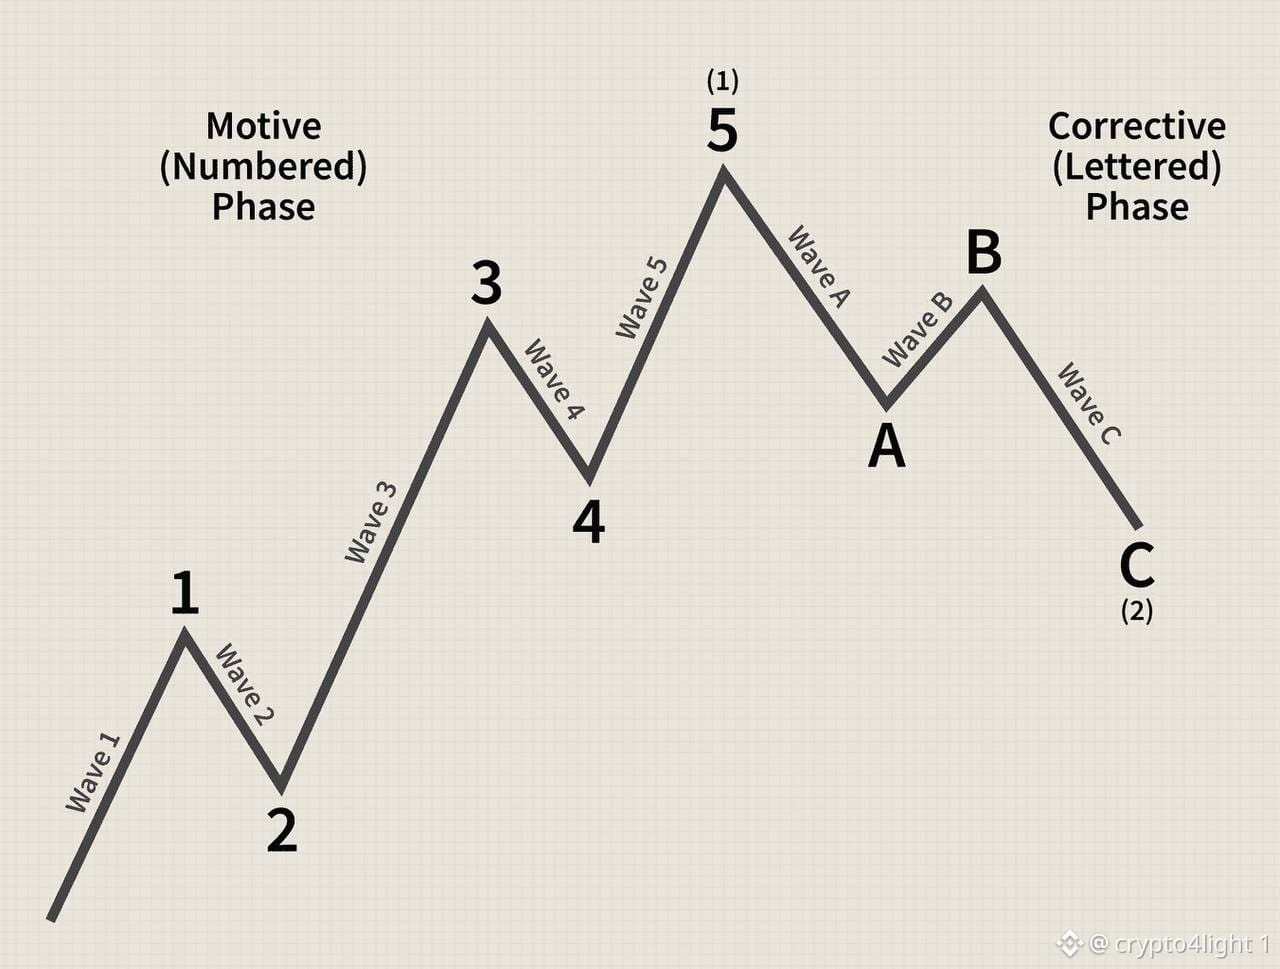
Eu não sou muito bom em contar Ondas de Elliott, e eu nunca me baseio nelas, mas vou dizer que o mercado sempre se move, aproximadamente, de acordo com esse tipo de estrutura. Você pode olhar o gráfico do Bitcoin e ver isso por conta própria. O problema, como sempre, é decidir em qual período analisar, mas é mais ou menos assim que a estrutura se parece. Estou dizendo isso porque não sabemos o comprimento de cada onda — nem em termos de tempo nem de tamanho — e cada ativo terá sua própria estrutura. Agora, goste ou não, em muitos altcoins, a maioria das pessoas já perdeu o fundo da primeira onda inicial. Provavelmente também perderão a segunda onda, e a maioria começará a entrar perto do fim da terceira onda. Veja muitos altcoins agora e observe o que acontece em outubro/novembro. A primeira onda provavelmente já estará concluída, seguida por uma correção. Sua tarefa não é ter pressa. Defina claramente suas zonas pessoais de interesse — não apenas para entrada, mas também para saída. Saiba exatamente onde você, pessoalmente, está pronto — mental, emocional e financeiramente — para realizar lucros e ir embora, sem ficar constantemente preocupado com o que acontecerá depois com aquele altcoin. $ETH
Eu não sou muito bom em contar Ondas de Elliott, e eu nunca me baseio nelas, mas vou dizer que o mercado sempre se move, aproximadamente, de acordo com esse tipo de estrutura. Você pode olhar o gráfico do Bitcoin e ver isso por conta própria. O problema, como sempre, é decidir em qual período analisar, mas é mais ou menos assim que a estrutura se parece. Estou dizendo isso porque não sabemos o comprimento de cada onda — nem em termos de tempo nem de tamanho — e cada ativo terá sua própria estrutura. Agora, goste ou não, em muitos altcoins, a maioria das pessoas já perdeu o fundo da primeira onda inicial. Provavelmente também perderão a segunda onda, e a maioria começará a entrar perto do fim da terceira onda. Veja muitos altcoins agora e observe o que acontece em outubro/novembro. A primeira onda provavelmente já estará concluída, seguida por uma correção. Sua tarefa não é ter pressa. Defina claramente suas zonas pessoais de interesse — não apenas para entrada, mas também para saída. Saiba exatamente onde você, pessoalmente, está pronto — mental, emocional e financeiramente — para realizar lucros e ir embora, sem ficar constantemente preocupado com o que acontecerá depois com aquele altcoin. $ETH
2
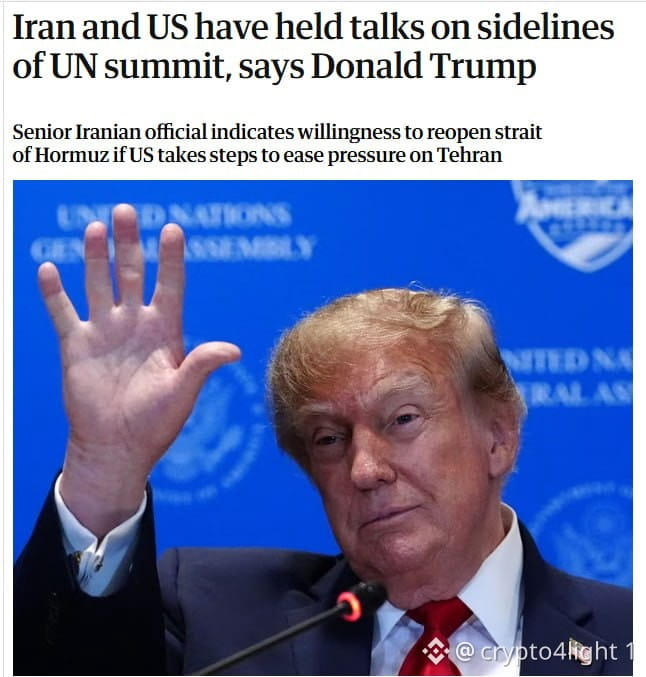
Irã e os EUA mantiveram conversas na Assembleia Geral da ONU, segundo Trump e *The Hill*. Rubio também confirmou que os EUA continuam abertos ao diálogo, embora ainda não haja uma nova data para outro encontro. Então, aqui vai um exemplo perfeito de como, quando os mercados ficam superaquecidos, o mundo aparentemente não tem nada de novo para apresentar além de guerra! (Ah, certo… e pandemias.) A ideia é simples: derrubar os mercados, esfriar o interesse dos investidores e, depois, passar muito tempo balançando o barco para lá e para cá com negociações, negociações que falham, tensões em escalada e assim por diante. Acumular ações e cripto enquanto os preços estão deprimidos. Então, quando todo mundo ainda estiver cético, mas os mercados já tiverem se recuperado — como o Bitcoin ganhando mais US$ 30 mil — começar a impulsionar sistematicamente posts sobre paz, acordos, negociações e sobre como tudo vai melhorar. E então o quê? No auge do Bitcoin, por volta de US$ 150–200 mil, veremos de repente a guerra na Ucrânia chegando ao fim, Israel resolvendo todos os seus problemas com a Palestina e uma nova onda de narrativas nos dizendo que o Bitcoin está pronto para US$ 500 mil e que o setor de IA está apenas no começo do seu crescimento? Eu não sei… mas é difícil acreditar que tudo acontece organicamente. Sempre há alguém influenciando o rumo da narrativa — e, talvez ainda mais importante, o momento em que essa narrativa aparece. $BTC
Irã e os EUA mantiveram conversas na Assembleia Geral da ONU, segundo Trump e *The Hill*. Rubio também confirmou que os EUA continuam abertos ao diálogo, embora ainda não haja uma nova data para outro encontro. Então, aqui vai um exemplo perfeito de como, quando os mercados ficam superaquecidos, o mundo aparentemente não tem nada de novo para apresentar além de guerra! (Ah, certo… e pandemias.) A ideia é simples: derrubar os mercados, esfriar o interesse dos investidores e, depois, passar muito tempo balançando o barco para lá e para cá com negociações, negociações que falham, tensões em escalada e assim por diante. Acumular ações e cripto enquanto os preços estão deprimidos. Então, quando todo mundo ainda estiver cético, mas os mercados já tiverem se recuperado — como o Bitcoin ganhando mais US$ 30 mil — começar a impulsionar sistematicamente posts sobre paz, acordos, negociações e sobre como tudo vai melhorar. E então o quê? No auge do Bitcoin, por volta de US$ 150–200 mil, veremos de repente a guerra na Ucrânia chegando ao fim, Israel resolvendo todos os seus problemas com a Palestina e uma nova onda de narrativas nos dizendo que o Bitcoin está pronto para US$ 500 mil e que o setor de IA está apenas no começo do seu crescimento? Eu não sei… mas é difícil acreditar que tudo acontece organicamente. Sempre há alguém influenciando o rumo da narrativa — e, talvez ainda mais importante, o momento em que essa narrativa aparece. $BTC
28
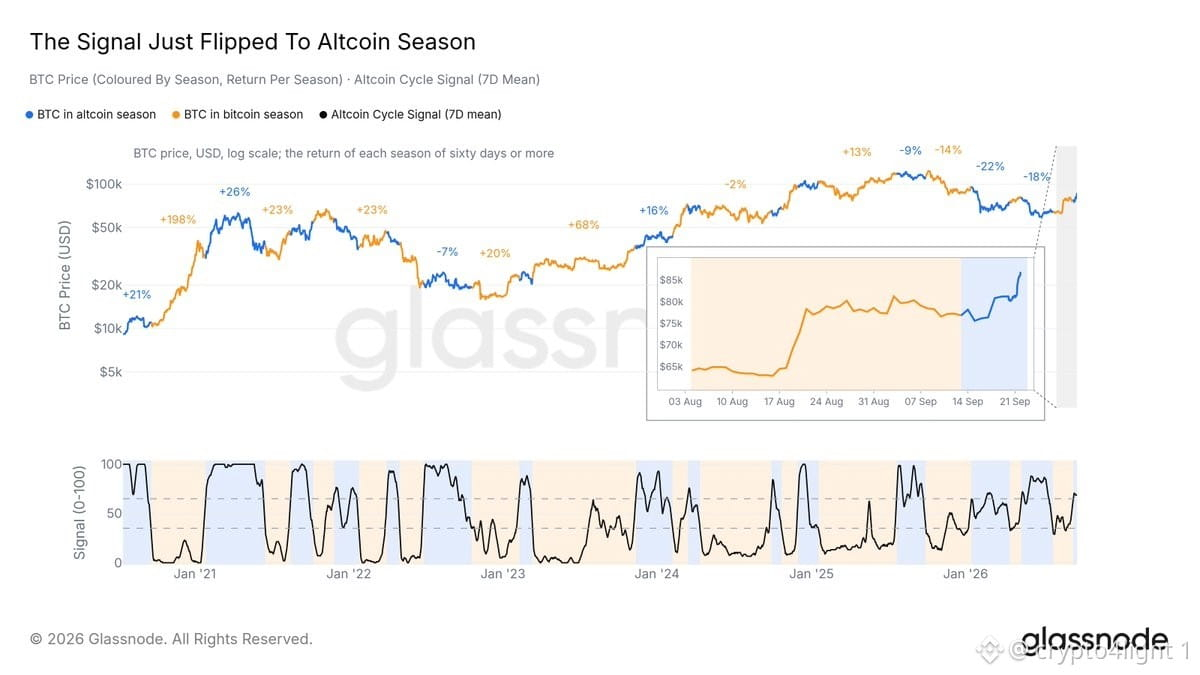
Uma manifestação impulsionada por Trump em ativos de risco é a principal chance para os republicanos manterem sua maioria no Congresso após as eleições de 3 de novembro. Novamente, é isso magia? Quando é necessário, a mídia cria uma narrativa de que as altcoins estão indo direto para zero e serão inúteis. E quando é hora de adicionar um pouco de otimismo antes das eleições, de repente os tokens começam a subir! Coincidência? 👀 $BTC
Uma manifestação impulsionada por Trump em ativos de risco é a principal chance para os republicanos manterem sua maioria no Congresso após as eleições de 3 de novembro. Novamente, é isso magia? Quando é necessário, a mídia cria uma narrativa de que as altcoins estão indo direto para zero e serão inúteis. E quando é hora de adicionar um pouco de otimismo antes das eleições, de repente os tokens começam a subir! Coincidência? 👀 $BTC
26
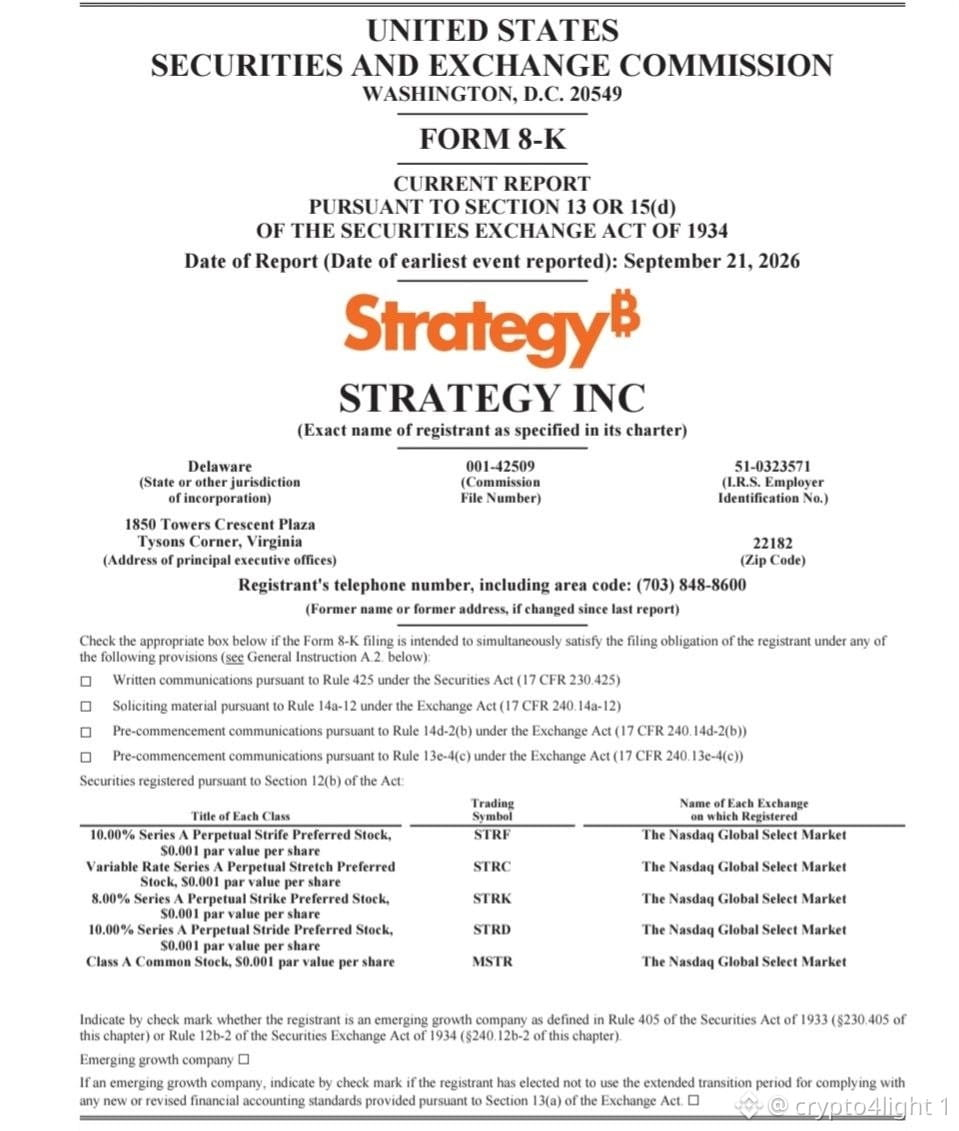
A estratégia comprou mais 950 BTC, elevando o saldo total para 846.000 BTC. $BTC
A estratégia comprou mais 950 BTC, elevando o saldo total para 846.000 BTC. $BTC
36
BTC em 58k Existem influenciadores que são pagos para promover certos tokens de memes, seja por meio de promoção nativa ou de forma muito mais agressiva, certo? E eles são pagos pelas pessoas por trás desses tokens. E eu comecei a ter a sensação de que pode existir algum tipo de organização pagando influenciadores de topo que, principalmente, cobrem Bitcoin para empurrar completa bobagem quando estamos perto do fundo — e então promover ideias absurdas como Bitcoin de US$ 500K quando o BTC já está extremamente superaquecido. É difícil acreditar que tantos influenciadores de cripto no topo das redes sociais possam chegar independentemente às mesmas conclusões exatas. Quando o Bitcoin estava por volta de US$ 58K, eles diziam que haviam vendido seu Bitcoin porque a gente ia despencar até quase zero. É difícil acreditar que todas essas pessoas sejam de fato idiotas. A pergunta real é: quem poderia, em teoria, estar financiando esse tipo de narrativa coordenada para criar um sentimento específico e impulsionar uma mensagem desejada nas redes sociais? $BTC
BTC em 58k Existem influenciadores que são pagos para promover certos tokens de memes, seja por meio de promoção nativa ou de forma muito mais agressiva, certo? E eles são pagos pelas pessoas por trás desses tokens. E eu comecei a ter a sensação de que pode existir algum tipo de organização pagando influenciadores de topo que, principalmente, cobrem Bitcoin para empurrar completa bobagem quando estamos perto do fundo — e então promover ideias absurdas como Bitcoin de US$ 500K quando o BTC já está extremamente superaquecido. É difícil acreditar que tantos influenciadores de cripto no topo das redes sociais possam chegar independentemente às mesmas conclusões exatas. Quando o Bitcoin estava por volta de US$ 58K, eles diziam que haviam vendido seu Bitcoin porque a gente ia despencar até quase zero. É difícil acreditar que todas essas pessoas sejam de fato idiotas. A pergunta real é: quem poderia, em teoria, estar financiando esse tipo de narrativa coordenada para criar um sentimento específico e impulsionar uma mensagem desejada nas redes sociais? $BTC

52
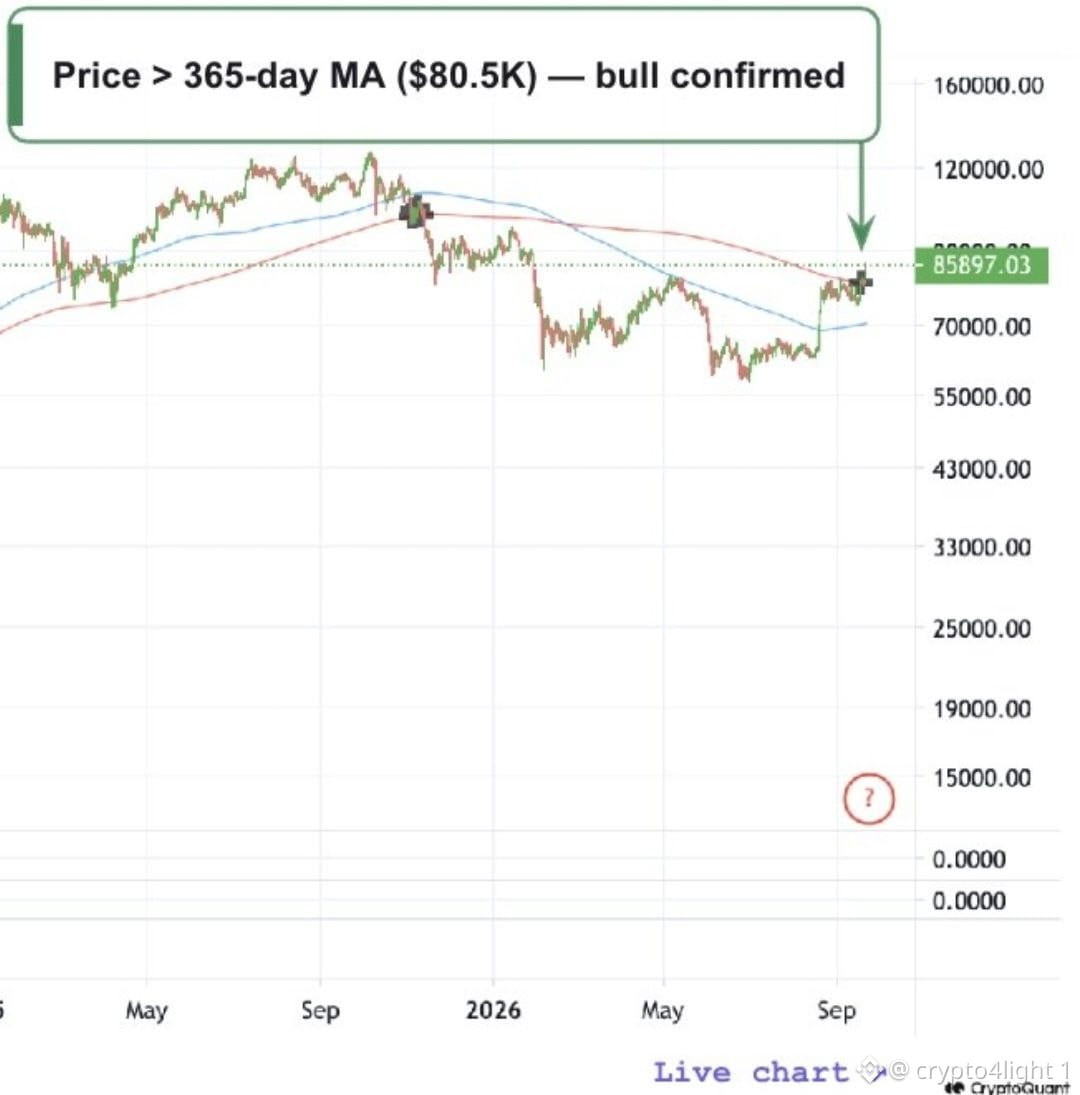
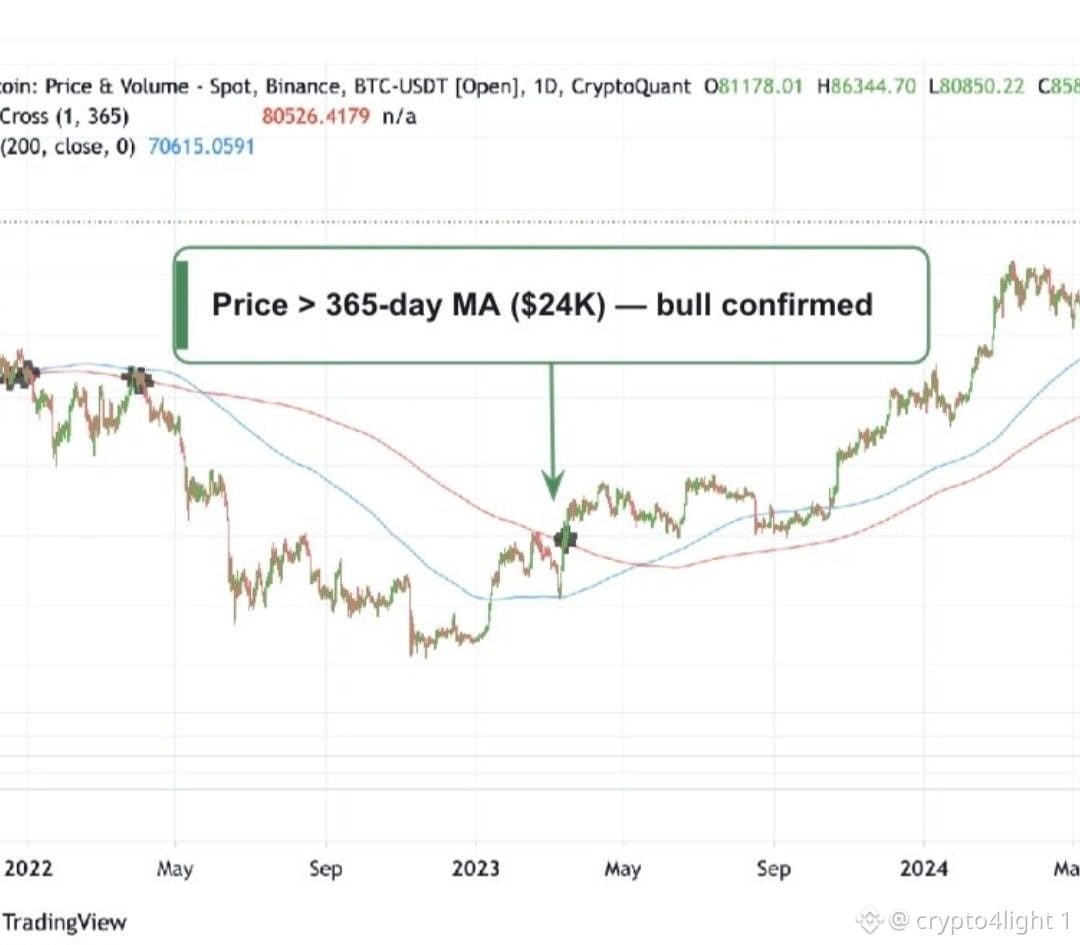
CryptoQuant: Mercado em alta confirmado! BTC fechou acima da sua média móvel de 365 dias pela primeira vez desde março de 2023 (e esta linha sinalizou todos os mercados em alta desde 2019). Eu nunca paro de ficar impressionado com como isso é até possível! Foi literalmente a mesma coisa em 2022. Todo mundo estava esperando $12–10K enquanto ouvia o Capo. Então, só um ano depois, em 2023, quando o Bitcoin já estava em torno de $30K, começaram a dizer: “O mercado em alta finalmente começou.” E agora estão fazendo exatamente a mesma coisa de novo. Eles estavam esperando $50–45K, o Bitcoin chegou a $87K, e de repente eles saem e dizem para uma audiência de centenas de milhares de pessoas: “O mercado em alta começou.” E o argumento??? Tambores, por favor… UMA ÚNICA LINHA DE MÉDIA MÓVEL. Temos tantas outras ferramentas para análise de gráficos, mas as pessoas estão determinando se um ativo deve ser comprado com base em uma única média móvel. Genial! Será que poderíamos ter ido abaixo de $57K? Com certeza! Mas chamar $57K de fundo e de início do mercado em alta — mesmo do ponto de vista de probabilidade — faz mais sentido em termos de risco/recompensa do que declarar o fundo e o começo do mercado em alta em $87K, apenas depois que isso acontece. $BTC
CryptoQuant: Mercado em alta confirmado! BTC fechou acima da sua média móvel de 365 dias pela primeira vez desde março de 2023 (e esta linha sinalizou todos os mercados em alta desde 2019). Eu nunca paro de ficar impressionado com como isso é até possível! Foi literalmente a mesma coisa em 2022. Todo mundo estava esperando $12–10K enquanto ouvia o Capo. Então, só um ano depois, em 2023, quando o Bitcoin já estava em torno de $30K, começaram a dizer: “O mercado em alta finalmente começou.” E agora estão fazendo exatamente a mesma coisa de novo. Eles estavam esperando $50–45K, o Bitcoin chegou a $87K, e de repente eles saem e dizem para uma audiência de centenas de milhares de pessoas: “O mercado em alta começou.” E o argumento??? Tambores, por favor… UMA ÚNICA LINHA DE MÉDIA MÓVEL. Temos tantas outras ferramentas para análise de gráficos, mas as pessoas estão determinando se um ativo deve ser comprado com base em uma única média móvel. Genial! Será que poderíamos ter ido abaixo de $57K? Com certeza! Mas chamar $57K de fundo e de início do mercado em alta — mesmo do ponto de vista de probabilidade — faz mais sentido em termos de risco/recompensa do que declarar o fundo e o começo do mercado em alta em $87K, apenas depois que isso acontece. $BTC
65
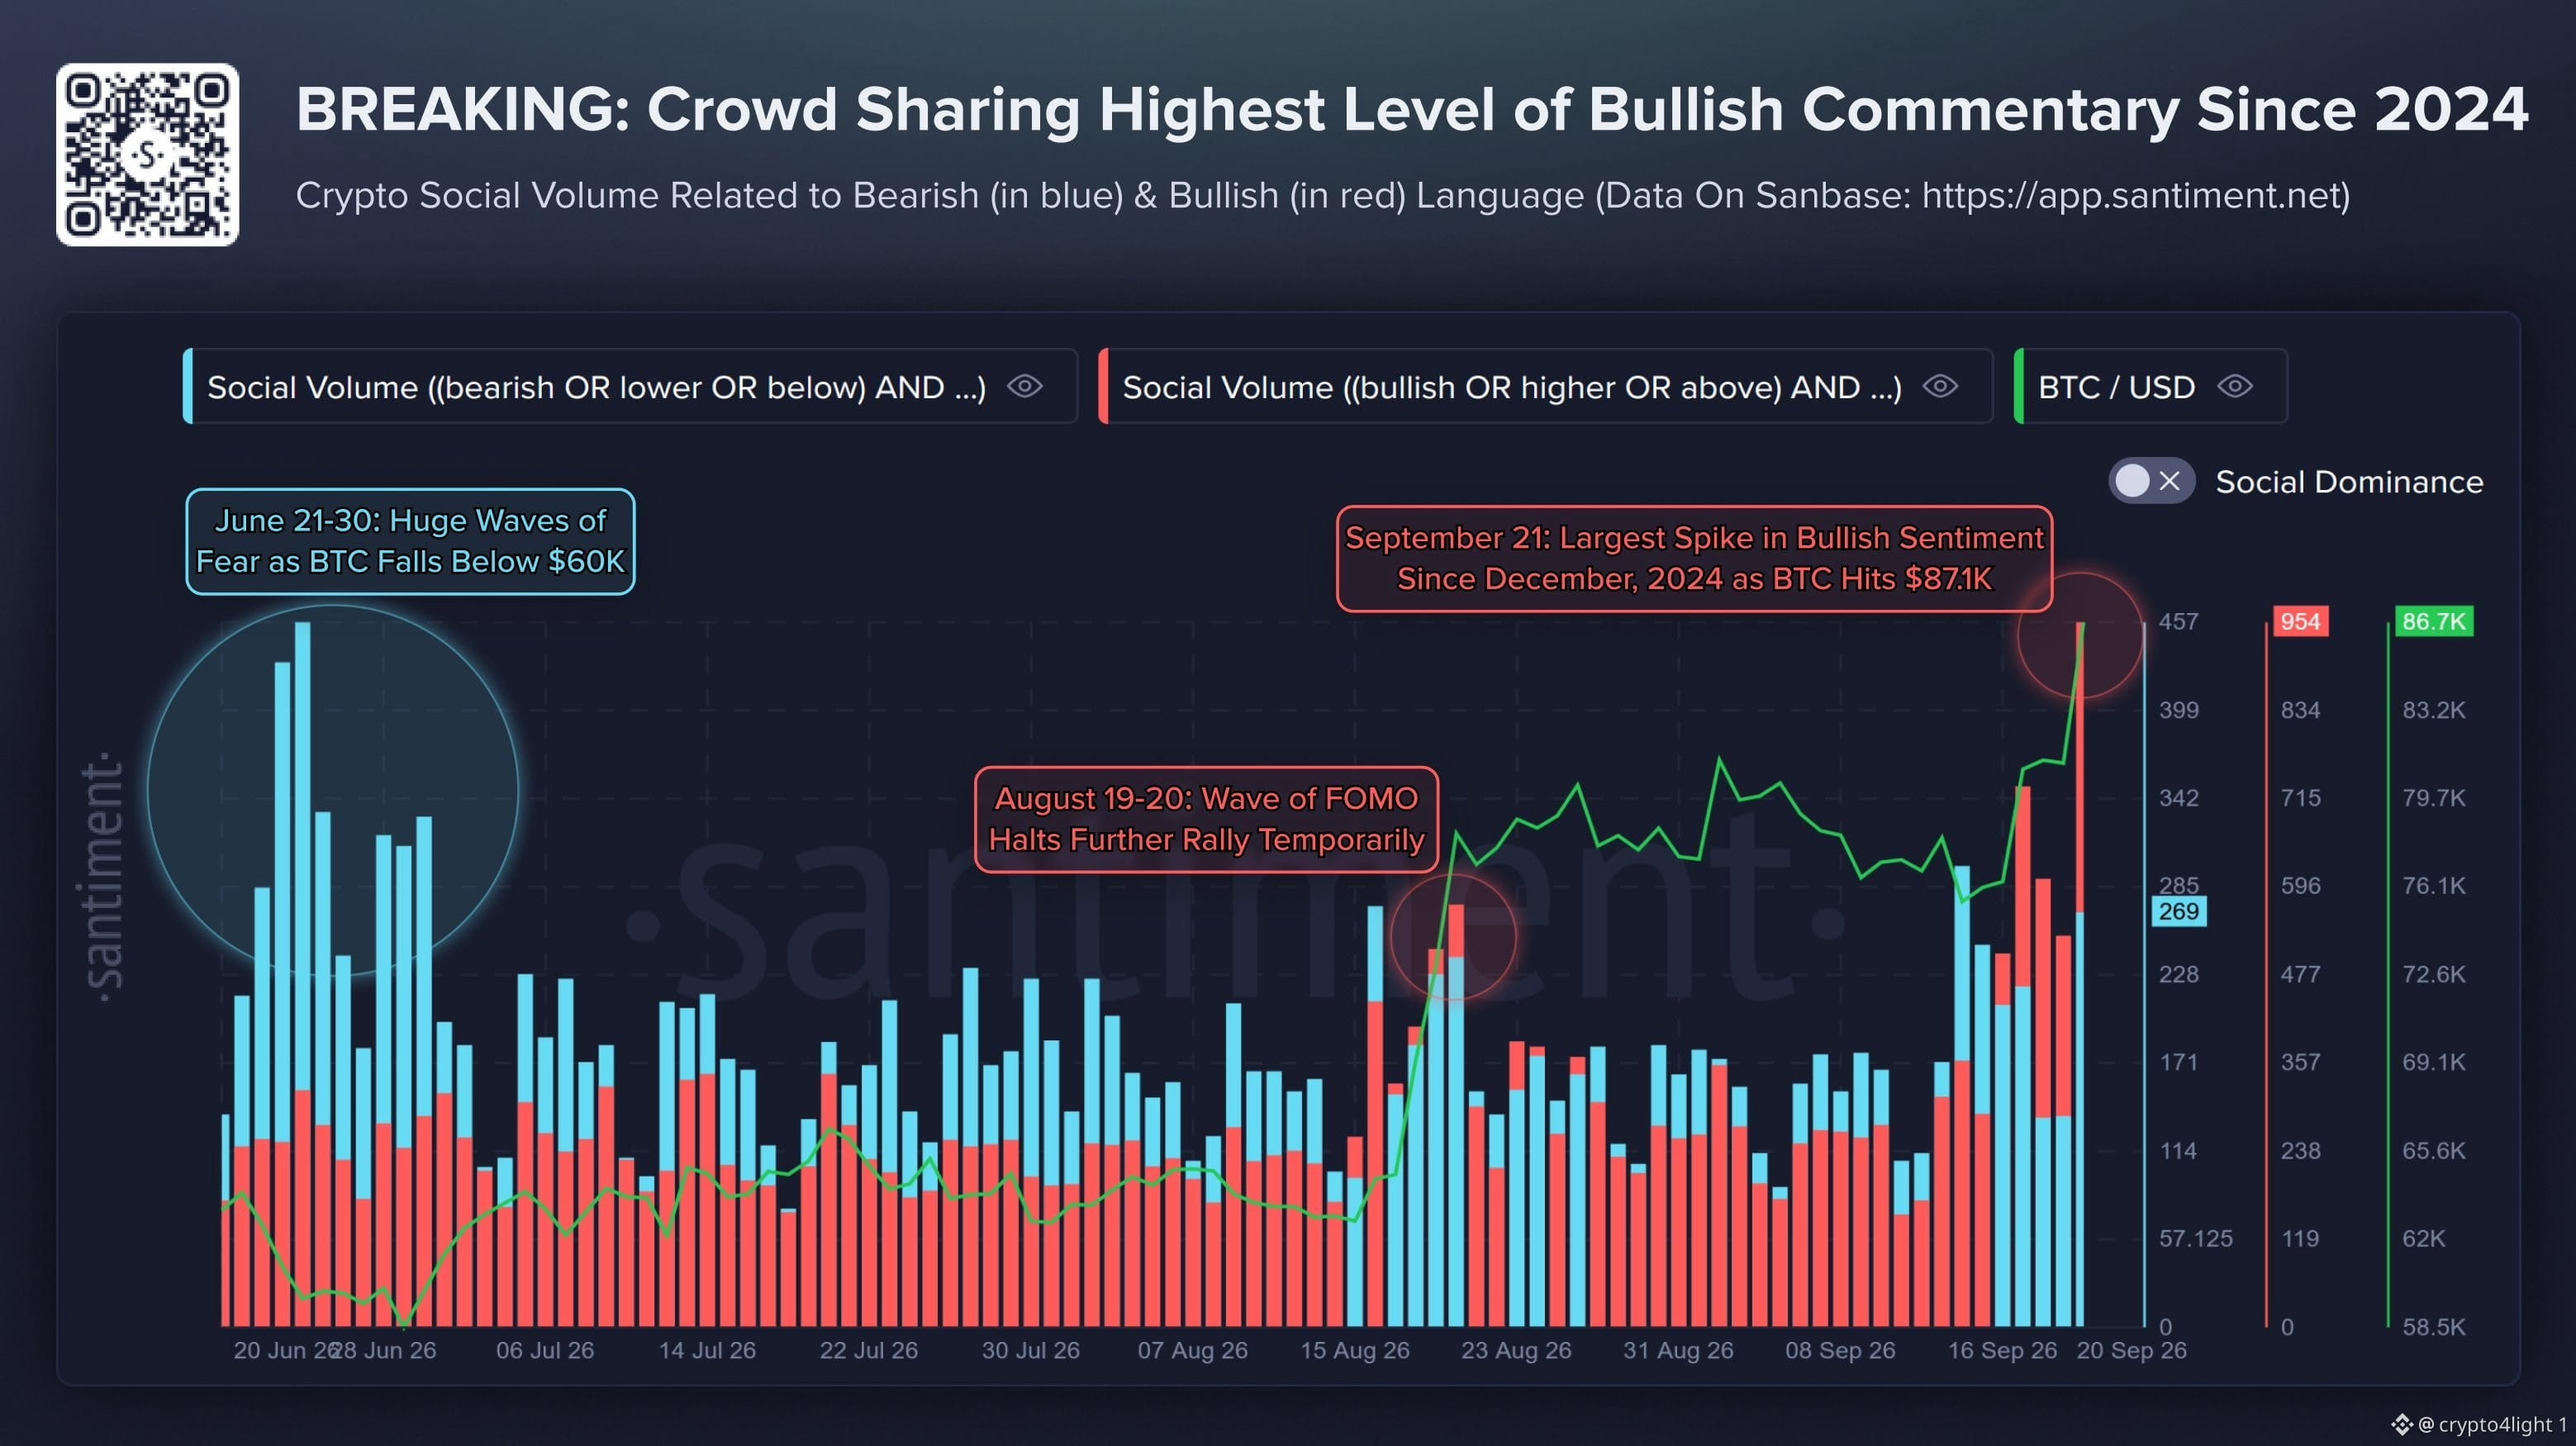
🪙 Bitcoin FOMO atinge o nível mais alto desde 2024! 🤌 ninguém se importa com o btc nos 60, mas todo mundo quer comprar nos 85! Um padrão que funciona o tempo todo $BTC
🪙 Bitcoin FOMO atinge o nível mais alto desde 2024! 🤌 ninguém se importa com o btc nos 60, mas todo mundo quer comprar nos 85! Um padrão que funciona o tempo todo $BTC
29
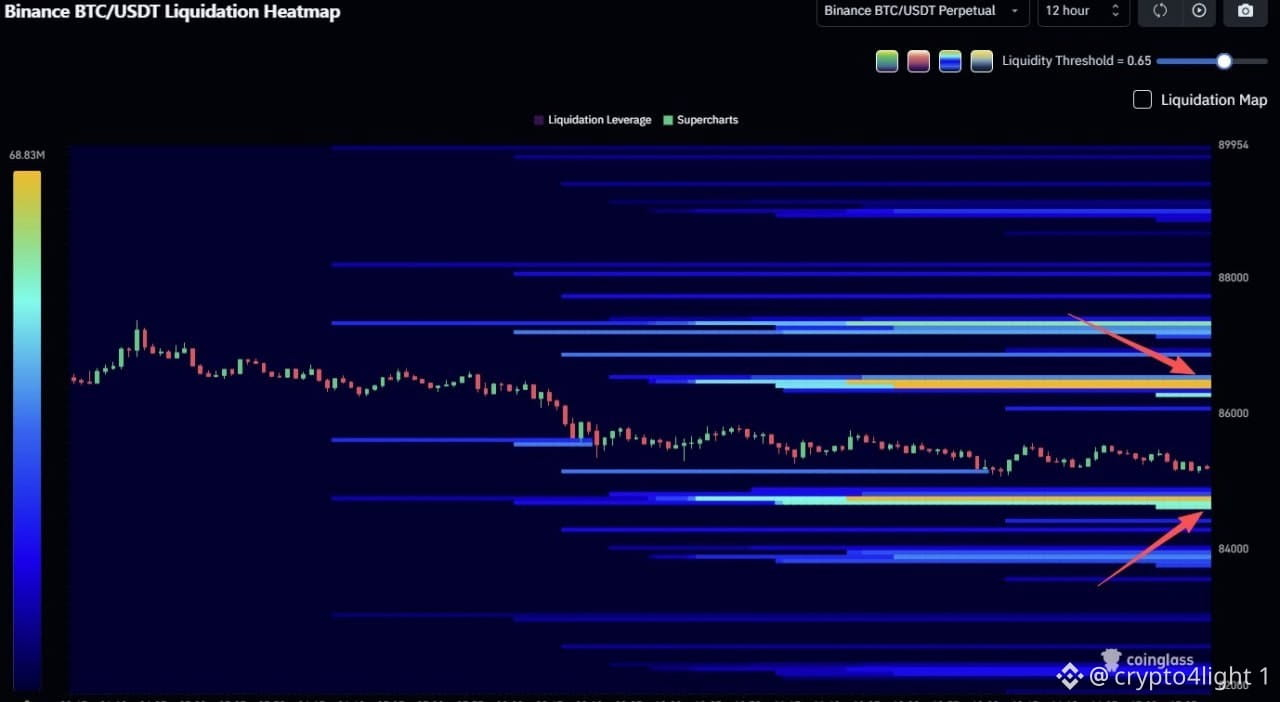
Altas alavancagens nos níveis de liquidação do $BTC agora
Altas alavancagens nos níveis de liquidação do $BTC agora
42
Análise do Preço do ICP: O ICP Está Pronto para um GRANDE Movimento? $ICP Neste vídeo, damos uma olhada mais de perto no gráfico do Internet Computer (ICP) e analisamos a estrutura atual do mercado, níveis-chave de suporte e resistência, possíveis alvos e cenários prováveis para o próximo movimento. https://youtu.be/AC8bJ81WMVM
Análise do Preço do ICP: O ICP Está Pronto para um GRANDE Movimento? $ICP Neste vídeo, damos uma olhada mais de perto no gráfico do Internet Computer (ICP) e analisamos a estrutura atual do mercado, níveis-chave de suporte e resistência, possíveis alvos e cenários prováveis para o próximo movimento. https://youtu.be/AC8bJ81WMVM
29
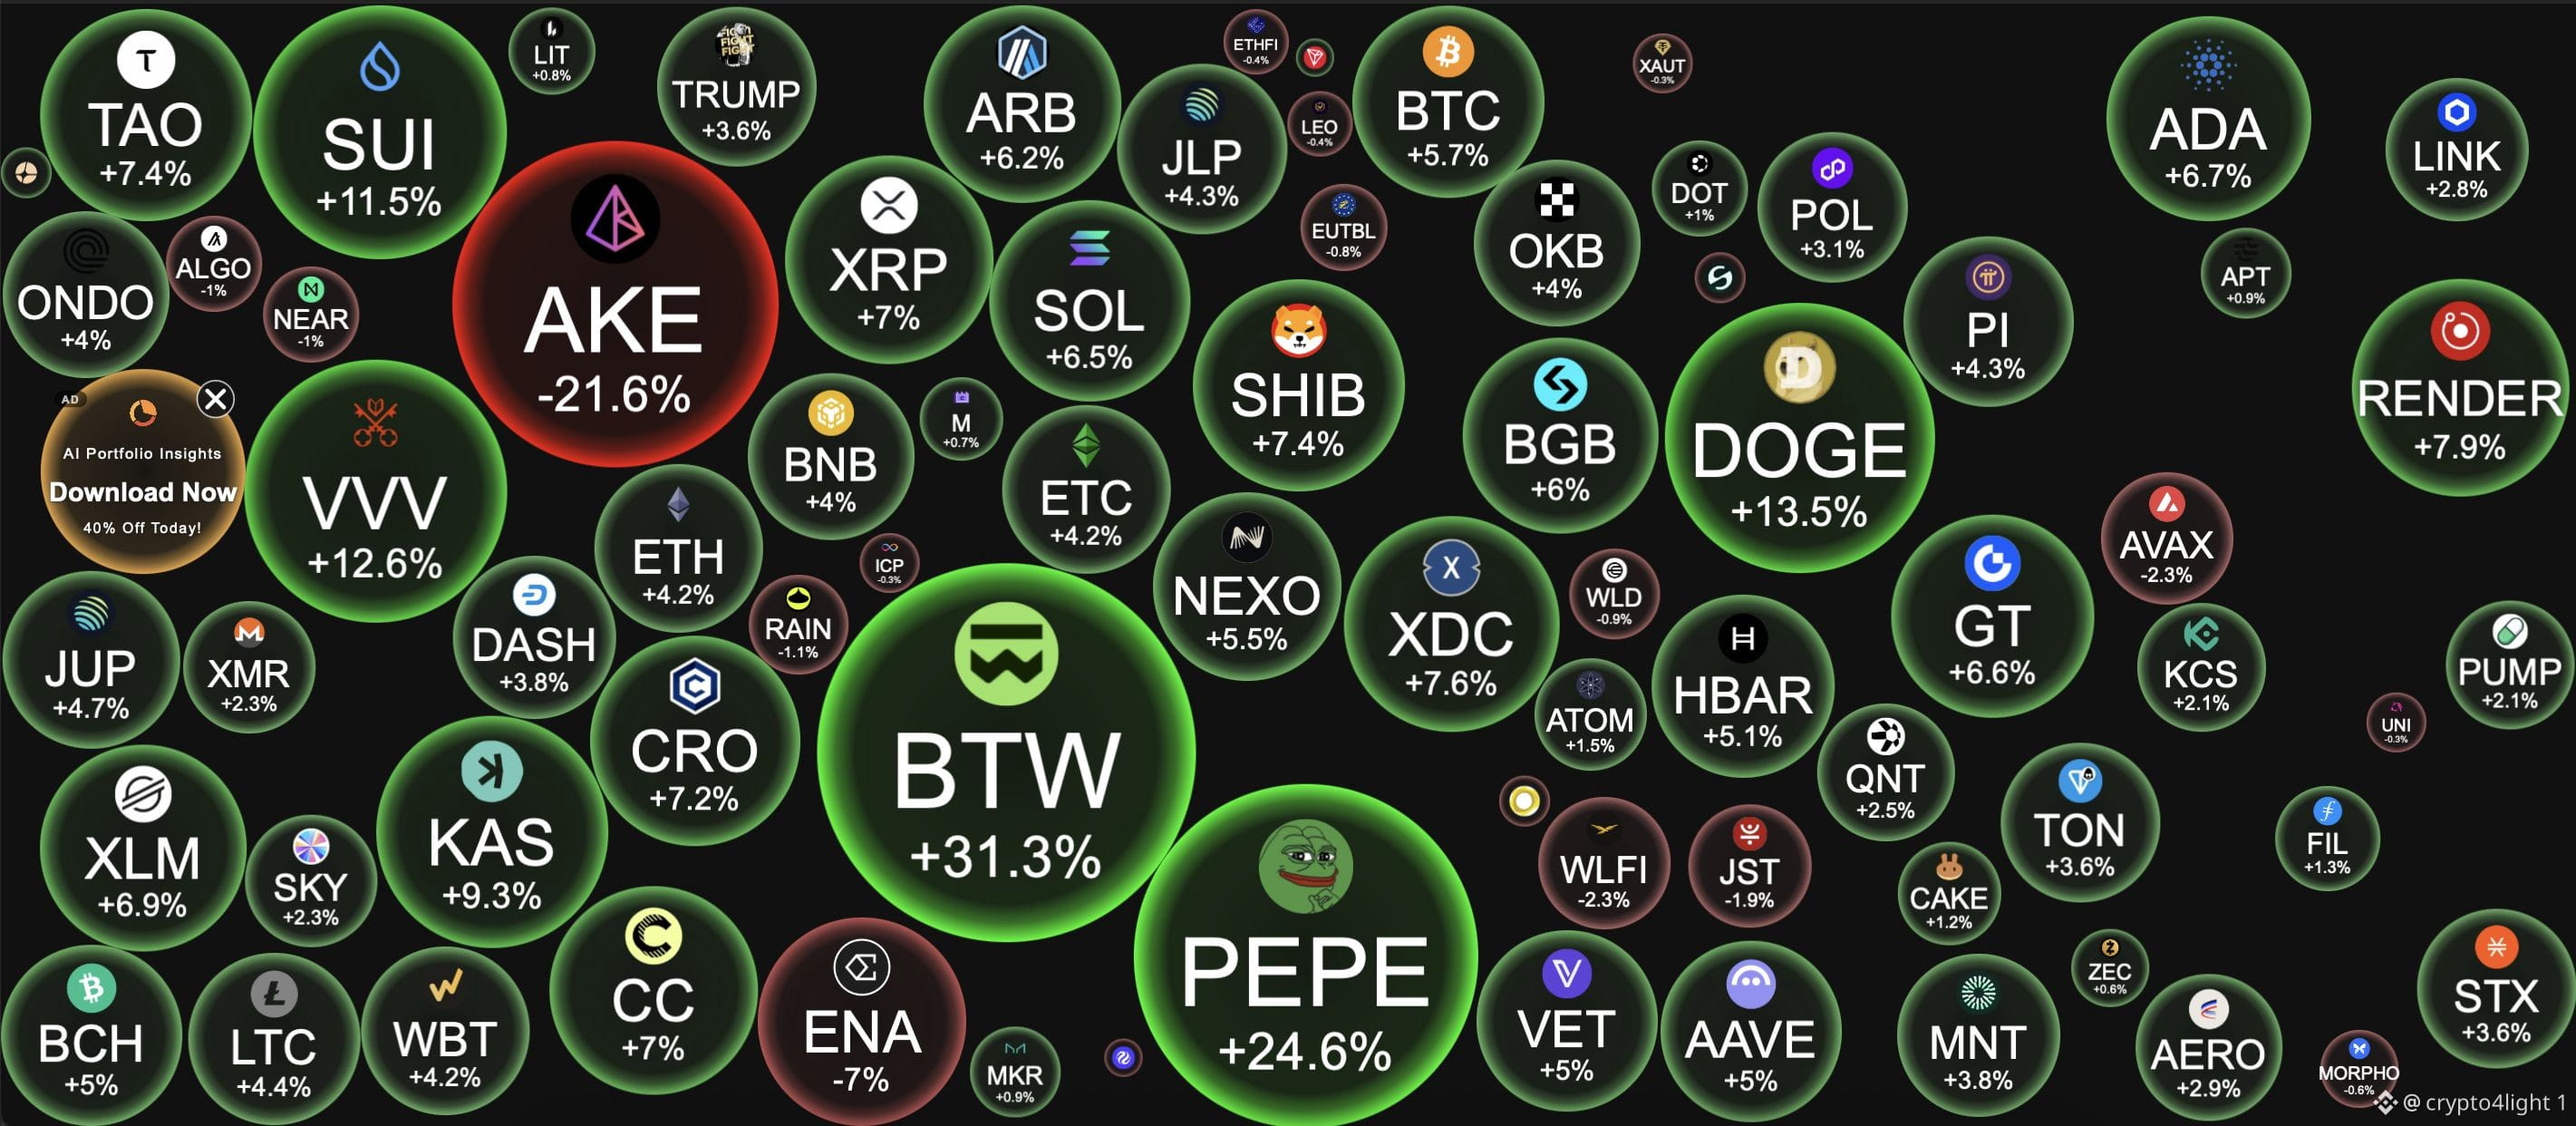
Lembre-se deste lindo dia verde) As novas publicações de cripto “é tudo over,” “é uma armadilha” e “manipulação” de influenciadores esta semana em 3....2....1 $BTC
Lembre-se deste lindo dia verde) As novas publicações de cripto “é tudo over,” “é uma armadilha” e “manipulação” de influenciadores esta semana em 3....2....1 $BTC
20
Sobre a situação envolvendo Benjamin Cowen — todos os influenciadores de cripto agora estão empurrando essa narrativa em massa e comemorando loucamente que Ben acabou estando errado na análise dele sobre seu $BTC. Tanto que provavelmente ele disse pela primeira vez em um vídeo que estava errado, e depois ainda fez esse post! Tipo… que porra??? Pessoalmente, nem sempre concordo com as ideias do Ben. Nós analisamos os gráficos de maneiras diferentes. Ele se baseia mais em padrões históricos do comportamento de um ativo e em médias móveis, enquanto eu atualmente foco mais em dados de indicadores algorítmicos, porque eu não acredito em teorias de padrões sobre Bitcoin. Ninguém conhece o futuro. Nós trabalhamos com probabilidades! Você nem sabe, sentado em casa, o que pode acontecer com você nos próximos 10 minutos! Mas temos gráficos de preço, ferramentas para trabalhar, e todo mundo simplesmente analisa o mercado do jeito que acha apropriado. E as pessoas esquecem a ideia principal das redes sociais: a gente compartilha ideias. Não importa se você tem uma conta com 100 seguidores ou, como o Ben, 2–3 milhões de seguidores nas redes sociais. Ele ainda é apenas uma pessoa compartilhando a visão dele. Algumas ideias vão estar certas. Outras vão estar erradas. Pessoalmente, a coisa mais importante para mim é que alguém não apenas desenhe setas aleatórias em um gráfico, mas explique e argumente logicamente o ponto de vista dele. É SÓ ISSO. O que importa é que exista raciocínio por trás das suas ideias. Com o tempo, todo mundo desenvolve a própria perspectiva e EXPERiência. Uma coisa é o Ben compartilhar abertamente uma ideia com uma audiência de milhões. Outra coisa é alguém como Arthur Hayes, intencionalmente, empurrar pessoas para certos tokens diante do mesmo tipo de audiência massiva — você se lembra daqueles posts — e depois vender sistematicamente o mesmo token. ISSO é influência negativa e usar intencionalmente o alcance da sua mídia. Enfim, continue trabalhando, continue ganhando experiência e não seja tóxico. Estamos todos no mesmo barco. #BTC
Sobre a situação envolvendo Benjamin Cowen — todos os influenciadores de cripto agora estão empurrando essa narrativa em massa e comemorando loucamente que Ben acabou estando errado na análise dele sobre seu $BTC. Tanto que provavelmente ele disse pela primeira vez em um vídeo que estava errado, e depois ainda fez esse post! Tipo… que porra??? Pessoalmente, nem sempre concordo com as ideias do Ben. Nós analisamos os gráficos de maneiras diferentes. Ele se baseia mais em padrões históricos do comportamento de um ativo e em médias móveis, enquanto eu atualmente foco mais em dados de indicadores algorítmicos, porque eu não acredito em teorias de padrões sobre Bitcoin. Ninguém conhece o futuro. Nós trabalhamos com probabilidades! Você nem sabe, sentado em casa, o que pode acontecer com você nos próximos 10 minutos! Mas temos gráficos de preço, ferramentas para trabalhar, e todo mundo simplesmente analisa o mercado do jeito que acha apropriado. E as pessoas esquecem a ideia principal das redes sociais: a gente compartilha ideias. Não importa se você tem uma conta com 100 seguidores ou, como o Ben, 2–3 milhões de seguidores nas redes sociais. Ele ainda é apenas uma pessoa compartilhando a visão dele. Algumas ideias vão estar certas. Outras vão estar erradas. Pessoalmente, a coisa mais importante para mim é que alguém não apenas desenhe setas aleatórias em um gráfico, mas explique e argumente logicamente o ponto de vista dele. É SÓ ISSO. O que importa é que exista raciocínio por trás das suas ideias. Com o tempo, todo mundo desenvolve a própria perspectiva e EXPERiência. Uma coisa é o Ben compartilhar abertamente uma ideia com uma audiência de milhões. Outra coisa é alguém como Arthur Hayes, intencionalmente, empurrar pessoas para certos tokens diante do mesmo tipo de audiência massiva — você se lembra daqueles posts — e depois vender sistematicamente o mesmo token. ISSO é influência negativa e usar intencionalmente o alcance da sua mídia. Enfim, continue trabalhando, continue ganhando experiência e não seja tóxico. Estamos todos no mesmo barco. #BTC
3
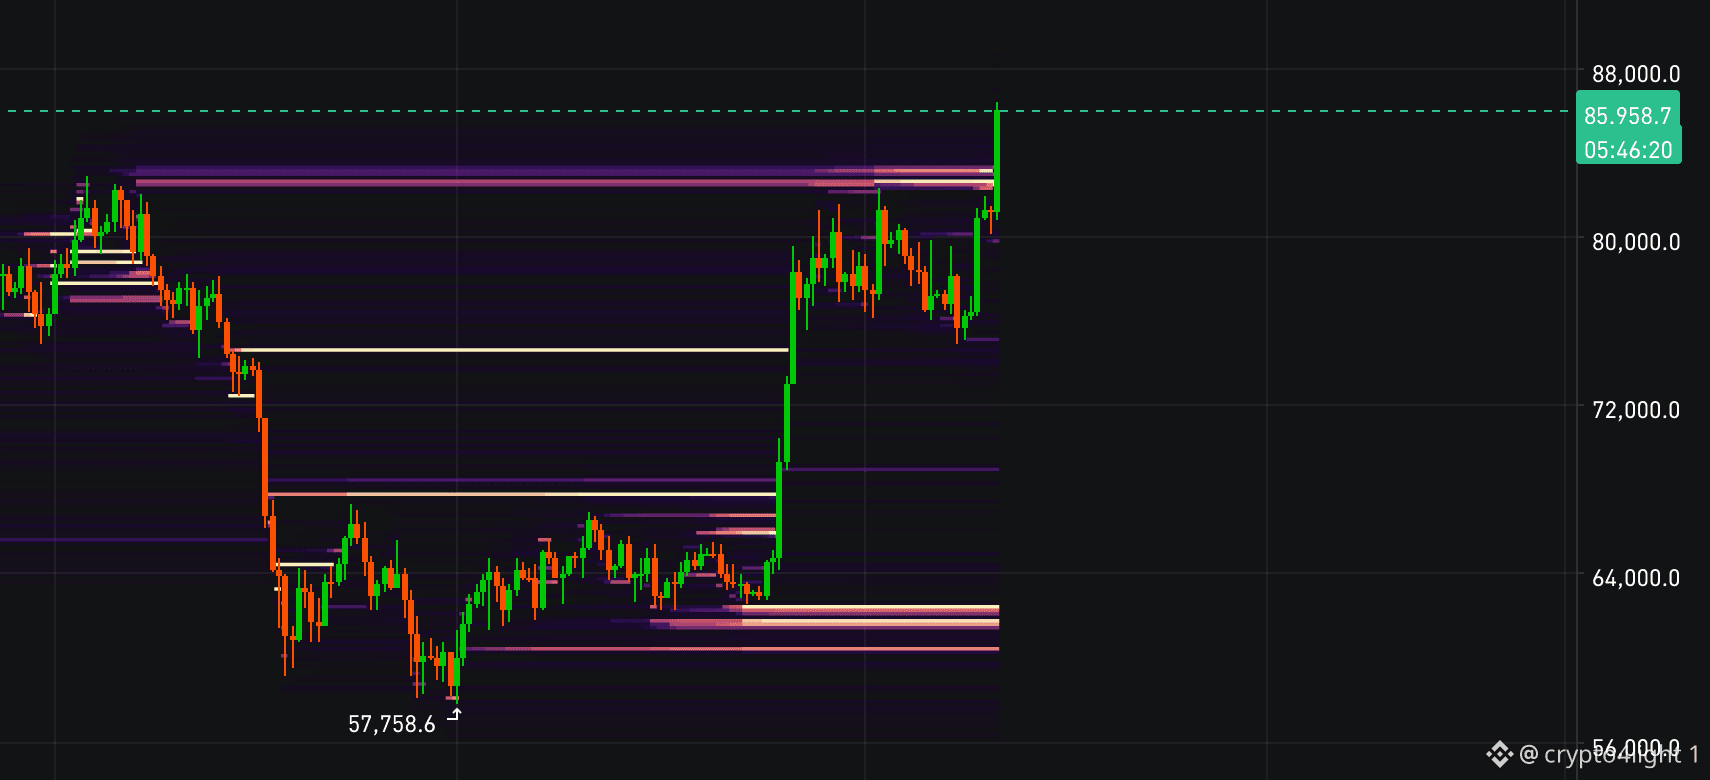
Todos os clusters acima de 80k concluídos! Todos os outros na tela (Linha Fair em W também hoje apareceu em vídeo) $BTC
Todos os clusters acima de 80k concluídos! Todos os outros na tela (Linha Fair em W também hoje apareceu em vídeo) $BTC
2
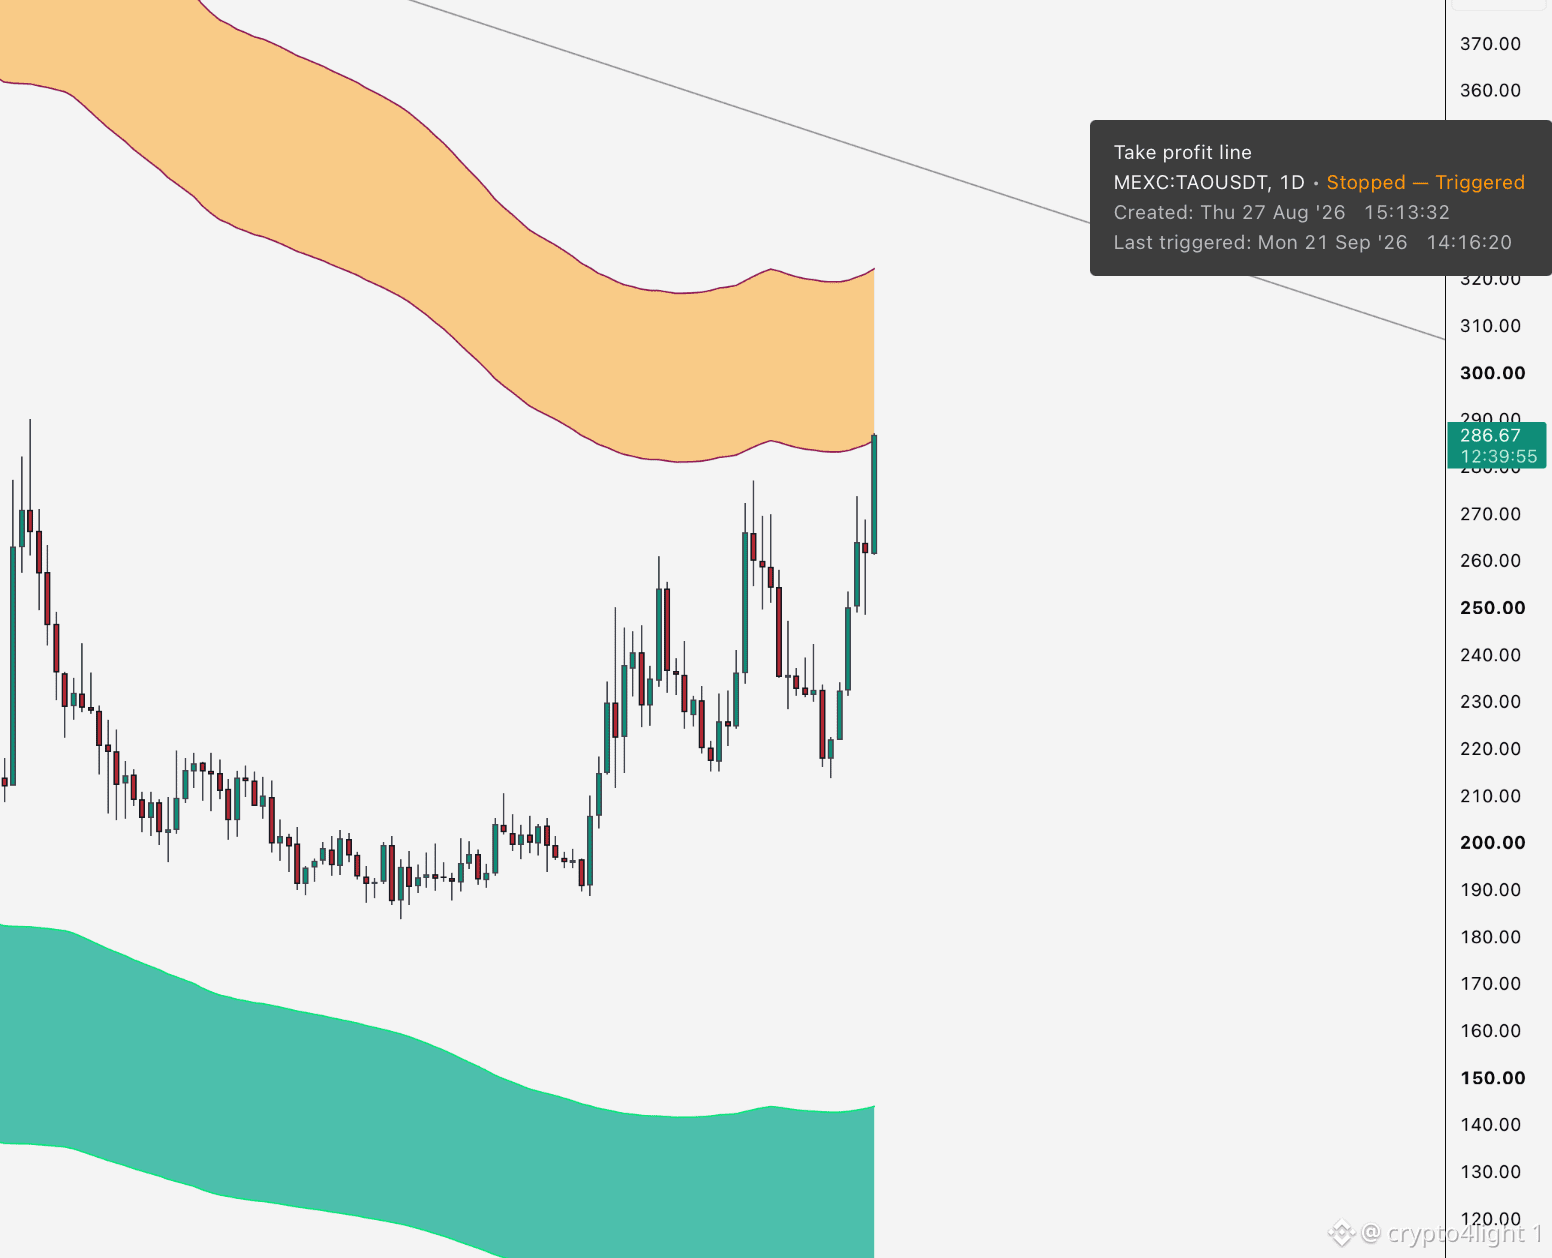
Alerta TAO! ✔️ Linha de take profit D, em D no período de hoje, no vídeo da SEI. Este alerta apareceu ao vivo)) Então não é depois do fato ou algo assim)) $TAO
Alerta TAO! ✔️ Linha de take profit D, em D no período de hoje, no vídeo da SEI. Este alerta apareceu ao vivo)) Então não é depois do fato ou algo assim)) $TAO
34
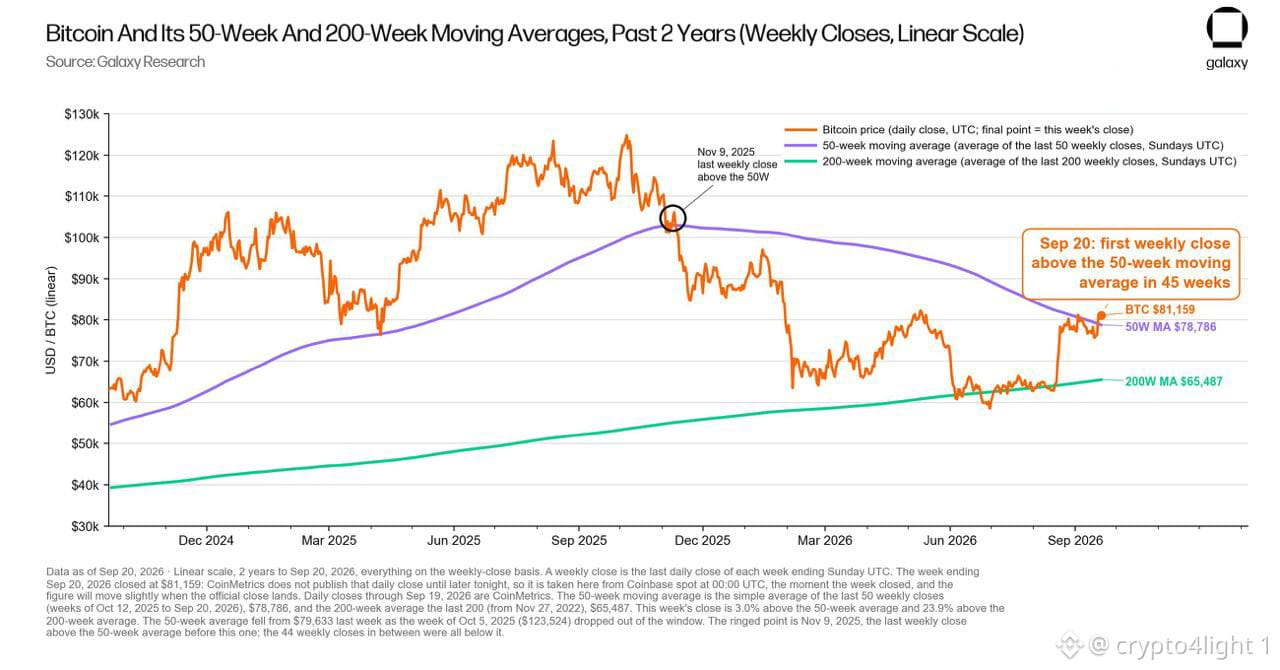
Bitcoin pode ter sinalizado o início de um novo mercado em alta. A BTC acabou de fechar uma vela semanal acima da média móvel de 50 semanas (50W MA) pela primeira vez em 45 semanas. Historicamente, Alex Thorn (da Galaxy) diz que essa alta muitas vezes confirma que o fundo já foi formado. 👀 Tudo isso é ótimo! Mas eu simplesmente não consigo entender como grandes empresas, com bilhões de dólares por trás, com os melhores pesquisadores, analistas, programadores e mentes no blockchain, conseguem determinar o fundo do principal ativo apenas quando o Bitcoin já está a US$ 85.000. E o argumento deles é o cruzamento da média móvel de 50 semanas! Então vocês não tiveram nenhum argumento quando o preço estava entre US$ 57–60 mil de que esse era o fundo? Ou vocês estavam comprando em silêncio, quietos, e agora precisam de um público porque são líderes de opinião — então precisam construir interesse aos poucos, um pouco por vez, e então começar com a narrativa de sempre sobre US$ 200 mil–US$ 300 mil–US$ 500 mil, vendendo isso gradualmente para a plateia? Vergonha alheia. $BTC
Bitcoin pode ter sinalizado o início de um novo mercado em alta. A BTC acabou de fechar uma vela semanal acima da média móvel de 50 semanas (50W MA) pela primeira vez em 45 semanas. Historicamente, Alex Thorn (da Galaxy) diz que essa alta muitas vezes confirma que o fundo já foi formado. 👀 Tudo isso é ótimo! Mas eu simplesmente não consigo entender como grandes empresas, com bilhões de dólares por trás, com os melhores pesquisadores, analistas, programadores e mentes no blockchain, conseguem determinar o fundo do principal ativo apenas quando o Bitcoin já está a US$ 85.000. E o argumento deles é o cruzamento da média móvel de 50 semanas! Então vocês não tiveram nenhum argumento quando o preço estava entre US$ 57–60 mil de que esse era o fundo? Ou vocês estavam comprando em silêncio, quietos, e agora precisam de um público porque são líderes de opinião — então precisam construir interesse aos poucos, um pouco por vez, e então começar com a narrativa de sempre sobre US$ 200 mil–US$ 300 mil–US$ 500 mil, vendendo isso gradualmente para a plateia? Vergonha alheia. $BTC
95
Inicia sessão para explorar mais conteúdos
Junta-te a utilizadores de criptomoedas de todo o mundo na Binance Square
⚡️ Obtém informações úteis e recentes sobre criptomoedas.
💬 Com a confiança da maior exchange de criptomoedas do mundo.
👍 Descobre perspetivas reais de criadores verificados.
E-mail/Número de telefone
Tópicos em Tendência
BitgetHackerMoves$83MStolenXRP
1,210 visualizações
30 a discutir
Em 24 de setembro de 2026, a Bitget sofreu uma grande violação de segurança, com cerca de US$ 387 milhões–US$ 390 milhões em ativos supostamente roubados.
Uma grande parte dos fundos roubados foi $XRP .
Cerca de 103M $XRP, no valor aproximado de US$ 157 milhões–US$ 160 milhões na época, foi movida para cinco carteiras controladas pelo atacante.
Até 26 de setembro, aproximadamente 54M XRP (US$ 83M) já haviam sido retirados de três dessas carteiras.
Duas carteiras, cada uma com cerca de 20M XRP, foram praticamente esvaziadas, enquanto outra foi reduzida para cerca de 5,8M XRP.
Isso deixou aproximadamente 49M XRP, no valor de cerca de US$ 75M na época, ainda nas carteiras originais.
As transferências também aumentaram durante a noite, com os fundos sendo divididos em novas carteiras. Alguns relatos dizem que parte do XRP foi posteriormente movida por meio do THORChain em direção ao Bitcoin.
Com certeza, estou de olho nessa situação enquanto os fundos continuam a se movimentar.
#BitgetHackerMoves$83MStolenXRP
jujucrypt
·3 gostos
·2.4k visualizações
SOLSpotETFWeeklyInflow$188M
785 visualizações
37 a discutir
StrategyStriveAdd2305BitcoinThisWeek
34,598 visualizações
950 a discutir