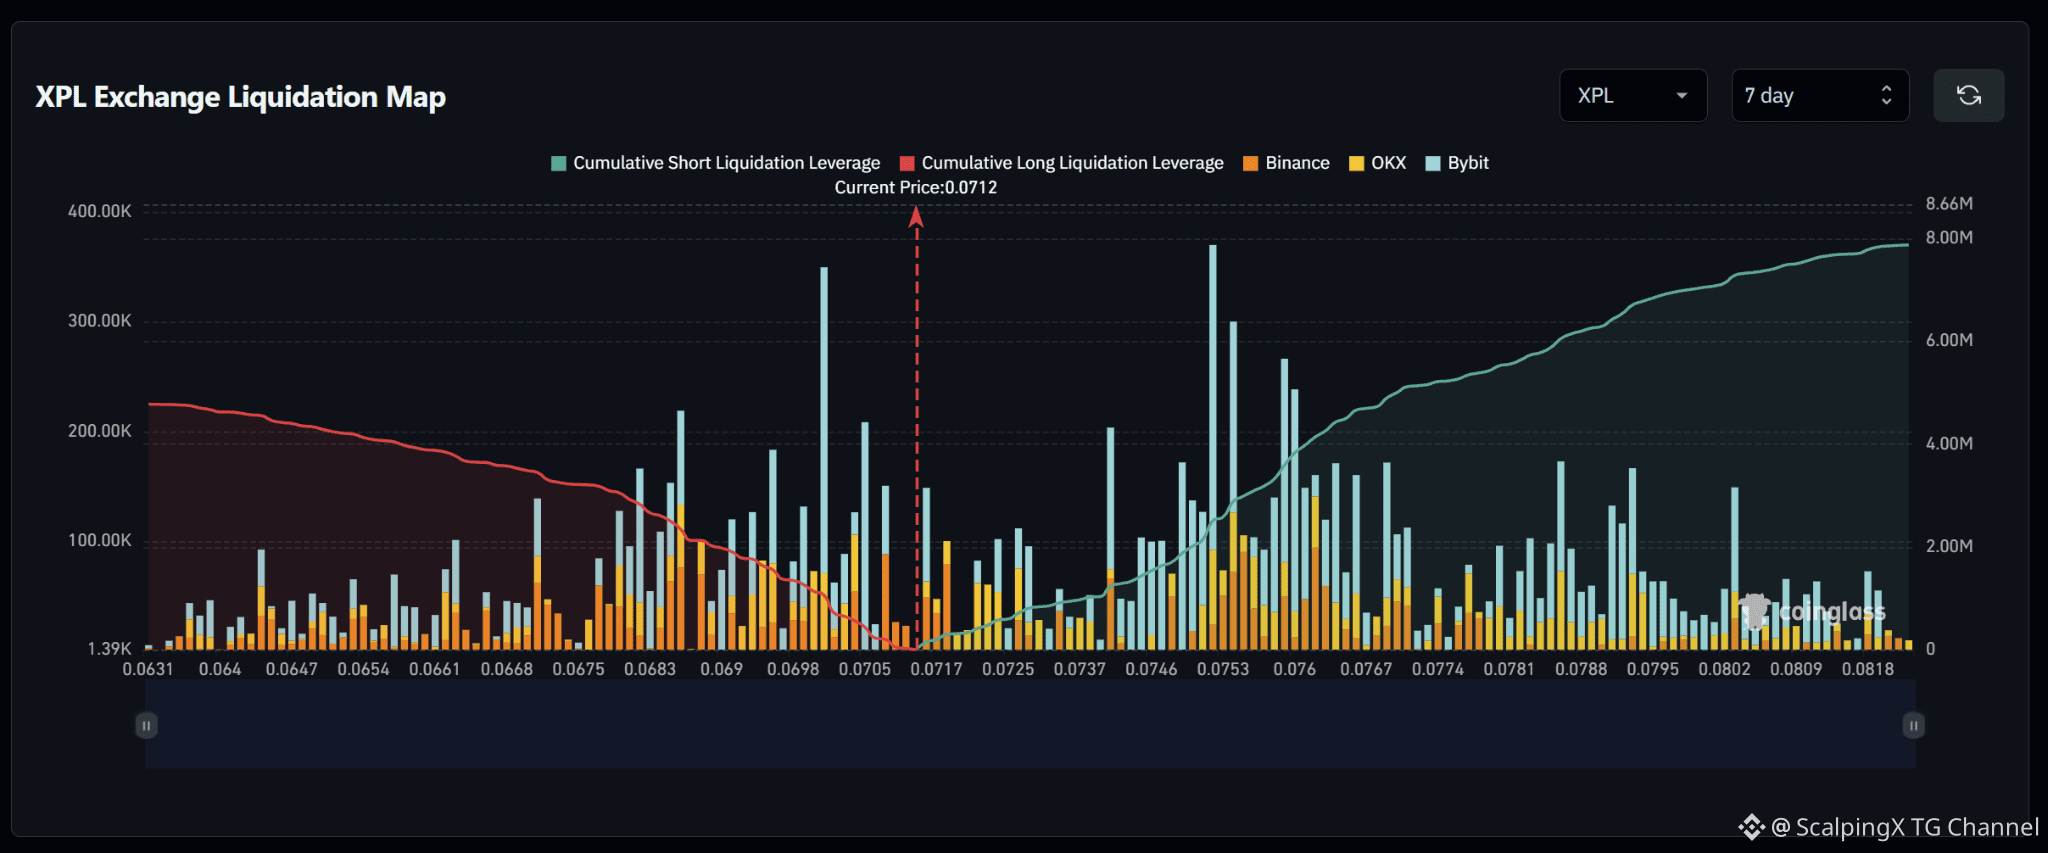
$XPL – Liquidation Map (7 days) – Index ~0.0712
🧭 The preferred scenario is a nearby downside long sweep first. The 0.0700–0.0706 cluster sits close to price, particularly near 0.0701. Cumulative short exposure is larger across the displayed range, but the strongest short band lies farther away at 0.0750–0.0762.
🔻 Losing 0.0708 without a reclaim shifts attention to 0.0700–0.0706. Long liquidations there could amplify the decline; the reaction after the sweep will help assess continuation.
🎯 A further break below 0.0700 brings 0.0682–0.0692 into focus, particularly near 0.0687. Conversely, a downside sweep followed by a quick reclaim of 0.0708 would weaken the case for further declines.
⚖️ A break and hold above 0.0726 shifts priority to short clusters at 0.0740–0.0747, then 0.0750–0.0762. The cluster near 0.0751 contains the map’s largest liquidation bar. Avoid chasing a major cluster sweep that quickly reverses.
#LiquidationMap
🧭 The preferred scenario is a nearby downside long sweep first. The 0.0700–0.0706 cluster sits close to price, particularly near 0.0701. Cumulative short exposure is larger across the displayed range, but the strongest short band lies farther away at 0.0750–0.0762.
🔻 Losing 0.0708 without a reclaim shifts attention to 0.0700–0.0706. Long liquidations there could amplify the decline; the reaction after the sweep will help assess continuation.
🎯 A further break below 0.0700 brings 0.0682–0.0692 into focus, particularly near 0.0687. Conversely, a downside sweep followed by a quick reclaim of 0.0708 would weaken the case for further declines.
⚖️ A break and hold above 0.0726 shifts priority to short clusters at 0.0740–0.0747, then 0.0750–0.0762. The cluster near 0.0751 contains the map’s largest liquidation bar. Avoid chasing a major cluster sweep that quickly reverses.
#LiquidationMap