


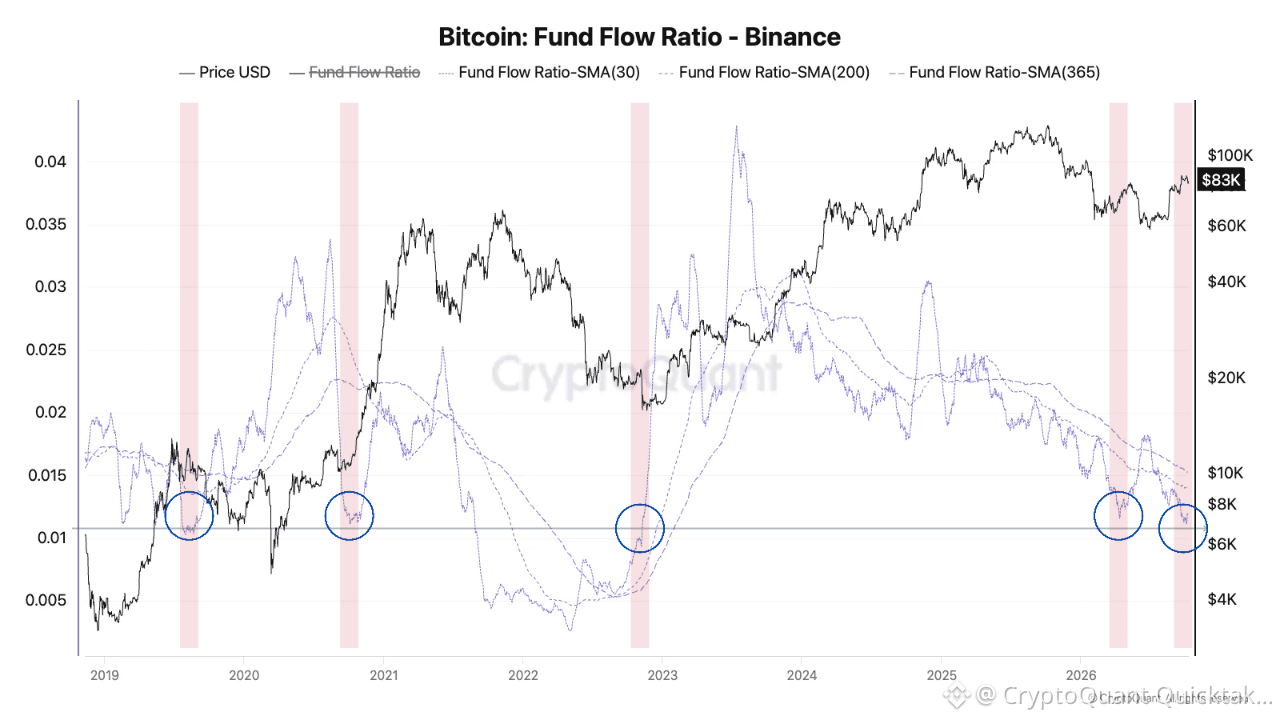
Binance’s 30-day Fund Flow Ratio is approaching 0.011, revisiting a zone associated with several important stages of Bitcoin’s price cycle. Its significance lies in the relationship between subdued exchange-related flows and subsequent shifts in price behavior.
Readings around 0.010–0.012 represent an average daily ratio of approximately 1.0–1.2% between Binance’s combined BTC inflows and outflows and total transfer volume across the Bitcoin network. These levels describe the relative intensity of on-chain activity involving the exchange.
The historical context is particularly relevant. A similar zone appeared in late 2020, ahead of Bitcoin’s strong advance, while the late-2022 revisit coincided with the formation of the bear-market price bottom. The highlighted 2019 episode also occurred during a period of price adjustment, although further downside followed. Together, these episodes identify a recurring area worth monitoring for market transitions, without establishing a consistent signal for their timing or direction.
At the chart’s endpoint, the 30-day average remains below the declining 200-day and 365-day averages. This indicates that Binance-related transfers remain less prominent within overall network activity than their longer-term baseline, despite the price recovery. The configuration offers context for evaluating whether Bitcoin is developing a more durable recovery or continuing through a consolidation phase.
The interpretation would become more constructive if the price recovery were supported by stronger spot demand and renewed on-chain engagement with Binance. In that scenario, a rising ratio would indicate a growing share of network transfer activity involving the exchange. Netflows would help clarify the composition of that activity: net deposits could indicate greater potential selling pressure, while net withdrawals could be consistent with accumulation and reduced exchange-held supply.
Written by MorenoDV_