
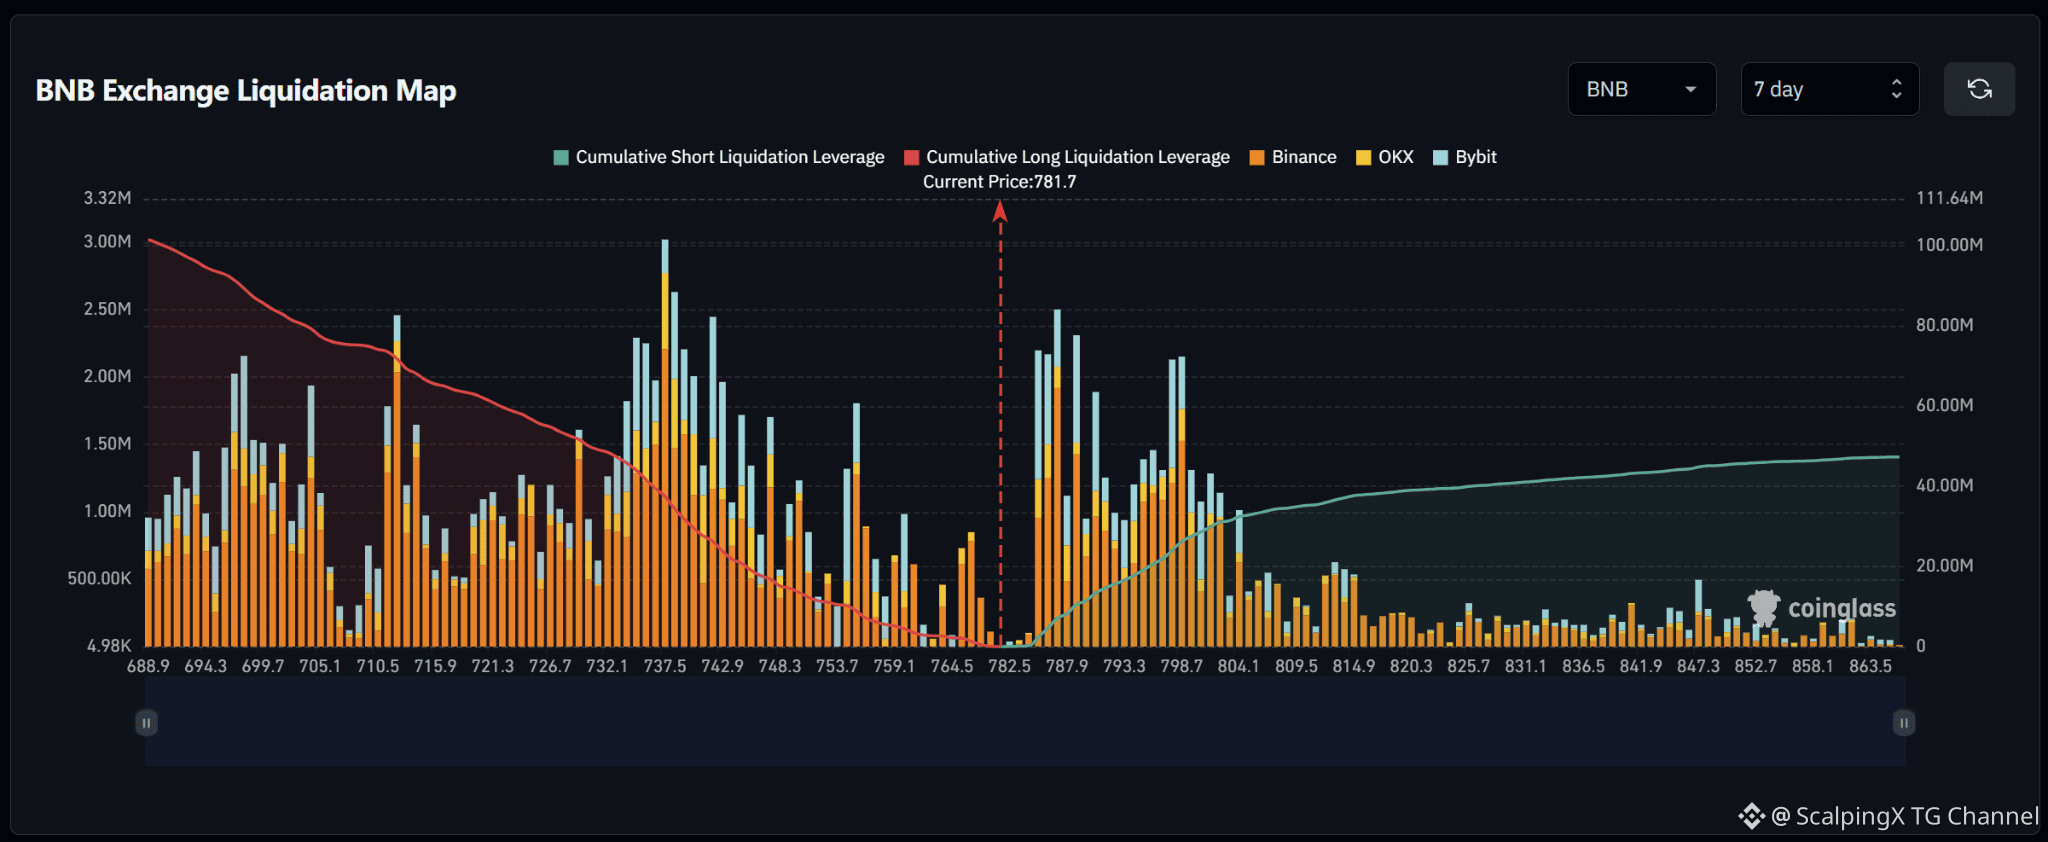
$BNB – Liquidation Map (7 Days) – Current Price 781.7 🔎 The 7-day liquidation map shows roughly 100 million USD in long liquidations below the current price, significantly exceeding approximately 40–45 million USD in short liquidations above. The liquidity structure therefore clearly favors the downside, with around 2.3–2.5 times more cumulative liquidity below the market. 📉 Below the market, long-liquidation liquidity is concentrated heavily across 695–755. The strongest cluster sits around 736–743, with the largest bar close to 3 million USD; the 710–715 and 697–705 areas also contain several bars around 2–2.5 million USD. Liquidity between 765 and the current price is relatively thin, so losing 765 could quickly shift attention toward 759–754 and then 743–737. 📈 Above the market, short-liquidation liquidity is densest across 786–800. A major cluster near 787–789 contains a bar close to 2.5 million USD, while 796–800 holds several bars around 1.5–2.2 million USD. Beyond 805, liquidity density declines noticeably and becomes relatively sparse above 820. 🧭 The broader setup still favors the downside because long-liquidation exposure below is more than twice as large. Losing 765 would increase the probability of a sweep toward 759–754, followed by 743–737. Breaking above 786 would instead expose 788–800 before price enters a thinner liquidity field higher up.

Publicar
Aviso legal: inclui opiniões de terceiros. Não constitui aconselhamento. A Binance AI pode ser utilizada sem garantia. Consulta os Termos e Condições.