
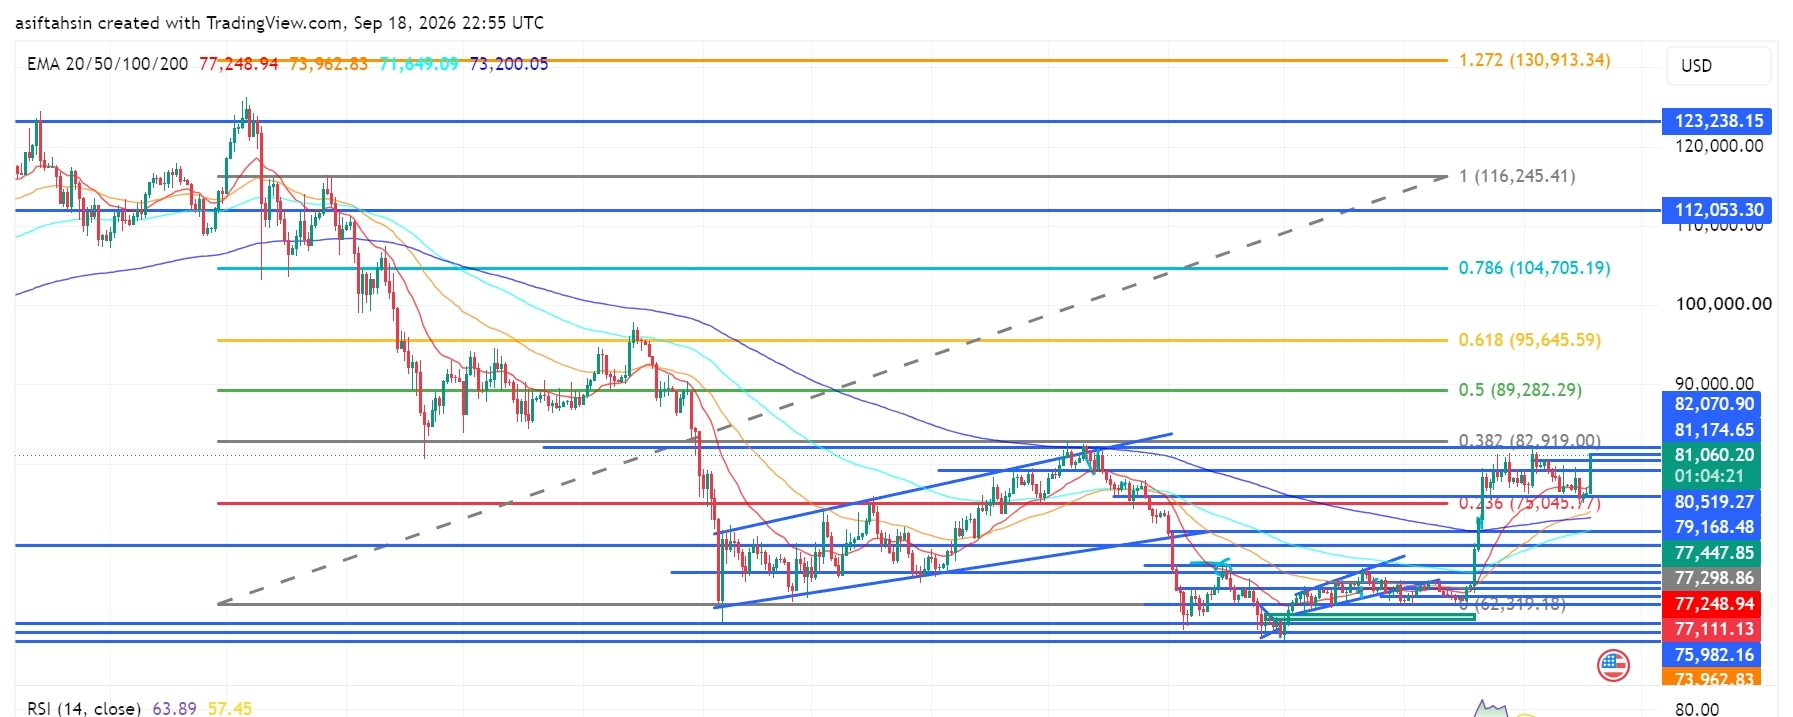

BTC is currently trading around $81,060, holding above the $79,000–$80,000 region after the recent recovery from the $73,000–$76,000 demand area.
The broader structure has improved, with price reclaiming the $80K area and moving back toward the major $82,070–$82,919 resistance zone. A sustained move through this area would put the higher Fibonacci levels back into focus.
📈 EMA Structure
20 EMA: $77,248.95
50 EMA: $73,962.83
100 EMA: $71,649.09
200 EMA: $73,200.05
BTC is currently trading well above the 20 EMA at $77,248.95.
The recovery above the 50 EMA at $73,962.83, 100 EMA at $71,649.09, and 200 EMA at $73,200.05 keeps the broader recovery structure constructive.
The 20 EMA has moved above the longer-term EMA levels, showing improving short-term structure.
📐 Fibonacci Levels
Key Fibonacci levels:
0.236: $75,045.77
0.382: $82,919.00
0.5: $89,282.29
0.618: $95,645.59
0.786: $104,705.19
1.0: $116,245.41
1.272: $130,913.34
BTC is currently trading between the 0.236 and 0.382 Fibonacci levels.
The next major Fibonacci reference is $82,919 — 0.382 Fib.
A sustained move above the $82,070–$82,919 zone could bring $89,282 into focus, followed by $95,645.
🟢 Bullish Scenario
BTC has recovered strongly from the lower support structure and is now consolidating around $80K–$81K.
Immediate resistance:
$81,174.65
$82,070.90
$82,919.00 — 0.382 Fibonacci
$89,282.29 — 0.5 Fibonacci
$95,645.59 — 0.618 Fibonacci
A clean breakout and sustained close above $82,070–$82,919 would provide stronger confirmation of continued recovery.
🎯 Target 1: $82,070
🎯 Target 2: $82,919 — 0.382 Fibonacci
🎯 Target 3: $89,282 — 0.5 Fibonacci
🎯 Target 4: $95,645 — 0.618 Fibonacci
🎯 Target 5: $104,705 — 0.786 Fibonacci
🎯 Target 6: $116,245 — 1.0 Fibonacci
A confirmed move through the $82K–$83K zone could strengthen the medium-term recovery structure and bring the $89K–$95K region into focus.
🔴 Pullback Scenario
After the recent expansion above $80K, a retest of the breakout area would be normal.
Key supports:
$80,519.27
$79,168.48
$77,447.85
$77,298.86
$77,248.95 — 20 EMA
$77,111.13
$75,982.16
$75,045.77 — 0.236 Fibonacci
$73,962.83 — 50 EMA
$73,200.05 — 200 EMA
The $77K–$80K zone is particularly important.
If BTC continues to hold this area during a pullback, the current recovery structure remains active.
A sustained loss of $75,045 would weaken the current recovery structure and bring the lower EMA region back into focus.
🧠 Market Structure & Liquidity
BTC has formed a recovery structure after sweeping liquidity around the $73K–$76K region.
The recent move produced a strong recovery through $77K, followed by a breakout above $80K.
BTC is now moving through an important:
Recovery → Breakout → Retest → Consolidation → Continuation
structure.
The major upside liquidity is concentrated around $81K–$83K. A decisive move through this area would place $89,282 as the next major Fibonacci reference.
📊 RSI Momentum
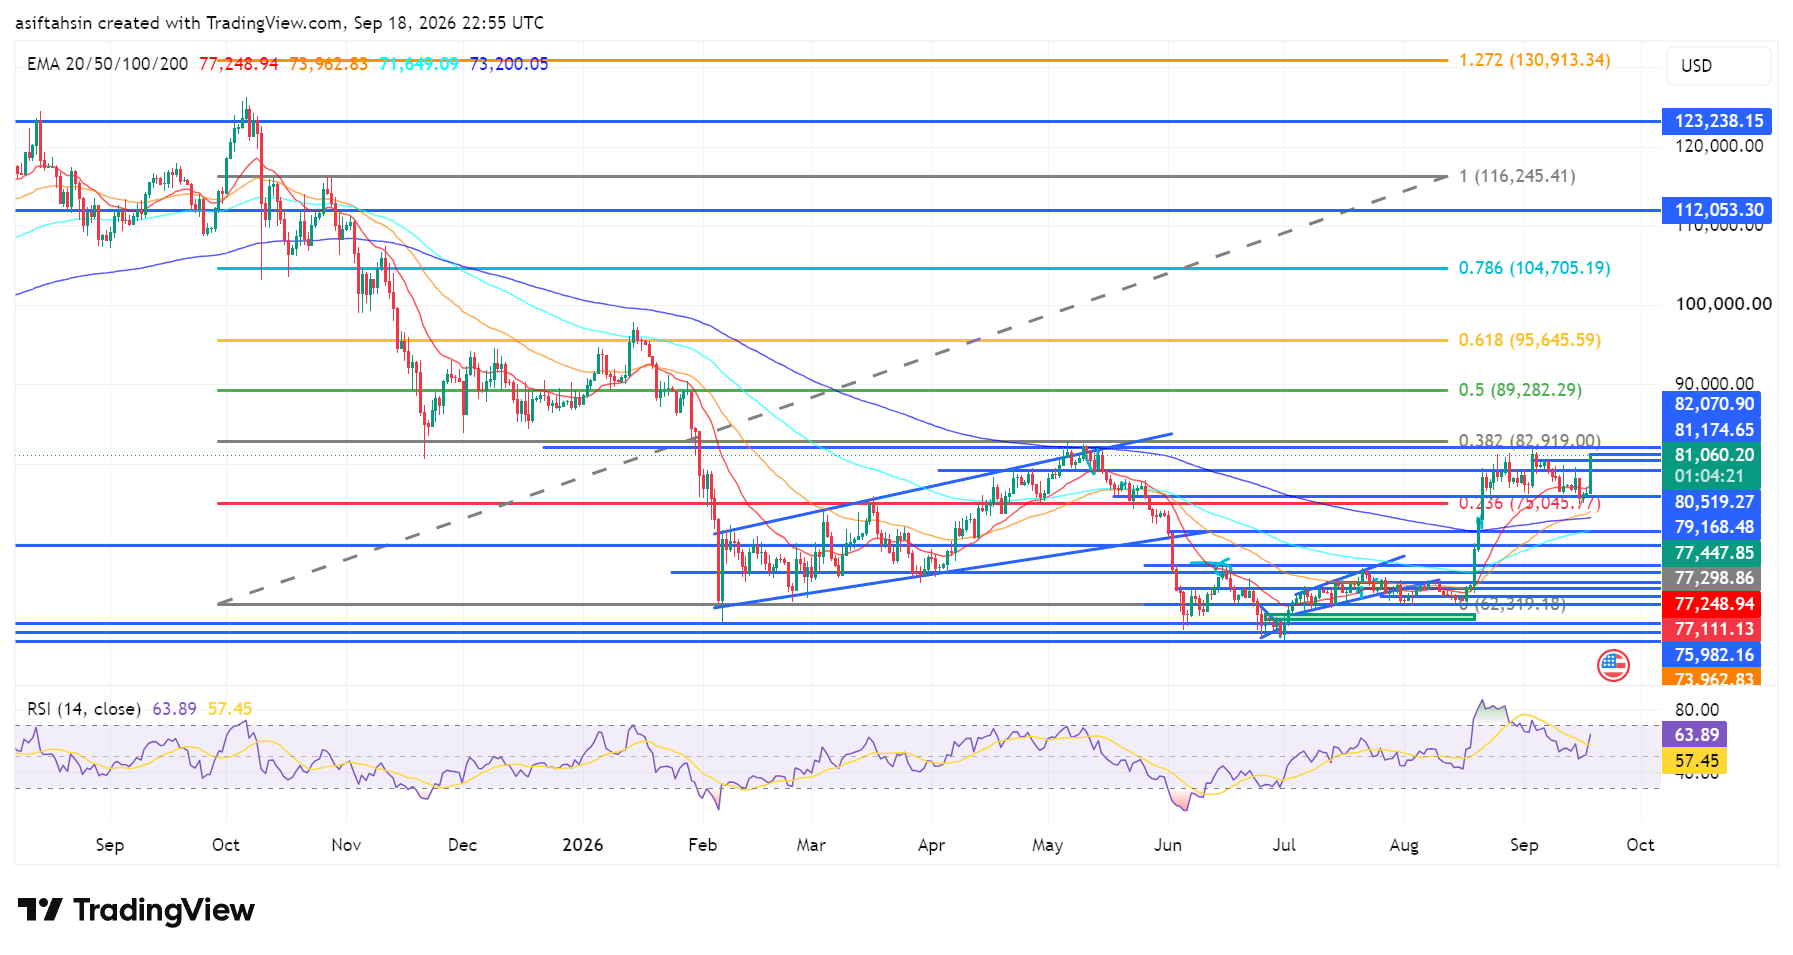
RSI (14): 63.89
RSI has moved above the neutral 50 level and remains in positive territory after the recent expansion.
The current reading shows stronger short-term momentum, while still remaining below the traditional 70 overbought threshold.
A sustained RSI above 60 would keep momentum supportive, while a move back below 50 would indicate increasing short-term weakness.
🎯 Key Levels
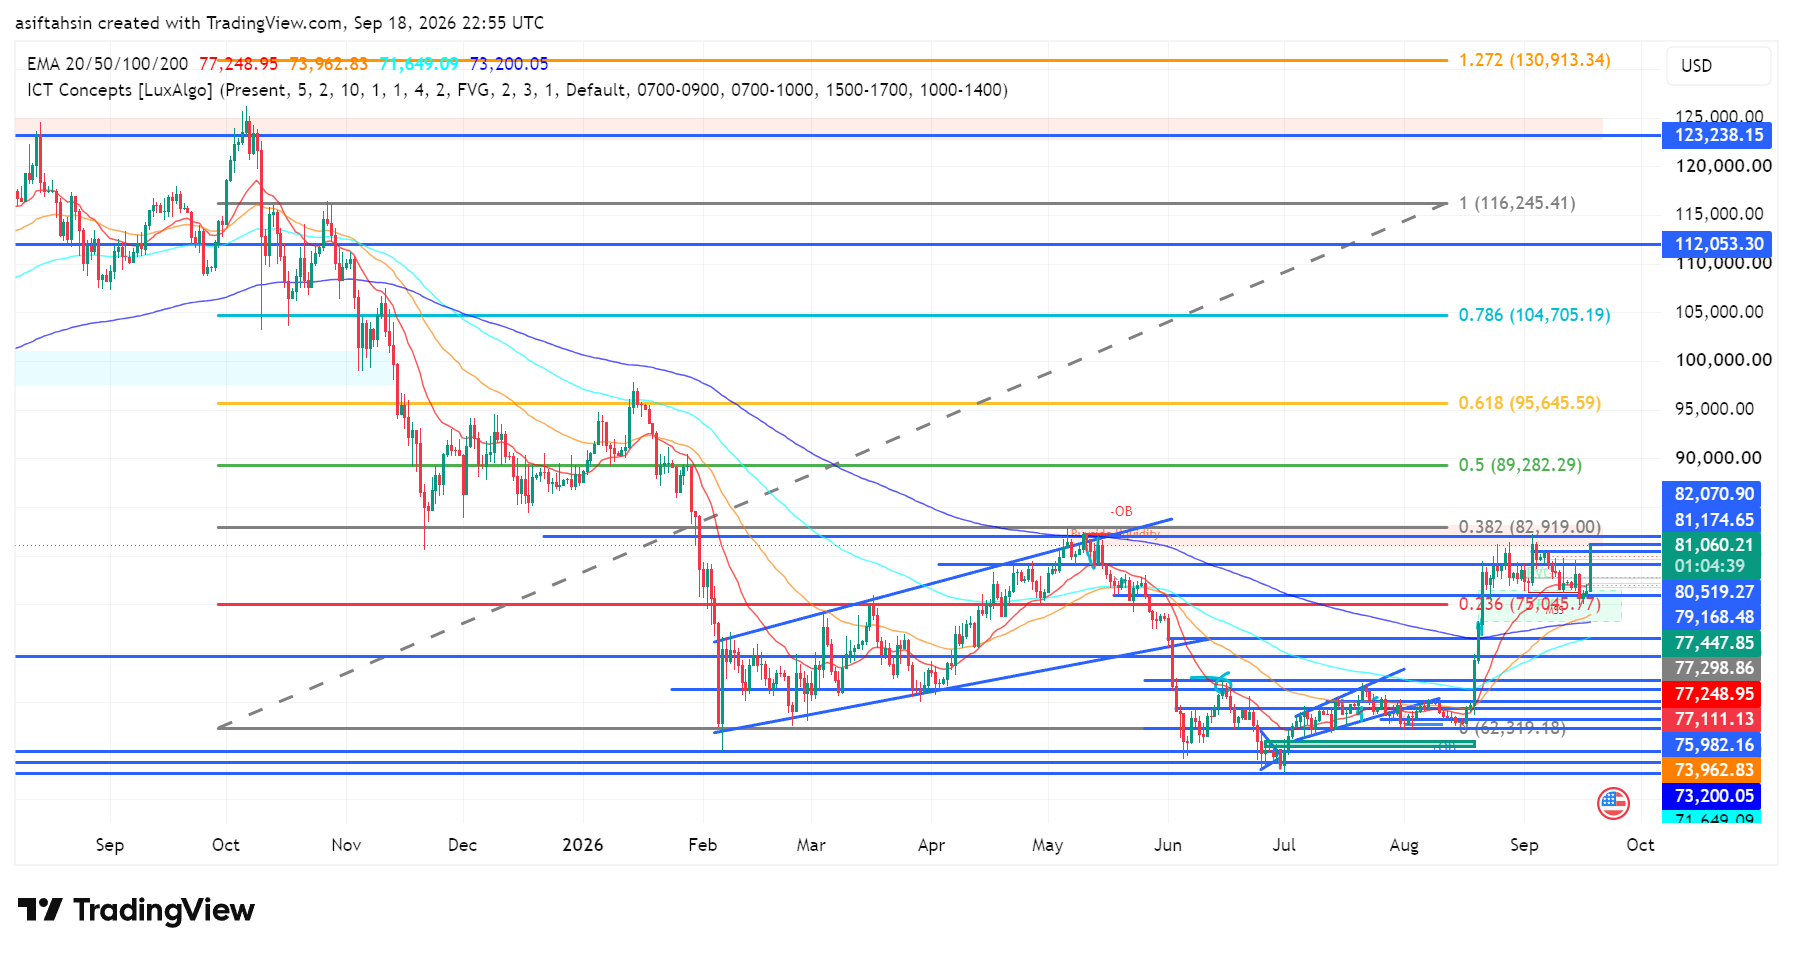
🔴 Major Resistance: $81,174.65 → $82,070.90 → $82,919 → $89,282 → $95,645
🟢 Major Support: $80,519 → $79,168 → $77,447 → $77,249 → $75,982 → $75,045
📉 Dynamic EMA Support: $77,248.95 — 20 EMA | $73,962.83 — 50 EMA | $73,200.05 — 200 EMA | $71,649.09 — 100 EMA
🚀 Upside References: $82,919 → $89,282 → $95,645 → $104,705 → $116,245
📌 Final Outlook
BTC's broader structure has strengthened after the recent recovery, with price now holding around $81K and above the major $77K–$80K support structure.
The $77K–$80K area is now an important short-term support region, while $82K–$83K remains the immediate major resistance zone.
A confirmed move above $82,919 could open the path toward $89,282, followed by $95,645 and $104,705.
However, rejection from the upper resistance area followed by a sustained loss of $75,045 would weaken the current recovery structure and bring the lower support zones back into focus.
Bias: 🟢 Recovery structure intact above $75,045. A sustained move above $82,919 could open the path toward $89,282, with $95,645 as the next major Fibonacci reference.
