Picture a coin that just fell off a cliff, bounced off the floor, and is now sitting there wondering if gravity still applies.
That's $VIB right now.
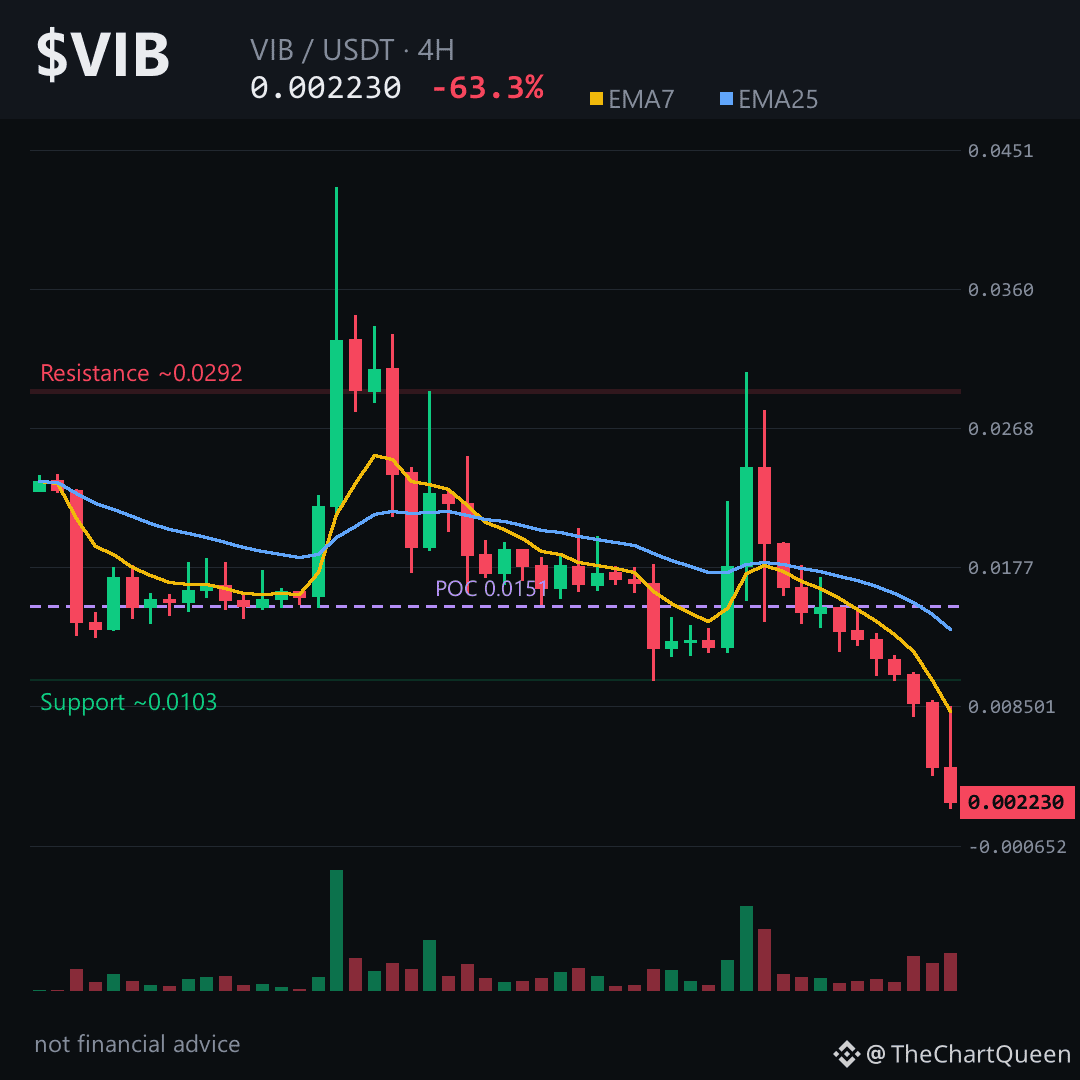
Down 63% in a day. A 288% range between high and low. This isn't a dip — it's a full-scale capitulation event.
Yesterday's candle opened near 0.0177, spiked to 0.0305, then bled out in a nearly uninterrupted cascade. Eleven of the last twelve 4-hour candles closed lower. The last one alone dropped over 50%.
That's not normal selling. That's a market structure collapse.
EMA7 sits around 0.0082 while EMA25 is way up near 0.0134 — a massive bearish spread. RSI is at 28.6, deeply oversold, but oversold can stay oversold longer than feels comfortable.
The volume profile shows the heaviest traded zone around 0.015, far above current price. We're trading in a vacuum — very little historical volume down here to act as support.
There's also an unfilled bearish gap between roughly 0.0102 and 0.0089. Gaps like that often act like magnets on any bounce attempt.
The key area to watch is around 0.00235 — if price can't reclaim that zone on a 4-hour close, the path of least resistance probably stays lower. The next meaningful demand pocket sits near 0.00204, and if that fails, there's not much standing between here and the 0.0019 region.
On the flip side, if buyers push back above 0.00235 with conviction, this read starts to weaken. Losing that level as resistance is the first sign the bleed might be slowing.
My read: decisively bearish, but the pace of the crash means a sharp technical bounce is always possible. The risk isn't being wrong about direction — it's underestimating how violently these oversold snapbacks can move in thin volume.
Tap $VIB to pull up the chart and see how these levels line up with what you're seeing.
What level are you watching most closely on $VIB right now? 👇
Follow for the next read on this chart.
⚠️ Not financial advice. DYOR.
#VIB #Crypto #BinanceSquare #Altcoins
That's $VIB right now.
Down 63% in a day. A 288% range between high and low. This isn't a dip — it's a full-scale capitulation event.
Yesterday's candle opened near 0.0177, spiked to 0.0305, then bled out in a nearly uninterrupted cascade. Eleven of the last twelve 4-hour candles closed lower. The last one alone dropped over 50%.
That's not normal selling. That's a market structure collapse.
EMA7 sits around 0.0082 while EMA25 is way up near 0.0134 — a massive bearish spread. RSI is at 28.6, deeply oversold, but oversold can stay oversold longer than feels comfortable.
The volume profile shows the heaviest traded zone around 0.015, far above current price. We're trading in a vacuum — very little historical volume down here to act as support.
There's also an unfilled bearish gap between roughly 0.0102 and 0.0089. Gaps like that often act like magnets on any bounce attempt.
The key area to watch is around 0.00235 — if price can't reclaim that zone on a 4-hour close, the path of least resistance probably stays lower. The next meaningful demand pocket sits near 0.00204, and if that fails, there's not much standing between here and the 0.0019 region.
On the flip side, if buyers push back above 0.00235 with conviction, this read starts to weaken. Losing that level as resistance is the first sign the bleed might be slowing.
My read: decisively bearish, but the pace of the crash means a sharp technical bounce is always possible. The risk isn't being wrong about direction — it's underestimating how violently these oversold snapbacks can move in thin volume.
Tap $VIB to pull up the chart and see how these levels line up with what you're seeing.
What level are you watching most closely on $VIB right now? 👇
Follow for the next read on this chart.
⚠️ Not financial advice. DYOR.
#VIB #Crypto #BinanceSquare #Altcoins