What happens when a coin is up 1.3% on the day, yet the chart is quietly bleeding momentum?
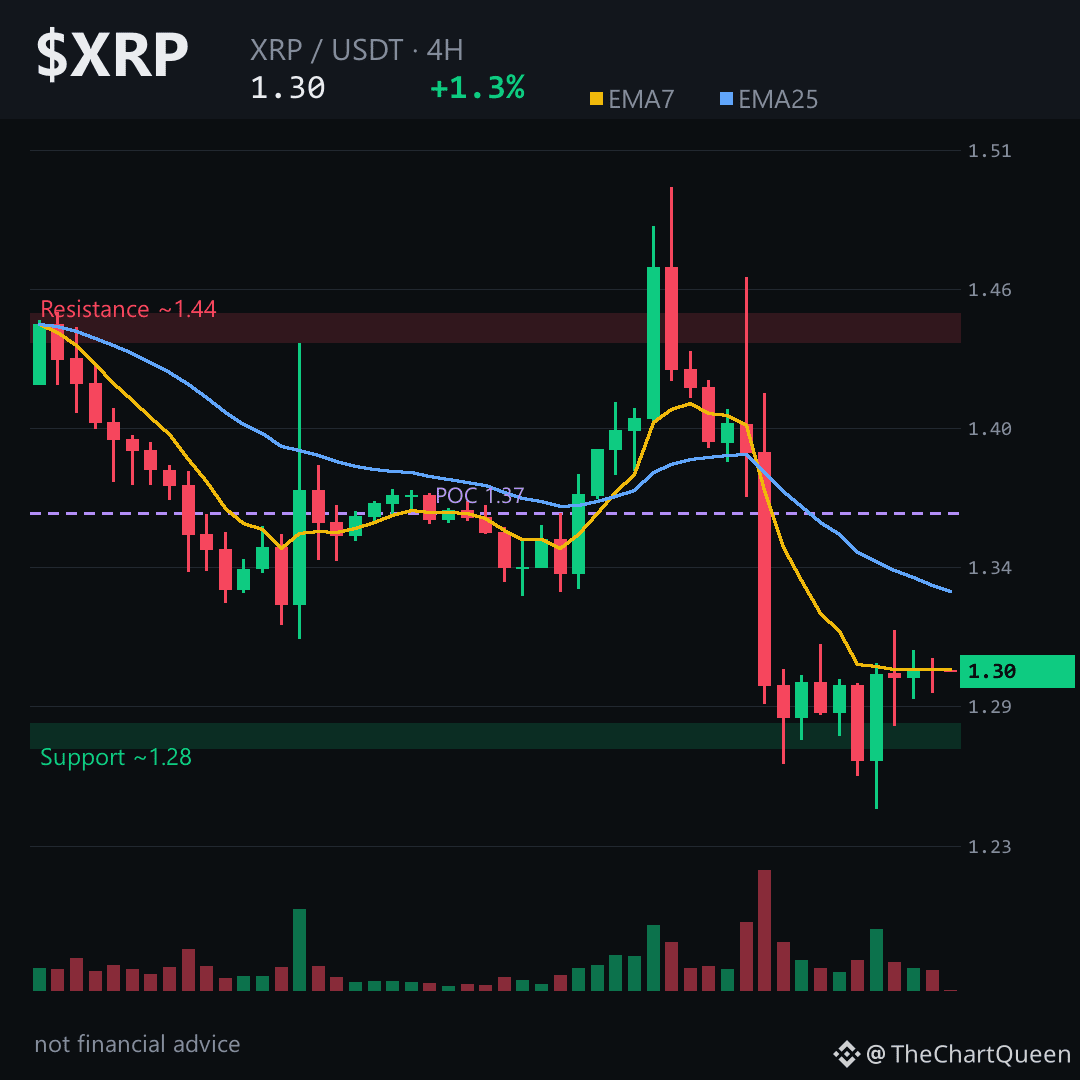
That gap between what price *shows* and what internals *whisper* is where the real story lives. $XRP is sitting inside a bearish imbalance zone — an unfilled gap roughly between 1.37 and 1.30.
The 4H chart shows price below both key moving averages. RSI is drifting near 40 — not oversold, just weak.
But futures tell a different story. Funding is slightly positive. Open interest is rising. Long/short ratio sits at 2.52 — crowded longs can unwind fast.
The 4H picture leans bearish. $XRP hovers near 1.31 — the pivot. If it holds above 1.30, the bearish case weakens. But real invalidation sits higher, around 1.37. A decisive push above that means sellers lost control.
Until then, path of least resistance points toward 1.19 — a level where buyers stepped in before.
My read: the bounce looks fragile. Price stuck under resistance, momentum fading, crowd leaning heavily one way. That combo often precedes a flush toward the next support shelf.
Tap $XRP to pull up the chart and see these zones yourself.
I’ll update this read if the 1.30–1.37 range resolves either way — follow so you catch it.
Which zone are you watching more closely on XRP — the 1.30 floor or the 1.37 ceiling? 👇
⚠️ Not financial advice. DYOR.
#XRP #Ripple #Crypto #BinanceSquare
That gap between what price *shows* and what internals *whisper* is where the real story lives. $XRP is sitting inside a bearish imbalance zone — an unfilled gap roughly between 1.37 and 1.30.
The 4H chart shows price below both key moving averages. RSI is drifting near 40 — not oversold, just weak.
But futures tell a different story. Funding is slightly positive. Open interest is rising. Long/short ratio sits at 2.52 — crowded longs can unwind fast.
The 4H picture leans bearish. $XRP hovers near 1.31 — the pivot. If it holds above 1.30, the bearish case weakens. But real invalidation sits higher, around 1.37. A decisive push above that means sellers lost control.
Until then, path of least resistance points toward 1.19 — a level where buyers stepped in before.
My read: the bounce looks fragile. Price stuck under resistance, momentum fading, crowd leaning heavily one way. That combo often precedes a flush toward the next support shelf.
Tap $XRP to pull up the chart and see these zones yourself.
I’ll update this read if the 1.30–1.37 range resolves either way — follow so you catch it.
Which zone are you watching more closely on XRP — the 1.30 floor or the 1.37 ceiling? 👇
⚠️ Not financial advice. DYOR.
#XRP #Ripple #Crypto #BinanceSquare