$YFI
📊 YFI/USDT 15-Min Chart — Bulls Still Holding, But 2080 Is the Test
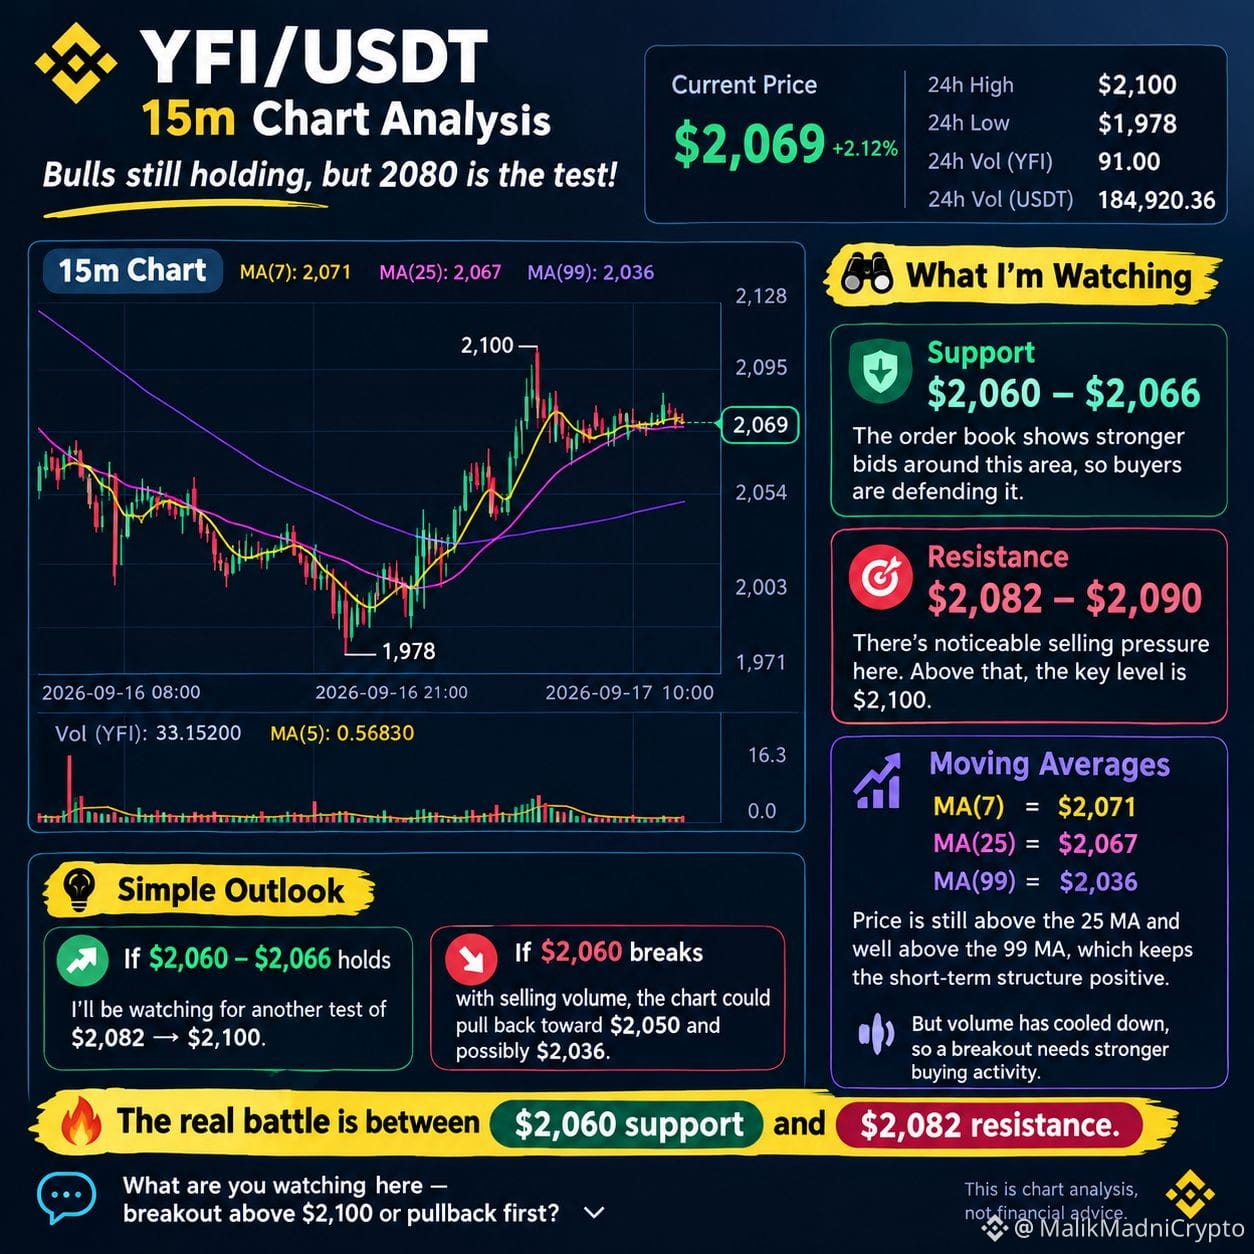
YFI is trading around $2,069, after a strong move from the $1,978 low to the $2,100 high.
Right now, price is moving sideways and catching its breath.
What I’m watching 👀
🟢 Support: $2,060–$2,066
The order book shows stronger bids around this area, so buyers are currently defending it.
🔴 Resistance: $2,082–$2,090
There’s noticeable selling pressure here. Above that, $2,100 is the key level.
📈 Moving averages:
MA(7) = $2,071
MA(25) = $2,067
MA(99) = $2,036
Price is still above the 25 MA and well above the 99 MA, which keeps the short-term structure relatively positive. But volume has cooled down, so a breakout needs stronger buying activity.
My simple view:
If YFI holds $2,060–$2,066, I’ll be watching for another test of $2,082 → $2,100.
If $2,060 breaks with selling volume, the chart could pull back toward $2,050 and possibly $2,036.
🔥 The real battle is between $2,060 support and $2,082 resistance.
What are you watching here — breakout above $2,100 or pullback first? 👇
This is chart analysis, not financial advice.
$NVDAB $YFI #USHouseAdvancesBitcoinReserveBill
📊 YFI/USDT 15-Min Chart — Bulls Still Holding, But 2080 Is the Test
YFI is trading around $2,069, after a strong move from the $1,978 low to the $2,100 high.
Right now, price is moving sideways and catching its breath.
What I’m watching 👀
🟢 Support: $2,060–$2,066
The order book shows stronger bids around this area, so buyers are currently defending it.
🔴 Resistance: $2,082–$2,090
There’s noticeable selling pressure here. Above that, $2,100 is the key level.
📈 Moving averages:
MA(7) = $2,071
MA(25) = $2,067
MA(99) = $2,036
Price is still above the 25 MA and well above the 99 MA, which keeps the short-term structure relatively positive. But volume has cooled down, so a breakout needs stronger buying activity.
My simple view:
If YFI holds $2,060–$2,066, I’ll be watching for another test of $2,082 → $2,100.
If $2,060 breaks with selling volume, the chart could pull back toward $2,050 and possibly $2,036.
🔥 The real battle is between $2,060 support and $2,082 resistance.
What are you watching here — breakout above $2,100 or pullback first? 👇
This is chart analysis, not financial advice.
$NVDAB $YFI #USHouseAdvancesBitcoinReserveBill