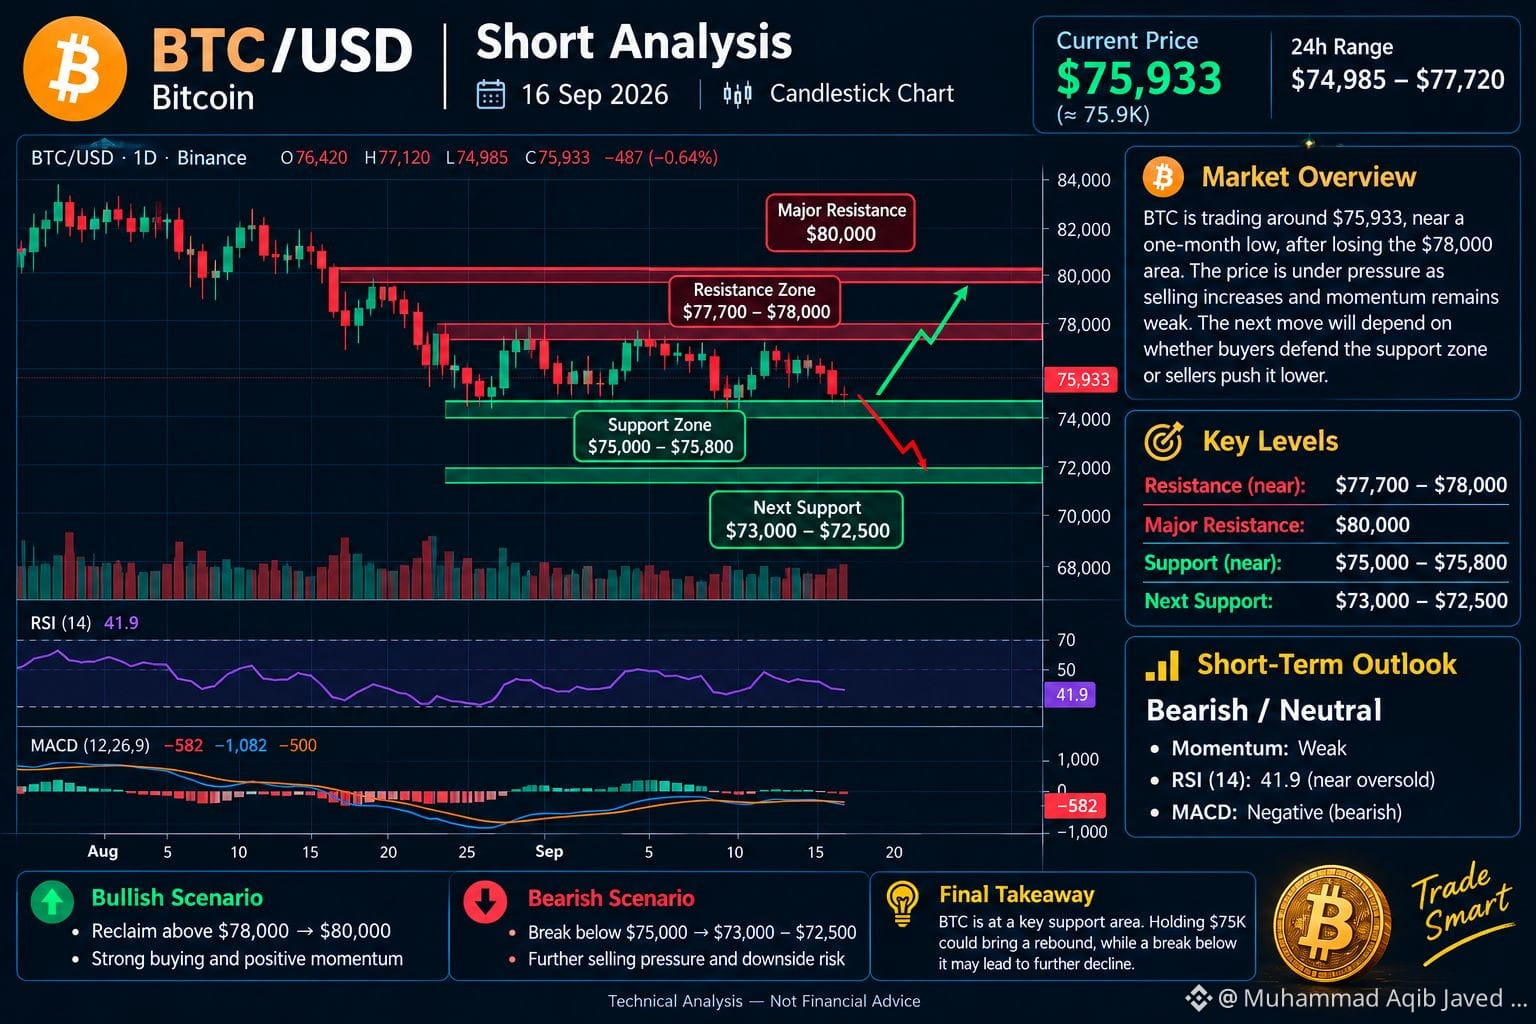
$BTC BTC/USD Short Analysis — 16 Sep 2026
Current price: around $75,933. �
Investing.com India
Trend: Bearish / Neutral
Support: $75,000–$75,800
Next support: $73,000–$72,500
Resistance: $77,700–$78,000
Major resistance: $80,000
RSI: around 42, showing weak momentum. �
Investing.com India
Bullish scenario: A sustained break above $78K could open the way toward $80K.
Bearish scenario: A break below $75K could expose the $73K–$72.5K area.
Bitcoin is currently trading near a one-month low, so the $75K support zone is the key level to watch. �
marketwatch.com +1
Candle chart: the chart above shows the support, resistance and possible breakout paths.
#FedRateWatch #BTC #ArgentinaCommitsToOECDCryptoReportingBy2029 #USSenateBlocksClarityAct #ClarityActOddsHalveOnPolymarket
Current price: around $75,933. �
Investing.com India
Trend: Bearish / Neutral
Support: $75,000–$75,800
Next support: $73,000–$72,500
Resistance: $77,700–$78,000
Major resistance: $80,000
RSI: around 42, showing weak momentum. �
Investing.com India
Bullish scenario: A sustained break above $78K could open the way toward $80K.
Bearish scenario: A break below $75K could expose the $73K–$72.5K area.
Bitcoin is currently trading near a one-month low, so the $75K support zone is the key level to watch. �
marketwatch.com +1
Candle chart: the chart above shows the support, resistance and possible breakout paths.
#FedRateWatch #BTC #ArgentinaCommitsToOECDCryptoReportingBy2029 #USSenateBlocksClarityAct #ClarityActOddsHalveOnPolymarket