DAILY SIGNAL — SOL/USDT
Date: 15 Sep 2026
Timeframe: 1m Intraday Bias
📊 Market Bias:
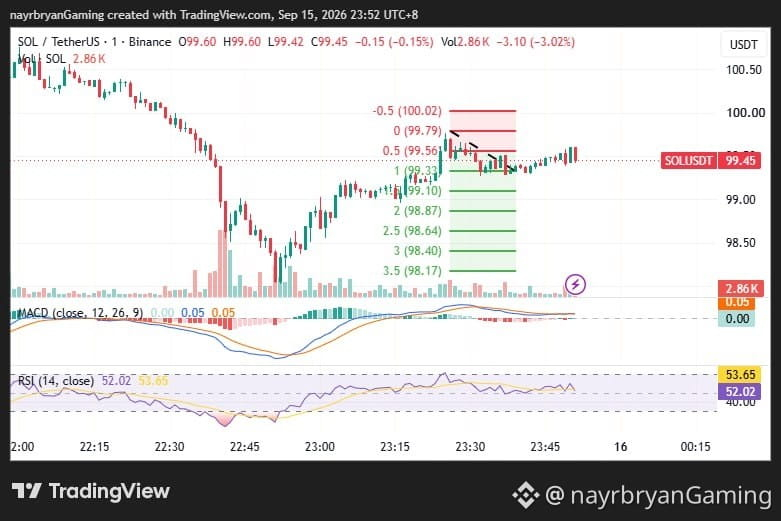
SOL is trading under a descending trendline after a sharp sell-off from the 101+ area. Price recovered from the 98.00–98.20 region but is now consolidating below the former support/supply zone around 99.55–99.80. The broader short-term structure remains bearish while price stays below the descending trendline and the 99.79–100.03 resistance area.
🔹 Key Levels (from chart)
Entry Zone (Short Bias): 99.56 → 99.79 (0.5 → 0)
Stop-Loss (Invalidation): 100.03 (-0.5)
Targets:
TP1 → 99.33 (1.0)
TP2 → 99.10 (1.5)
TP3 → 98.87 (2.0)
*TP4 → 98.64 (2.5, extended)
*TP5 → 98.40 (3.0, extended)
*TP6 → 98.17 (3.5, extended)
📈 Technical Breakdown
SOL experienced a strong rejection from the upper region before selling aggressively toward 98.00. The subsequent recovery reached back into the purple resistance zone, but price remains beneath the descending blue trendline. The current consolidation around 99.44 suggests hesitation rather than a confirmed bullish reversal. The 99.56–99.79 region is the key resistance area, while 100.03 represents the chart-defined invalidation level. A rejection from resistance could reopen the downside toward the Fibonacci extension levels.
🧠 Quick Insight
“After a sharp sell-off, the first recovery is not automatically a reversal. Let price prove whether resistance has truly been reclaimed.”
⚠️ Disclaimer
This is personal analysis, not financial advice. Always DYOR / DYODD, manage risk properly, and avoid emotional trading.
— @nayrbryanGaming #SOL #DYOR #NFA #SAP #NOFOMO 🔔 Follow my Binance Square & X (@nayrbryanGaming) for daily signals.
Date: 15 Sep 2026
Timeframe: 1m Intraday Bias
📊 Market Bias:
SOL is trading under a descending trendline after a sharp sell-off from the 101+ area. Price recovered from the 98.00–98.20 region but is now consolidating below the former support/supply zone around 99.55–99.80. The broader short-term structure remains bearish while price stays below the descending trendline and the 99.79–100.03 resistance area.
🔹 Key Levels (from chart)
Entry Zone (Short Bias): 99.56 → 99.79 (0.5 → 0)
Stop-Loss (Invalidation): 100.03 (-0.5)
Targets:
TP1 → 99.33 (1.0)
TP2 → 99.10 (1.5)
TP3 → 98.87 (2.0)
*TP4 → 98.64 (2.5, extended)
*TP5 → 98.40 (3.0, extended)
*TP6 → 98.17 (3.5, extended)
📈 Technical Breakdown
SOL experienced a strong rejection from the upper region before selling aggressively toward 98.00. The subsequent recovery reached back into the purple resistance zone, but price remains beneath the descending blue trendline. The current consolidation around 99.44 suggests hesitation rather than a confirmed bullish reversal. The 99.56–99.79 region is the key resistance area, while 100.03 represents the chart-defined invalidation level. A rejection from resistance could reopen the downside toward the Fibonacci extension levels.
🧠 Quick Insight
“After a sharp sell-off, the first recovery is not automatically a reversal. Let price prove whether resistance has truly been reclaimed.”
⚠️ Disclaimer
This is personal analysis, not financial advice. Always DYOR / DYODD, manage risk properly, and avoid emotional trading.
— @nayrbryanGaming #SOL #DYOR #NFA #SAP #NOFOMO 🔔 Follow my Binance Square & X (@nayrbryanGaming) for daily signals.