
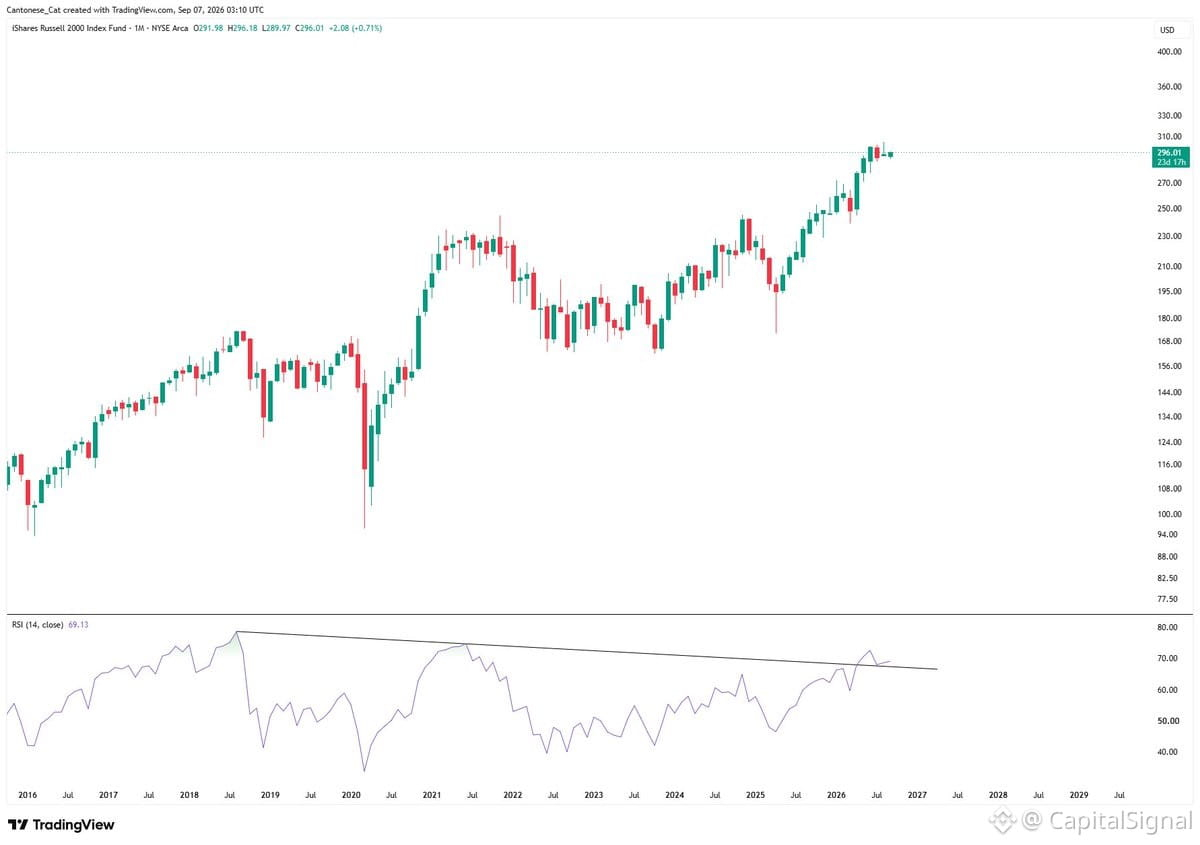
$IWM monthly chart showing RSI breakout with a clean back-test. This is textbook technical setup — momentum confirmed, support retested. Small caps historically rip hard once this pattern holds. Watch for follow-through here. If it sticks above this level, you're looking at a multi-month run in Russell 2000 land.

Publicar
Aviso legal: inclui opiniões de terceiros. Não constitui aconselhamento. A Binance AI pode ser utilizada sem garantia. Consulta os Termos e Condições.