

Haedal put in a sharp spike to $0.0205 five days ago, got rejected hard, and has spent the time since quietly rebuilding a higher base. That base just produced a fresh Higher High — the first real sign buyers are stepping back in.
Market Snapshot
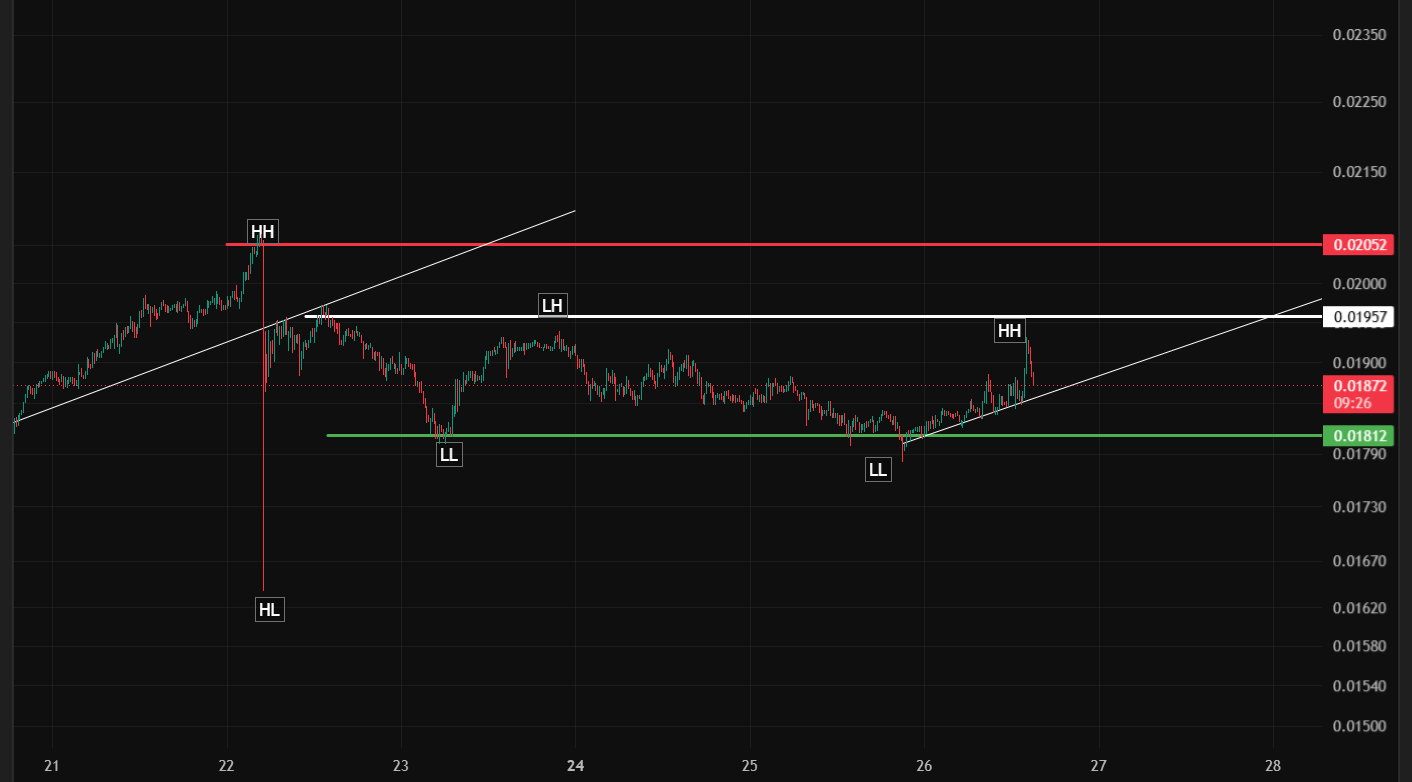
HAEDAL/USDT is trading around $0.01884 on Binance Perpetuals at the time of writing, flat over the last 15-minute candle (O $0.01883 / H $0.01885 / L $0.01882 / C $0.01884, 0.00%) after bouncing off the $0.01812 support shelf and tagging a fresh intraday Higher High near $0.0192. Price is consolidating right along a long-term rising trendline that's been in place since August 21.
Structure Breakdown
The 15-minute chart tells a clear story of a failed breakout followed by patient base-building:
The spike and rejection (Aug 21–22): HAEDAL rallied from a Higher Low near $0.0172 to a sharp Higher High at $0.02052, but the move was immediately rejected, crashing straight down to a Lower Low near $0.01810 — a classic blow-off top and fade.
Range-building (Aug 22–25): Since that rejection, price has chopped inside a well-defined range between a Lower High around $0.01957 and a Lower Low that held twice near $0.01812 — the second test of that support (Aug 25) being especially important, since it confirmed buyers were still defending the level.
Fresh Higher High (Aug 25–26): From the second test of $0.01812, HAEDAL bounced along the rising trendline and just printed a new Higher High near $0.0192 — the first Higher High since the failed spike, and a meaningful shift in short-term structure.
Key Levels to Watch
Immediate support: $0.01860 (recent consolidation floor, aligned with the rising trendline)
Structural support: $0.01812 (green level, twice-tested range floor)
Resistance 1: $0.01957 (white level, the range's Lower High — the key level standing between here and a full trend reversal)
Resistance 2 (major): $0.02052 (red level, the original Higher High and the range's absolute ceiling)
Trade Setups (Not Financial Advice)
Setup 1 — Trendline Support Retest (lower risk, higher probability)
Entry zone: $0.01812 – $0.01860, on a hold of the twice-tested support and rising trendline
Stop loss: below $0.01790 (a clean break of both the range floor and the trendline)
Target 1: $0.01957
Target 2: $0.02052
Risk-to-reward: roughly 1:2 to 1:3.5 depending on fill location
Setup 2 — Range Breakout (higher risk, for confirmation traders)
Entry trigger: a 15m candle close above $0.01960
Stop loss: $0.01860 (below the current consolidation low)
Target 1: $0.02052
Target 2: $0.0215–$0.0220 if the range finally resolves upward with volume
Invalidation: A clean close below $0.01790 would break both the range floor and the rising trendline, putting the recent Higher High in doubt — in that scenario, the next support to watch sits back near $0.0172, where this entire structure originated.
The Bigger Picture
The most encouraging thing here isn't the size of any single move — it's that HAEDAL held the same support level twice after a failed breakout, then used it to print a fresh Higher High. That's a healthier setup than the original spike, which had no base underneath it at all. The $0.01957 level is the real test: reclaim it, and the path toward $0.02052 and a genuine trend reversal opens up. Fail there again, and this likely stays a range-bound chop for a while longer.
Lower-cap tokens like HAEDAL can see outsized moves relative to their liquidity, so treat these levels as a framework and always trade with a stop loss.
This article is for informational purposes only and does not constitute financial advice. Cryptocurrency trading carries significant risk of loss. Always do your own research (DYOR) and manage risk according to your own risk tolerance before trading.
@Binance Square Official #BitcoinFaces$6.4BOptionsExpiry #IranSaysHormuzOmanDealNotFinalized #XRPRallies44%InAWeek #Binance #ChartSniper