

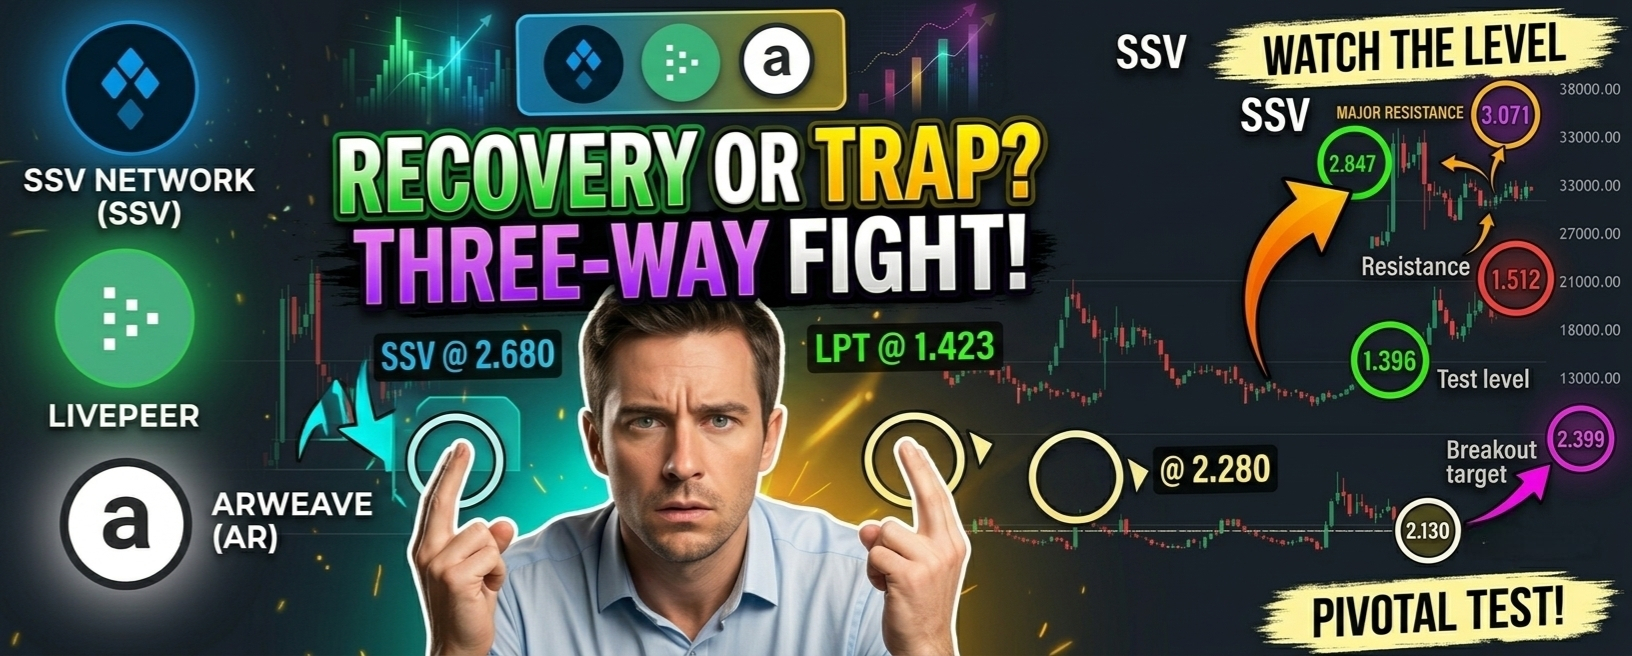

Um grupo de altcoins de média capitalização está mostrando sinais de recuperação após recentes mínimas, mas cada uma enfrenta níveis de resistência distintos que determinarão se o repique continua ou se enfraquece.
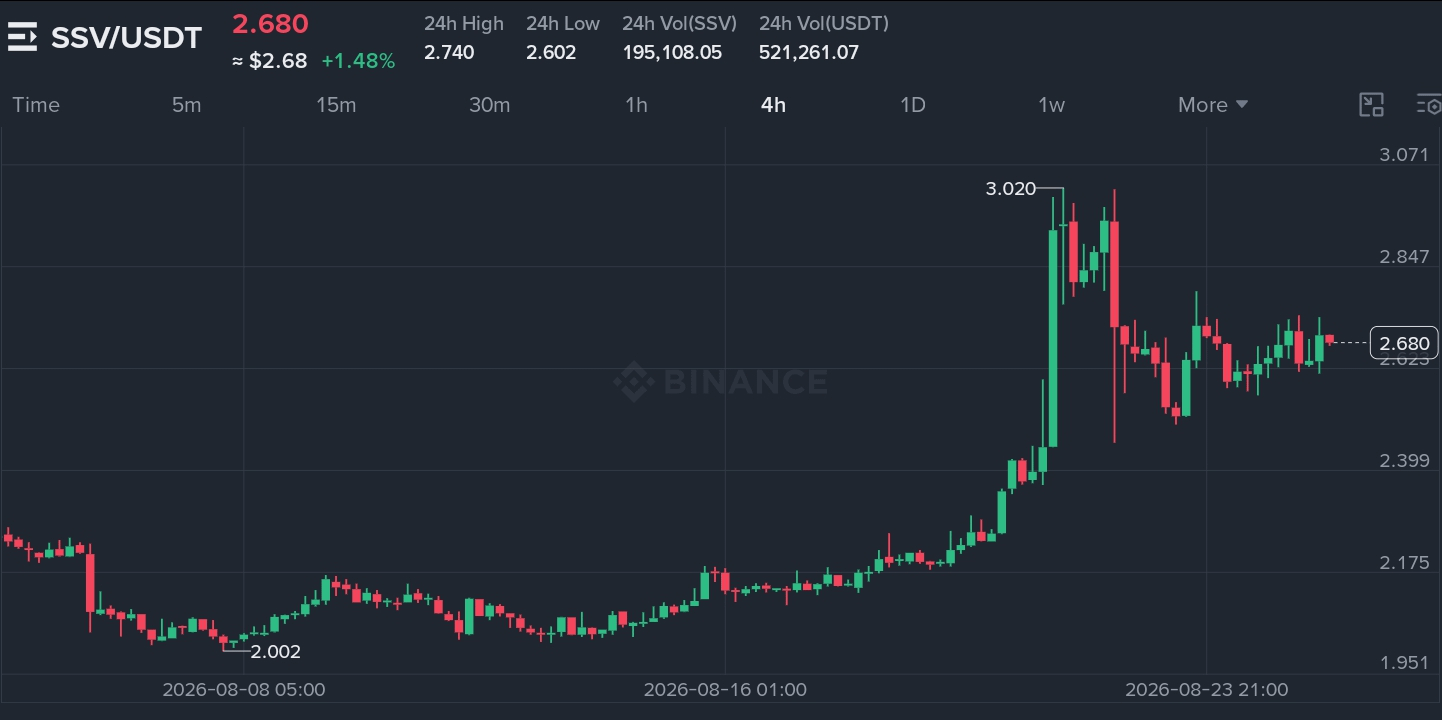
SSV consolida acima do piso recente
$SSV recuou da mínima de 1.951, subindo acima de 2.175 antes de atingir um pico perto de 3.071. O preço atual de 2.680 está abaixo do nível de 2.847, que tem atuado como resistência durante o recuo recente. A estrutura mostra o preço se mantendo acima de 2.602, um nível que tem fornecido suporte durante a fase atual de consolidação.
Essa zona entre 2.602 e 2.680 importa porque representa o ponto médio da faixa recente de negociação. Manter aqui pode abrir caminho para um movimento em direção a 2.847, enquanto uma quebra exporia a região de 2.175. A rejeição em 3.071 confirma a presença de oferta em níveis mais altos, tornando a confirmação de reconquista essencial para qualquer tentativa de recuperação.
Suporte: 2.602
Suporte principal: 2.175
Resistência: 2.847
Resistência principal: 3.071
Estrutura de Trading
Zona de Observação: A faixa de 2.602 a 2.680 pode agir como ponto de reação se os compradores defenderem o suporte. Um fechamento de 4 horas acima de 2.847 sinalizaria força.
Próximo Objetivo: Se o preço romper 2.847 e mantiver, a barreira de 3.071 se torna o próximo foco.
Invalidação: Um fechamento sustentado de 4 horas abaixo de 2.602 enfraqueceria a estrutura atual.
Negocie aqui 👇🏻

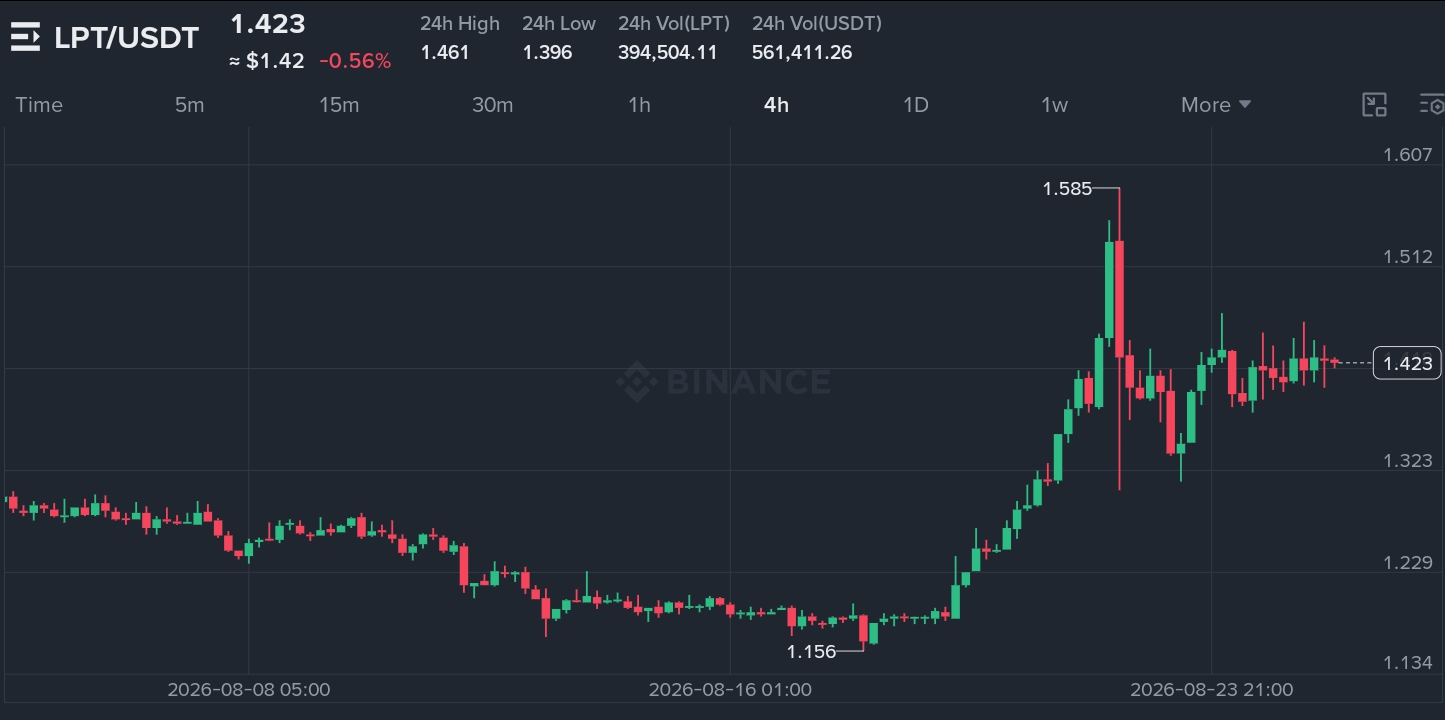
LPT Testa a Zona Crítica de Demanda
$LPT declinou a partir do pico de 1.607, rompendo 1.585 e 1.512 antes de se estabilizar perto de 1.423. O preço atual está testando o nível de suporte 1.396, que anteriormente atraiu compradores. A estrutura sugere que há vendedores perto de 1.512, tornando essa a resistência-chave a observar.
Essa área entre 1.396 e 1.423 representa a linha entre uma retração saudável e uma correção mais profunda. Manter aqui pode permitir uma recuperação em direção a 1.512, enquanto uma quebra exporia a região de 1.323. A rejeição em 1.607 confirma oferta perto desse nível, tornando a confirmação de reconquista essencial.
Suporte: 1.396
Suporte principal: 1.323
Resistência: 1.512
Resistência principal: 1.607
Estrutura de Trading
Zona de Observação: A faixa de 1.396 a 1.423 pode agir como ponto de reação se os compradores defenderem o suporte. Um fechamento de 4 horas acima de 1.512 sinalizaria força.
Próximo Objetivo: Se o preço romper 1.512 e mantiver, a barreira de 1.607 se torna o próximo foco.
Invalidação: Um fechamento sustentado de 4 horas abaixo de 1.396 enfraqueceria a estrutura atual.
Negocie aqui 👇🏻

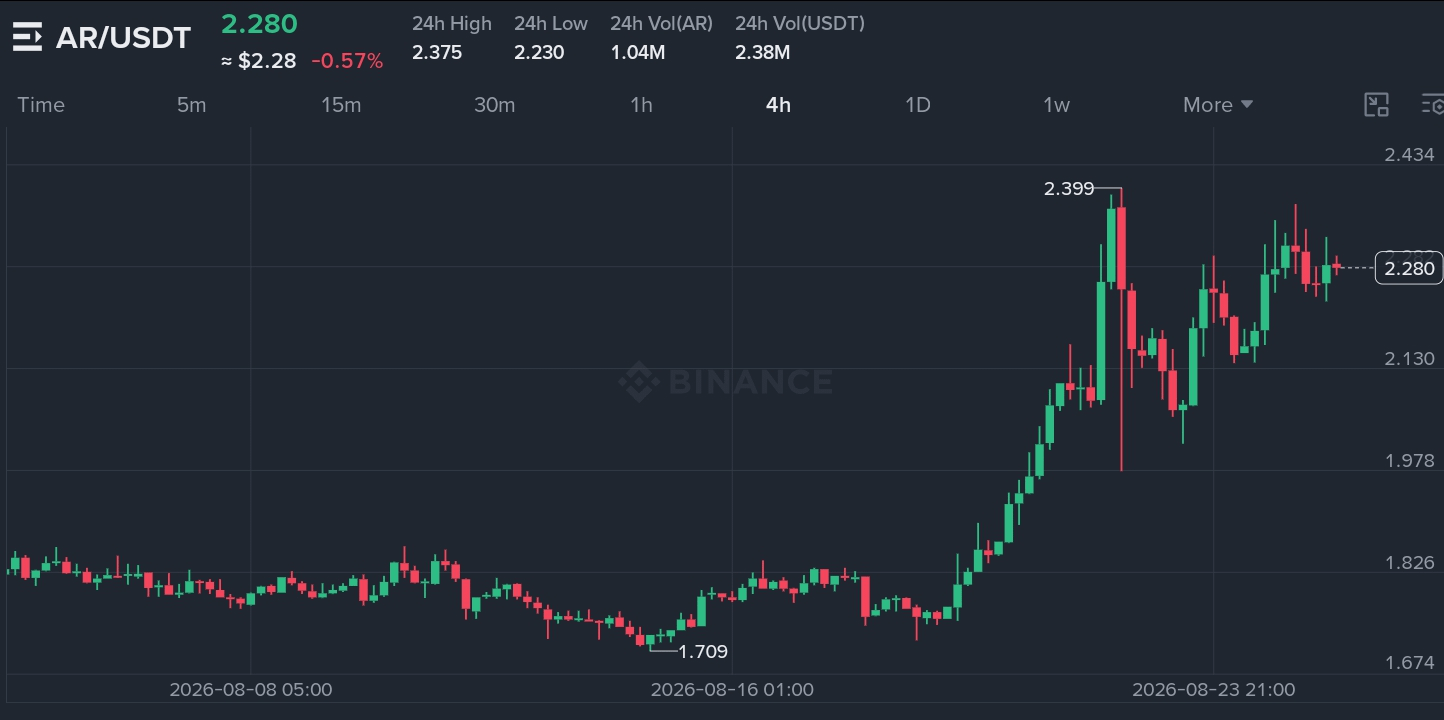
AR Acima da Zona-chave de Suporte
$AR se recuperou da mínima de 1.674, subindo por 1.826 e 1.978 antes de atingir um pico perto de 2.434. O preço atual de 2.280 está segurando acima do nível 2.130, que forneceu suporte durante a retração recente. A estrutura mostra preço consolidando entre 2.130 e 2.399, com o nível superior atuando como resistência.
Essa zona entre 2.130 e 2.280 importa porque representa o ponto médio da faixa recente de negociação. Manter aqui pode abrir caminho para um movimento em direção a 2.399, enquanto uma quebra exporia a região de 1.978. A rejeição em 2.434 confirma a presença de oferta em níveis mais altos.
Suporte: 2.130
Suporte principal: 1.978
Resistência: 2.399
Resistência principal: 2.434
Estrutura de Trading
Zona de Observação: A faixa de 2.130 a 2.280 pode agir como ponto de reação se os compradores defenderem o suporte. Um fechamento de 4 horas acima de 2.399 sinalizaria força.
Próximo Objetivo: Se o preço romper 2.399 e mantiver, a barreira de 2.434 se torna o próximo foco.
Invalidação: Um fechamento sustentado de 4 horas abaixo de 2.130 enfraqueceria a estrutura atual.
Negocie aqui 👇🏻

Resumo da Comparação
· SSV: Testando o suporte 2.602. Rejeição em 3.071. Viés: recuperação cautelosa.
· LPT: Testando o suporte 1.396. Rejeição em 1.607. Viés: recuperação fraca.
· AR: Testando o suporte 2.130. Rejeição em 2.434. Viés: recuperação moderada.
O que Isso Nos Diz:
Todos os três ativos estão tentando se recuperar das mínimas recentes, mas enfrentam resistência em níveis diferentes. SSV mostra a estrutura de recuperação mais forte, com a maior posição relativa. LPT está mostrando a recuperação mais fraca, negociando mais perto do seu suporte recente. AR está no meio, segurando acima do suporte, mas enfrentando resistência em 2.399.
A principal lição aqui é entender a força relativa dentro do mesmo ambiente de mercado. Quando vários ativos estão se recuperando de mínimas semelhantes, aquele que se mantém acima dos níveis mais altos de suporte frequentemente indica uma demanda subjacente mais forte. SSV está mostrando mais resiliência, enquanto LPT está exibindo a maior fraqueza.
Observe fechamentos limpos de 4 horas acima dos níveis de resistência para confirmar qualquer tentativa de recuperação em todos os três ativos. As zonas de suporte continuam sendo o principal campo de batalha para cada moeda.
Desses três cenários de recuperação, qual deles você acha mais convincente com base em sua estrutura atual?
Apenas educacional. Não é aconselhamento financeiro. Gerencie o risco.