
Perpetual | 15-Minute Chart | Binance
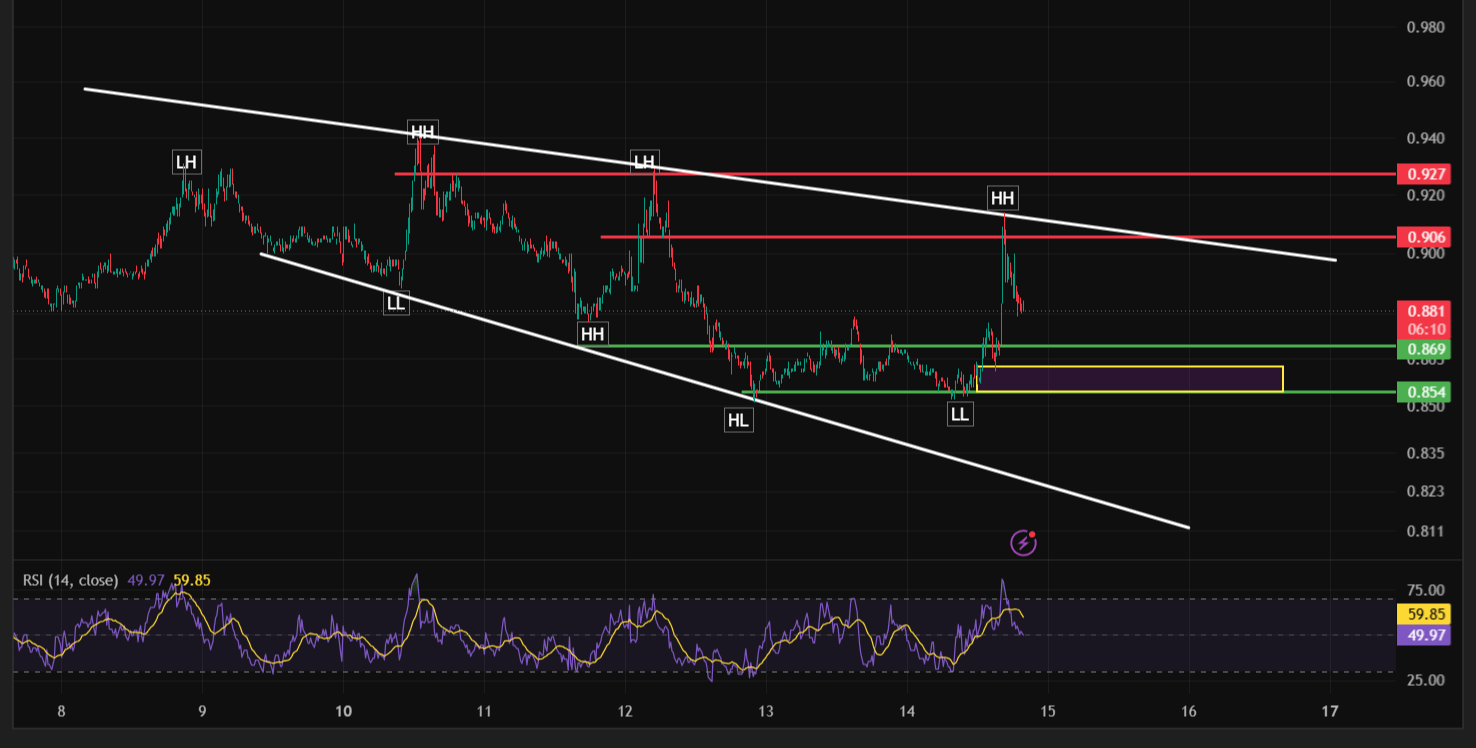
AXS/USDT has been locked in a persistent descending channel since its August 9 peak, with every rally capped by a falling trendline that has now guided price down from above $0.94 to the current $0.881. The good news for bulls: the last two swing lows have held above the prior Lower Low, and RSI is holding a healthier structure near 59.85, suggesting the sharp downside pressure seen earlier in the week may be easing even as the trendline itself remains unbroken.
Market Structure
Since the August 9 Lower High, AXS has traced a clean descending channel: Higher Highs at $0.927 and then a slightly lower $0.906 area, each rejected by the same falling trendline, while the lows stepped down from $0.869 (Higher Low) to $0.854 (Lower Low) before the most recent bounce. That bounce produced a sharp spike toward the trendline and $0.869 resistance before settling back to consolidate around $0.869–$0.881, right at the boundary of the highlighted supply zone on the chart.
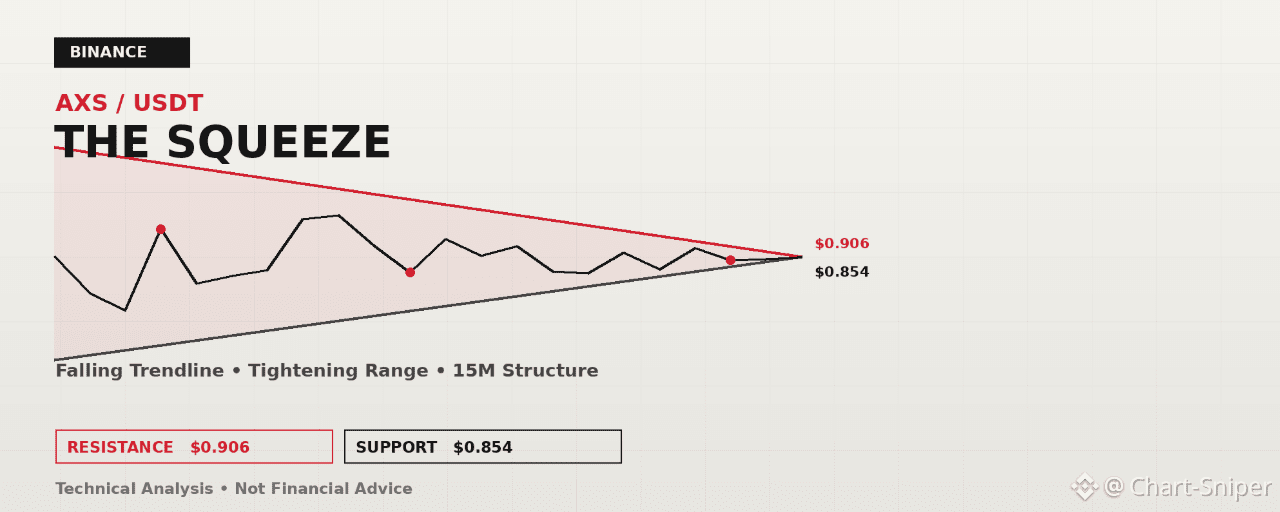
This is a market still technically in a downtrend — the descending trendline connecting the highs has not been broken — but the shrinking distance between swing highs and lows, combined with RSI holding above the 50 midline rather than collapsing toward oversold, points to a market that's compressing rather than accelerating lower. That compression typically resolves with either a trendline breakout or a fresh leg down through support.
Key Levels to Watch
Immediate resistance / trendline: $0.887–$0.906 — the descending trendline currently intersects this zone; a break and hold above it is the first sign of a structural shift.
Major resistance: $0.927 — the last significant Higher High and the level that would need to fall for a full trend reversal.
Immediate support: $0.869 — the recent reaction zone and first line of defense on a pullback.
Structural support: $0.854 — the most recent Lower Low; losing this would confirm the downtrend remains firmly in control.
Trade Setup Ideas
Range support long (tactical) A pullback into the $0.854–$0.865 zone that holds with a bullish reversal candle, especially with RSI staying above 45, offers a tactical long back toward $0.887–$0.906. A stop below $0.850 keeps risk defined against a breakdown through the recent low.
Trendline breakout long (trend-reversal play) A decisive 15-minute close above the descending trendline and the $0.906 level, ideally with RSI pushing above 65, would be the strongest signal that the downtrend structure has genuinely changed, opening room toward $0.927 and beyond. Waiting for a retest of the broken trendline as new support offers a lower-risk entry than chasing the initial breakout candle.
Invalidation / bearish scenario A clean break and close below $0.854 would confirm the descending channel remains intact and likely accelerate a move toward the next demand zone below $0.84. In that scenario, rallies back into the trendline are better treated as opportunities to reduce risk than as reversal signals.
The Bigger Picture
AXS/USDT remains technically bearish while trading beneath its descending trendline, but the pattern of higher, tighter lows and resilient RSI suggests selling pressure is easing. The $0.854 support and the $0.887–$0.906 trendline zone are the two levels that matter most from here — holding the former keeps the range-bound setup alive, while reclaiming the latter would be the first real evidence this downtrend is ending.
Disclaimer: This article is for educational and informational purposes only and does not constitute financial advice. Cryptocurrency markets are highly volatile, and perpetual futures trading carries a substantial risk of loss. Always conduct your own research, manage your risk carefully, and consult a licensed financial advisor before making any trading decisions.
@Binance Square Official #OilEdgesHigher #AnthropicIPOMeetingsSkipFinancialsValuation #KalshiOrderedToSuspendWashingtonOperations #Binance #ChartSniper