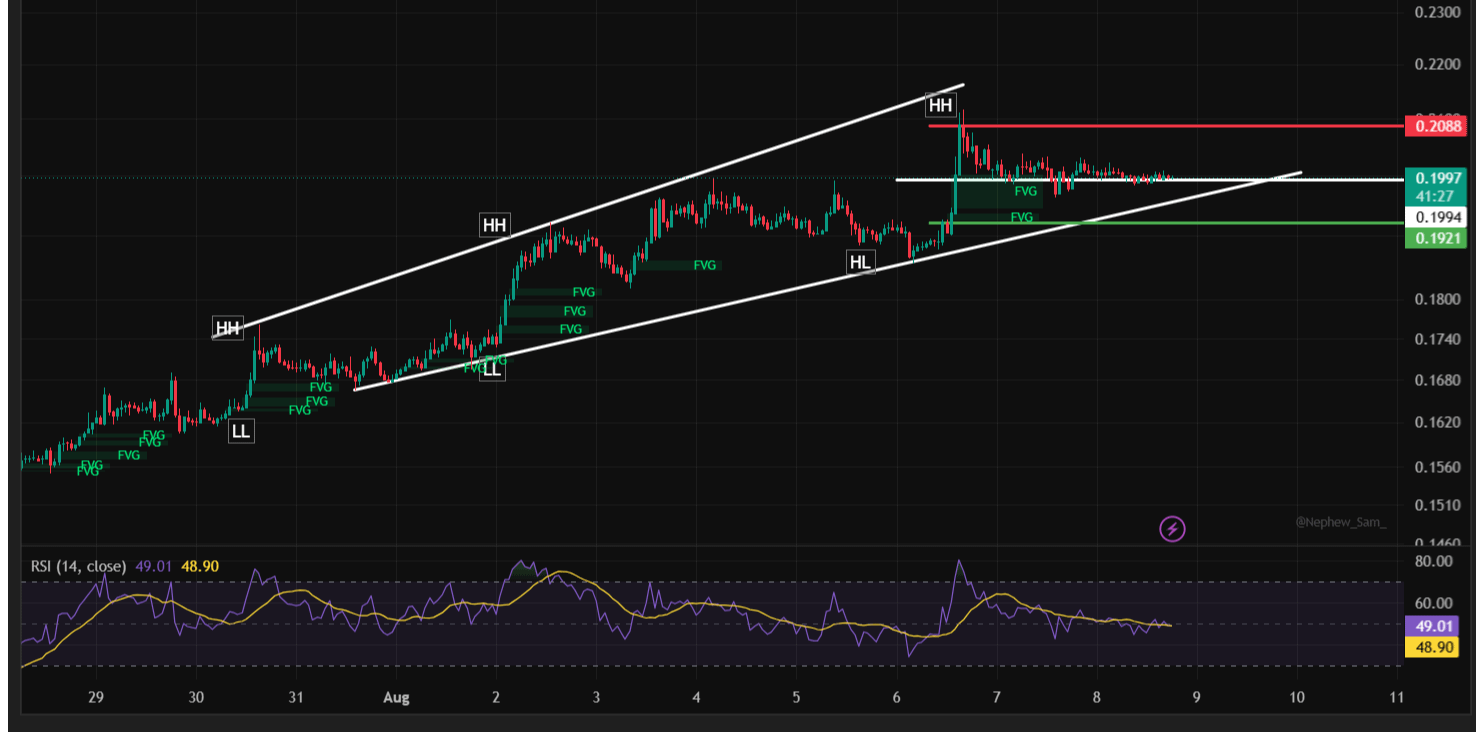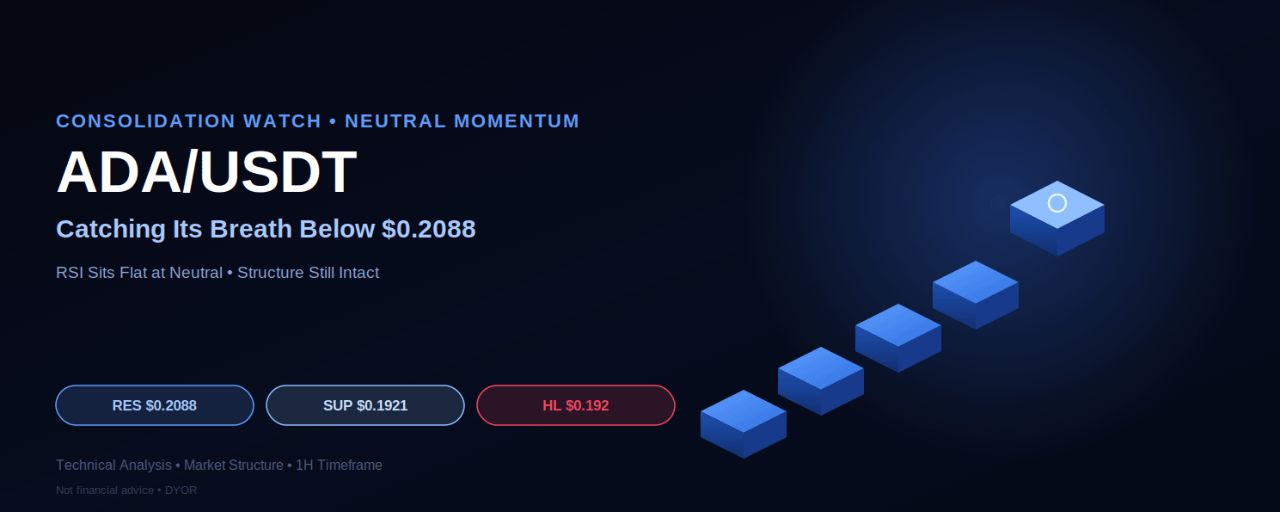

ADA/USDT Perpetual · 1H Chart with RSI · Ascending Structure & Fair Value Gap Analysis
Cardano has put together one of the more consistent uptrends on the board over the past week and a half, climbing from around $0.155 to a spike high of $0.2088 in a well-defined ascending structure. Since that spike, price has pulled back and is now consolidating tightly around $0.1996, and the momentum picture has cooled off right along with it — RSI is sitting almost exactly at neutral, a sign this is more of a pause than a clear directional signal in either direction.
Reading the Structure
The trend has been a steady staircase of Higher Highs, interrupted only by shallow pullbacks:
An HH near $0.166 (Jul 29) followed by a Lower Low near $0.163, the last real weakness on the chart.
A strong push into an HH near $0.183 (Aug 2), followed by a shallow retracement.
Continued climbing along the rising channel into a Higher Low near $0.192 (Aug 6).
A sharp spike through that structure into the HH at $0.2088 (Aug 6–7) — the high of the entire move and the sharpest single leg on the chart.
Since that spike, ADA has settled into a tight consolidation range around $0.1994–0.1996, right along the channel's structure. This is where the RSI reading matters: at 48.49–48.87, it's neither overbought nor oversold — it's simply flat, reflecting the kind of sideways digestion that often follows a fast, sharp move rather than confirming a fresh breakout is imminent.
Key Levels to Watch
Resistance:
$0.2088 — the major resistance and the spike high; this is the level that needs to break, ideally alongside RSI pushing back above 55–60, to confirm the uptrend is resuming with real momentum.
Support:
$0.1921 — first support, aligned with a recent unfilled FVG and the current consolidation's lower edge.
$0.192 — the Higher Low that preceded the spike; a hold here keeps the broader ascending structure intact.
$0.183 — deeper support, the prior HH turned potential support if the consolidation breaks down further.
Trade Scenarios
Scenario A — Consolidation breakout (aligned with the trend):
Entry: On a confirmed break and close above $0.2088, ideally with RSI moving back above 55
Stop-loss: Below $0.1996
Target: New highs beyond $0.2088, trailed as price discovers
Scenario B — Range trade within consolidation:
Entry: On a hold/bounce in the $0.1921–0.1994 zone
Stop-loss: Below $0.192
Target 1: $0.1996
Target 2: $0.2088
Scenario C — Deeper retracement entry (conservative):
Entry: On a reaction/hold at $0.192, or as deep as $0.183 for full trendline confirmation
Stop-loss: Below $0.183
Target 1: $0.1921
Target 2: $0.1996
What Would Change This Outlook
The flat RSI reading is the key nuance here — it means the current consolidation could resolve in either direction with roughly equal probability until it actually breaks. A move above $0.2088 with RSI confirming (pushing back above 55–60) would favor trend continuation. A break below $0.1921 and then $0.192, especially if RSI drops below 40, would suggest the pullback is turning into something deeper rather than just a pause.
Bottom Line
ADA remains in a technically healthy uptrend, but the current consolidation around $0.1994–0.1996 with a neutral RSI reading means momentum has genuinely cooled, not just paused for show. A hold above $0.1921–0.192 keeps the broader structure intact, but the real signal for continuation is a confirmed break above $0.2088 — not just a bounce within the current range.
This article is for informational and educational purposes only and does not constitute financial advice. Cryptocurrency trading, and perpetual futures contracts in particular, involve substantial risk of loss. Always do your own research and manage risk according to your own financial situation before making any trading decisions.
@Binance Square Official #BIP110ForkSignalingExpectedThisWeekend #VIXFallsToJanuaryLow #IraqOilExportsFall75% #Binance #ChartSniper