

Nvidia stock holds a structurally bullish daily posture heading into late July. At $206.84, NVDA closed above all three major daily EMAs. Yet intraday signals have softened, creating tension between the daily trend and hourly reality that warrants close attention.
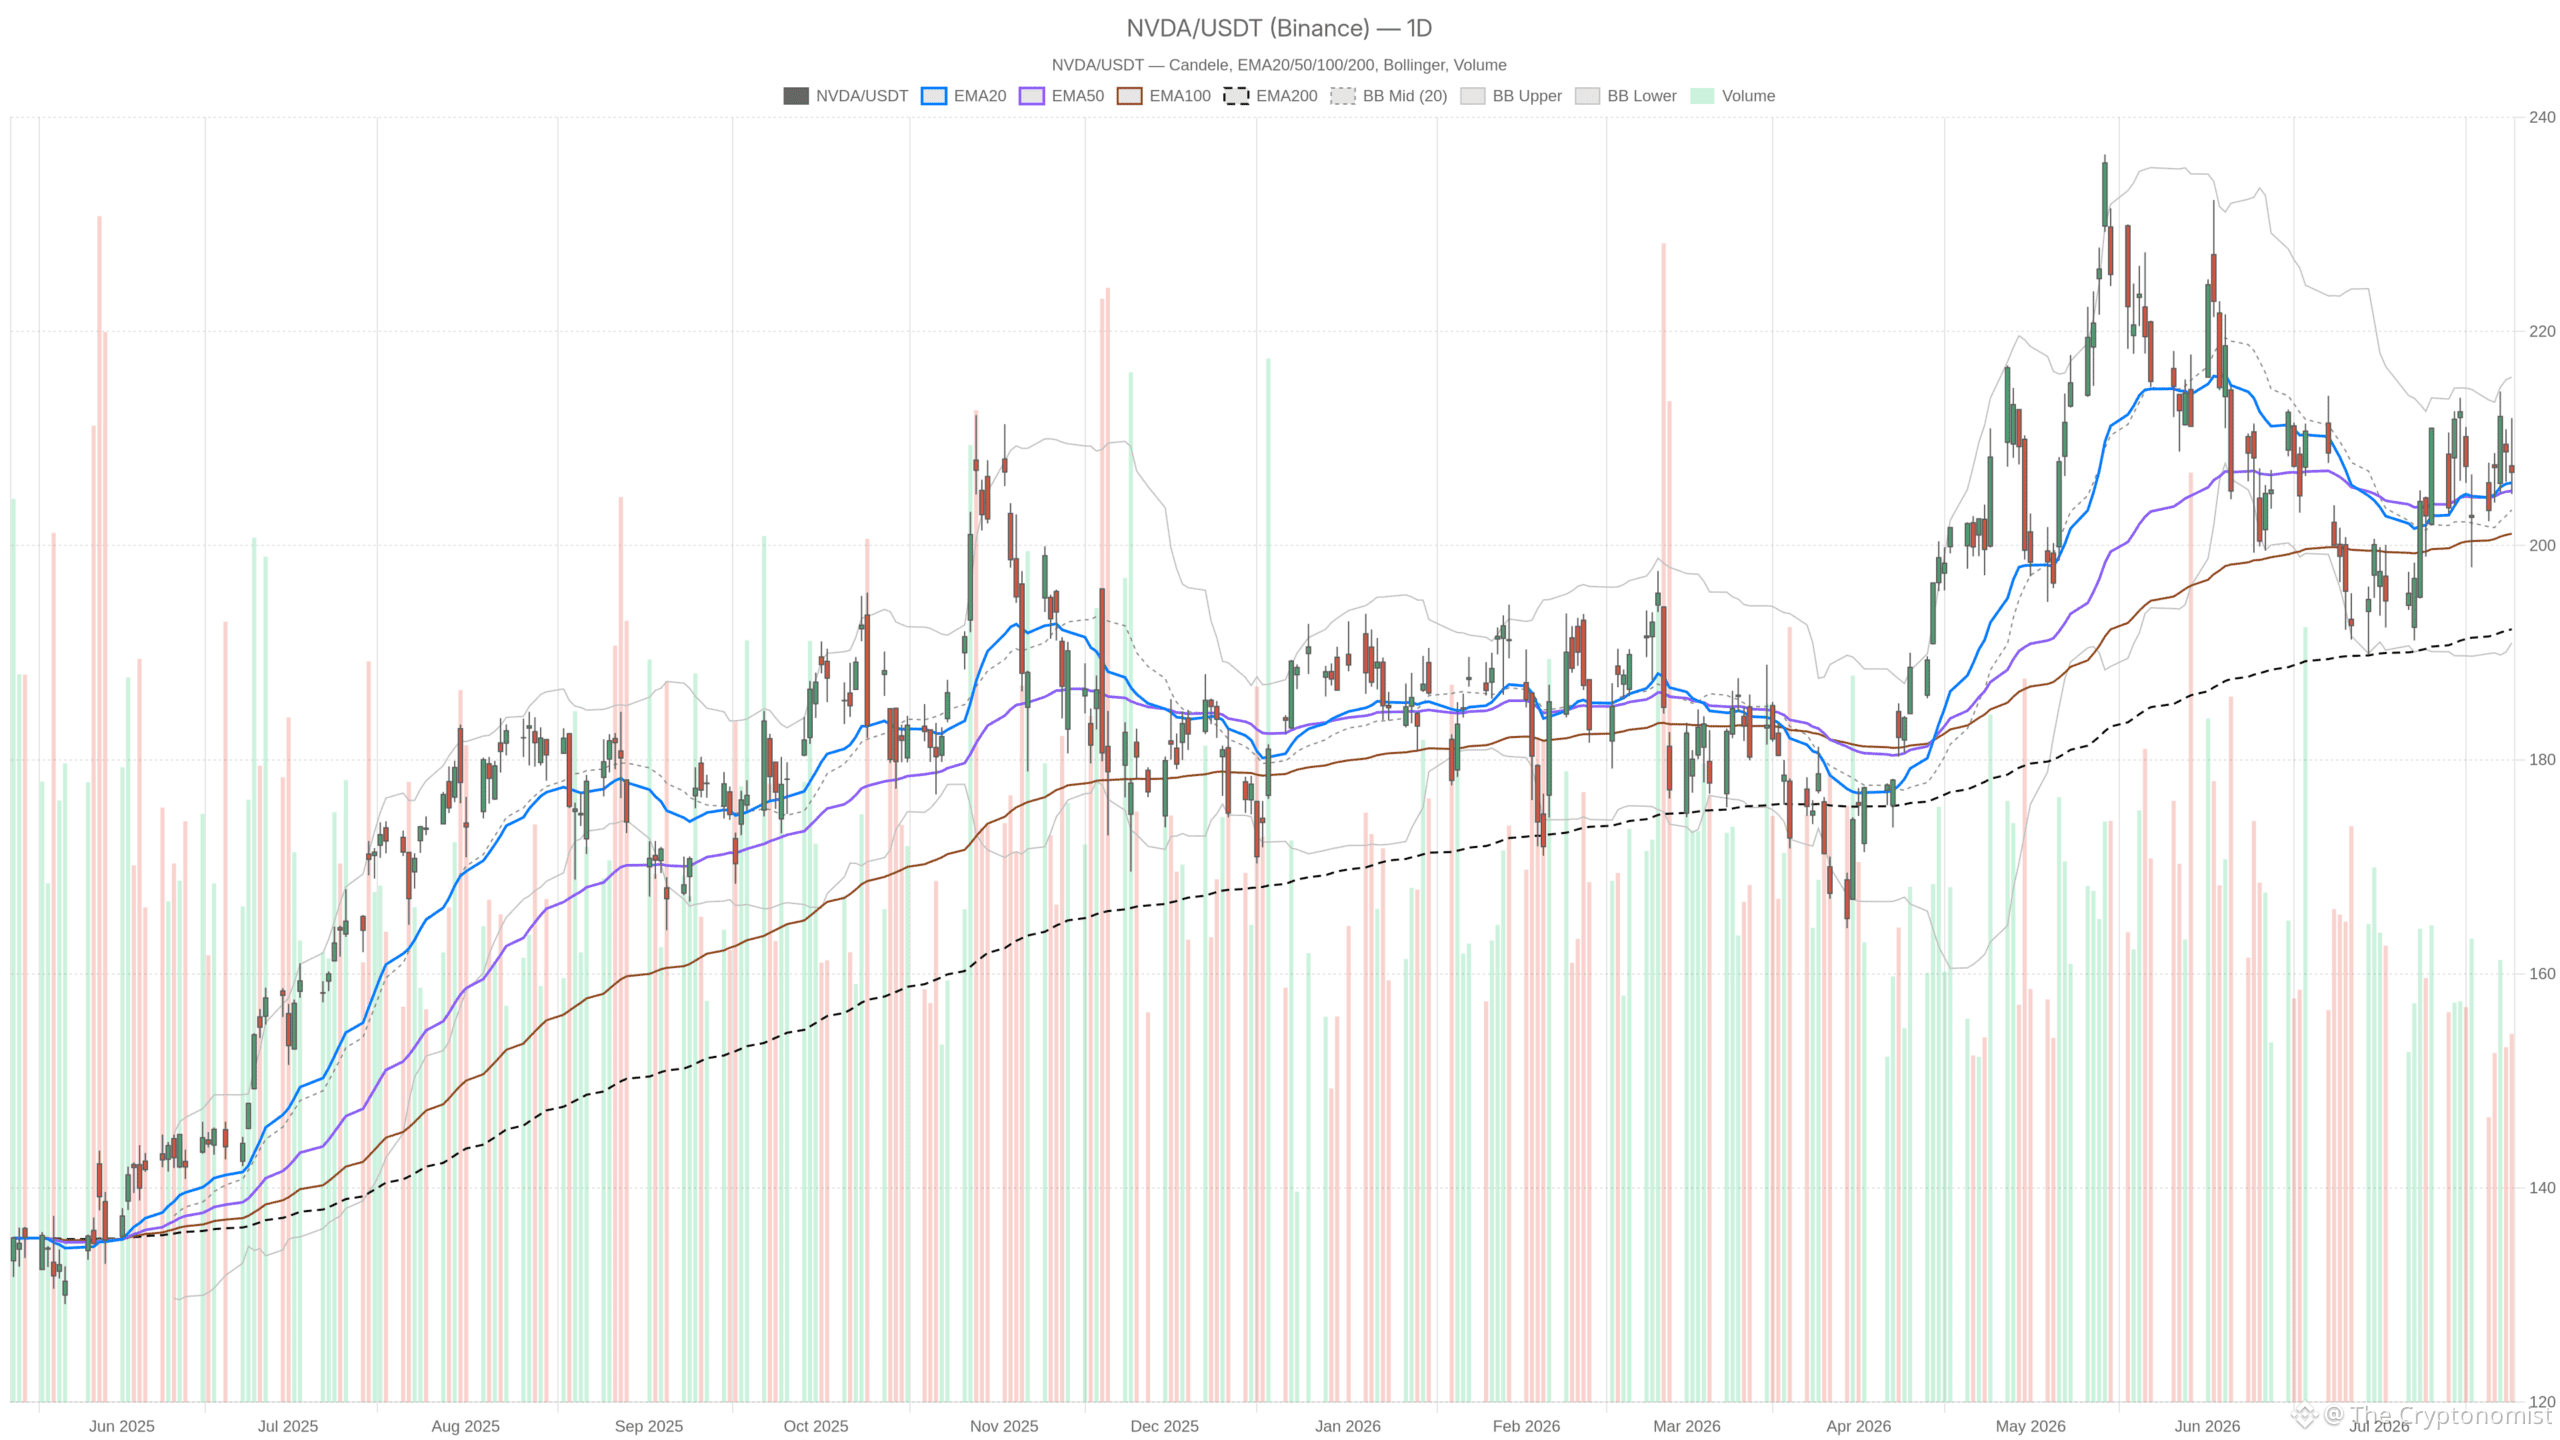 NVDA — daily chart with candlesticks, EMA20/EMA50 and volume.
Key takeaways
NVDA closed at $206.84 on July 24, holding above all three major daily exponential moving averages.
The daily MACD reads at 0.84 with a histogram of 0.77, confirming positive but not accelerating momentum.
Hourly signals show a neutral regime, with price slipping below the H1 EMA20 at $208.51 and EMA50 at $207.72.
Nvidia announced a roughly $1 billion investment in NAVER for AI datacenter infrastructure in South Korea.
The pivotal level is $207.85 — a sustained close above reaffirms bullish control; failure opens a test of S1 at $203.80.
Daily Structure: Nvidia Stock Holds a Bullish Regime
Nvidia stock is in a confirmed bullish regime on the daily timeframe. The EMA stack, MACD, and price structure all point to sustained buyer control heading into the final week of July.
The EMA20 sits at $205.87, the EMA50 at $205.11, and the EMA200 at $192.19. All three are in ascending order beneath the current price. This alignment reflects a trend that has built steadily. Price closing at $206.84 above both the EMA20 and EMA50 confirms short- and medium-term momentum remains with buyers.
The daily MACD adds weight to the bullish view. The line reads at 0.84, well above the signal at 0.08, producing a histogram of 0.77. That is not explosive, but it is firmly positive. Meanwhile, the RSI14 at 51.07 sits in neutral-to-slightly-bullish territory. This leaves room for further upside without the overhead risk of an extended reading.
Volatility Context and Pivot Levels
Bollinger Bands show a midline at $203.33, with the upper band at $215.74 and the lower at $190.93. Price above the midline is consistent with a trend-following setup. The upper band provides a natural ceiling. ATR14 at 7.6 reflects meaningful daily volatility — moves of this magnitude are normal for NVDA.
Meanwhile, the daily pivot structure places the pivot at $207.85, with R1 at $210.90 and S1 at $203.80. The July 24 close at $206.84 sits just below the pivot. A sustained move above $207.85 would reaffirm bullish control. A slide toward $203.80 would signal short-term sellers regaining the upper hand.
Intraday Conflict: Hourly Signals Introduce Caution
The hourly chart paints a more cautious picture for Nvidia stock. Short-term momentum has turned neutral, with price slipping below key moving averages and the H1 MACD diverging negatively.
Notably, price at $206.96 now trades below the H1 EMA20 at $208.51 and the EMA50 at $207.72. That inverted positioning is a meaningful short-term warning. It does not invalidate the daily trend, but it complicates immediate upside. The hourly MACD reinforces the caution: the line is at -0.03 versus a signal of 0.43, producing a histogram of -0.46.
15-Minute Frame Adds Execution Context
The 15-minute timeframe offers additional precision. Here, the regime is also neutral. Price sits below the 15m EMA20 at $207.83, the EMA50 at $208.51, and the EMA200 at $207.70. This creates a full bearish EMA stack on the shortest timeframe. The 15m MACD shows a line at -0.80 with a histogram of -0.37. Meanwhile, RSI at 43.31 trends toward oversold territory.
For traders timing entries, this suggests patience. Short-term momentum has not yet turned supportive. Any bullish play based on the daily trend requires confirmation from the intraday frames first.
Macro Catalysts: Capital Deployment at Scale
Two major capital deployment initiatives are shaping Nvidia stock’s fundamental backdrop. The company is committing billions to AI infrastructure through strategic partnerships that extend well beyond its core chip business.
Over the weekend, Nvidia announced plans to invest approximately $1 billion in NAVER as part of an AI datacenter expansion in South Korea. The announcement coincided with South Korean President Lee Jae Myung’s visit to the AI Summit in San Francisco. At the same time, a Wall Street Journal report indicated Nvidia is in talks to provide roughly $250 billion as a backstop for OpenAI’s data-center financing push — a deal that would also benefit Oracle.
These commitments reflect Nvidia’s deepening role in the global AI infrastructure buildout. However, the OpenAI financing news drew scrutiny. Michael Burry, the investor known from ‘The Big Short,’ posted ‘Around and Around We Go’ in response — a pointedly skeptical signal. Tech commentator Ed Zitron also voiced concerns. The debate around this deal’s implications will likely intensify ahead of any formal confirmation.
Bullish and Bearish Scenarios
Nvidia stock’s next move hinges on whether the daily trend can overpower intraday softness. Two distinct scenarios frame the outlook for the sessions ahead.
Bullish Scenario: Reclaiming the Pivot
The bullish case rests on the daily trend holding. If NVDA reclaims the $207.85 pivot on a closing basis, the path toward daily R1 at $210.90 becomes realistic. The H1 EMA stack must also resolve back to a bullish alignment for confirmation. Above R1, the Bollinger upper band at $215.74 represents the next structural target. The macro catalysts carry the potential to act as sentiment accelerators if confirmed positively.
Bearish Scenario: Intraday Pressure Extends
In contrast, the bearish scenario unfolds if intraday pressure deepens. A break below H1 S1 support at $205.77 with follow-through would open a test of daily S1 near $203.80. Below that, the daily Bollinger midline at $203.33 and the EMA20 at $205.87 form a support cluster. Losing that zone would signal a more meaningful pullback. The OpenAI financing concerns, if they gain traction, could inject headline-driven selling pressure. At that point, the daily bullish regime would face its first credible test.
Positioning and Volatility Outlook
Overall, Nvidia stock presents a classic multi-timeframe tension heading into the final week of July. The daily trend remains structurally bullish, but the intraday setup has softened. Re-engagement requires confirmation before it makes technical sense.
The ATR14 on the daily at 7.6 means intraday swings of this magnitude are expected, not exceptional. With major macro catalysts still unresolved, volatility around NVDA is likely to remain elevated. Two factors will determine the next leg: a technical reclaim of the $207.85 pivot, and how markets digest Nvidia’s capital commitments at scale.
FAQ
Is Nvidia stock in a bullish or bearish trend on the daily chart?
Nvidia stock is in a confirmed bullish regime on the daily timeframe. The EMA20, EMA50, and EMA200 are all in ascending order beneath the current price of $206.84. The daily MACD is positive at 0.84 and RSI14 sits at 51.07 in neutral-to-bullish territory.
What are the key support and resistance levels for NVDA?
The daily pivot sits at $207.85, with R1 at $210.90 and S1 at $203.80. The Bollinger upper band at $215.74 provides a structural ceiling, while the midline at $203.33 and the EMA20 at $205.87 form a support cluster. On the hourly chart, S1 support is at $205.77.
What fundamental catalysts are affecting Nvidia stock right now?
Two major developments are in focus: Nvidia’s roughly $1 billion investment in NAVER for AI datacenter expansion in South Korea, and reports that the company is in talks to backstop OpenAI’s data-center financing with approximately $250 billion. Both highlight Nvidia’s expanding role beyond chip supply into strategic capital deployment.
Why are intraday signals diverging from the daily trend?
The hourly chart shows price below both the H1 EMA20 and EMA50, with the MACD turning negative at -0.03 and RSI dipping below 50 to 46.02. This neutral-to-soft intraday posture reflects short-term sellers taking control, though it does not yet invalidate the structurally bullish daily trend.
Disclaimer: This article is for informational purposes only and does not constitute financial advice, an investment recommendation, or a solicitation to buy or sell any financial instrument or cryptocurrency. The analysis provided is not indicative of future results. Investing in crypto assets and financial markets carries a high risk of capital loss. Always do your own research (DYOR) and consult a qualified financial advisor before making any decision.
Article produced with the assistance of artificial intelligence and reviewed by the editorial team.