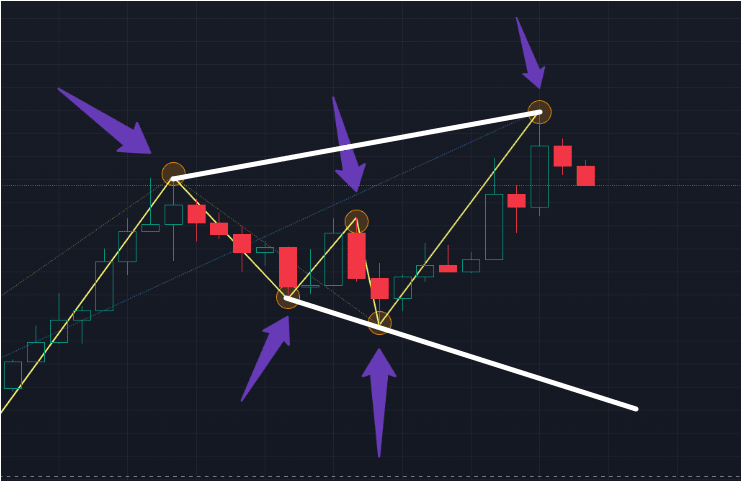
Chart patterns are very popular among technical traders, and they are key based on technical market analysis.
Why are the support and resistance trend lines drawn by everyone different for the same graphic, and it seems that everyone feels they have mastered the trading bible, like a vendor boasting about their own melons? Little do they know, danger hides in the shadows—the risk of overfitting intensifies our biases instead of objectively constructing patterns.
Overfitting refers to traders drawing patterns arbitrarily without any objective rules, hoping to support biases or conclusions formed in other ways.
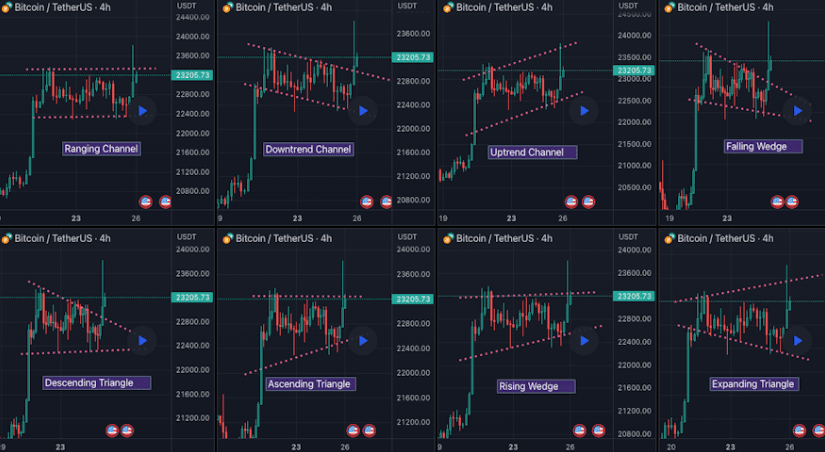
As shown, the same image trend can draw 8 or even more trend lines, some of the patterns here are considered bullish, while others are considered bearish. If you further convert the chart scale from linear to logarithmic, you will see a different set of patterns or more patterns compared to those shown at the same price.
Traders cannot distinguish between correct and incorrect patterns. When we talk about correct and incorrect patterns, they are unrelated to trading outcomes. Even trades based on correct patterns can fail. Here we only discuss patterns that are essentially objective and do not rely on the subjective biases of the analyst.
True failure patterns are inconsistently and unstably drawn patterns over a period of time, leading to inconsistent analysis. Traders cannot formulate reliable strategies based on this, as they do not know if trades fail due to incorrect pattern drawing.
OK, the previous part was nonsense, this is the main text 😂
The only way to overcome the risk of bias-based drawing is to define clear and objective rules. Typically, zigzag indicators are used to algorithmically identify patterns on charts. Below is a description of a set of such rules.
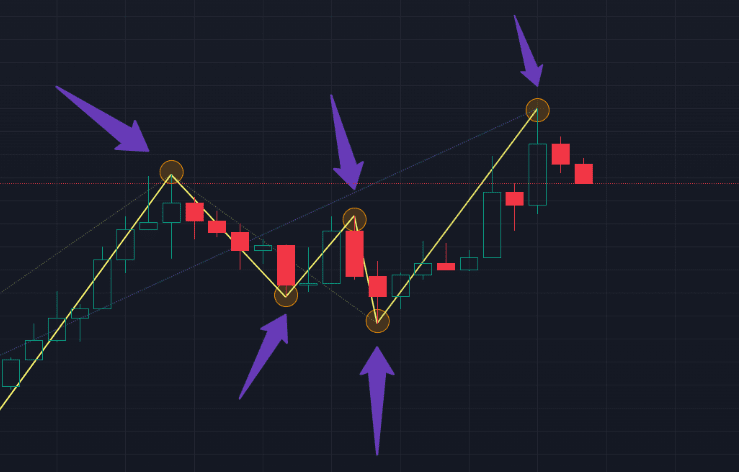
Draw a zigzag on the chart.
Find and draw a trend line connecting 2 or more pivot lows, where the price has not yet broken through the downward trend line.
Find and draw a trend line connecting 2 or more pivot highs, where the price has not yet broken through the upward trend line.
When drawing trend lines, the trend line can touch the pivot candles at any point. However, the candles should not be located outside the trend line.
Consider false moves to make adjustments.
At least one of the above trend lines should connect 3 or more pivot points. The other can have only two pivot points.
After following these steps, did you see a clear pattern? If so, then you have found your own pattern and mastered the skill of defining them objectively and without bias.