


The net active buying volume of Bitcoin in 24 hours has shifted to an increase after weeks of being dominated by sellers.
Despite short-term optimism, the long-term buyer flow remains negative, necessitating caution for investors regarding a complete trend reversal.
Bitcoin [BTC] appears to be regaining strength as selling pressure from active buyers decreases. With no major macroeconomic obstacles, BTC may trend toward moderate growth this week.
Is this recovery sustainable?
The 24-hour net buying volume shows a positive shift
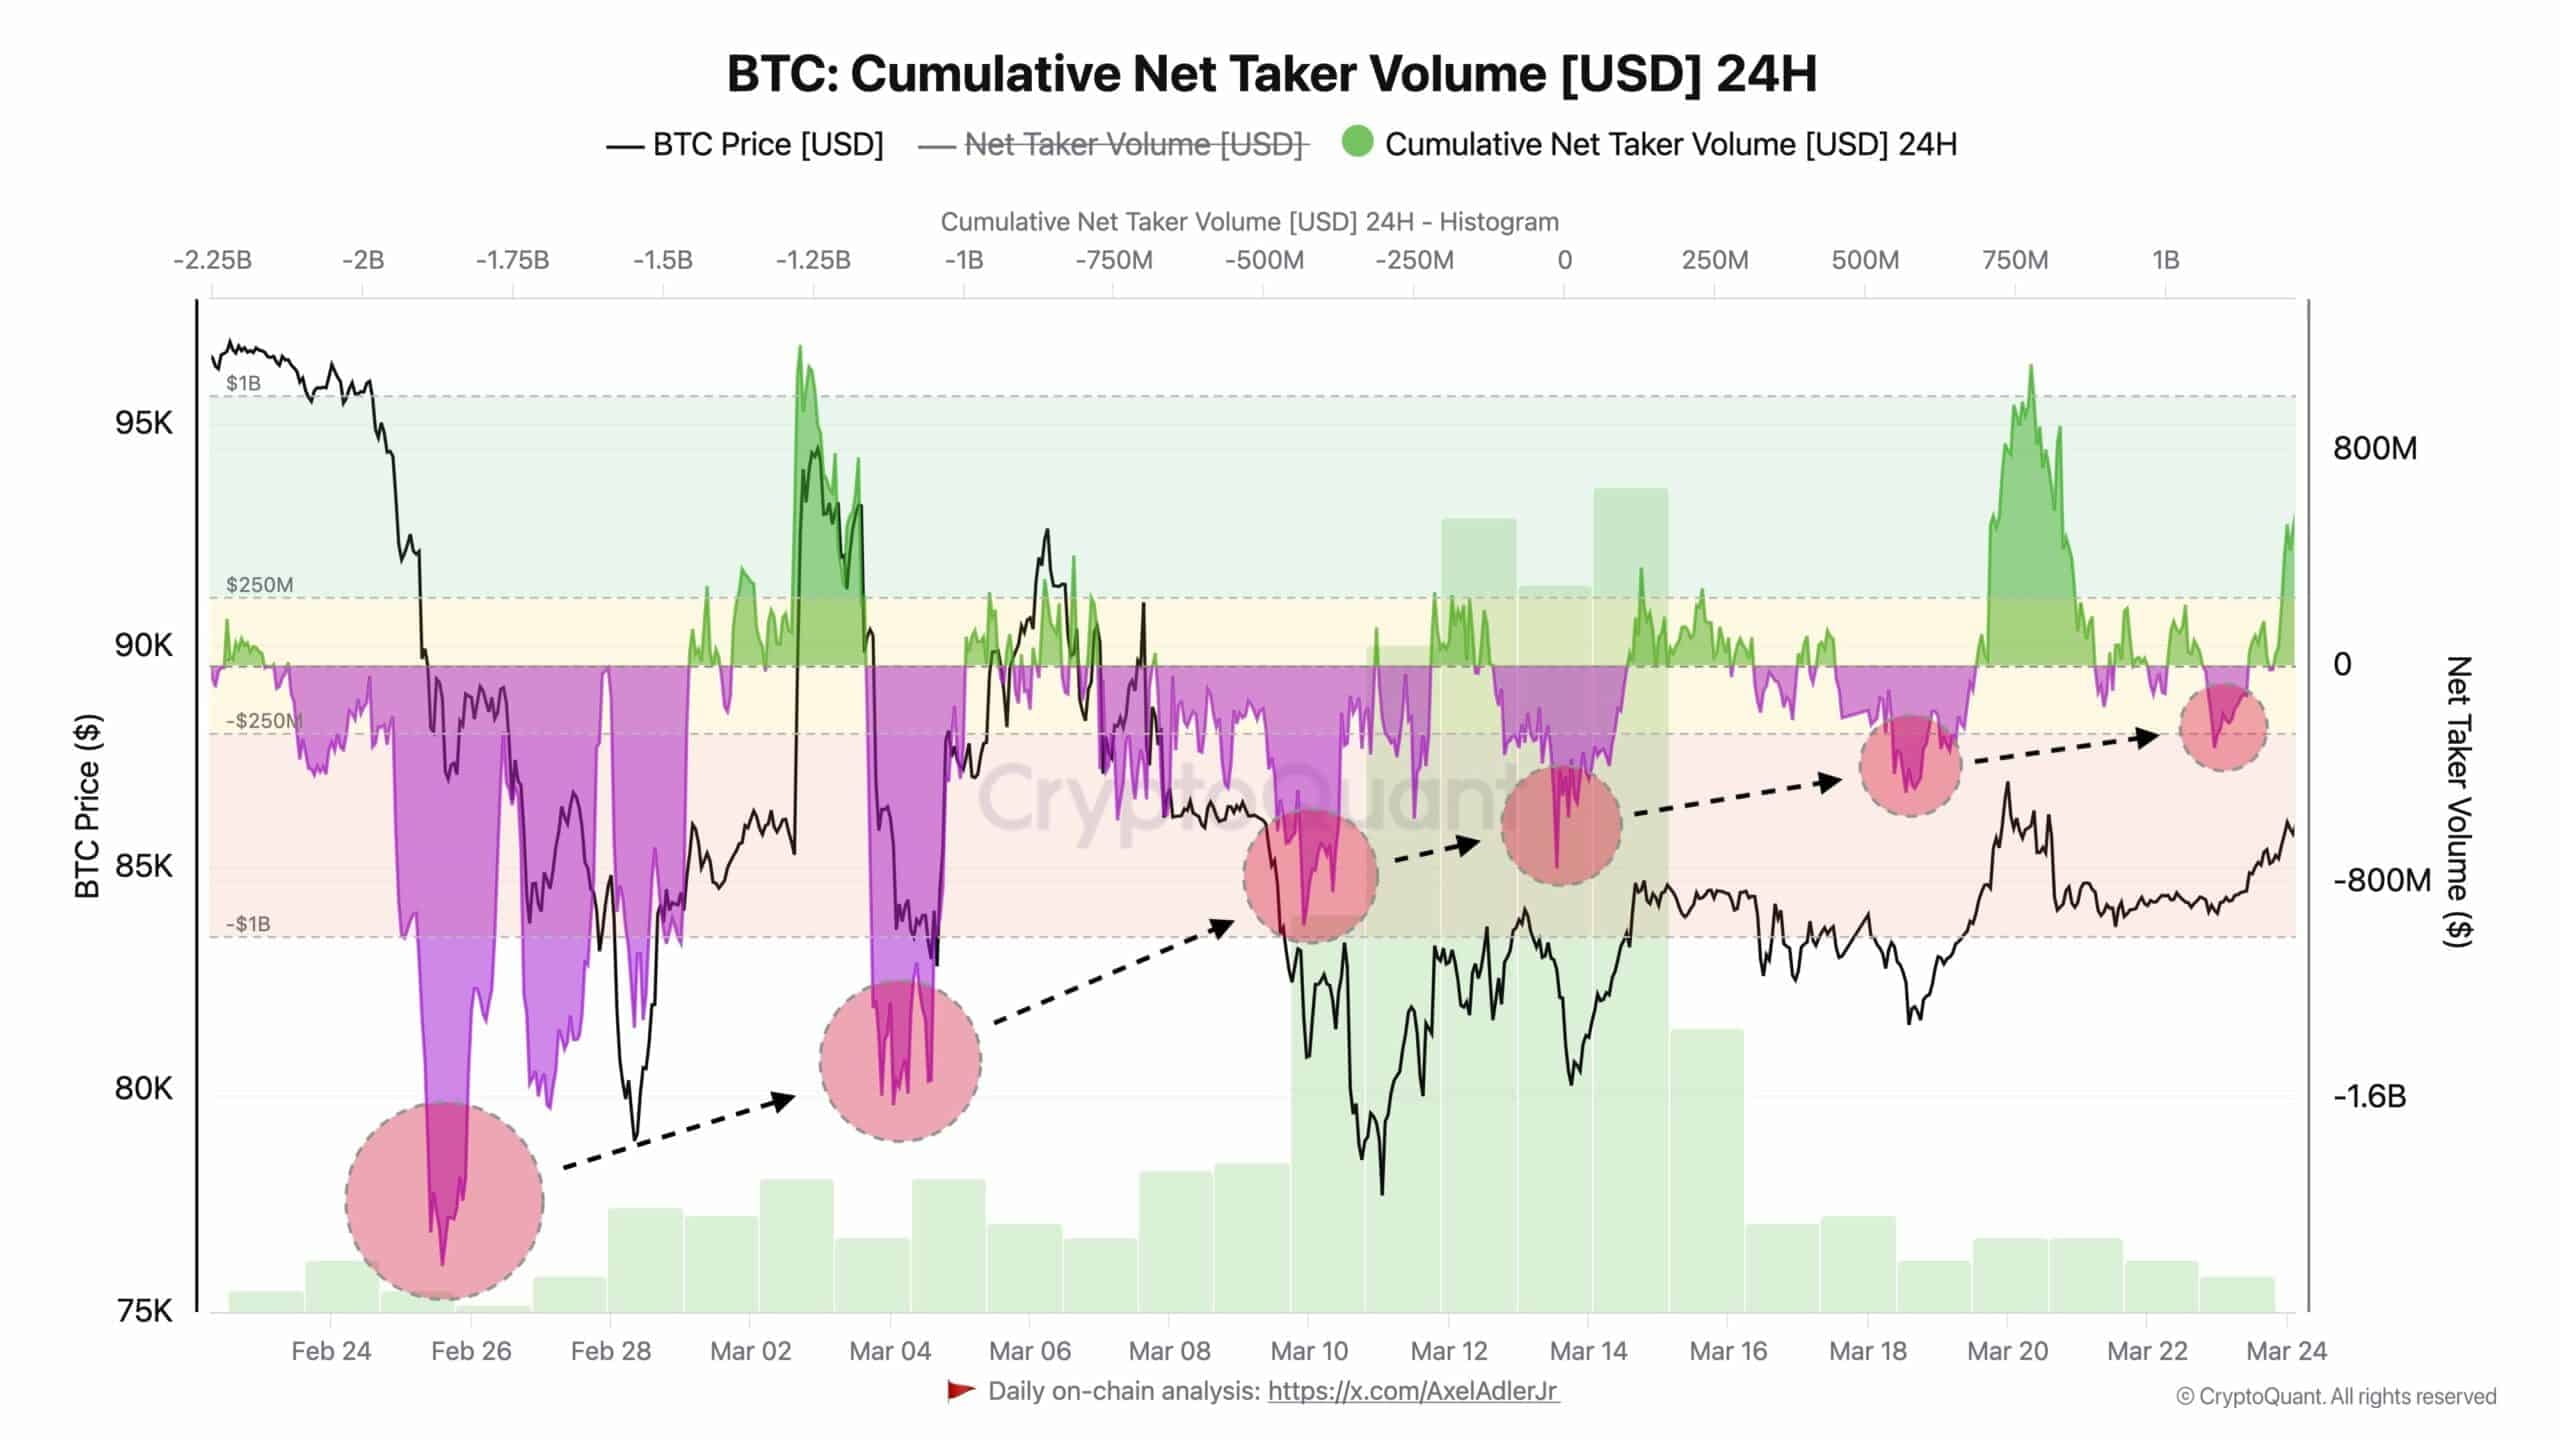
The net accumulation volume of active buyers of Bitcoin over the past 24 hours has shown a remarkable shift in the past month.
This index, measuring the decisiveness of market participants, has been deep in the negative zone throughout February — with net volume dropping to as low as -1 billion USD.
However, in recent days, the cumulative figure has returned to the positive zone. This shift indicates that active buyers have begun to dominate the market after weeks of strong control by sellers.
Source: X
Historical patterns indicate that whenever this index shifts from negative to positive, BTC prices tend to rise gradually.
The most recent increase coincides with BTC's recovery from below 80K USD to above 87K USD.
The long-term net buying volume of Bitcoin is still influenced by selling pressure
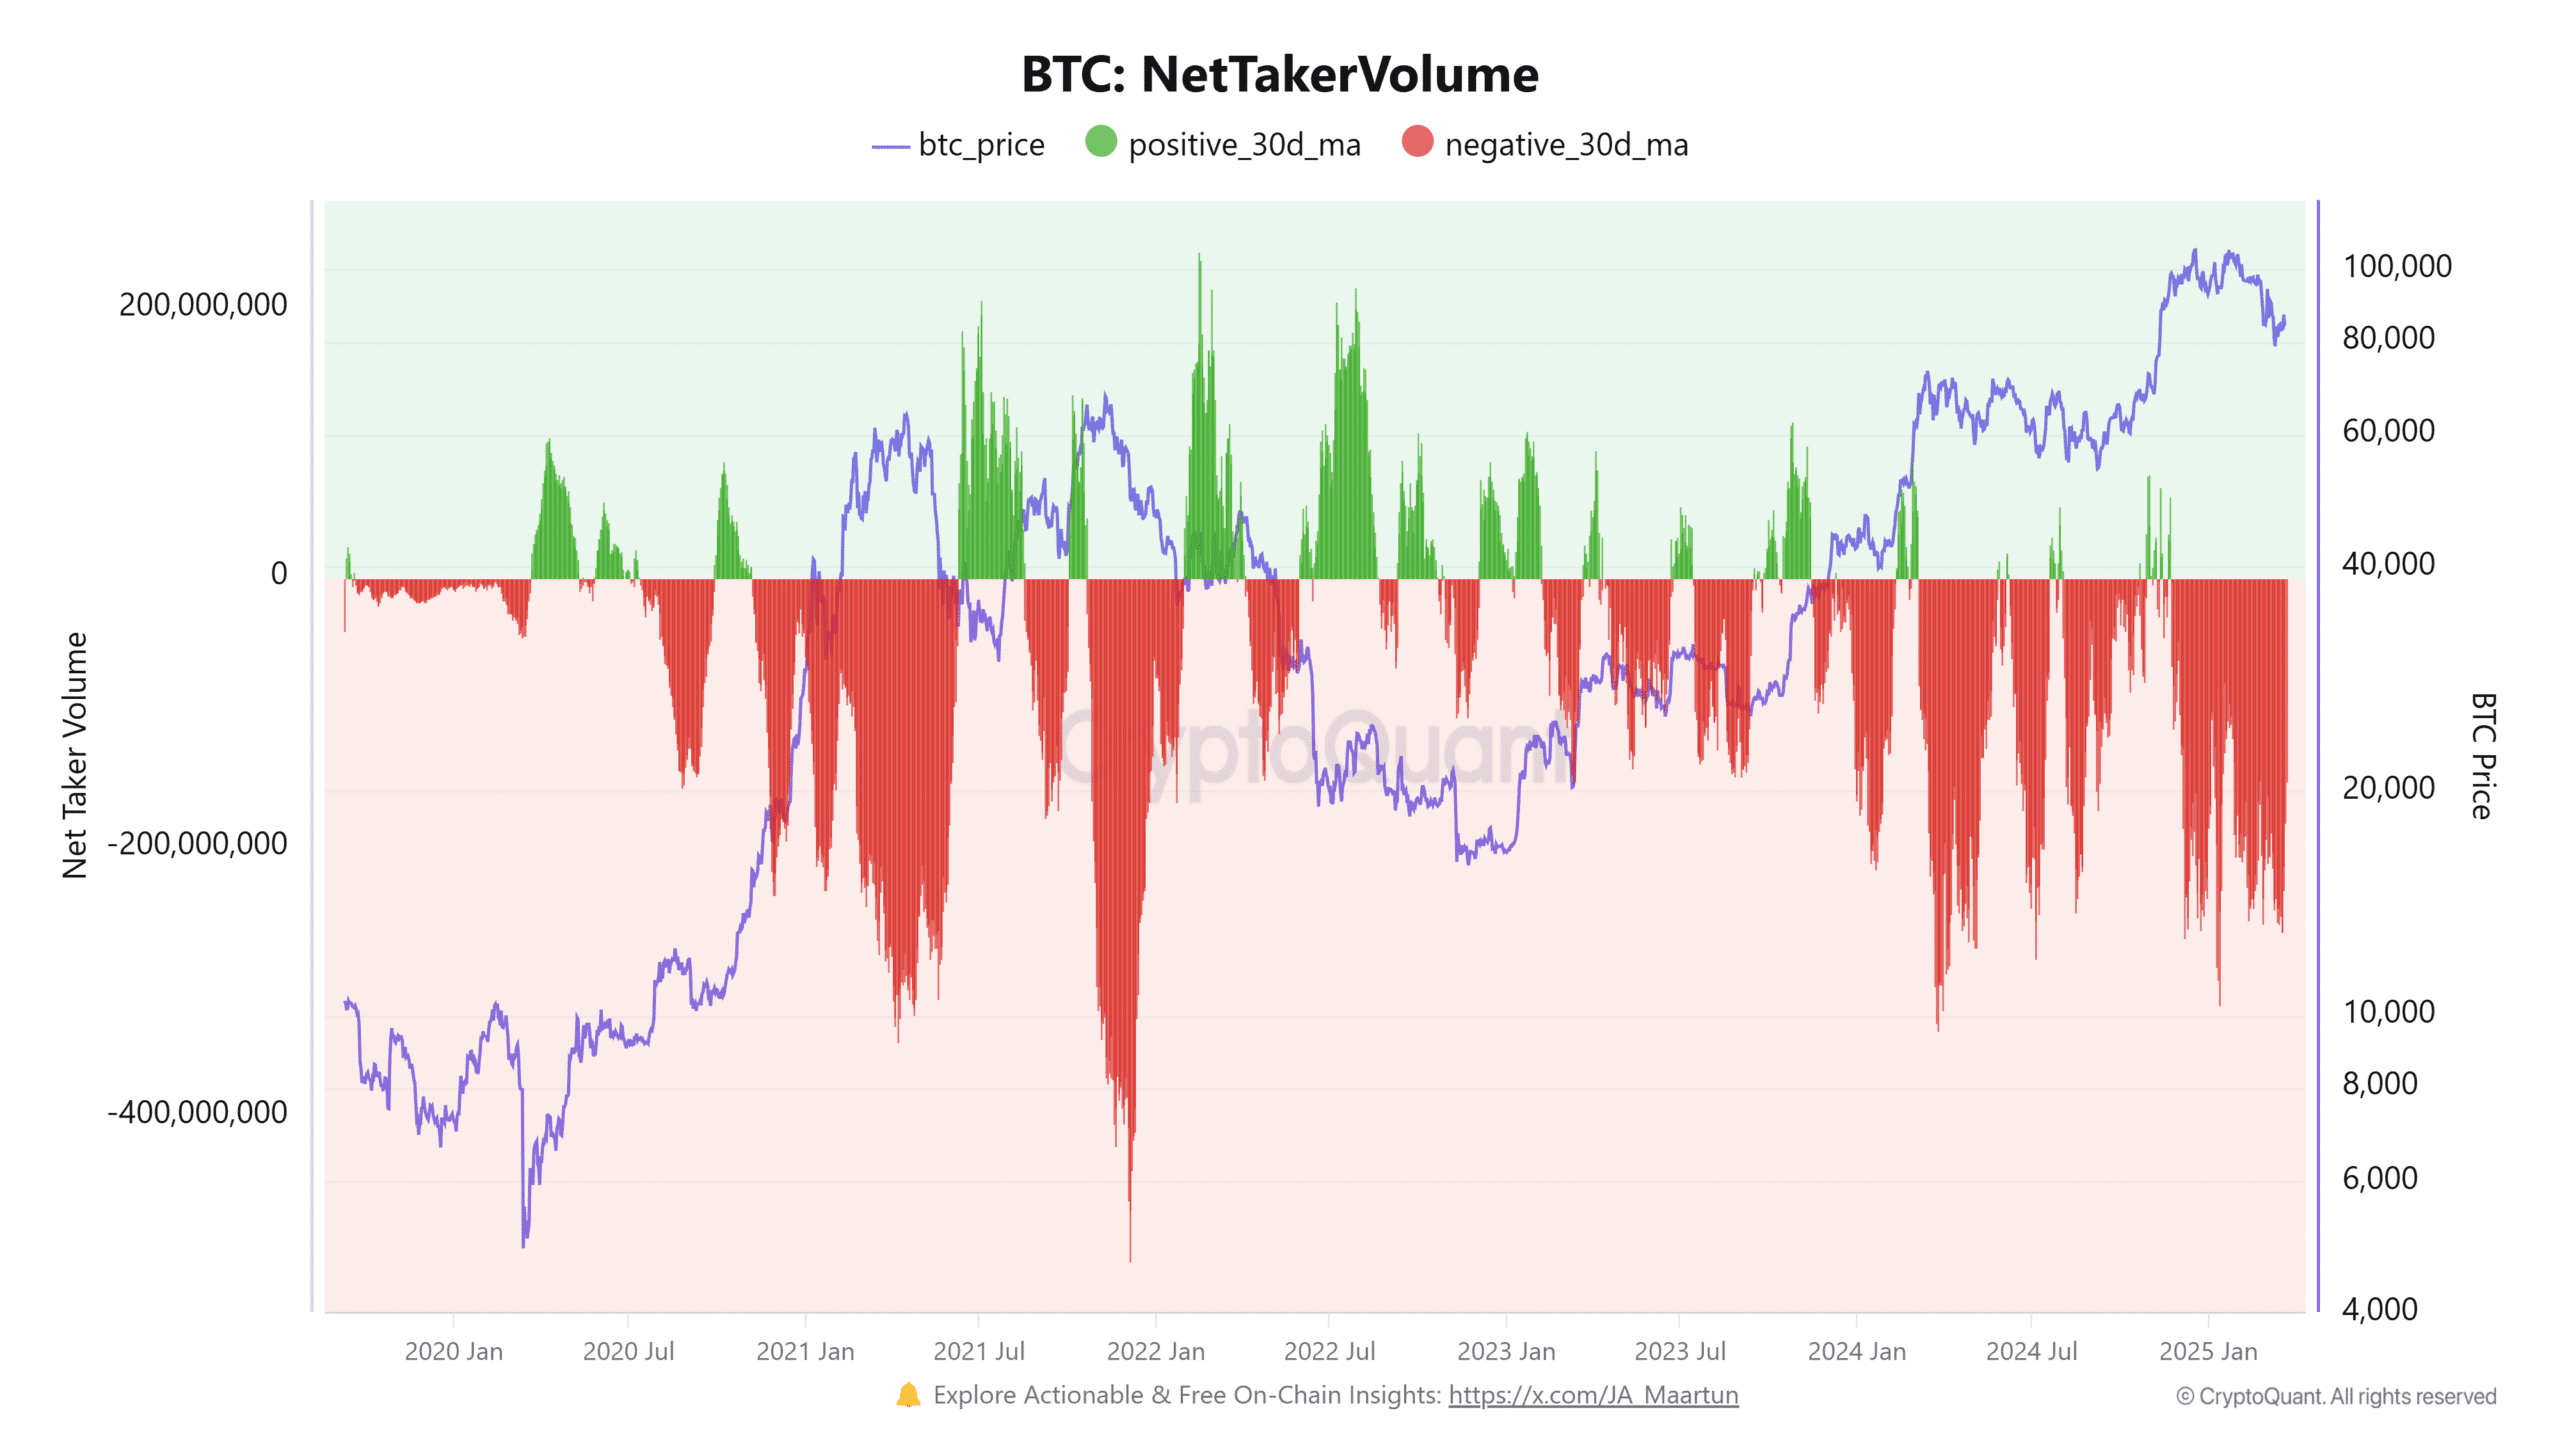
Although the 24-hour index shows bullish signals, the long-term net buying volume index — the 30-day moving average — provides a broader overview.
This chart shows that negative net flow still dominates, with continuous red bars indicating accumulation pressure from sellers.
Source: CryptoQuant
Although there have been a few short periods of positive net volume in recent months, a continuous green chain has not been established.
This suggests that although sellers may pause in the short term, the market still bears the weight of previous strong selling phases.
A complete transition to a sustainable green phase on this chart would significantly bolster the bullish scenario.
BTC closed above the important support level
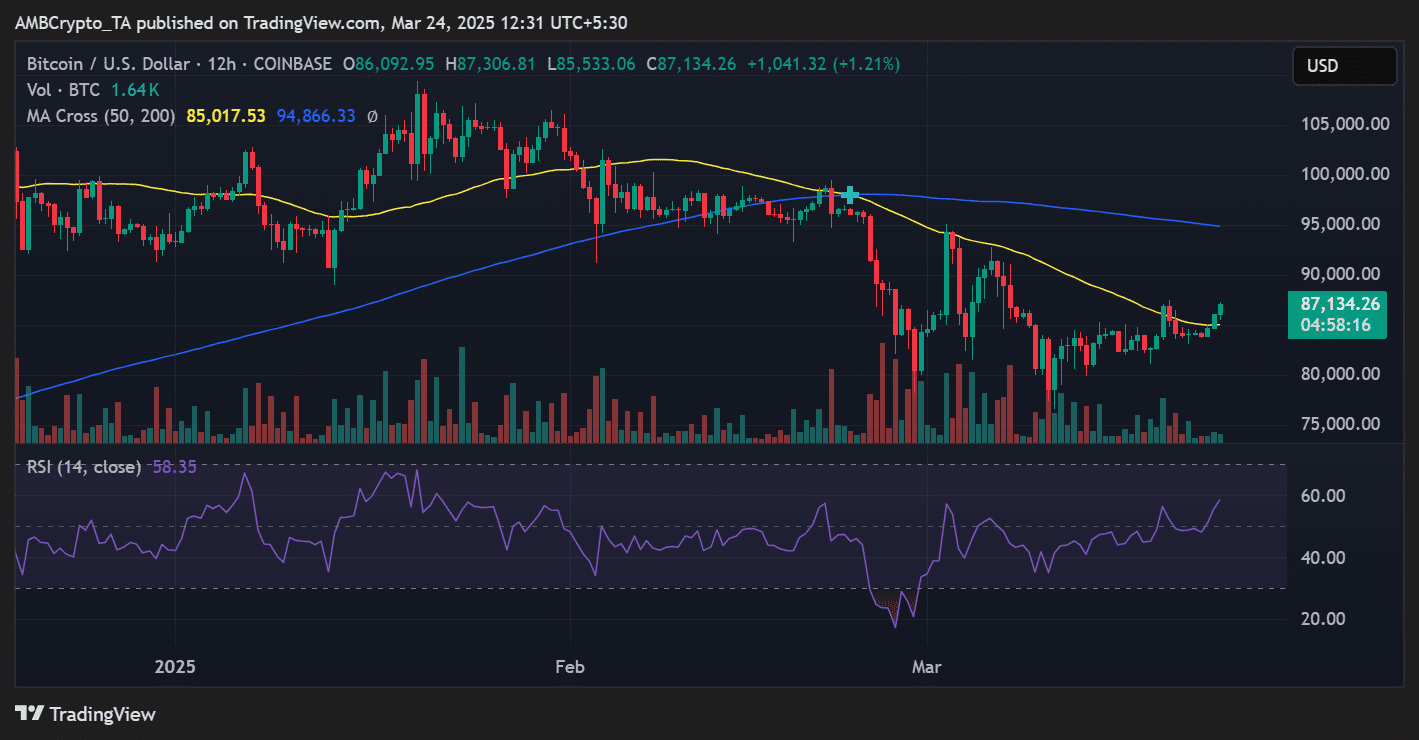
In terms of price, Bitcoin has surpassed the 50-day moving average at 85,017 USD and is trading at 87,134 USD.
The 12-hour chart also shows that momentum is improving, with the Relative Strength Index [RSI] rising to 58.35 — near bullish territory but not yet overbought.
Source: TradingView
Trading volume remains relatively stable, but if BTC surpasses the resistance of the 200-day MA at 94,866 USD, it could pave the way to retest the 95K–100K price range. However, a rejection near this range will lead to sideways action.
Predictions for this week?
The key factor is whether demand from buyers can maintain momentum without external catalysts. So far, data suggests a fairly good risk-reward setup for continued recovery.
However, caution is still necessary, especially as BTC approaches the important psychological resistance zone.
Buyers may push towards higher targets if the net active buying volume stays above zero and BTC maintains above the 50-day MA.
Conversely, if it drops below 85K USD, it will signal weakness and may reintroduce short-term selling pressure.
Source: https://tintucbitcoin.com/ap-luc-mua-bitcoin-tang-tai-87k-usd-btc-huong-den-95k-usd/
Thank you for reading this article!
Please Like, Comment, and Follow TinTucBitcoin to stay updated with the latest cryptocurrency market news and not miss any important information!